7th Grade Inequalities Worksheets
All worksheets are created by the team of experienced teachers at Cazoom Math.
What are inequalities and why do 7th graders learn them?
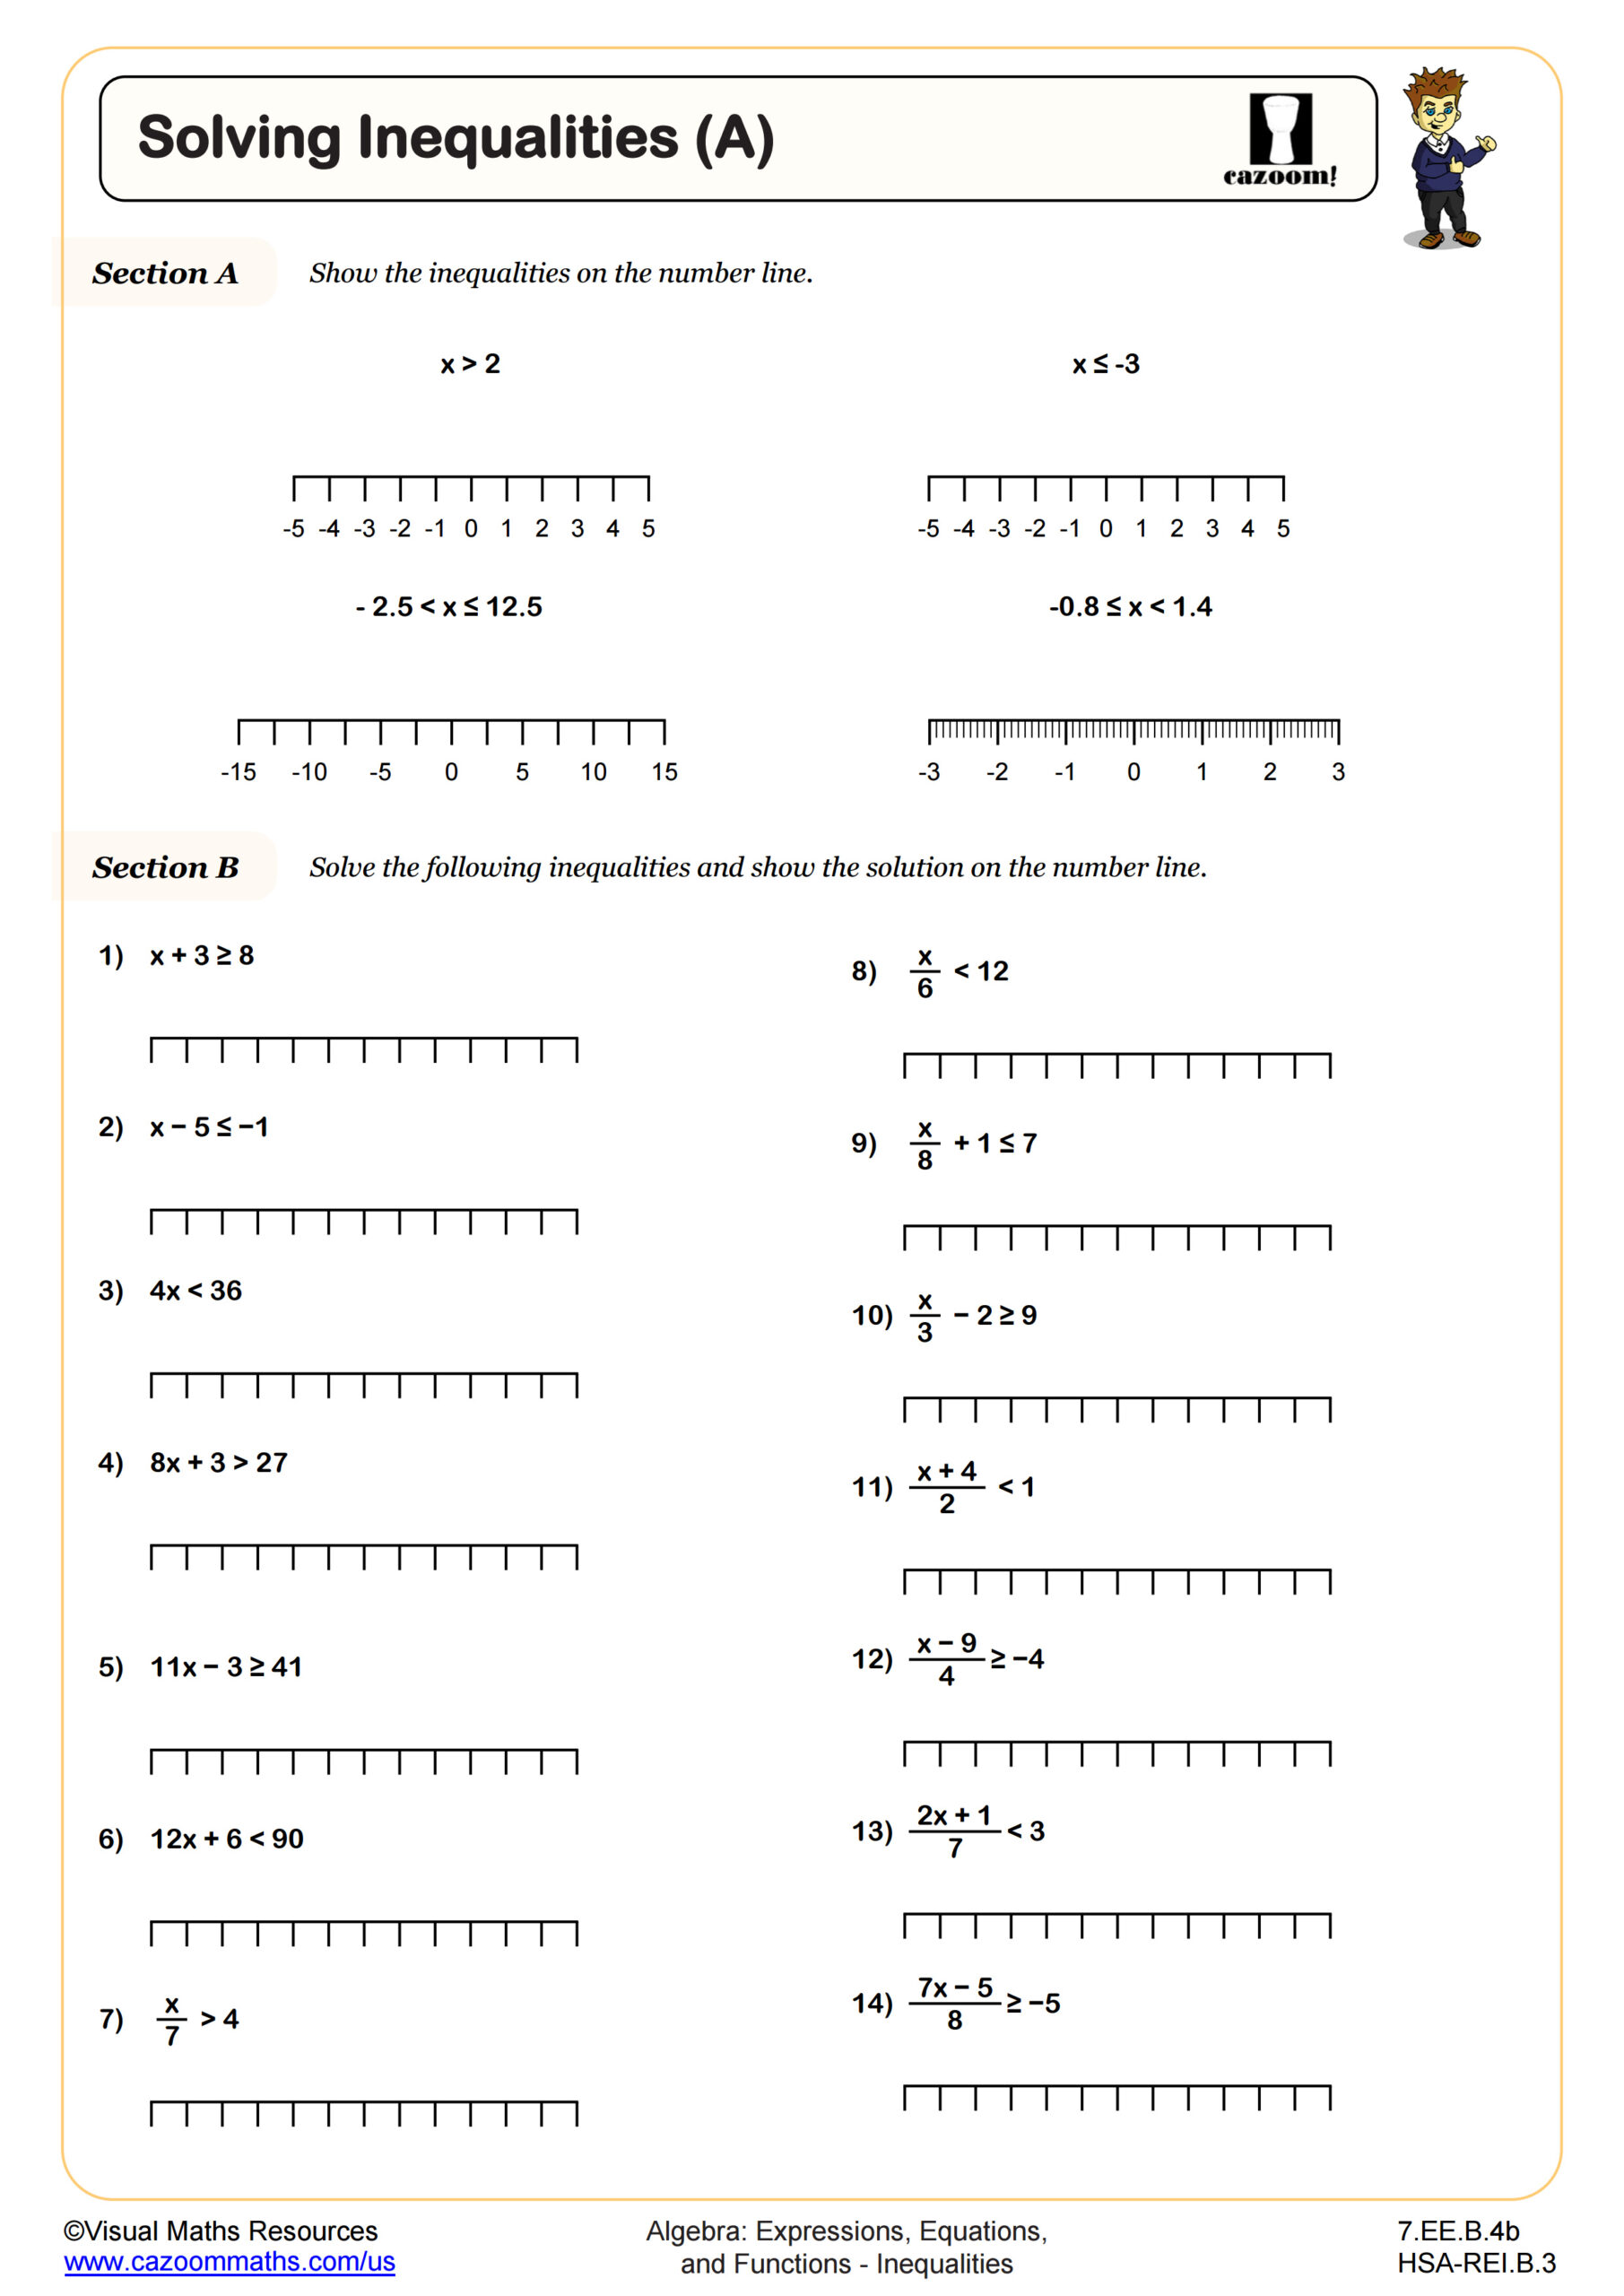
Inequalities are mathematical statements that compare two expressions using symbols like greater than (>), less than (<), greater than or equal to (≥), and less than or equal to (≤). In 7th grade, students encounter inequalities as an extension of their equation work, learning to represent situations where exact values aren't required or where a range of solutions exists. This aligns with Common Core standard 7.EE.B.4, which expects students to use variables to represent quantities and solve real-world mathematical problems involving linear inequalities.
A common misconception emerges when students treat the inequality symbol like an equal sign and expect one solution. Teachers notice students initially struggle to understand that x > 5 means infinitely many values satisfy the inequality, not just six or seven. The graphing component helps students visualize this solution set, and state assessments regularly test whether students can match an inequality to its correct number line representation or write an inequality from a given graph.
What grade level are these inequality worksheets for?
These worksheets target 7th grade students in middle school, where inequalities become a formal part of the expressions and equations strand. At this stage, students apply their understanding of number sense, operations, and basic algebraic thinking to represent and solve problems involving unequal relationships. The content bridges arithmetic reasoning and the more abstract algebraic manipulation students will encounter in 8th grade and high school courses.
In 6th grade, students work with numerical expressions and begin recognizing inequality relationships through ratio and number line work. The 7th grade worksheets formalize this understanding with symbolic notation and graphing techniques. By 8th grade, students extend these skills to solve and graph two-variable linear inequalities, building directly on the single-variable inequalities practiced here. This progression ensures students develop fluency with inequality concepts before tackling more complex algebraic applications in high school algebra courses.
How do students graph inequalities on a number line?
Graphing inequalities on a number line requires students to identify a boundary point and then indicate which values make the inequality true. For inequalities with < or >, students use an open circle at the boundary to show that value isn't included in the solution set, then shade or draw an arrow in the direction of values that satisfy the inequality. For ≤ or ≥, students use a closed or filled circle to show the boundary value is included. Students lose points on standardized tests when they mix up these circle conventions or shade in the wrong direction.
This skill connects directly to real-world constraints in STEM fields. Engineers use inequalities to specify acceptable tolerances for manufactured parts: a shaft diameter might need to satisfy 2.48 ≤ d ≤ 2.52 centimeters. Budget planners work with inequalities when total expenses must stay below available funds. Scientists express measurement uncertainty using inequality notation. Understanding number line representations helps students visualize these practical constraints, making abstract mathematical notation meaningful in contexts where precision and acceptable ranges matter.
How can teachers use these inequality worksheets effectively?
The worksheets provide structured practice moving between different representations of inequalities: symbolic notation, number line graphs, and written descriptions. This multi-representational approach helps students build flexibility in thinking about inequalities rather than memorizing isolated procedures. The answer keys allow students to self-check during independent work or enable teachers to quickly review student thinking and identify where confusion arises, particularly around boundary points and direction of shading.
Many teachers use these worksheets during guided practice after introducing inequality concepts, allowing students to work through examples while circulating to address questions. The worksheets work well for differentiated instruction, where some students need additional practice with basic graphing while others tackle writing inequalities from more complex graphs. Teachers also assign these for homework following classroom instruction, as warm-up review before assessments, or during intervention time for students who need focused practice on specific subtopics. Paired work encourages mathematical discussion as students explain their reasoning about which direction to shade or why they chose a particular inequality symbol.