7th Grade Pie Charts and Bar Charts Worksheets
All worksheets are created by the team of experienced teachers at Cazoom Math.
What skills do students practice with pie charts and bar charts worksheets?
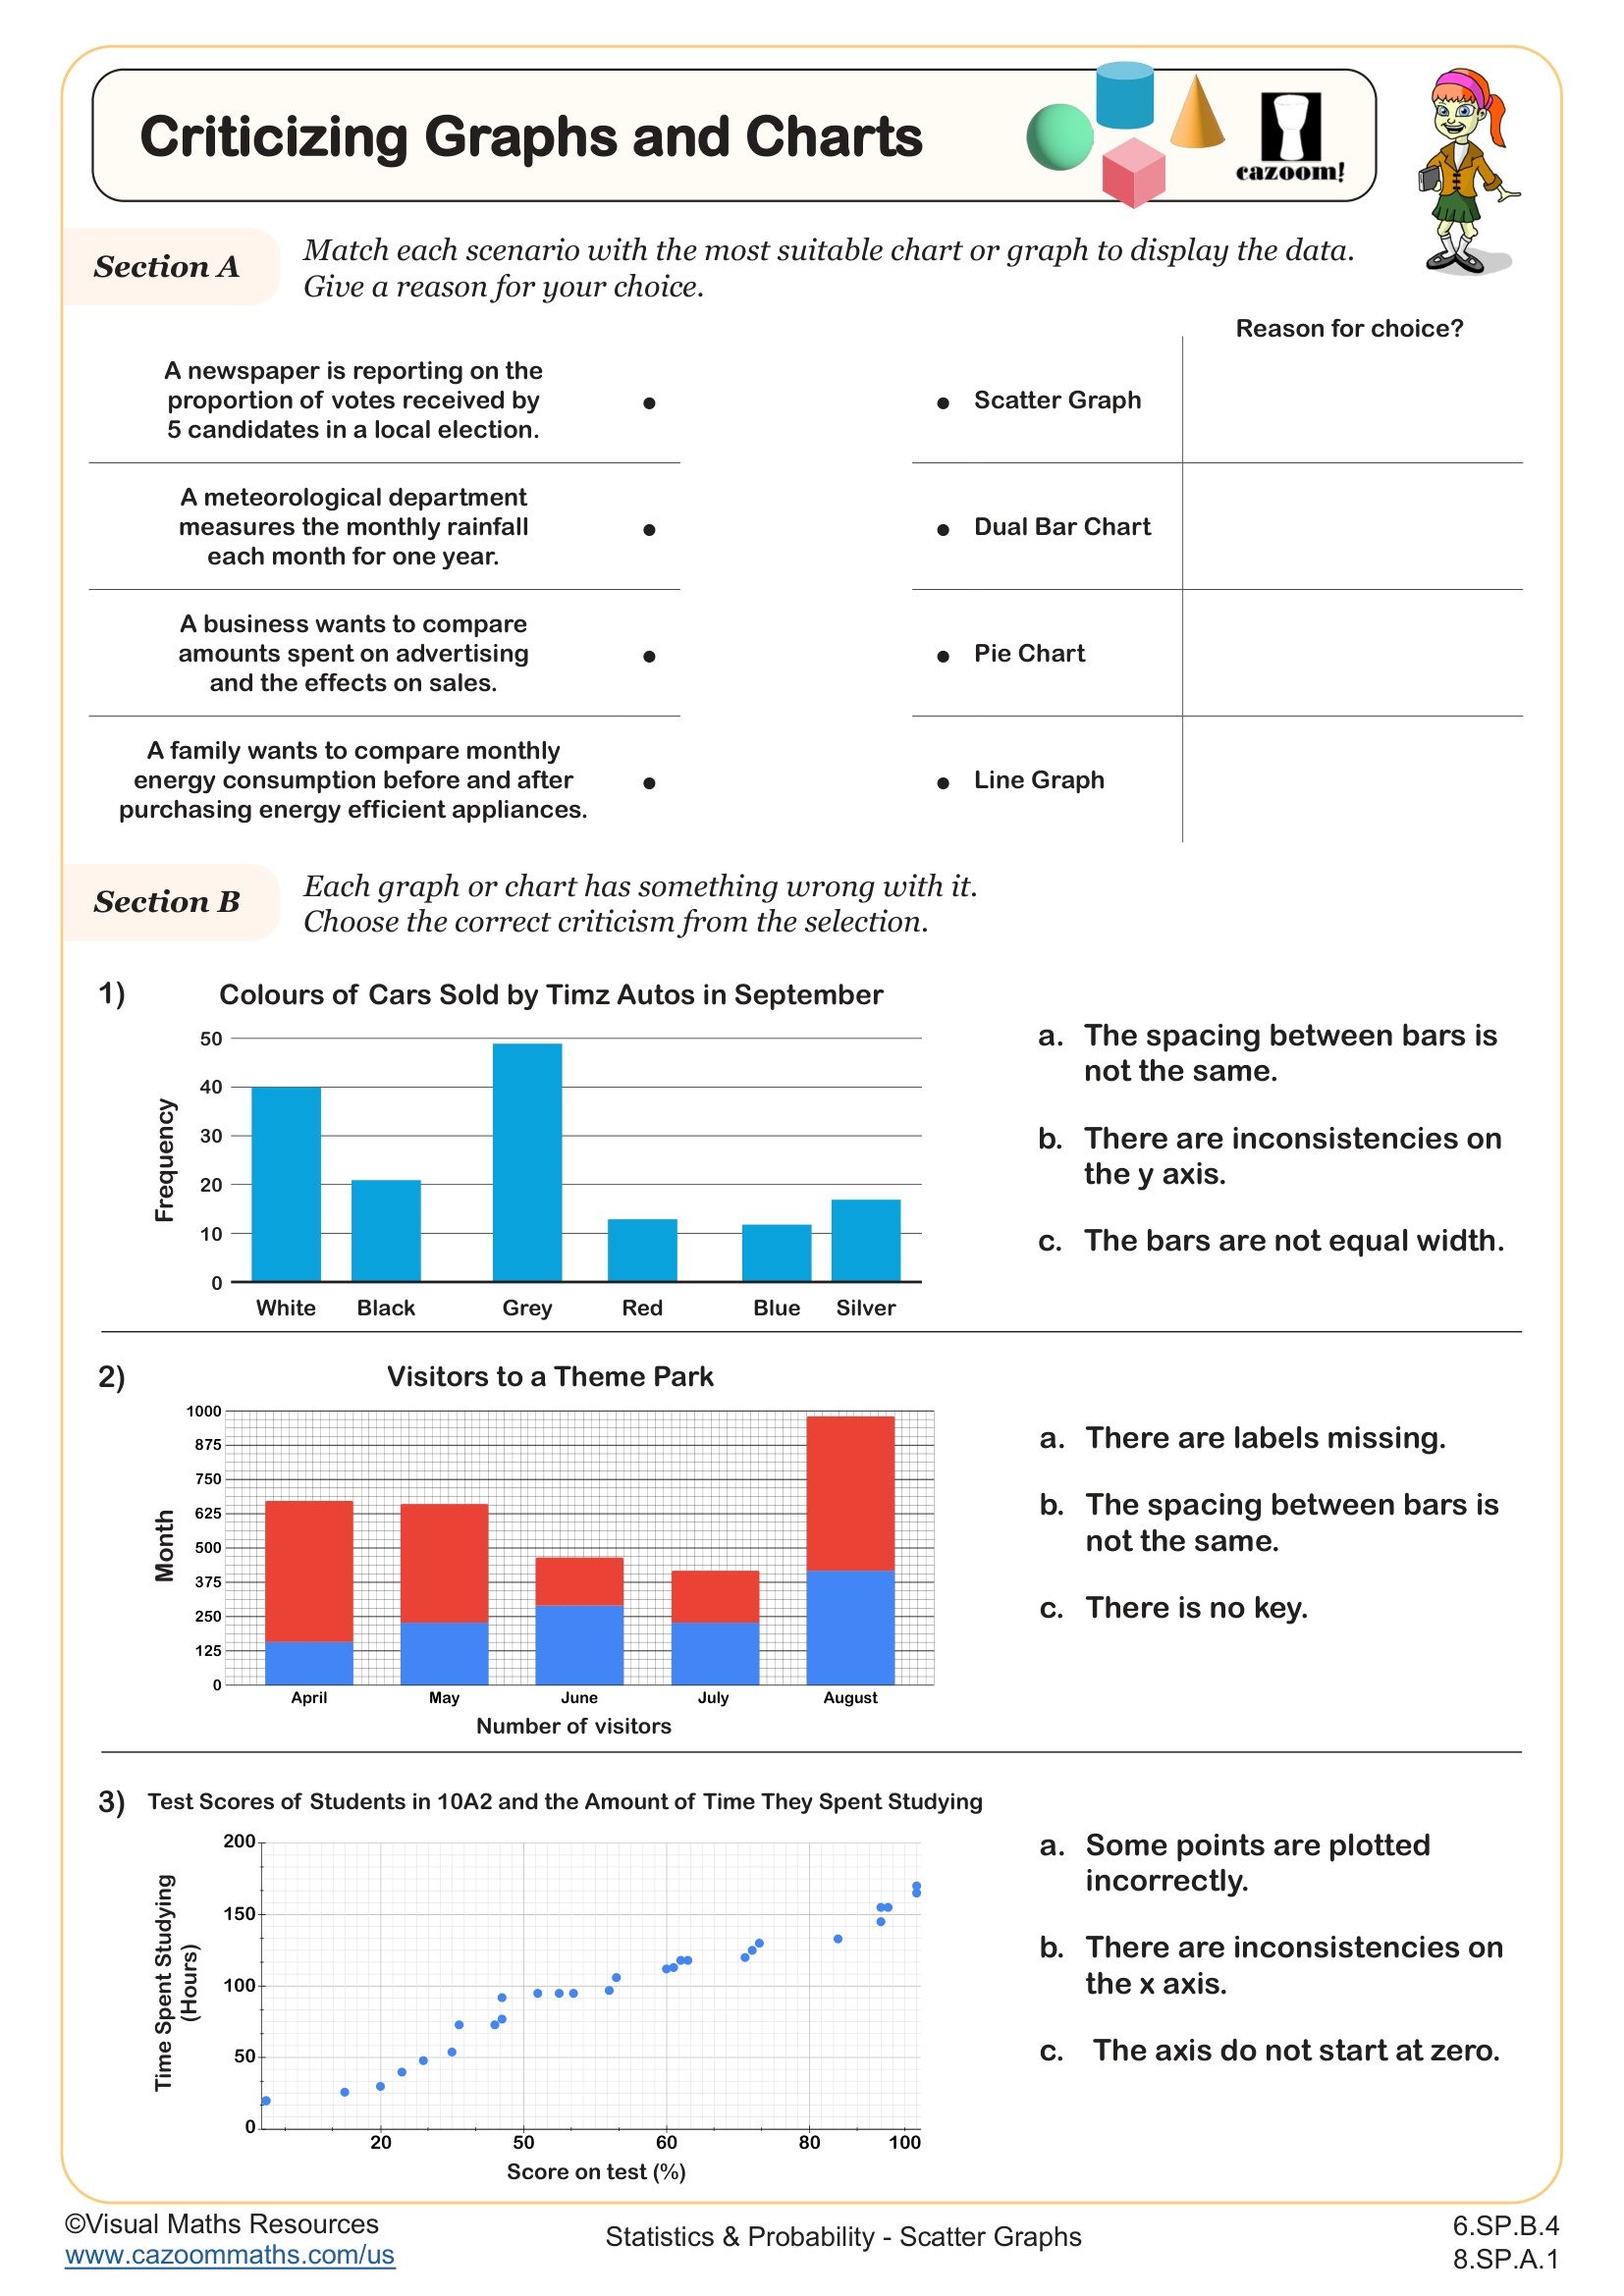
Students practice interpreting data from multiple visual formats and creating accurate representations of numerical information. The worksheets develop skills in reading scales, calculating percentages and fractions from pie charts, comparing categories across bar graphs, and extracting information from two-way tables and pictographs. Students also work on selecting appropriate graph types based on the data structure and drawing accurate charts with proper labeling.
A common error occurs when students confuse the size of pie chart sections with their actual values. For example, students might correctly identify that a section represents 25% but then report the answer as 25 instead of calculating one-quarter of the total dataset. Teachers see this mistake repeatedly on assessments, which is why practice converting between visual representations and numerical values proves particularly valuable for exam preparation.
What grade level are these pie charts and bar charts worksheets designed for?
These worksheets target 7th grade students in middle school, aligning with curriculum standards that emphasize data analysis and statistical reasoning. At this level, students move beyond basic graph reading to more complex interpretations involving percentages, ratios, and multi-step problems. The Common Core State Standards expect seventh graders to use random sampling concepts and make inferences about populations, skills that rely heavily on interpreting various graph formats.
This work builds directly on 6th grade foundations where students created basic graphs and calculated simple statistics. By 7th grade, the complexity increases with questions requiring proportional reasoning and connecting multiple data representations. These skills prepare students for 8th grade work with scatter plots, linear relationships, and bivariate data, where choosing and interpreting appropriate graphs becomes critical for understanding correlation and causation.
How do students learn to draw pie charts accurately?
Drawing pie charts requires students to convert data into percentages, then translate those percentages into angle measures by calculating the appropriate fraction of 360 degrees. Students must recognize that each 1% equals 3.6 degrees, so a category representing 25% requires a 90-degree angle. The worksheets guide students through this multi-step process, from organizing raw data to measuring and labeling each sector with precision using a protractor.
This skill connects directly to STEM fields where data visualization matters. Scientists use pie charts to show composition of substances in chemistry, engineers display budget allocations across project phases, and medical researchers present percentages of patients responding to different treatments. Understanding how to create accurate visual representations helps students communicate findings effectively in science fair projects, lab reports, and research presentations throughout their academic careers.
How can teachers use these pie charts and bar charts worksheets effectively?
The worksheets provide structured practice that moves students from interpretation to creation of graphs. Teachers can use the reading activities first to ensure students understand how information translates into visual formats before asking them to construct their own. The included answer keys allow students to check their work independently, making these materials suitable for stations, learning centers, or flipped classroom models where students work at different paces.
Many teachers use these worksheets for targeted intervention with students who struggle on the data analysis portions of state assessments. The variety of graph types helps teachers identify specific gaps, whether students need practice with scales, angle calculations, or table interpretation. They also work well as warm-ups before project-based activities where students collect and display their own data, or as homework that reinforces concepts introduced during whole-class instruction with real datasets.