8.SP.A.4 Worksheets
Common Core State Standards 8.SP.A.4 Worksheets
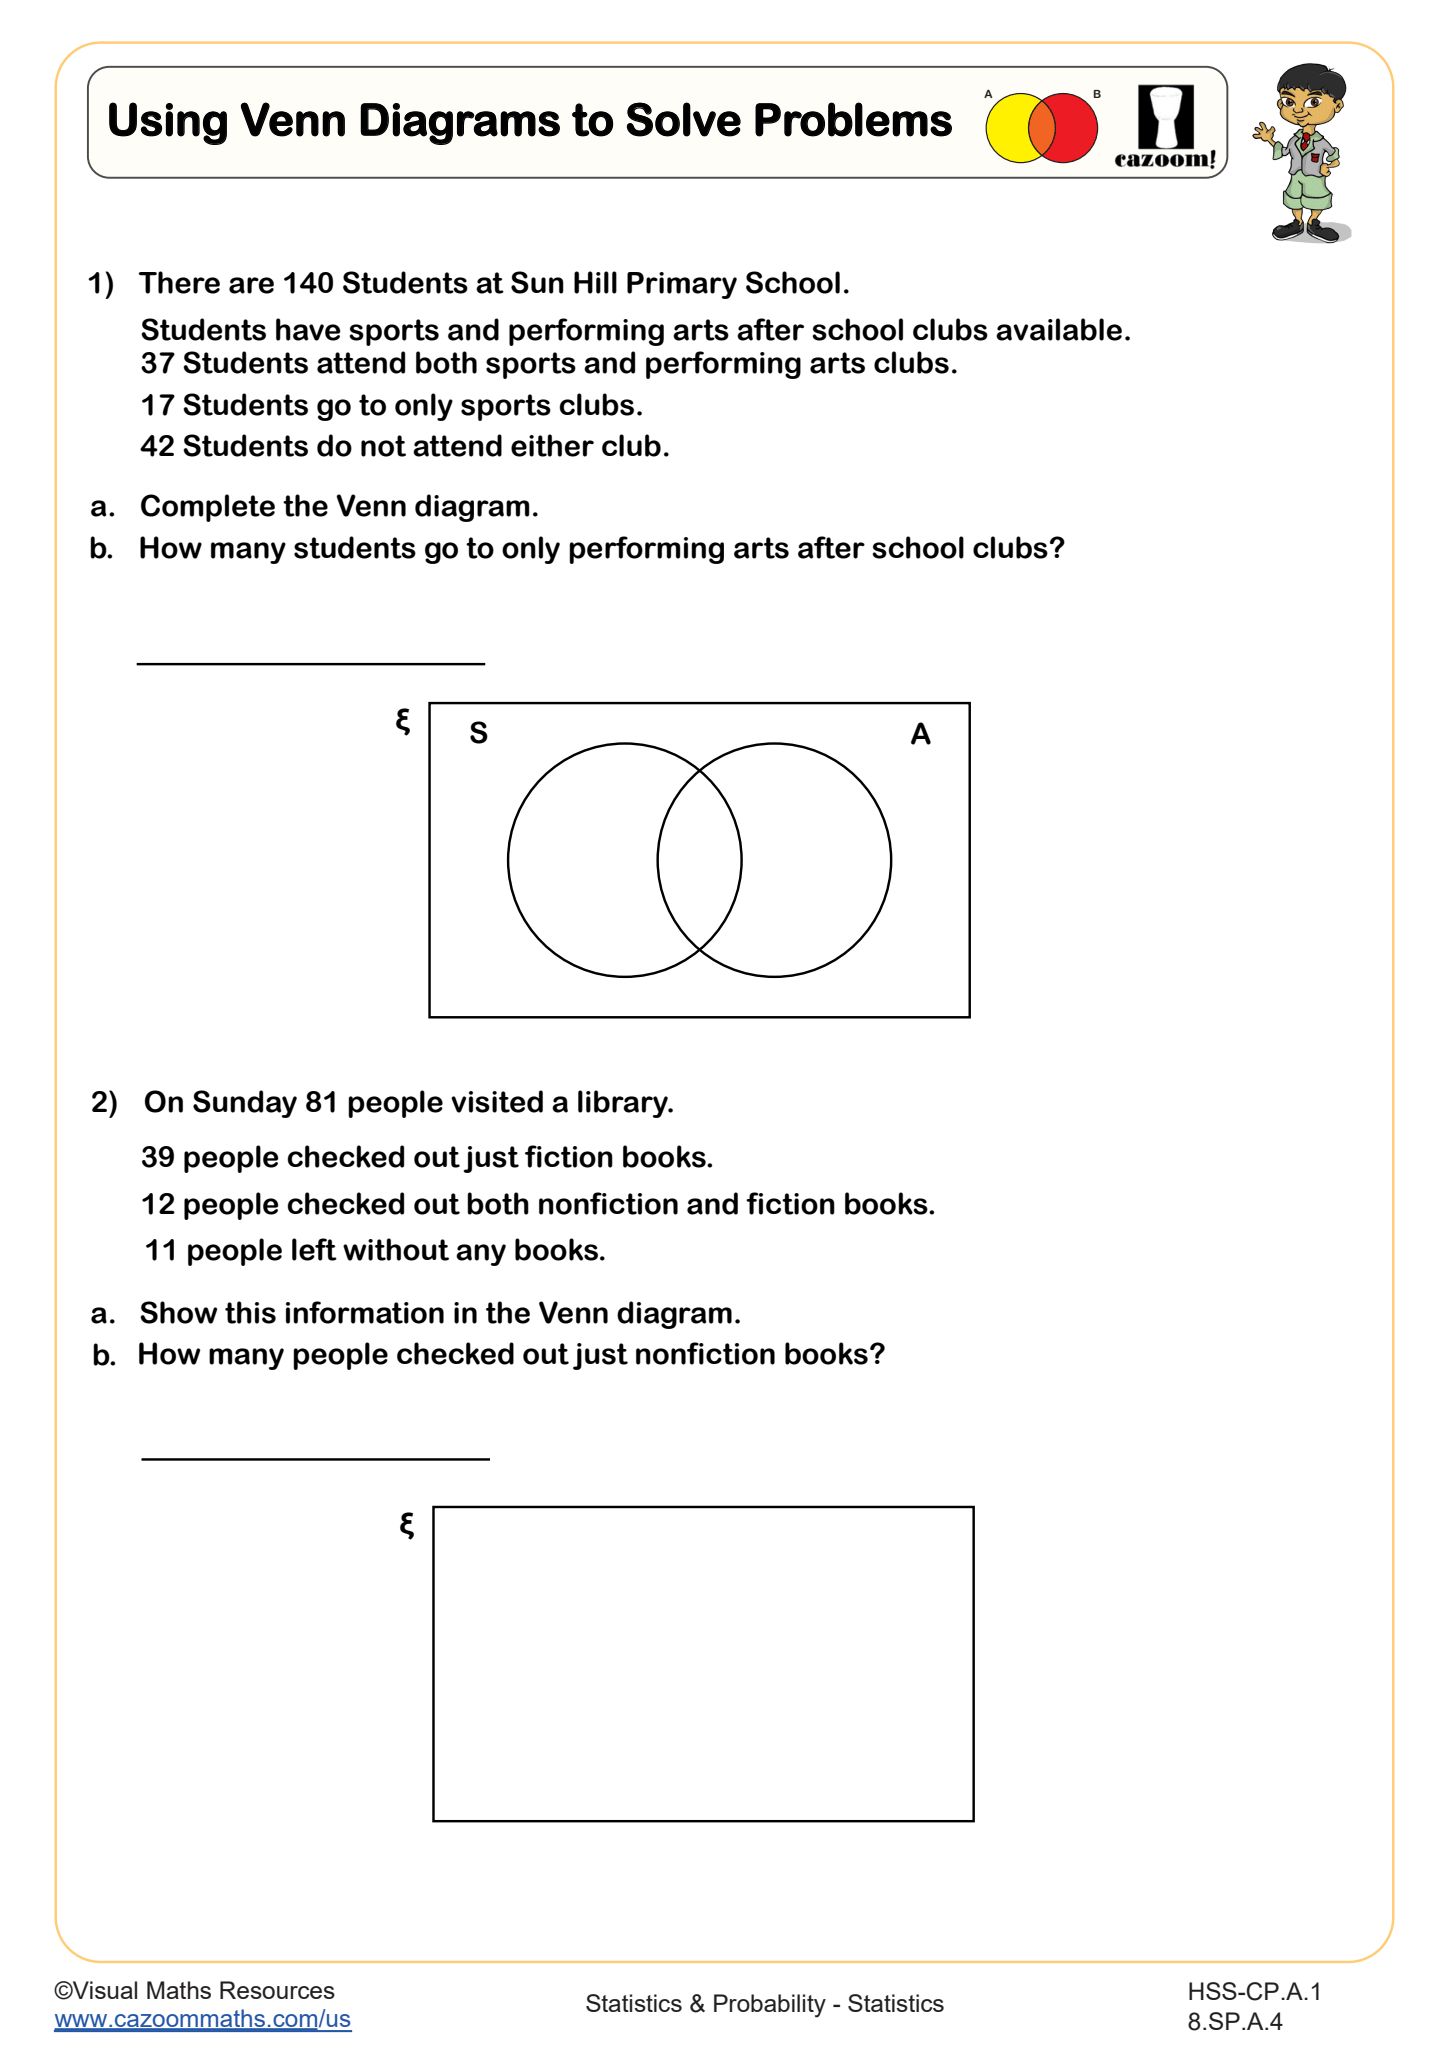
Strand: Statistics and Probability
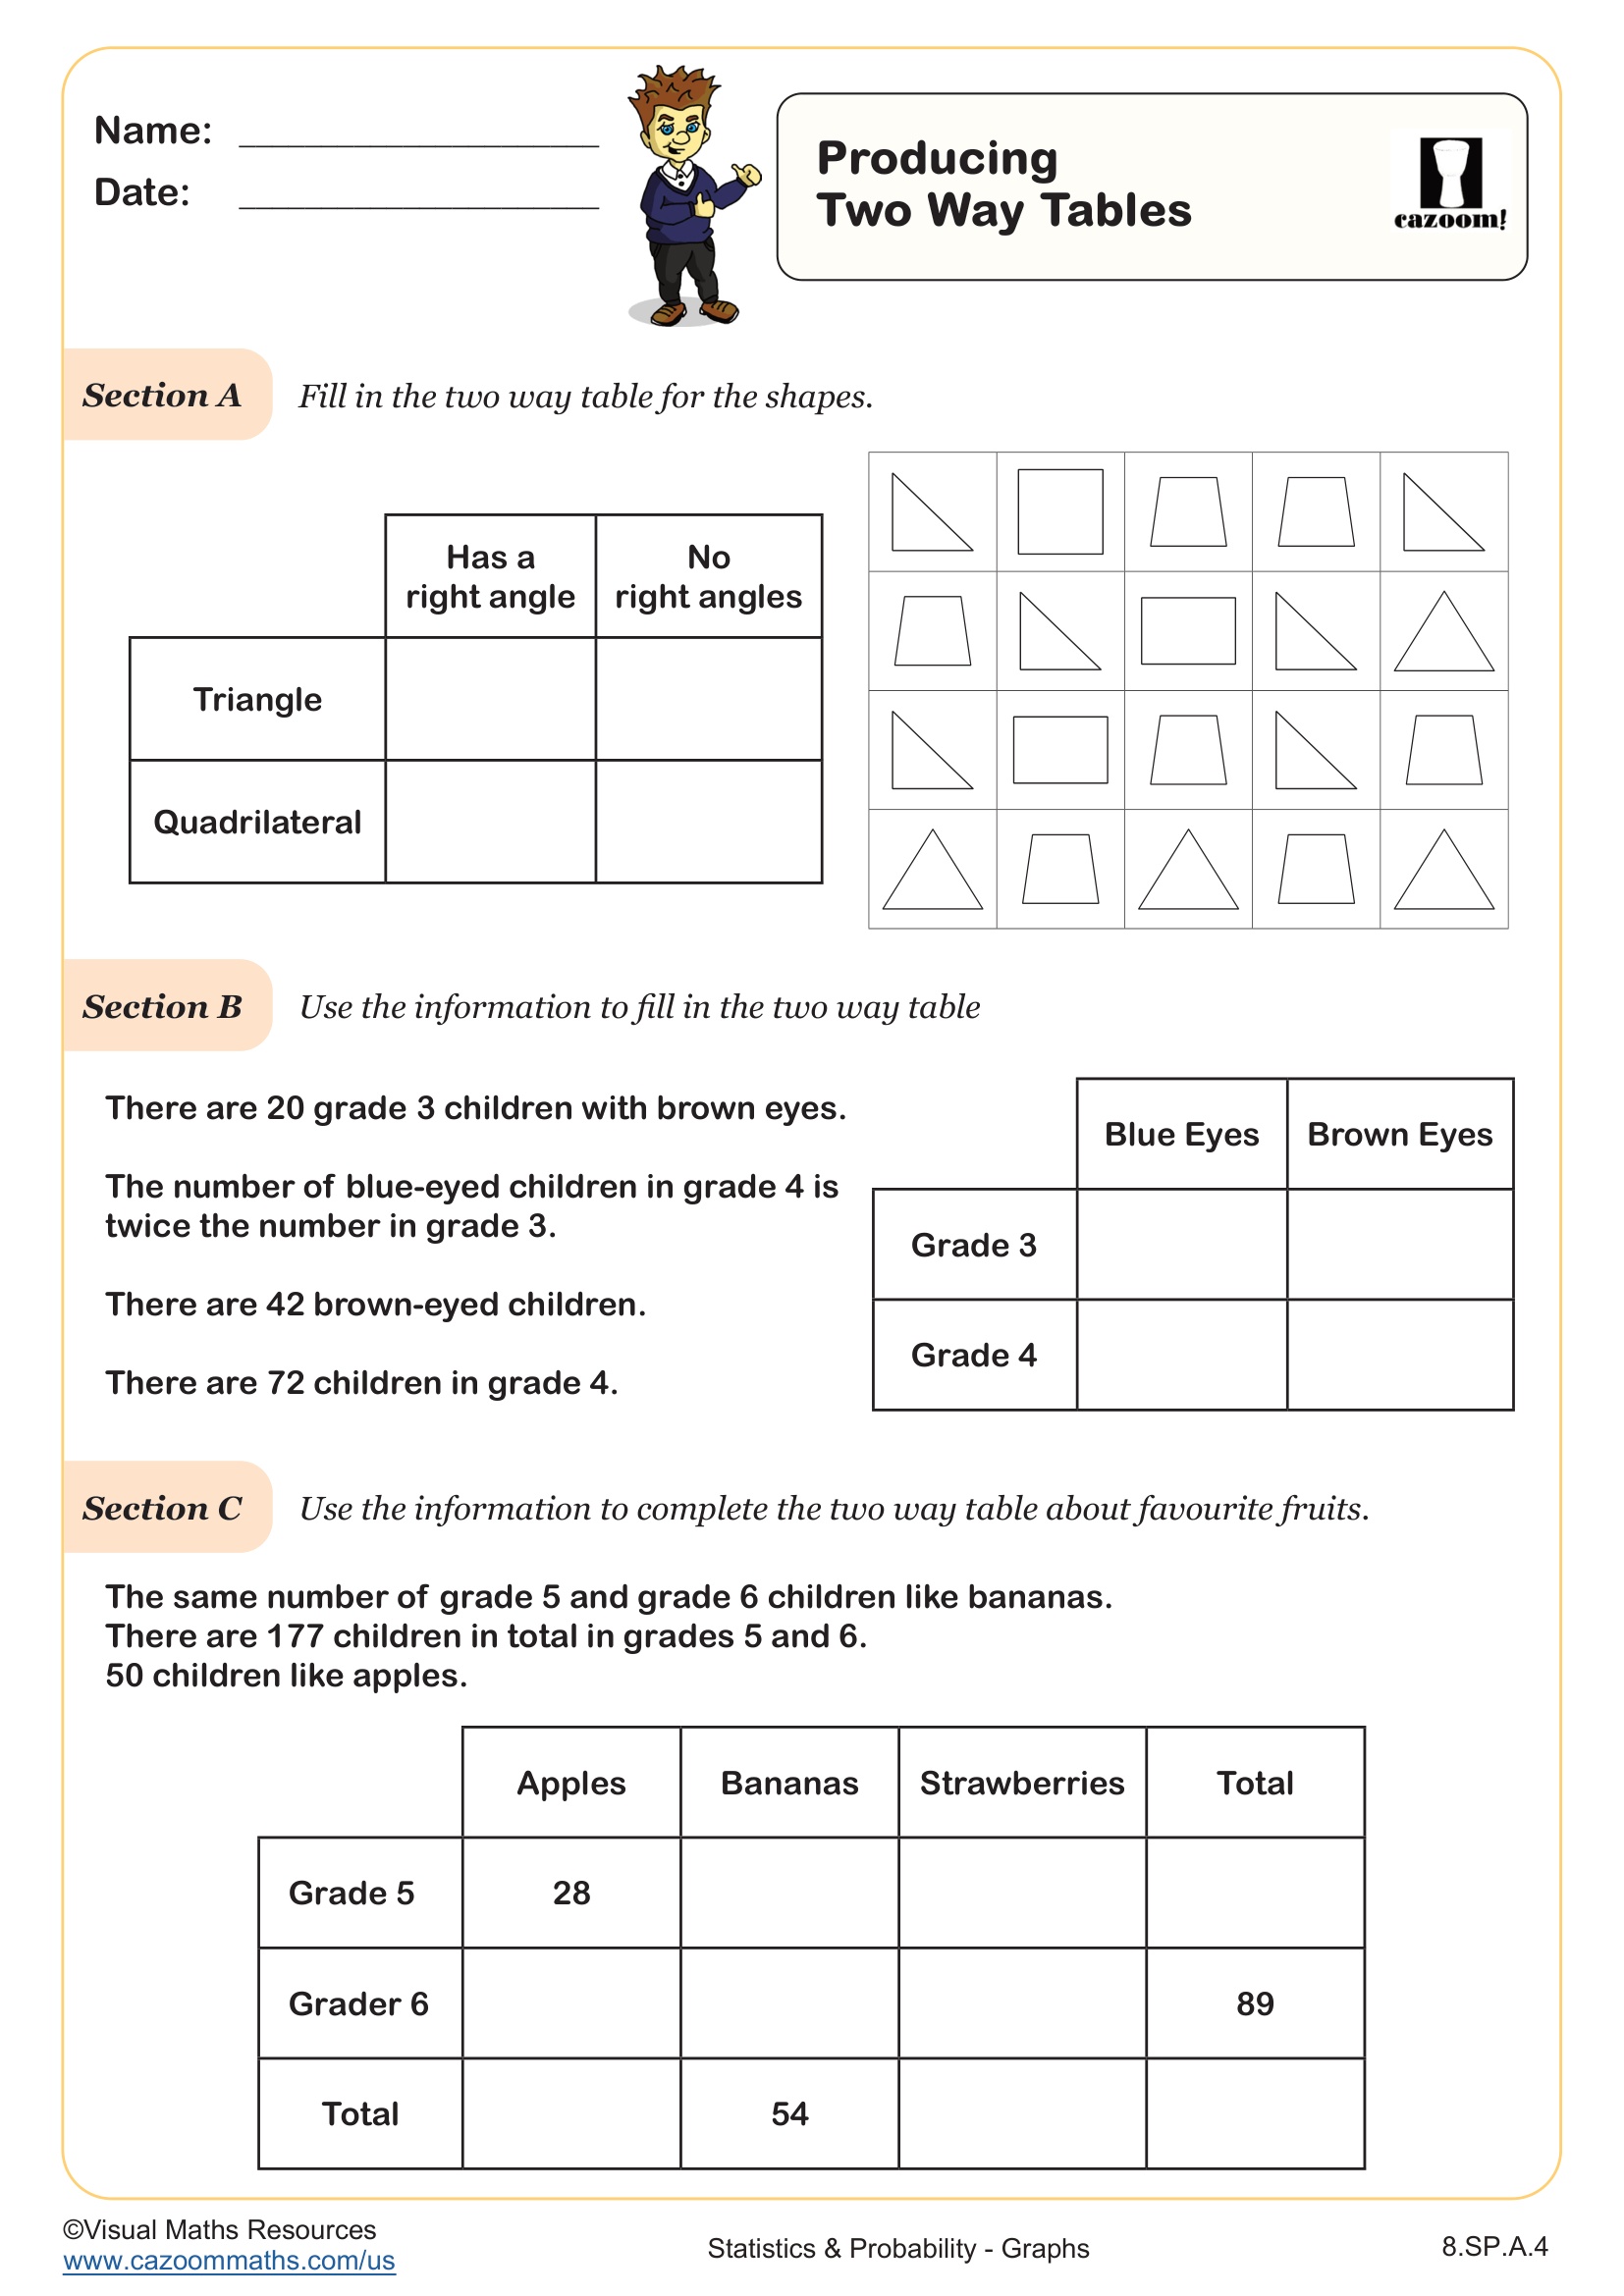
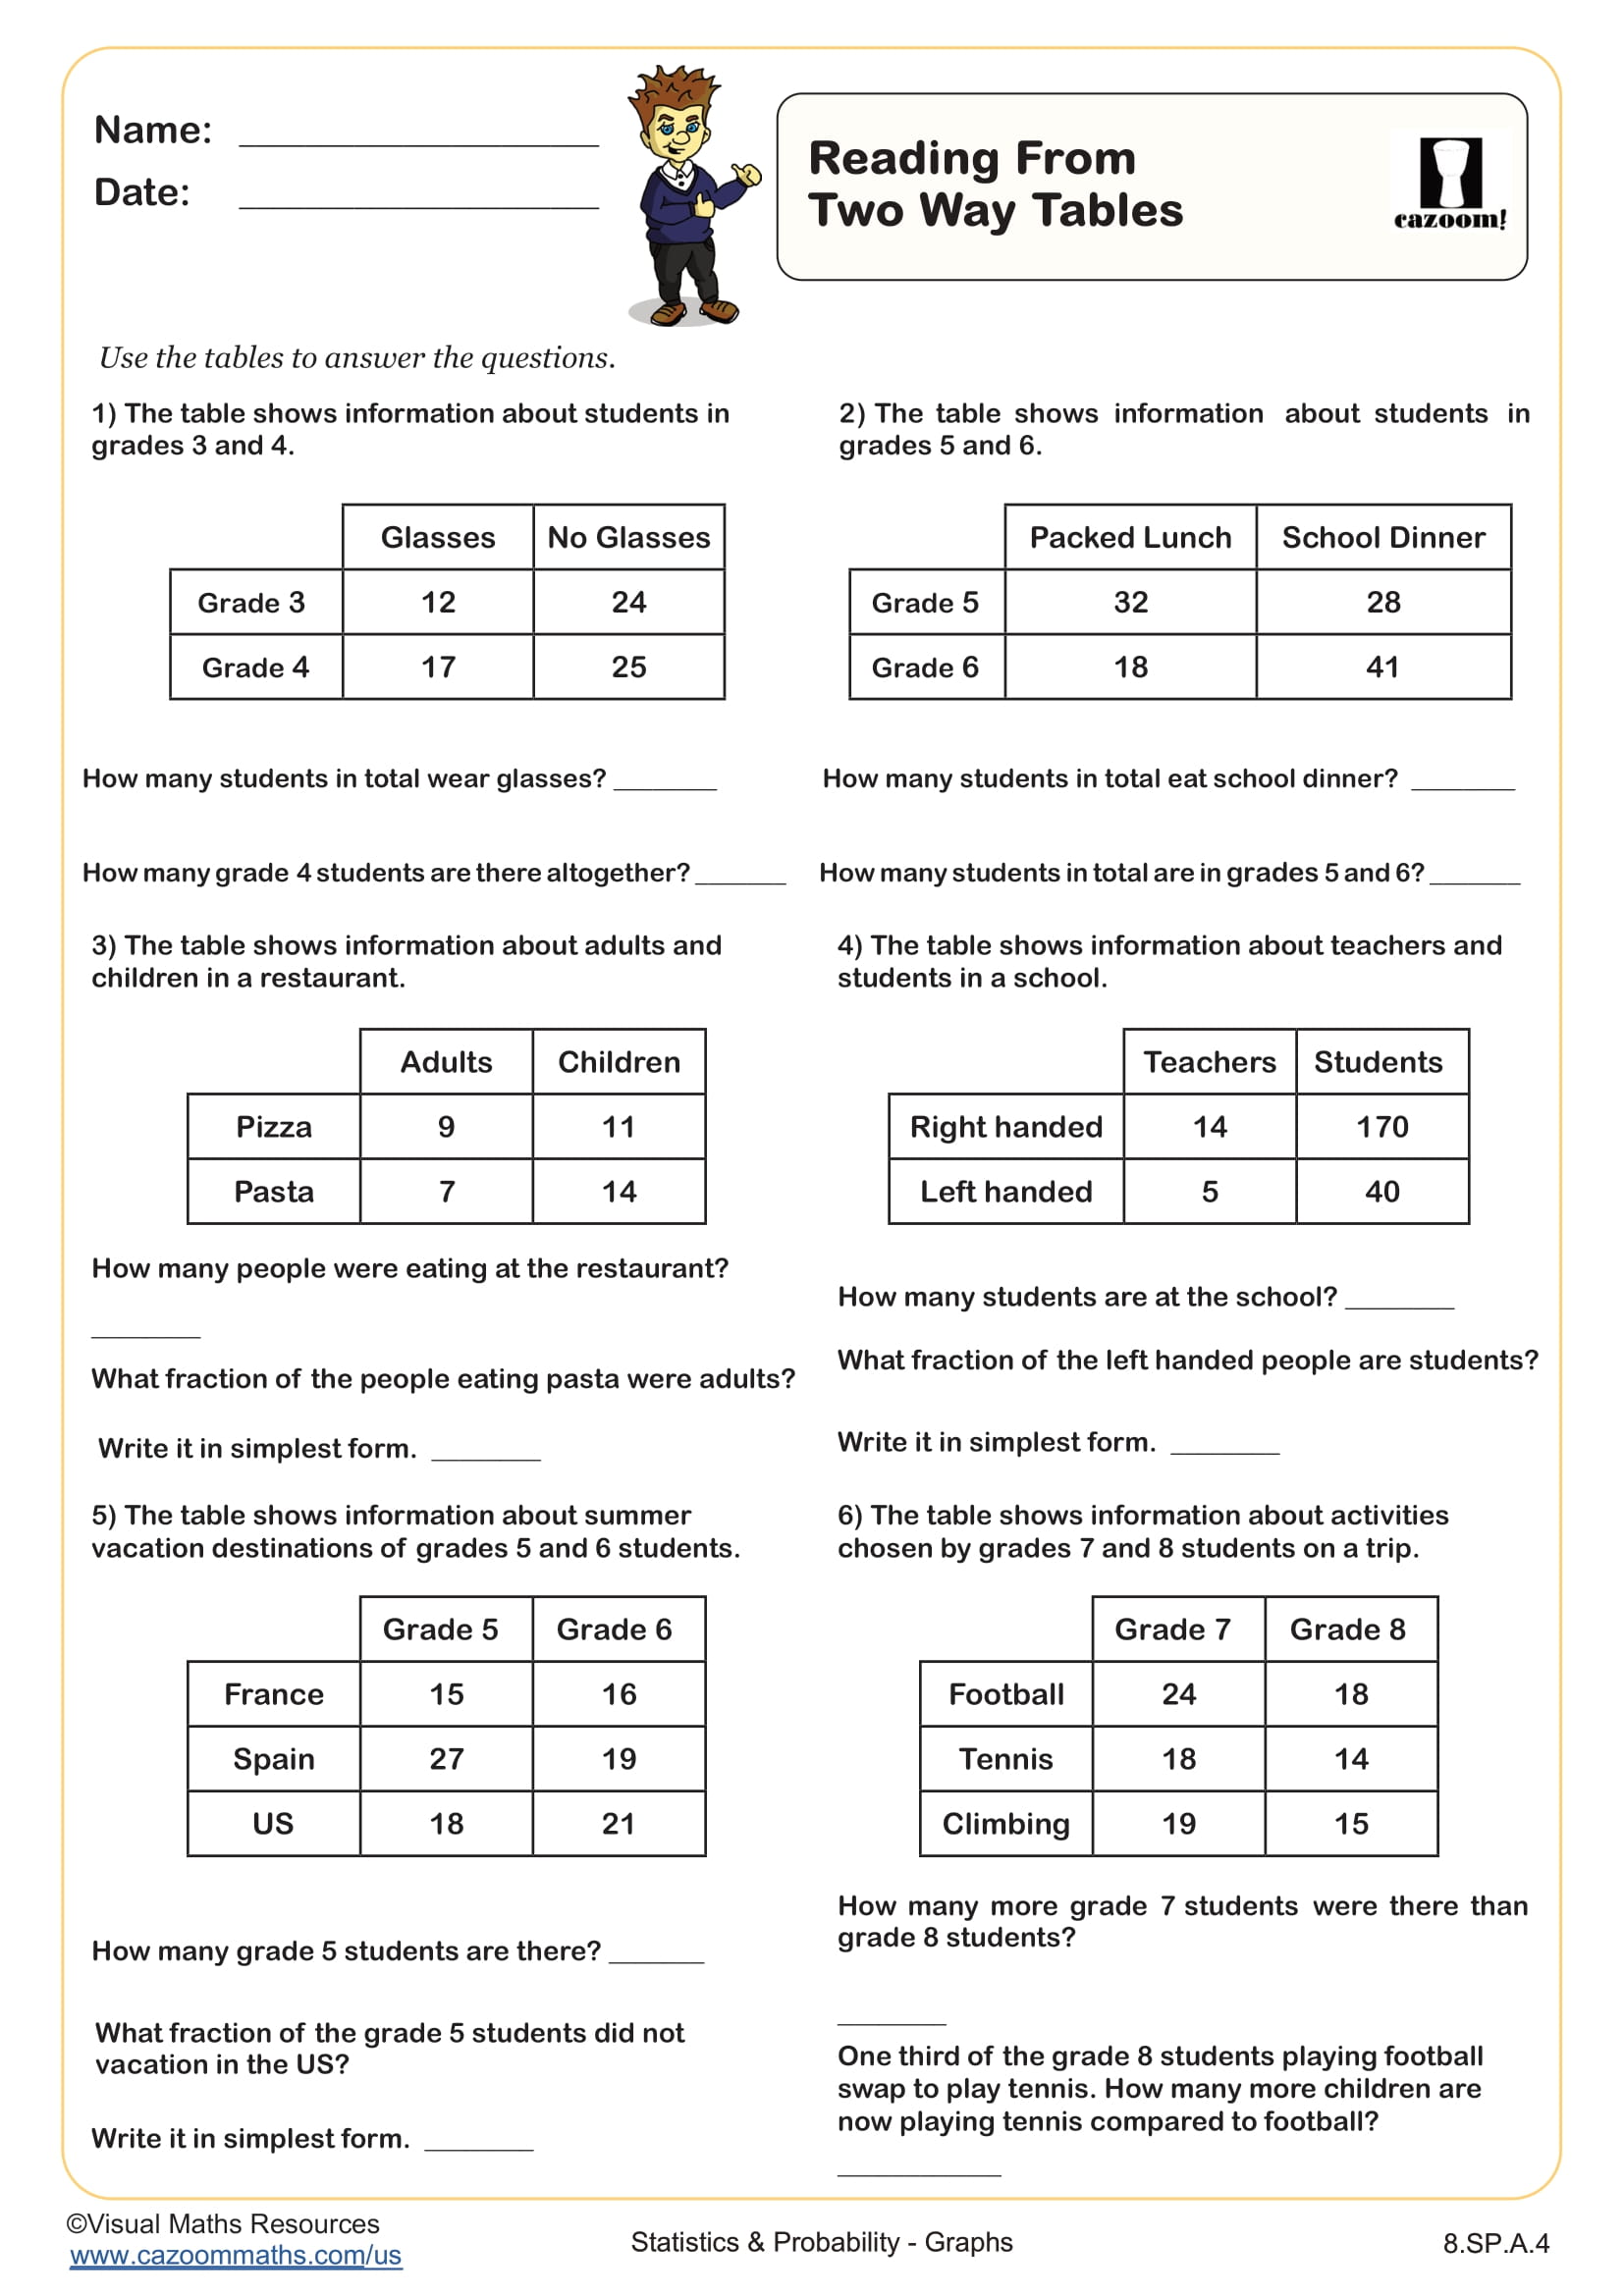
Objective: Investigate patterns of association in bivariate data.
CCSS Description: Understand that patterns of association can also be seen in bivariate categorical data by displaying frequencies and relative frequencies in a two-way table. Construct and interpret a two-way table summarizing data on two categorical variables collected from the same subjects. Use relative frequencies calculated for rows or columns to describe possible association between the two variables. For example, collect data from students in your class on whether or not they have a curfew on school nights and whether or not they have assigned chores at home. Is there evidence that those who have a curfew also tend to have chores?
Cazoom Math is a leading provider of Math Worksheets and used by over 50,000 teachers and parents around the world. Here you can find a set of math worksheets aligned to the common core standard 8.SP.A.4. These worksheets are perfect for learners to develop critical math skills.
You can click on the images below to find out more about each math worksheet, and download and print the resource.
We have a great range of resources for students in 8th Grade. Check out our 8th Grade Math Worksheets page for more details.
All worksheets are created by the team of experienced teachers at Cazoom Math.