8th Grade Ratio Worksheets
All worksheets are created by the team of experienced teachers at Cazoom Math.
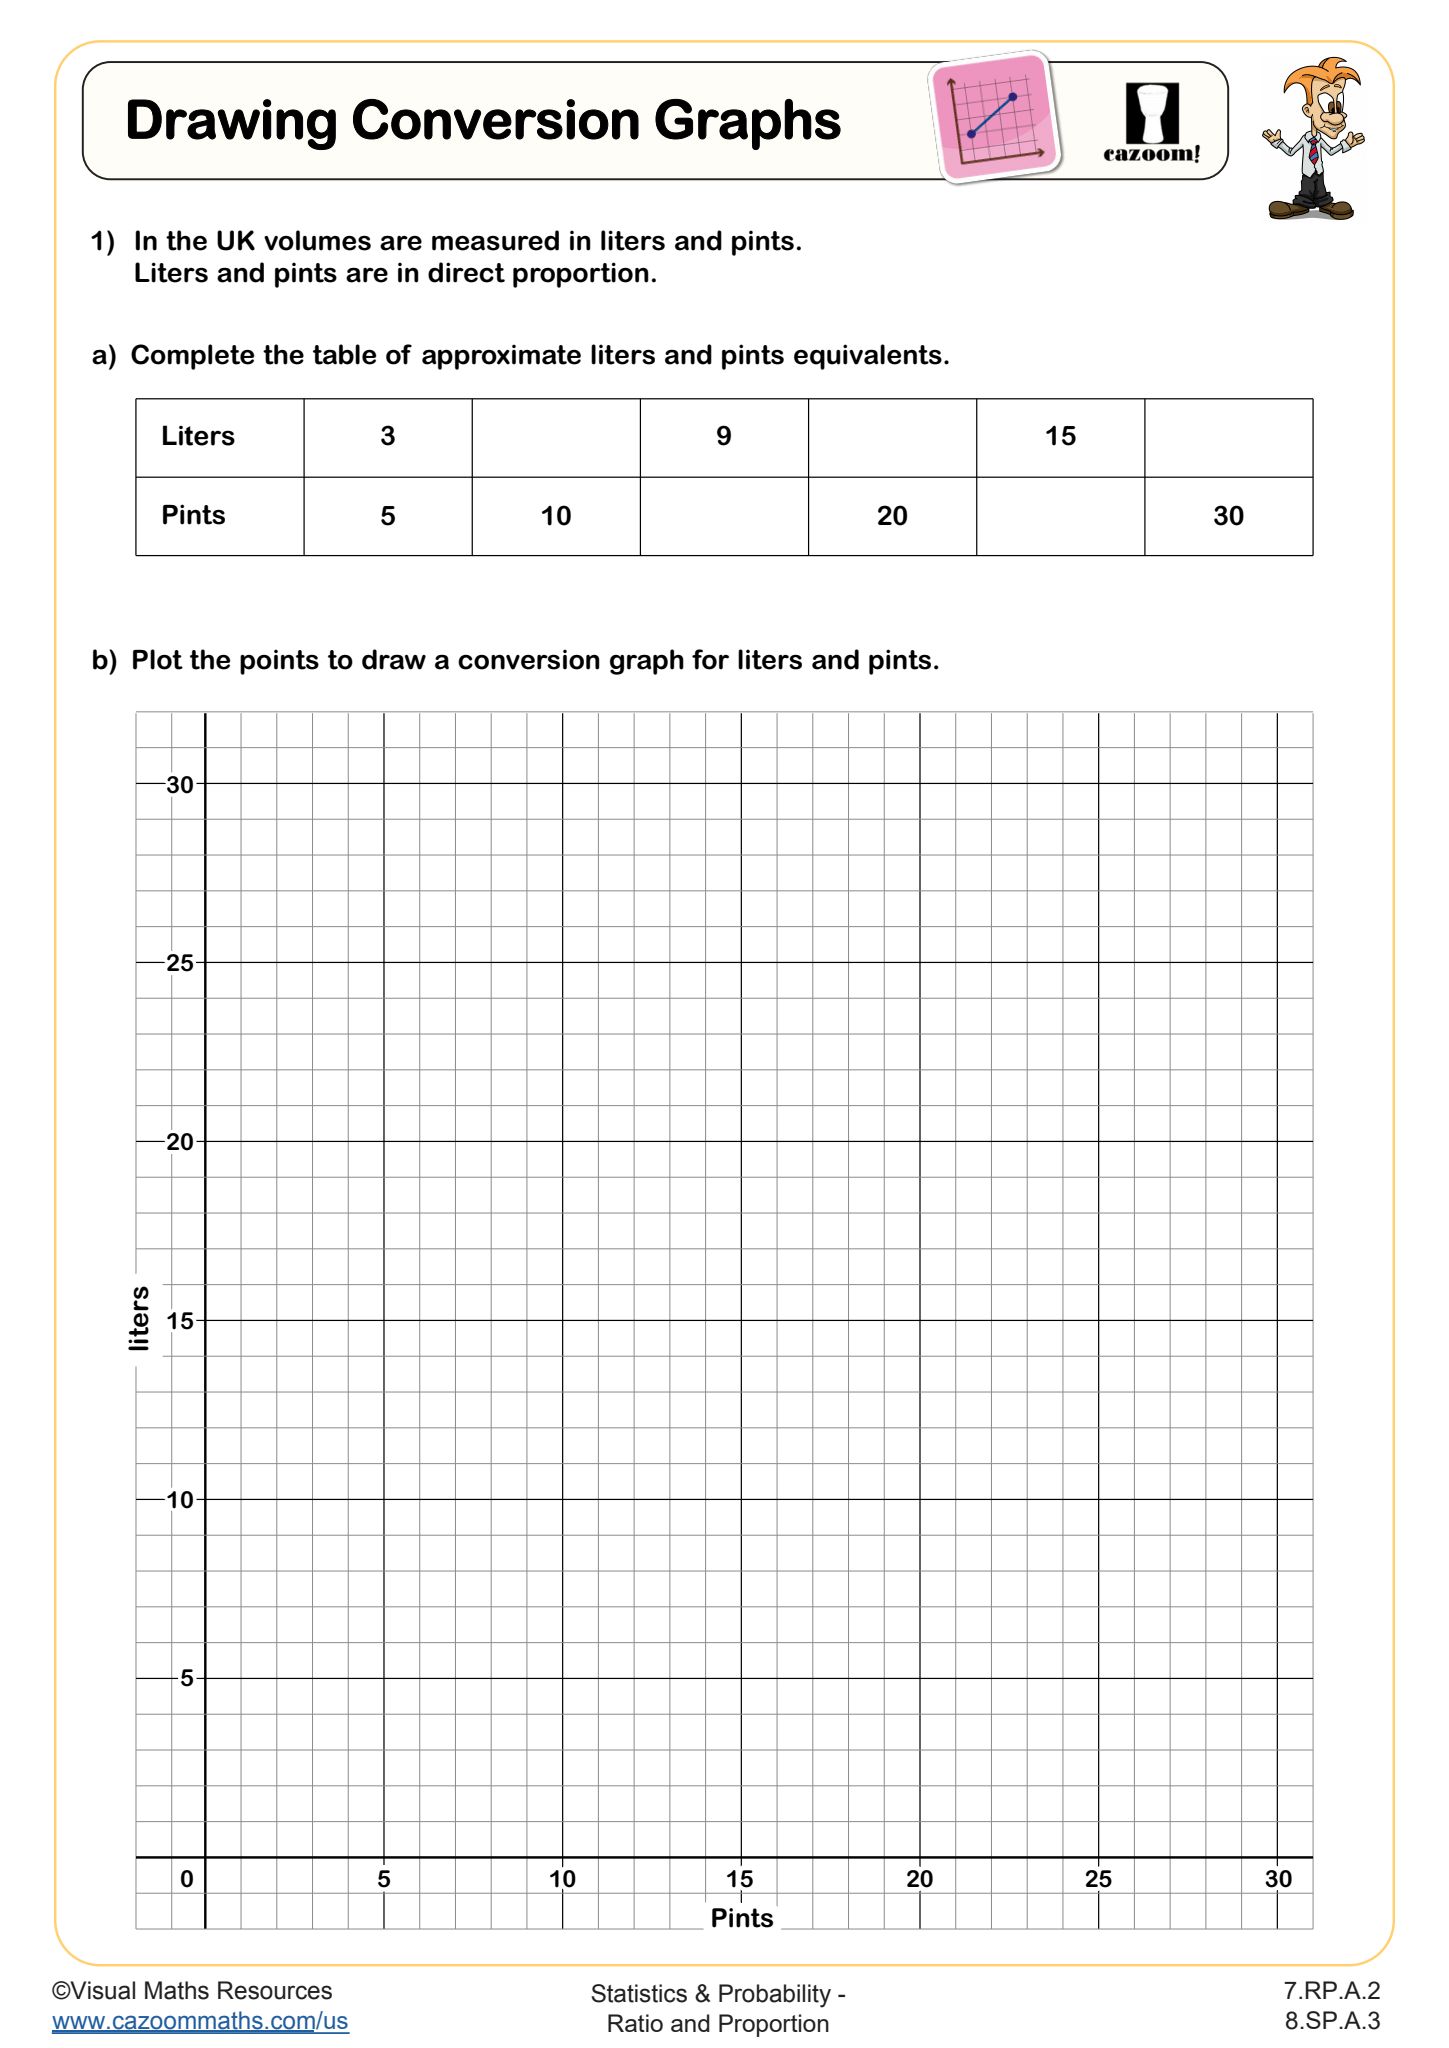
What are conversion graphs and why do 8th graders study them?
Conversion graphs represent the relationship between two different units of measurement as a straight line on a coordinate plane. In 8th grade, students use these graphs to convert between units like dollars to pounds, kilometers to miles, or gallons to liters by plotting points that represent equivalent values and drawing the proportional relationship.
Many students initially plot conversion points correctly but forget that the line must pass through the origin (0,0) for a true proportional relationship. Teachers notice this is when students make the connection between ratio tables from earlier grades and linear equations they're now studying. The slope of the conversion line equals the unit rate, linking three representations: the graph, the ratio, and the constant of proportionality.
What ratio skills should 8th grade students have mastered?
By 8th grade, students should move beyond basic ratio equivalence to graphing proportional relationships and analyzing unit rates as slopes. They're expected to recognize that proportional relationships form straight lines through the origin and write equations in y = kx form, where k represents the constant of proportionality. State assessments frequently test whether students can identify proportional vs. non-proportional relationships from graphs.
This builds directly on 7th grade work with unit rates and proportions but adds the algebraic and graphing components that prepare students for high school algebra. Students who master conversion graphs find linear functions in Algebra 1 more intuitive because they've already visualized constant rates of change. The connection between slope and ratio becomes foundational for understanding direct variation.
How do you read values from a conversion graph?
To read a conversion graph, students locate a value on one axis, trace horizontally or vertically to the conversion line, then read the corresponding value on the other axis. For example, on a miles-to-kilometers graph, finding 5 miles on the horizontal axis and tracing up to the line, then across to the vertical axis, reveals the equivalent kilometers. Students can also extend the line or calculate using the slope when exact points aren't marked.
This skill connects directly to real-world travel planning, currency exchange, and recipe scaling. Engineers use conversion graphs constantly when working with metric and imperial measurements in manufacturing specifications. Scientists graph temperature conversions between Celsius and Fahrenheit, pressure conversions between atmospheres and pascals, and energy conversions between calories and joules. These applications show students that proportional reasoning extends far beyond classroom exercises into professional STEM fields.
How can teachers use these ratio worksheets effectively?
These worksheets guide students through creating conversion graphs by providing structured practice with coordinate plotting and proportional reasoning. The included answer keys show not just final graphs but correct point placement, allowing teachers to identify exactly where students veer off track. Students benefit from seeing the visual pattern that equivalent ratios create when graphed.
Teachers often use these worksheets during the transition from numerical ratio work to algebraic representations, making them valuable for introducing or reinforcing the graphing component of proportional relationships. They work well for paired activities where one student plots points while another checks alignment through the origin. The worksheets also serve as intervention tools for students who understand ratios numerically but struggle with the graphical representation, and as homework to reinforce the connection between tables, graphs, and equations.