Elementary School Pie Charts and Bar Charts Worksheets
All worksheets are created by the team of experienced teachers at Cazoom Math.
What's the Difference Between Pie Charts and Bar Charts?
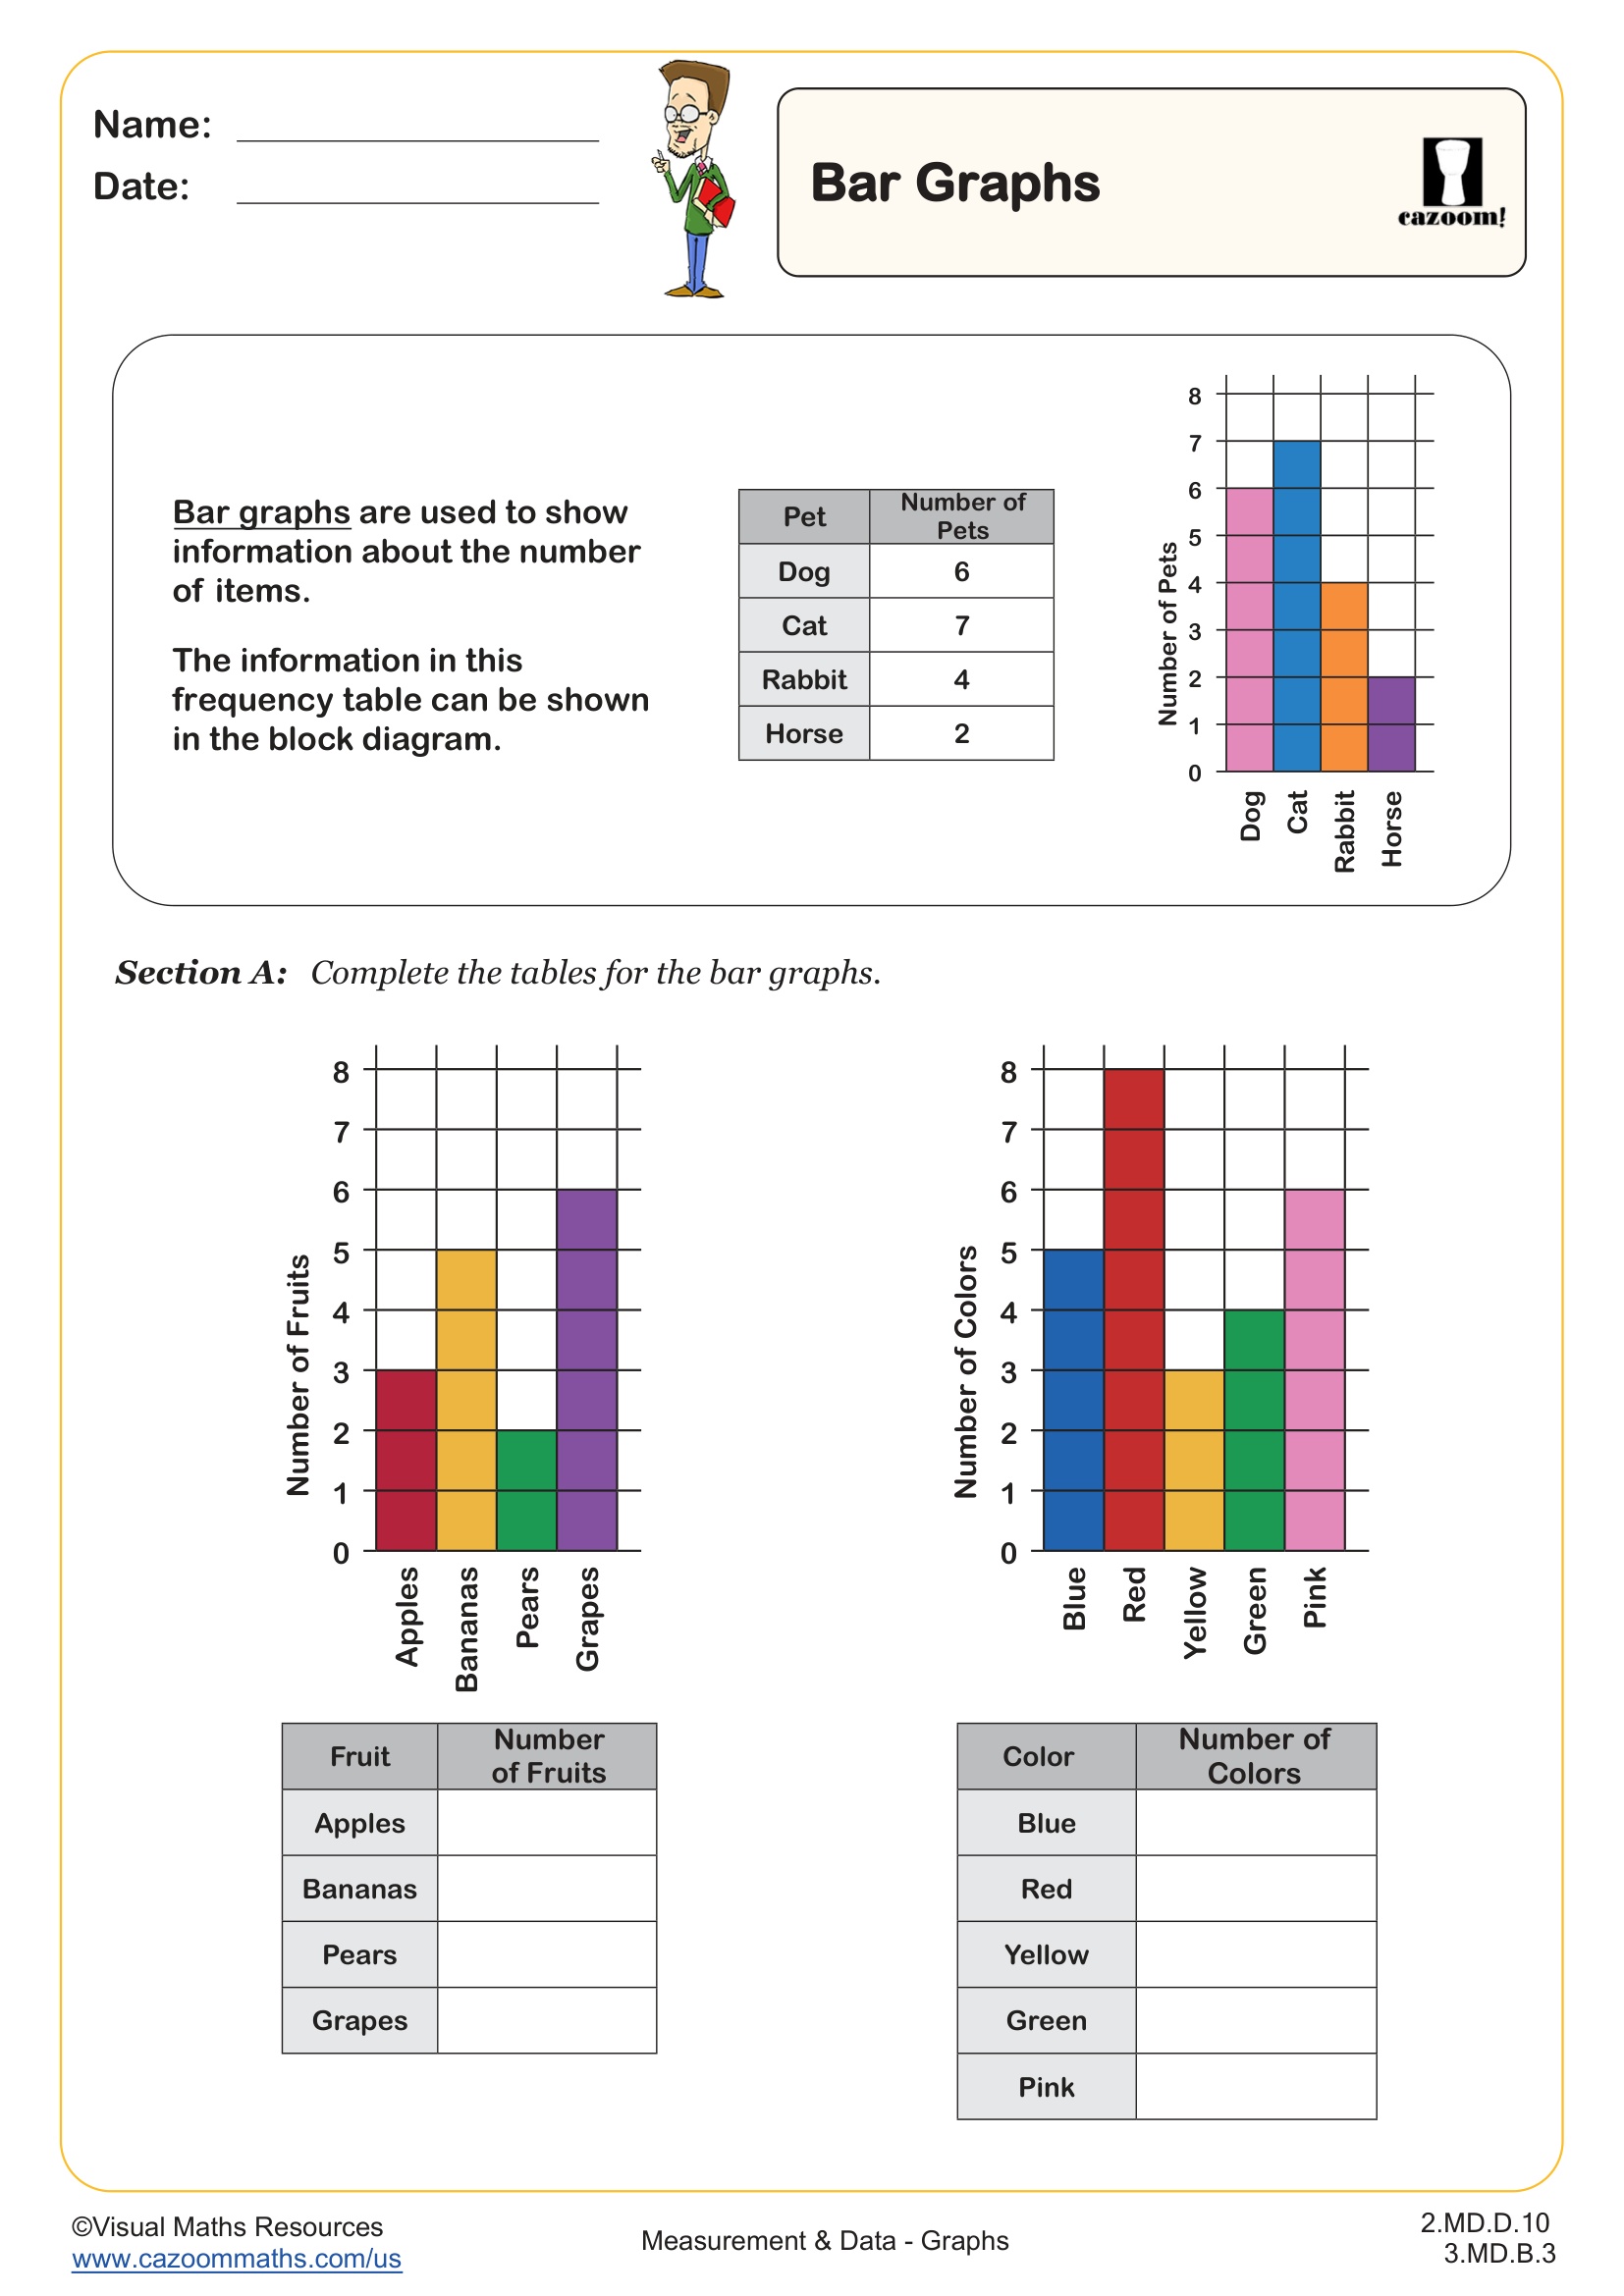
Bar charts use rectangular bars to show quantities across different categories, with the length or height representing the value. Pie charts divide a circle into slices, with each slice representing a part of the whole, showing proportions rather than exact counts. Students typically encounter bar charts first in early elementary grades because they're easier to read and construct, while pie charts appear more frequently in upper elementary when students understand fractions and parts of a whole.
A common misconception occurs when students try to compare exact values from pie charts without considering the total. Teachers often see students claim one slice is "bigger" without recognizing that 25% of 100 is different from 25% of 200. Bar charts avoid this confusion by displaying actual quantities on a numbered axis, making comparisons more straightforward for younger learners.
Which Grade Levels Use These Pie Charts and Bar Charts Worksheets?
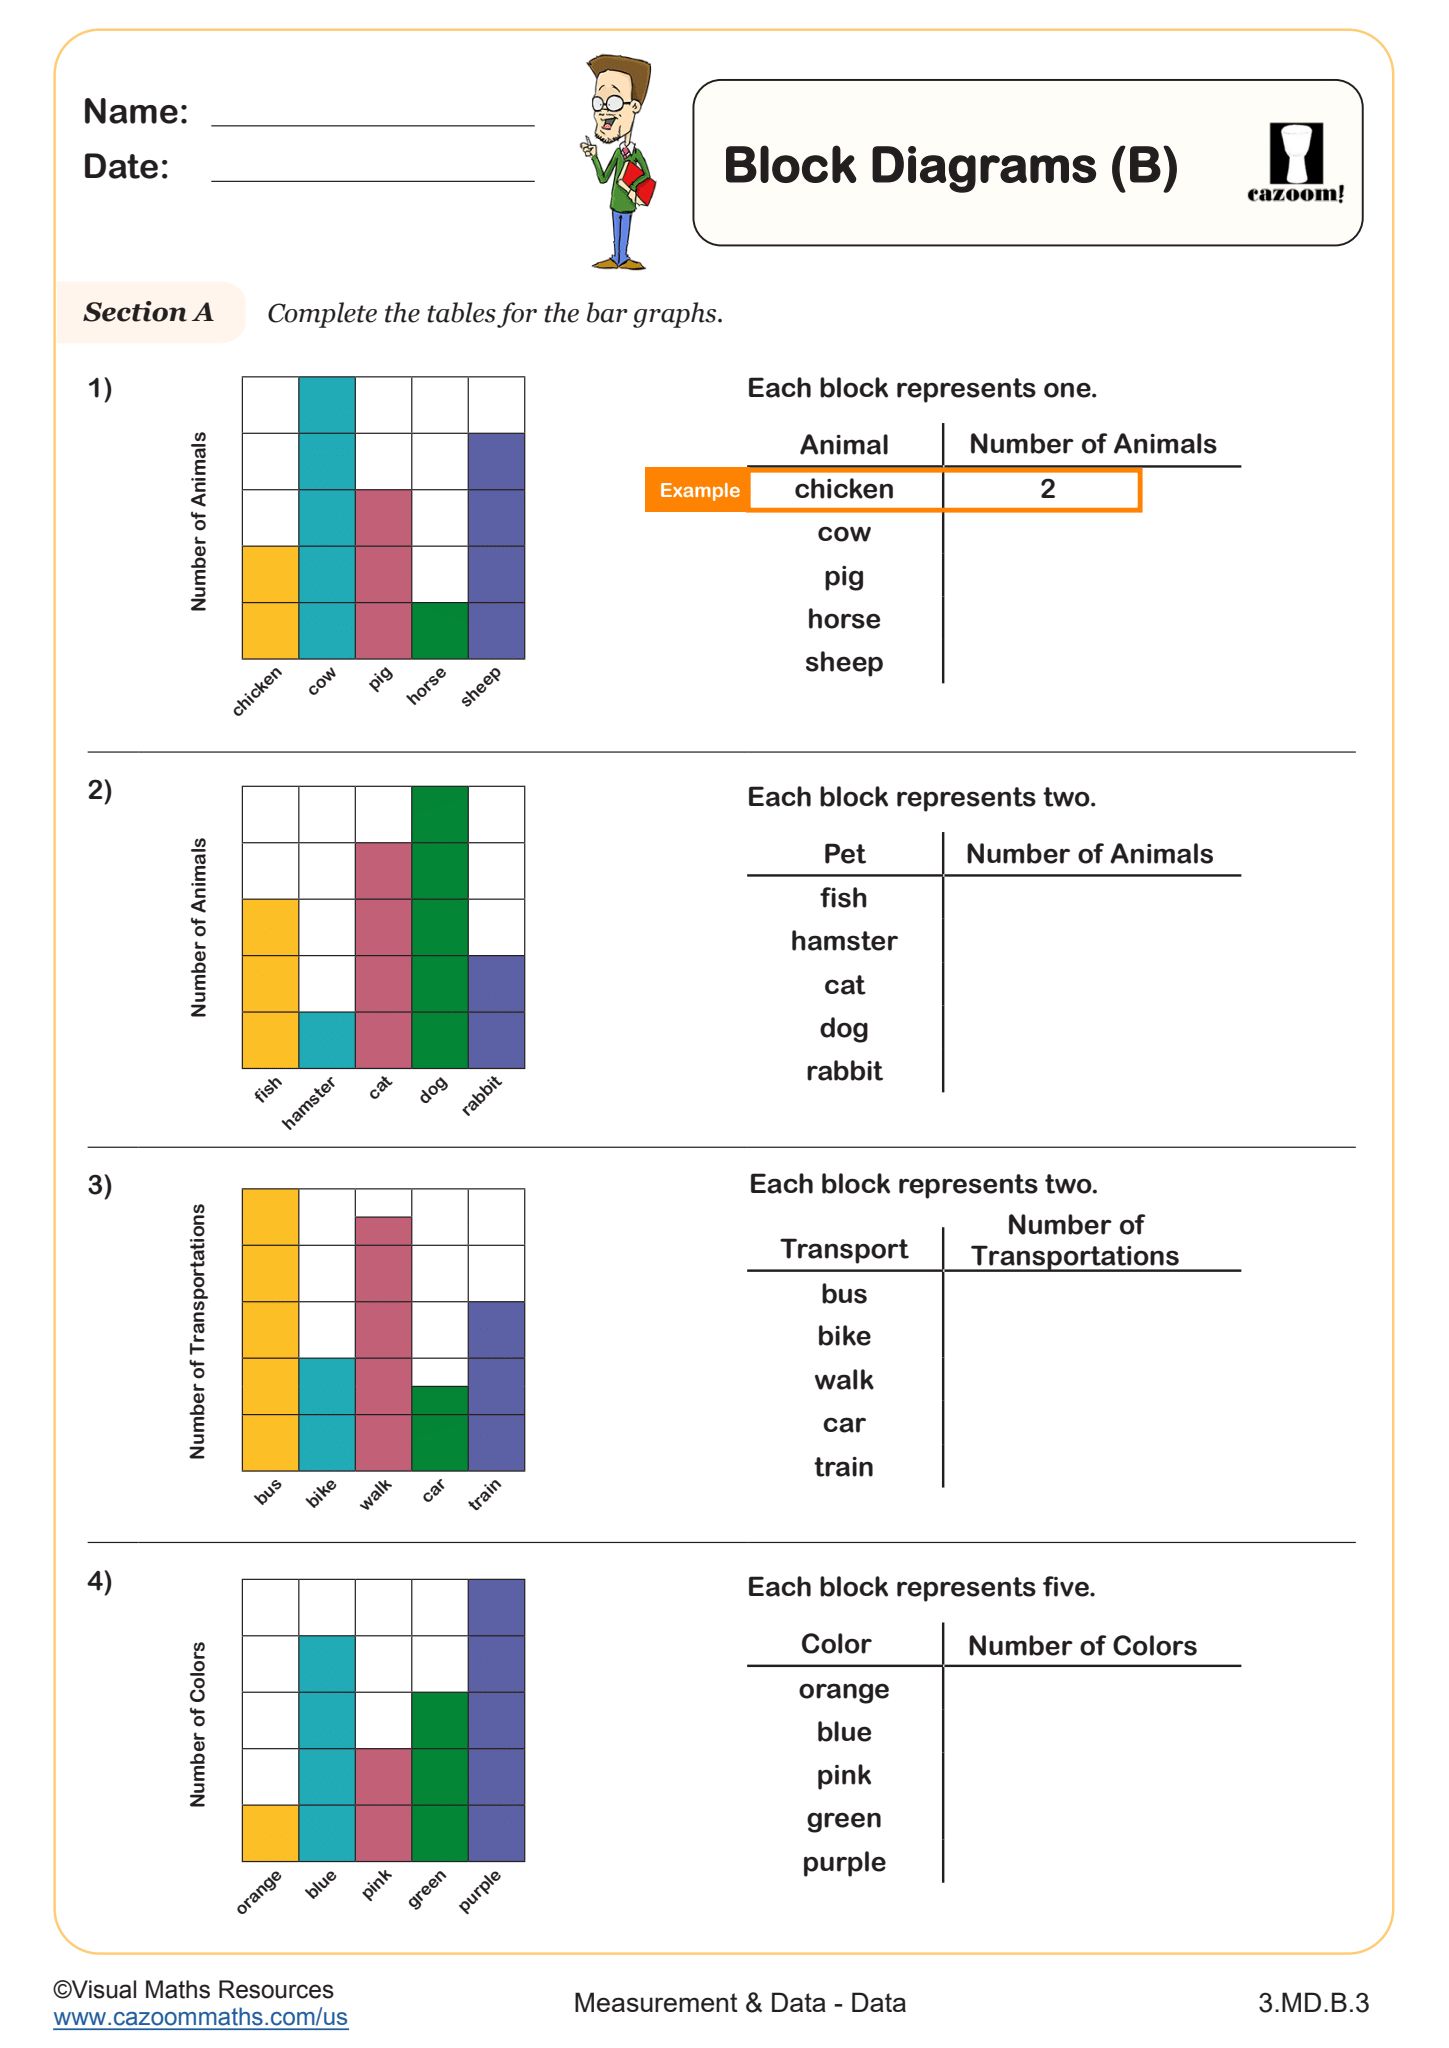
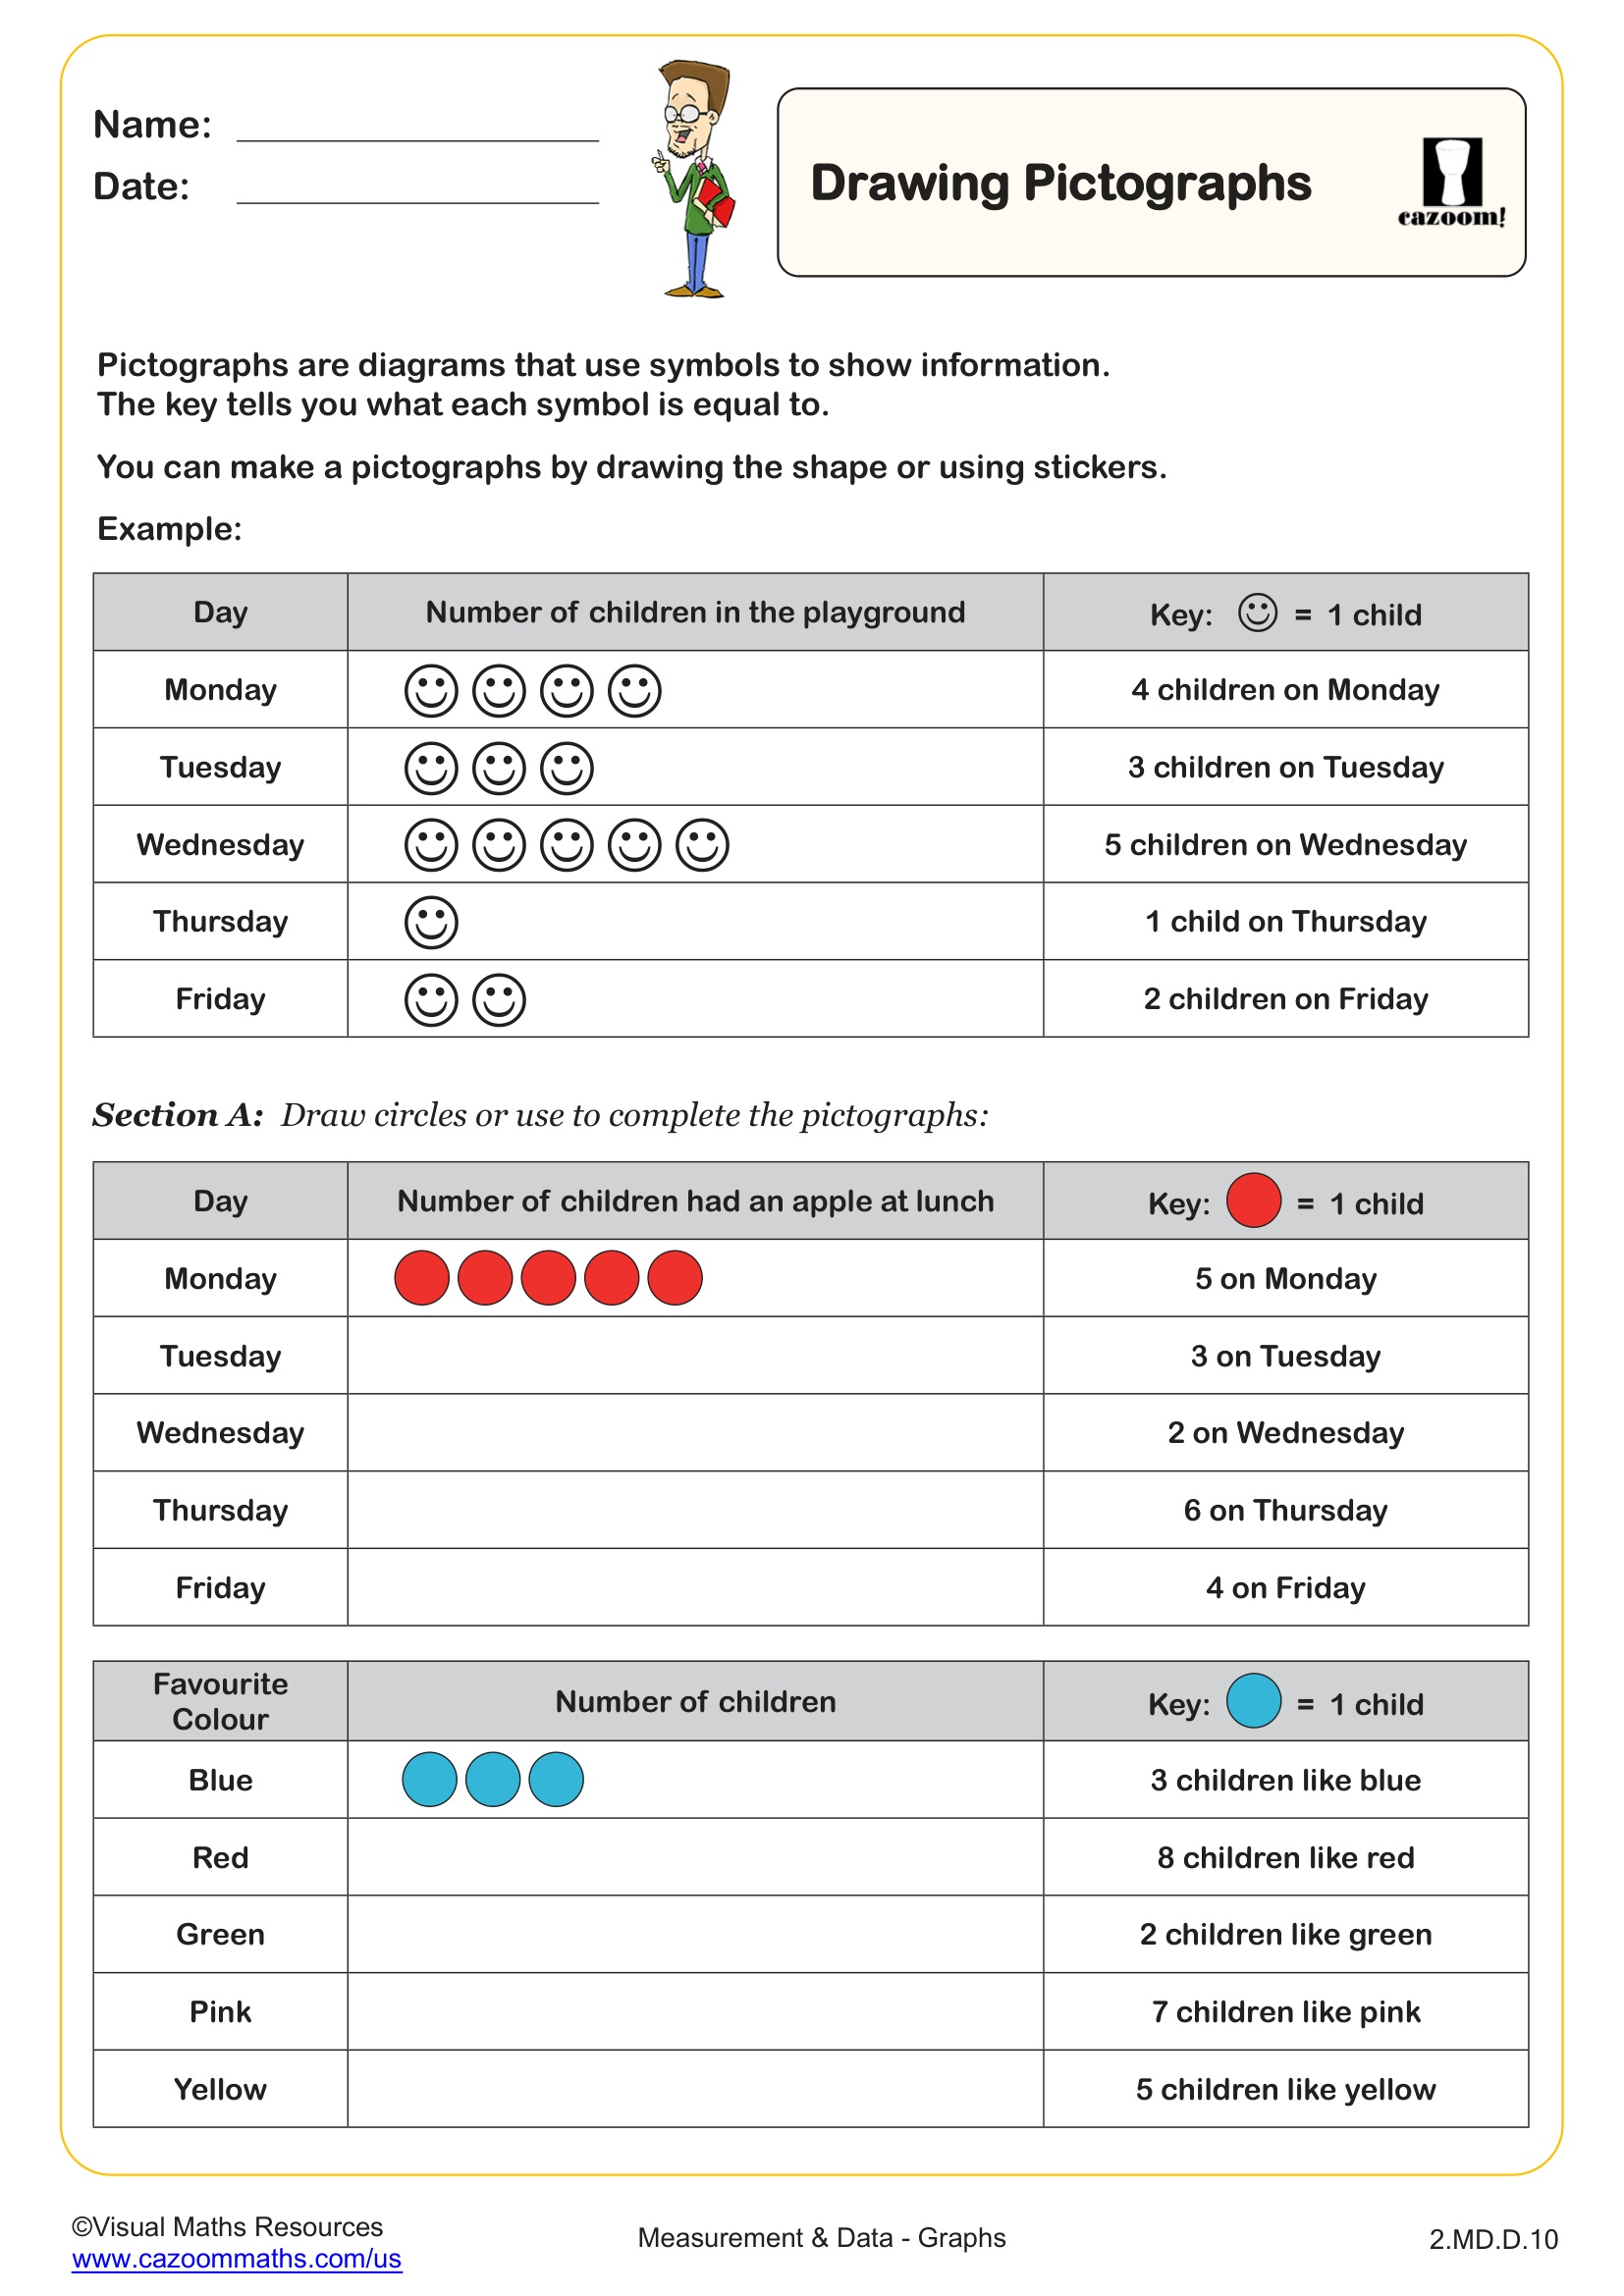
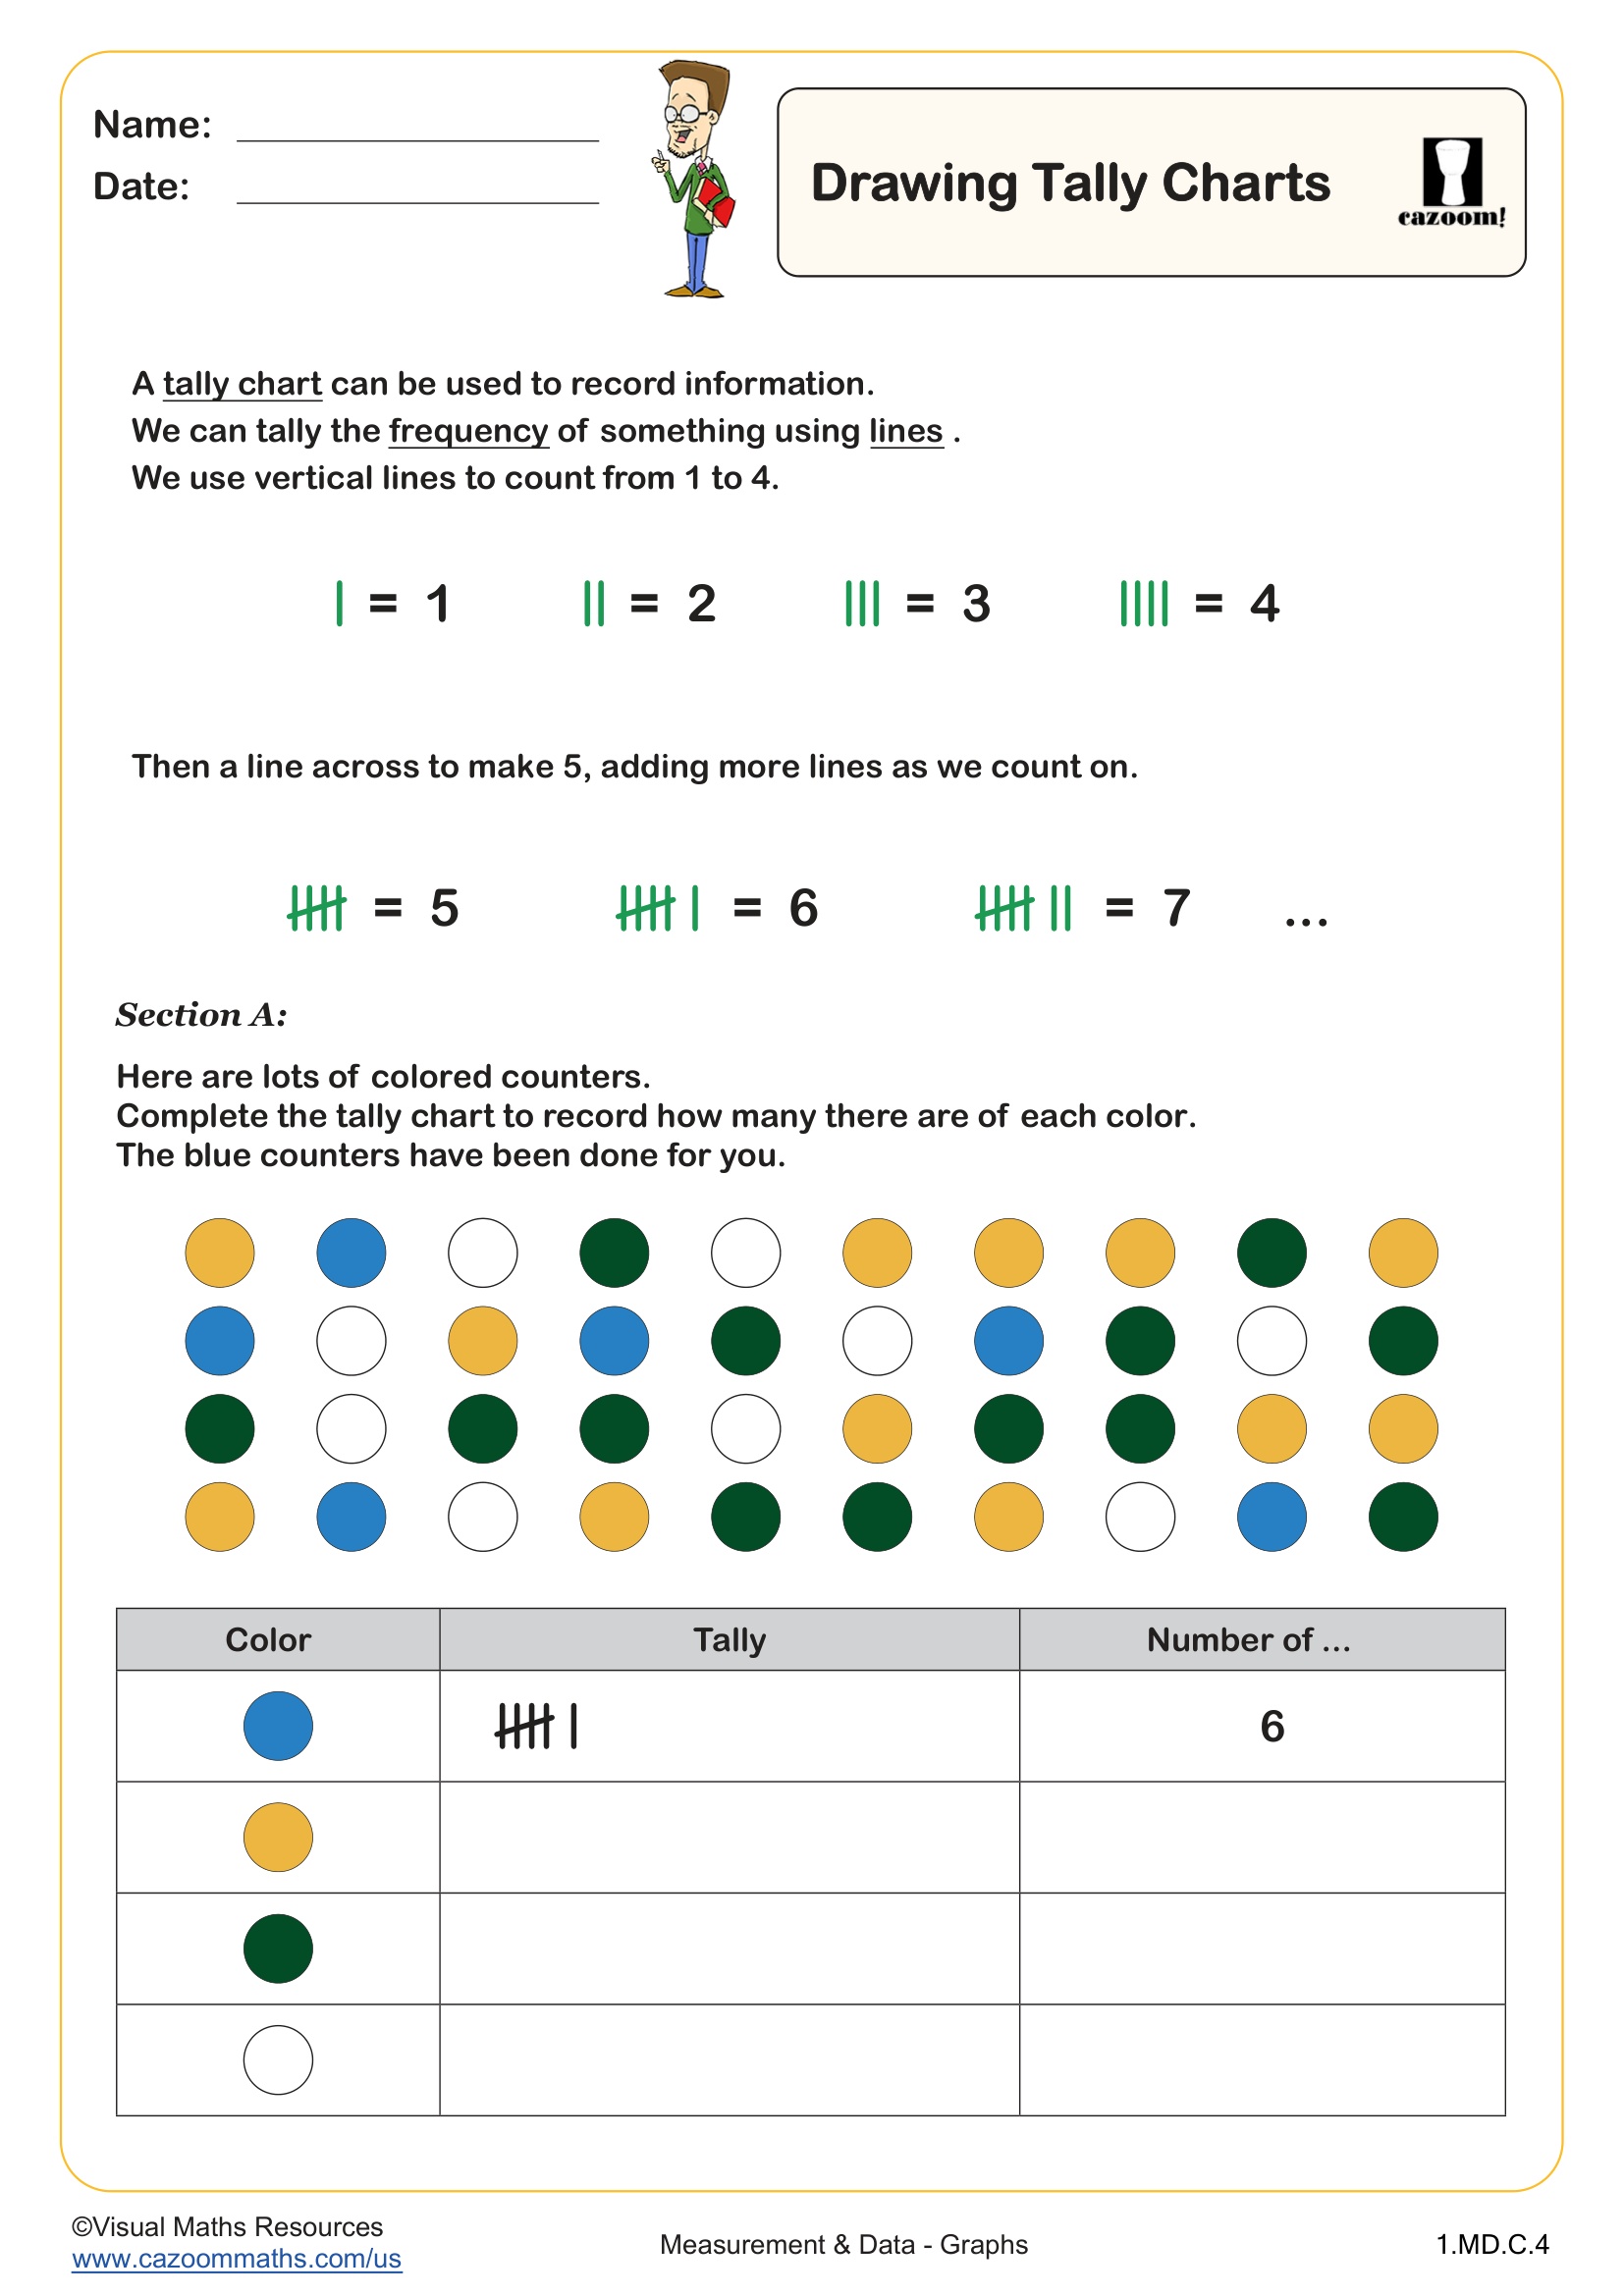
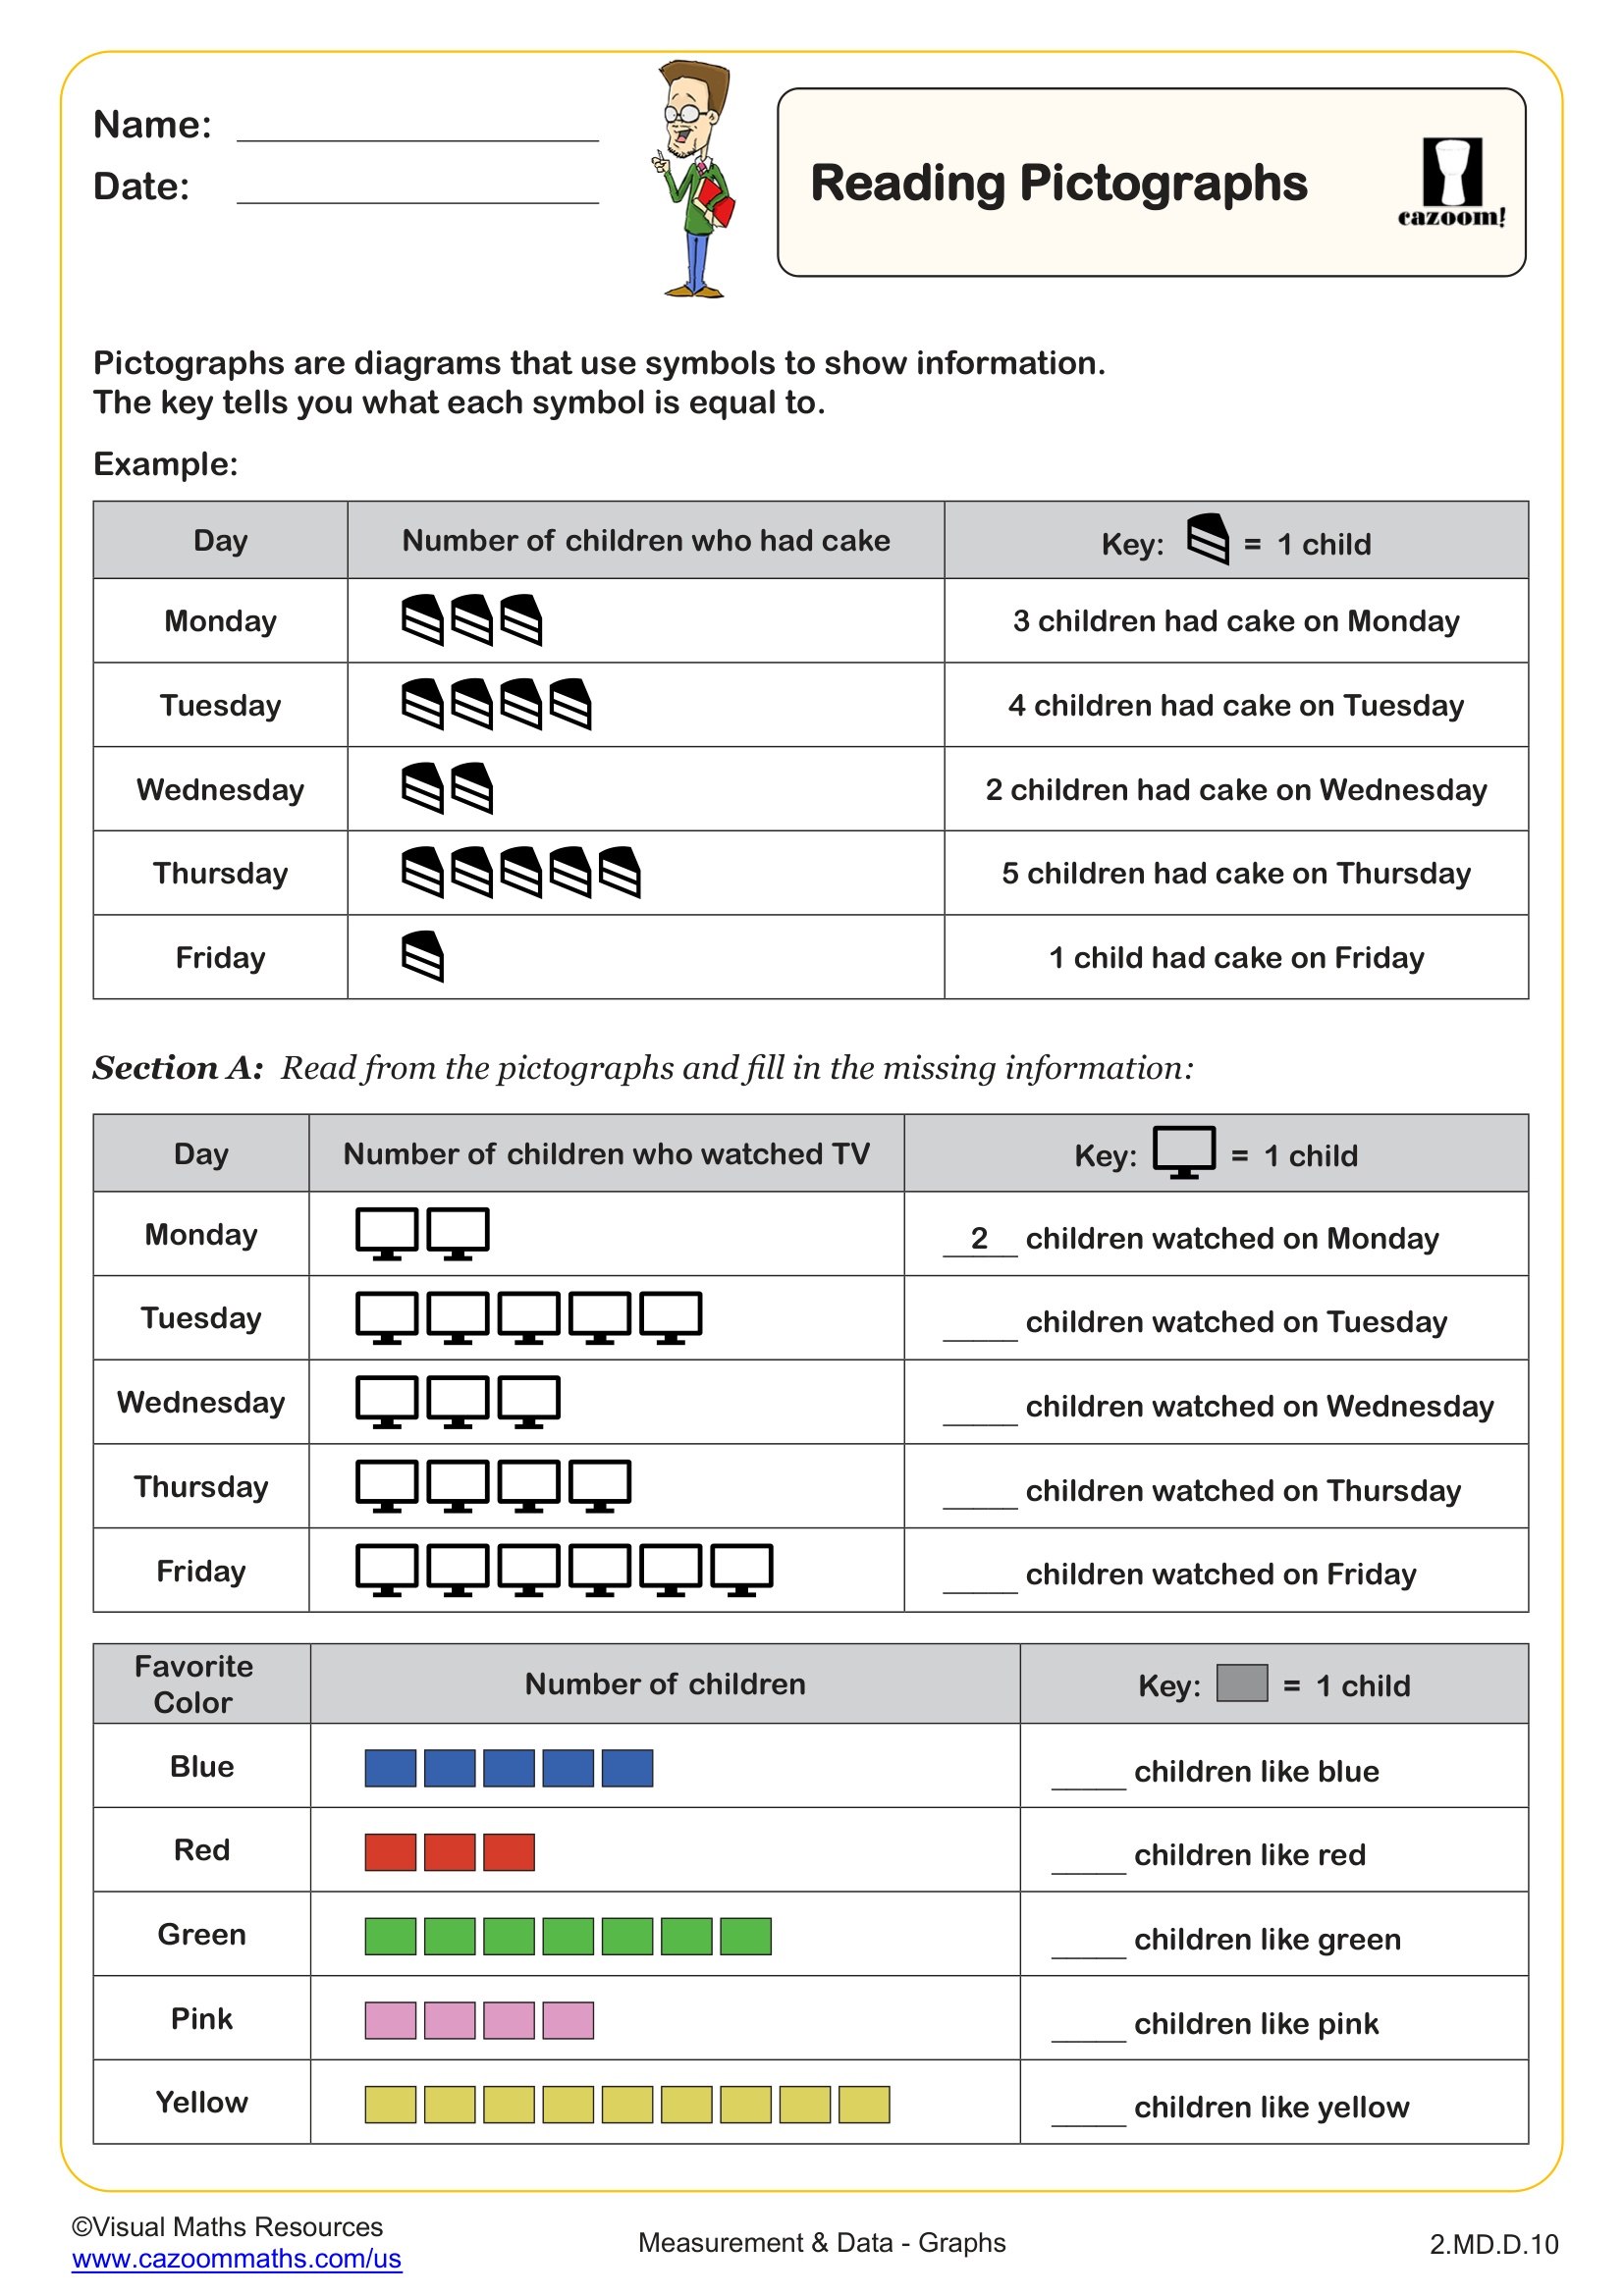
These worksheets cover kindergarten through 5th grade across elementary school. Kindergarten and 1st grade students work with simple pictographs and basic bar graphs using concrete objects or pictures. Second and 3rd grade students progress to reading scaled bar graphs and interpreting data from multiple categories, while 4th and 5th graders analyze more complex graphs, create two-way tables, and determine which graphical representation best fits different data scenarios.
The progression builds systematically from counting objects in picture graphs to analyzing trends across multiple data sets. Teachers notice that students who struggle with skip counting often find scaled bar graphs challenging, since reading graphs with intervals of 2, 5, or 10 requires this foundational skill. By 5th grade, students should confidently choose between bar charts, line plots, and pie charts based on whether data shows categories, changes over time, or parts of a whole.
What Are Two-Way Tables and How Do They Connect to Graphs?
Two-way tables organize data into rows and columns, showing the relationship between two categorical variables simultaneously. For example, a table might display favorite sports across different grade levels, with sports in rows and grades in columns. Students learn to read intersecting cells to find specific information and calculate row or column totals, which prepares them for more advanced statistical thinking in middle school.
This skill connects directly to real-world applications in science and social studies. When students analyze weather patterns by month and location, or compare recycling habits across different classrooms, they're using the same data organization skills scientists employ in research. Teachers frequently see students make the connection between two-way tables and bar graphs when they realize the same data can be represented both ways—the table shows exact numbers while the graph reveals patterns and comparisons visually.
How Can Teachers Use These Worksheets in the Classroom?
The worksheets provide scaffolded practice starting with interpreting existing graphs before moving to creating original representations. Students work through reading data from axes and keys, answering questions about quantities and comparisons, then advance to constructing their own graphs from given data sets. The answer keys let teachers quickly identify whether students struggle with reading scales, choosing appropriate intervals, or understanding what different graph types communicate.
These worksheets work well for math centers where students practice at their level, for homework to reinforce classroom instruction, or as formative assessments before unit tests. Many teachers use them during small group instruction to address specific gaps—students who misread scales benefit from focused practice with the bar graph worksheets, while those ready for challenge can explore choosing between multiple graphical representations. Paired work encourages mathematical discussion as students explain their reasoning for selecting particular graph types or interpreting data patterns.