High School Histograms and Frequency Polygon Worksheets
All worksheets are created by the team of experienced teachers at Cazoom Math.
Boost Test Performance With Ready-to-Print High School Frequency Polygons and Histograms Worksheets.
These worksheets expand middle school graphing skills into advanced statistical representations. Students transition from simple bar charts to understanding continuous data distributions and frequency density. They discover patterns in data that basic graphs cannot reveal.
Regular practice with these visualization techniques prepares students for calculus and college-level statistics. Working through varied problems develops fluency in selecting appropriate graphs for different data types. This foundation directly supports AP Statistics coursework and future studies in data science.
Topic Coverage: What Cazoom Math High School Measurement and Data Resources Cover
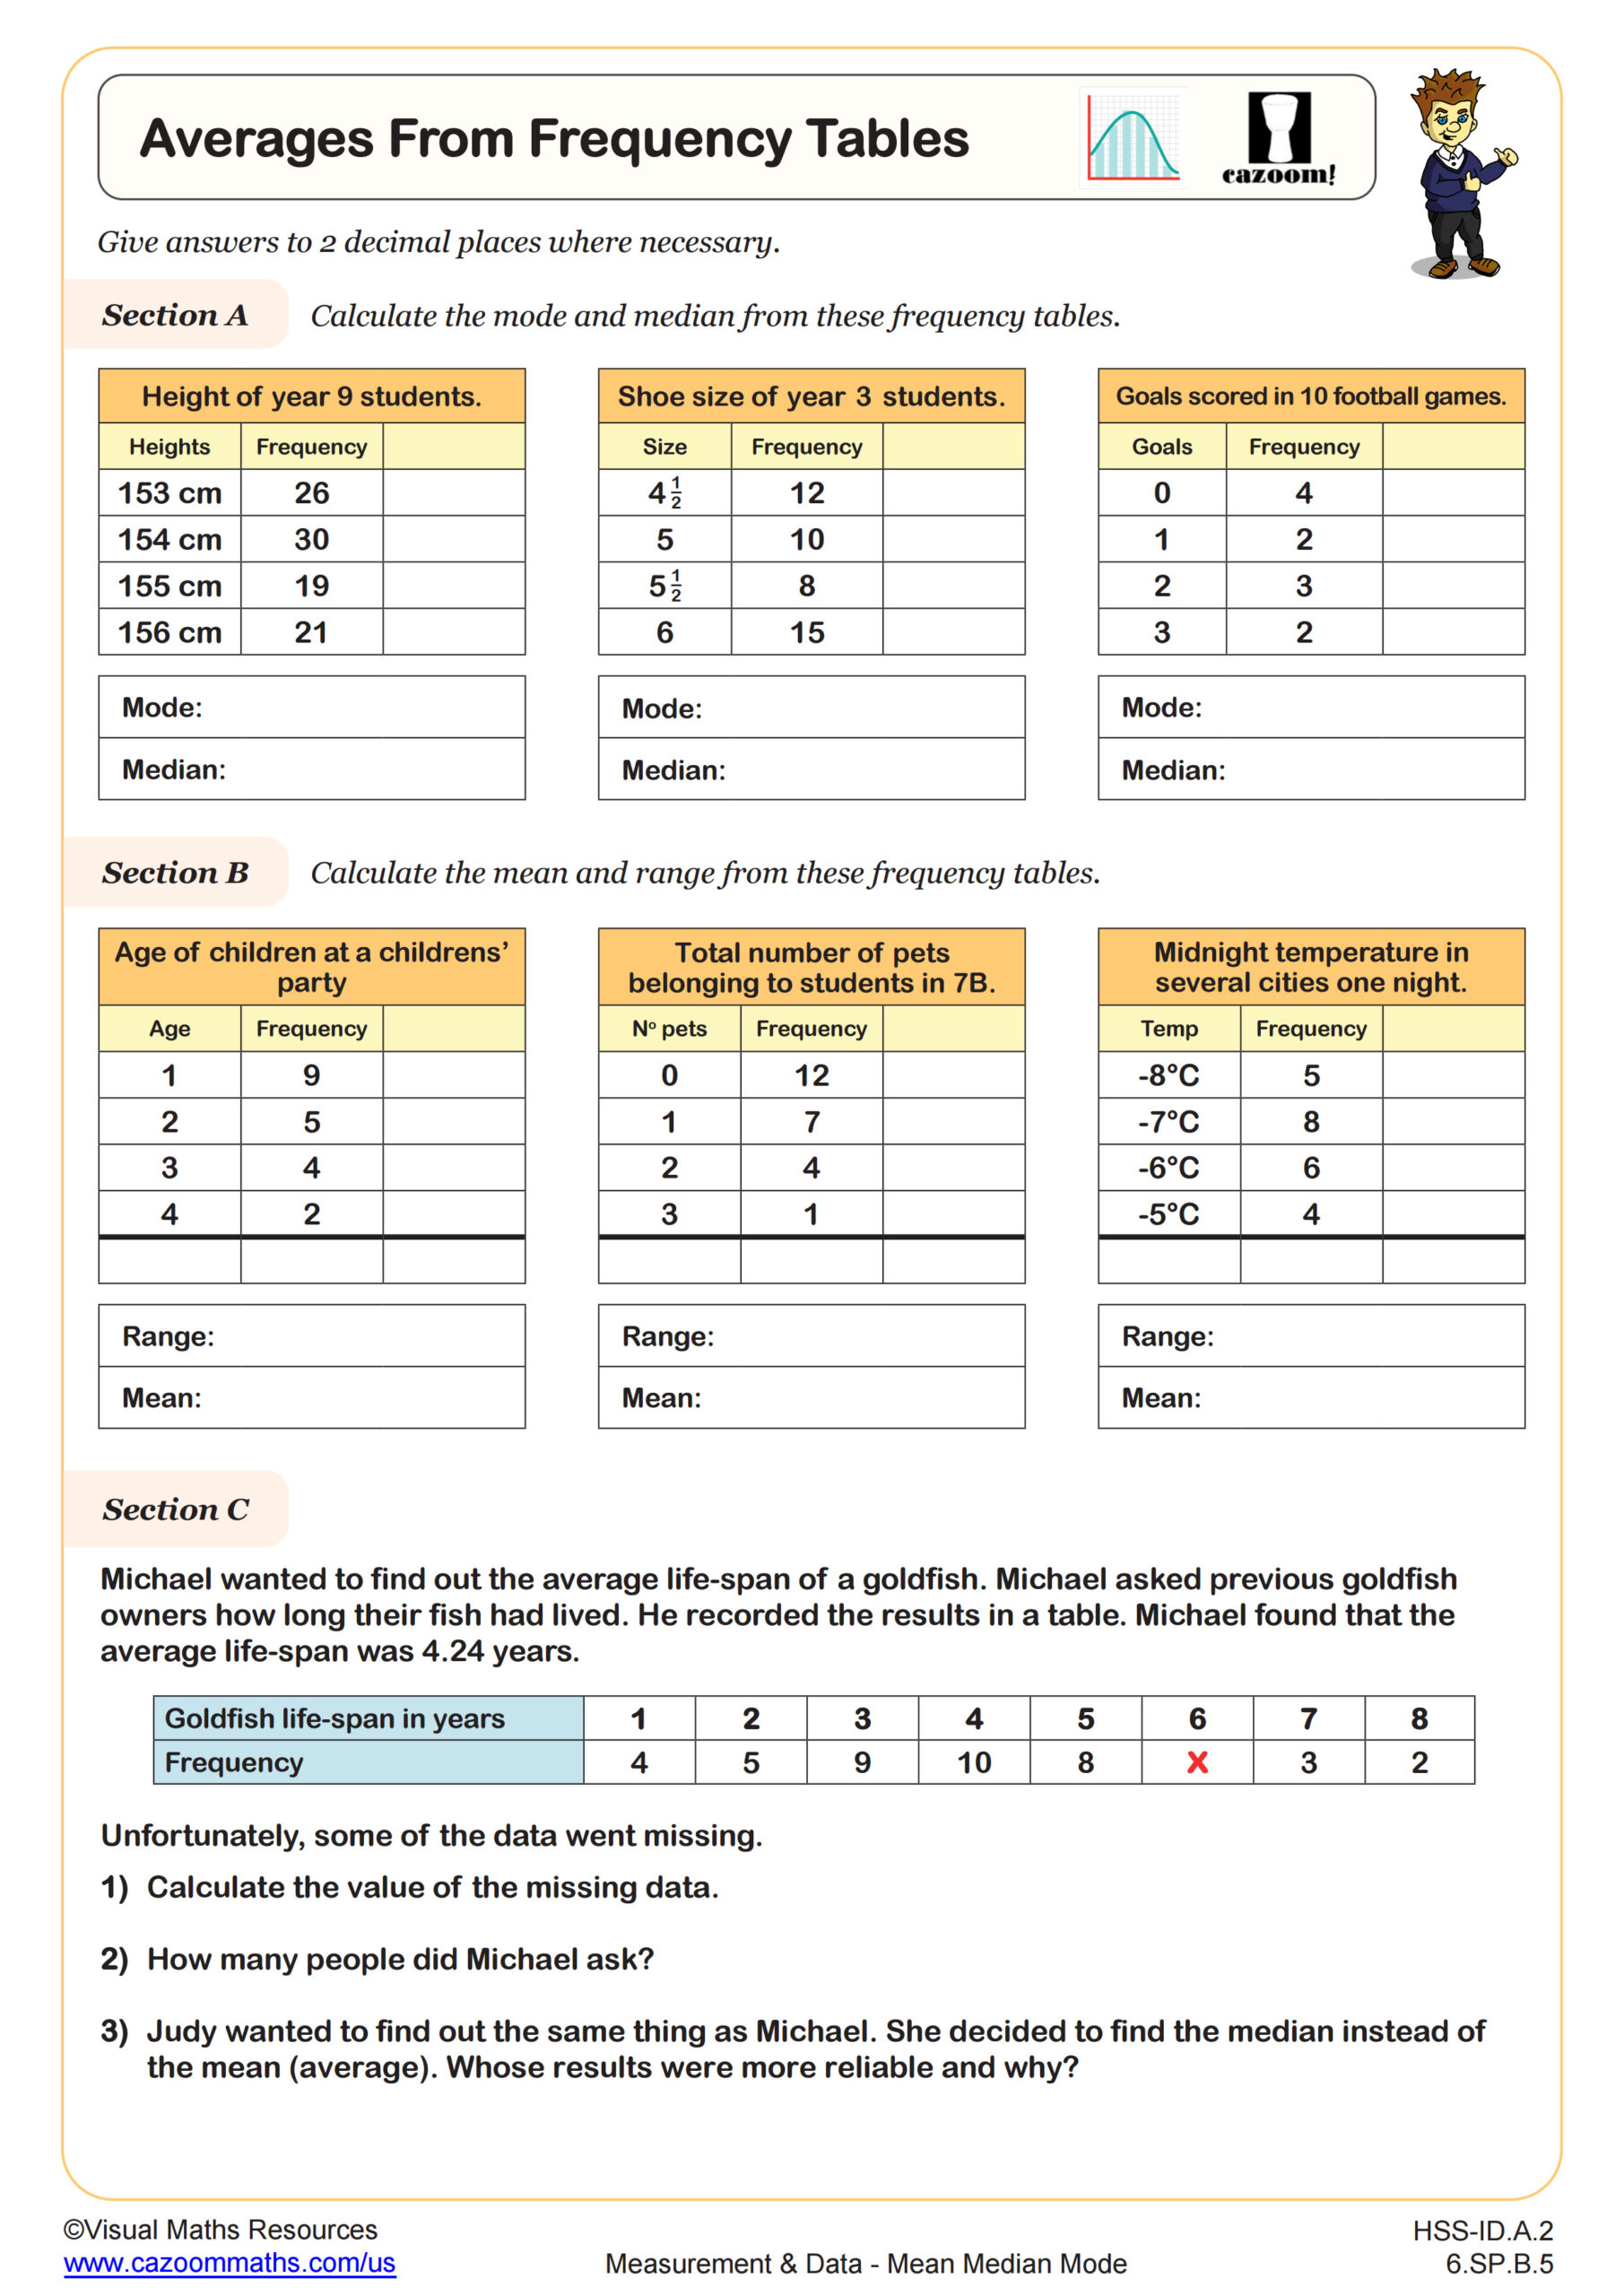
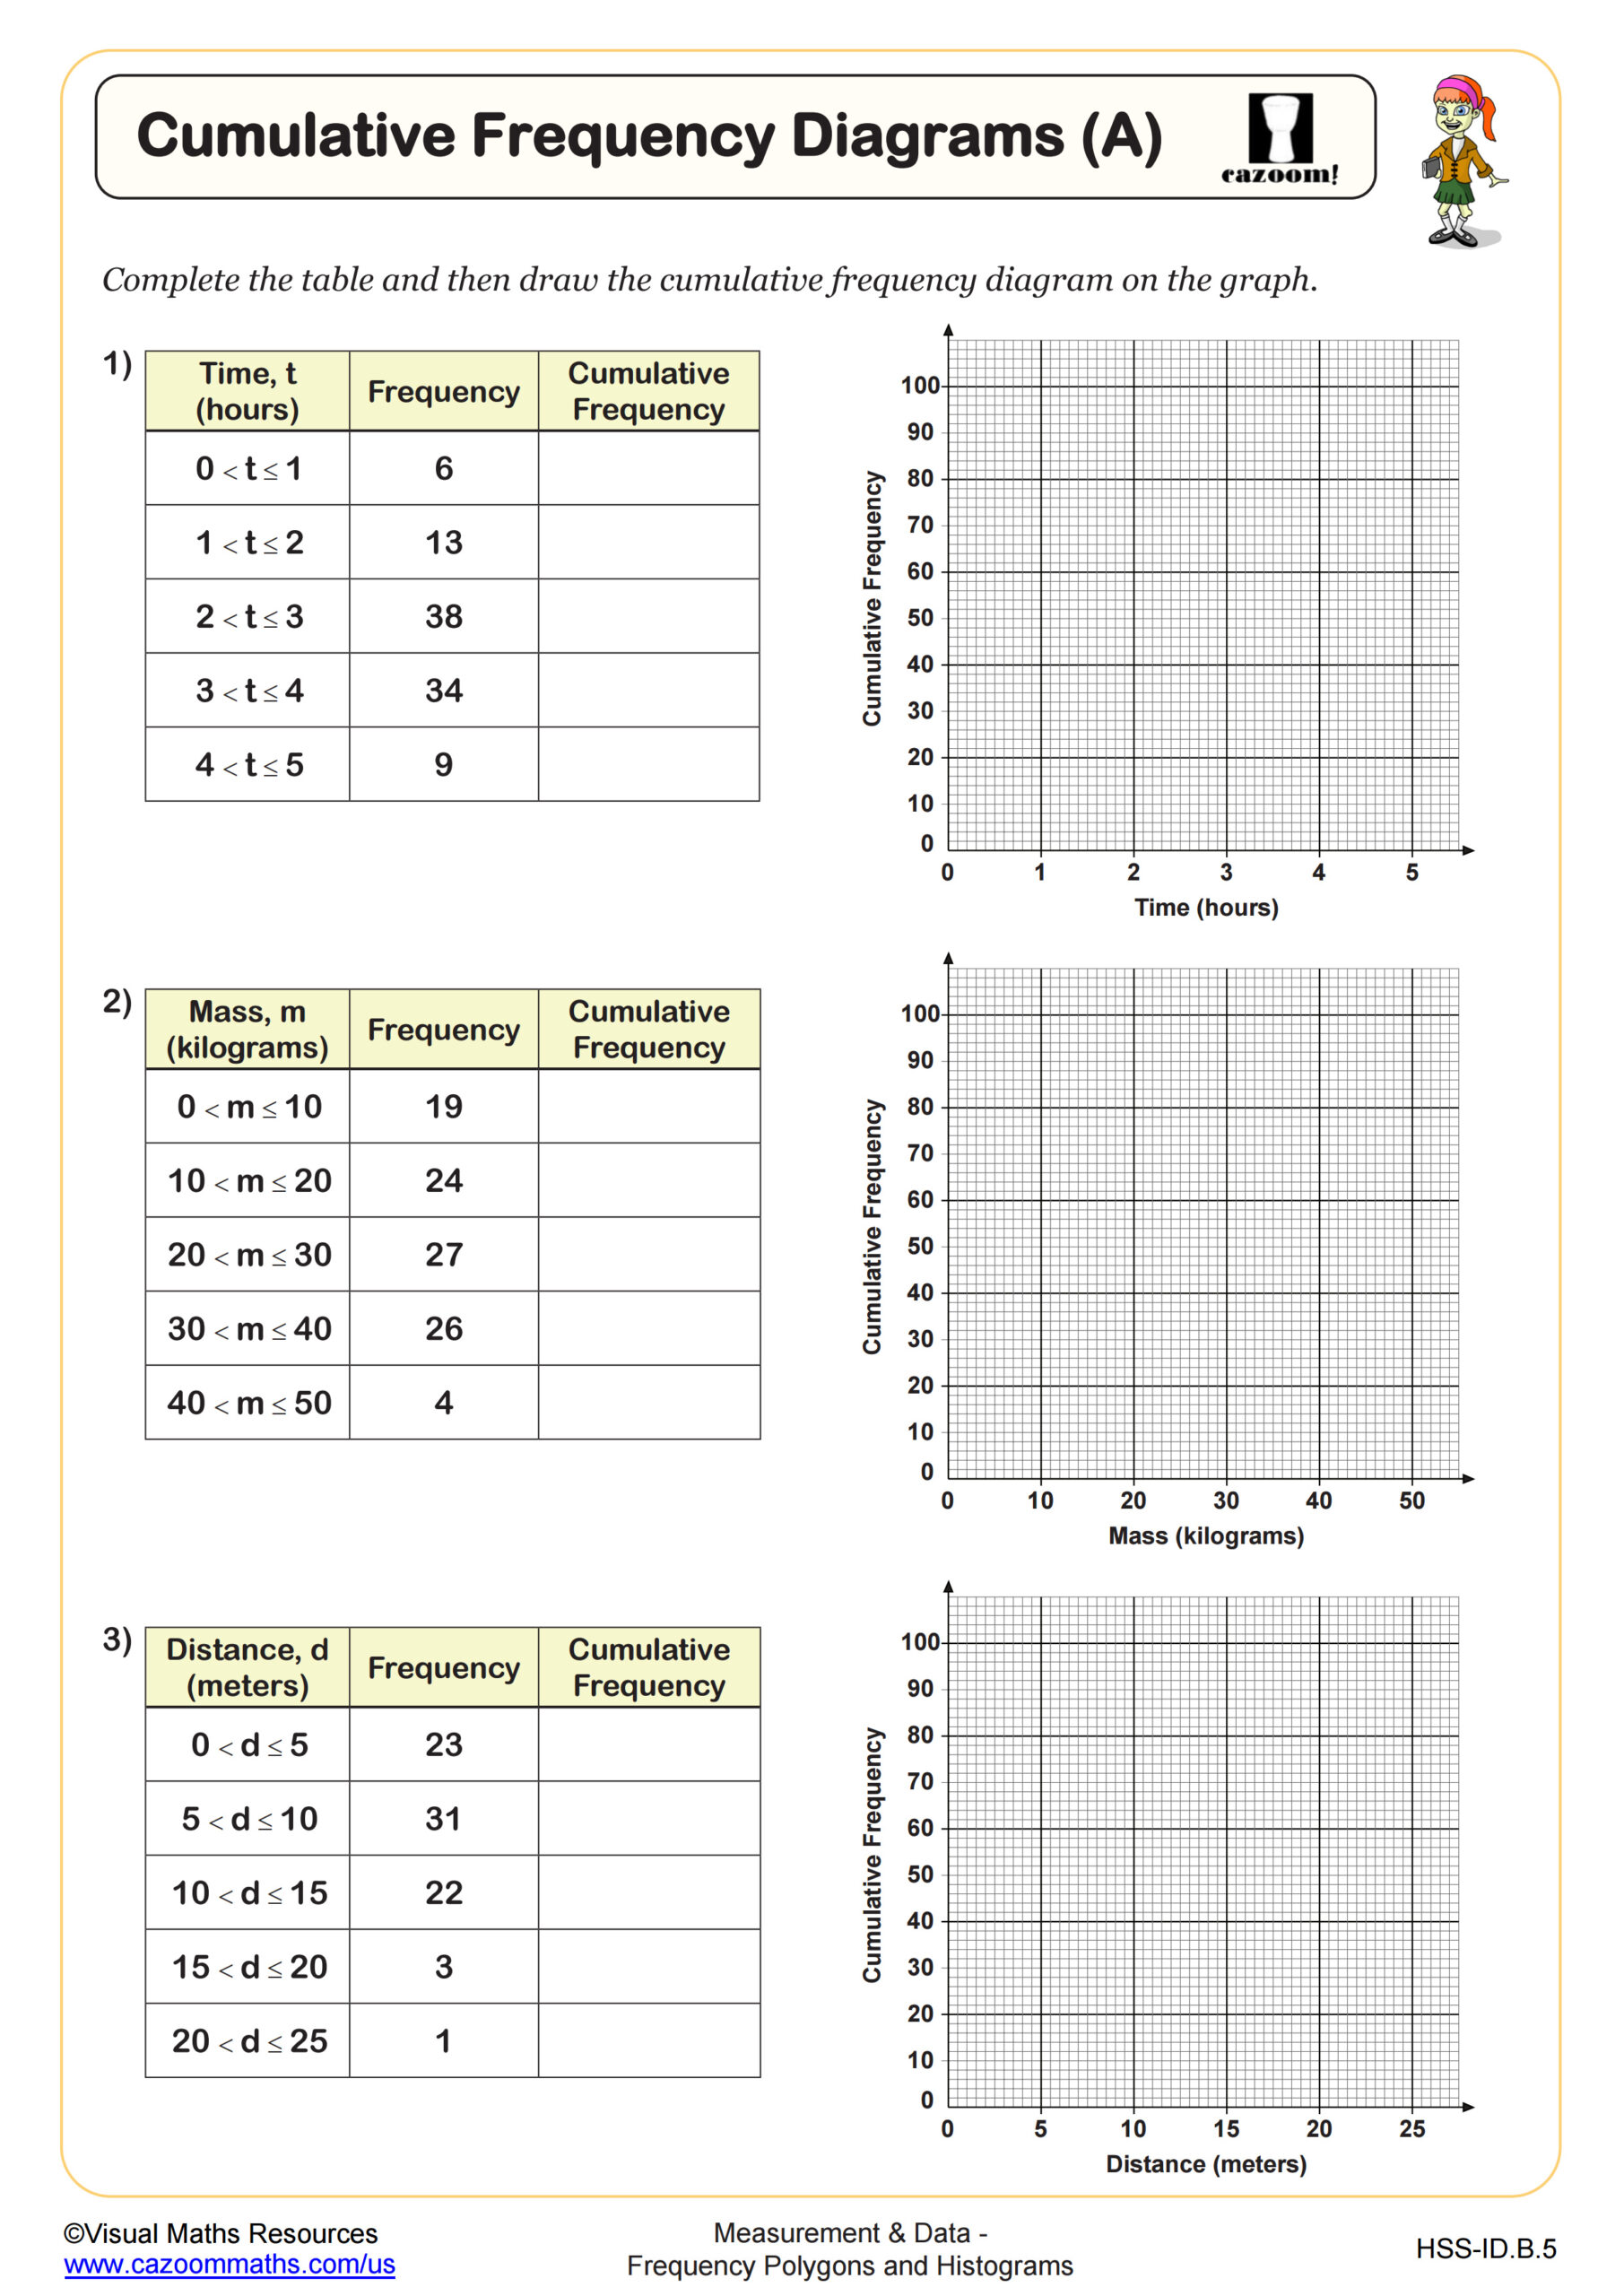
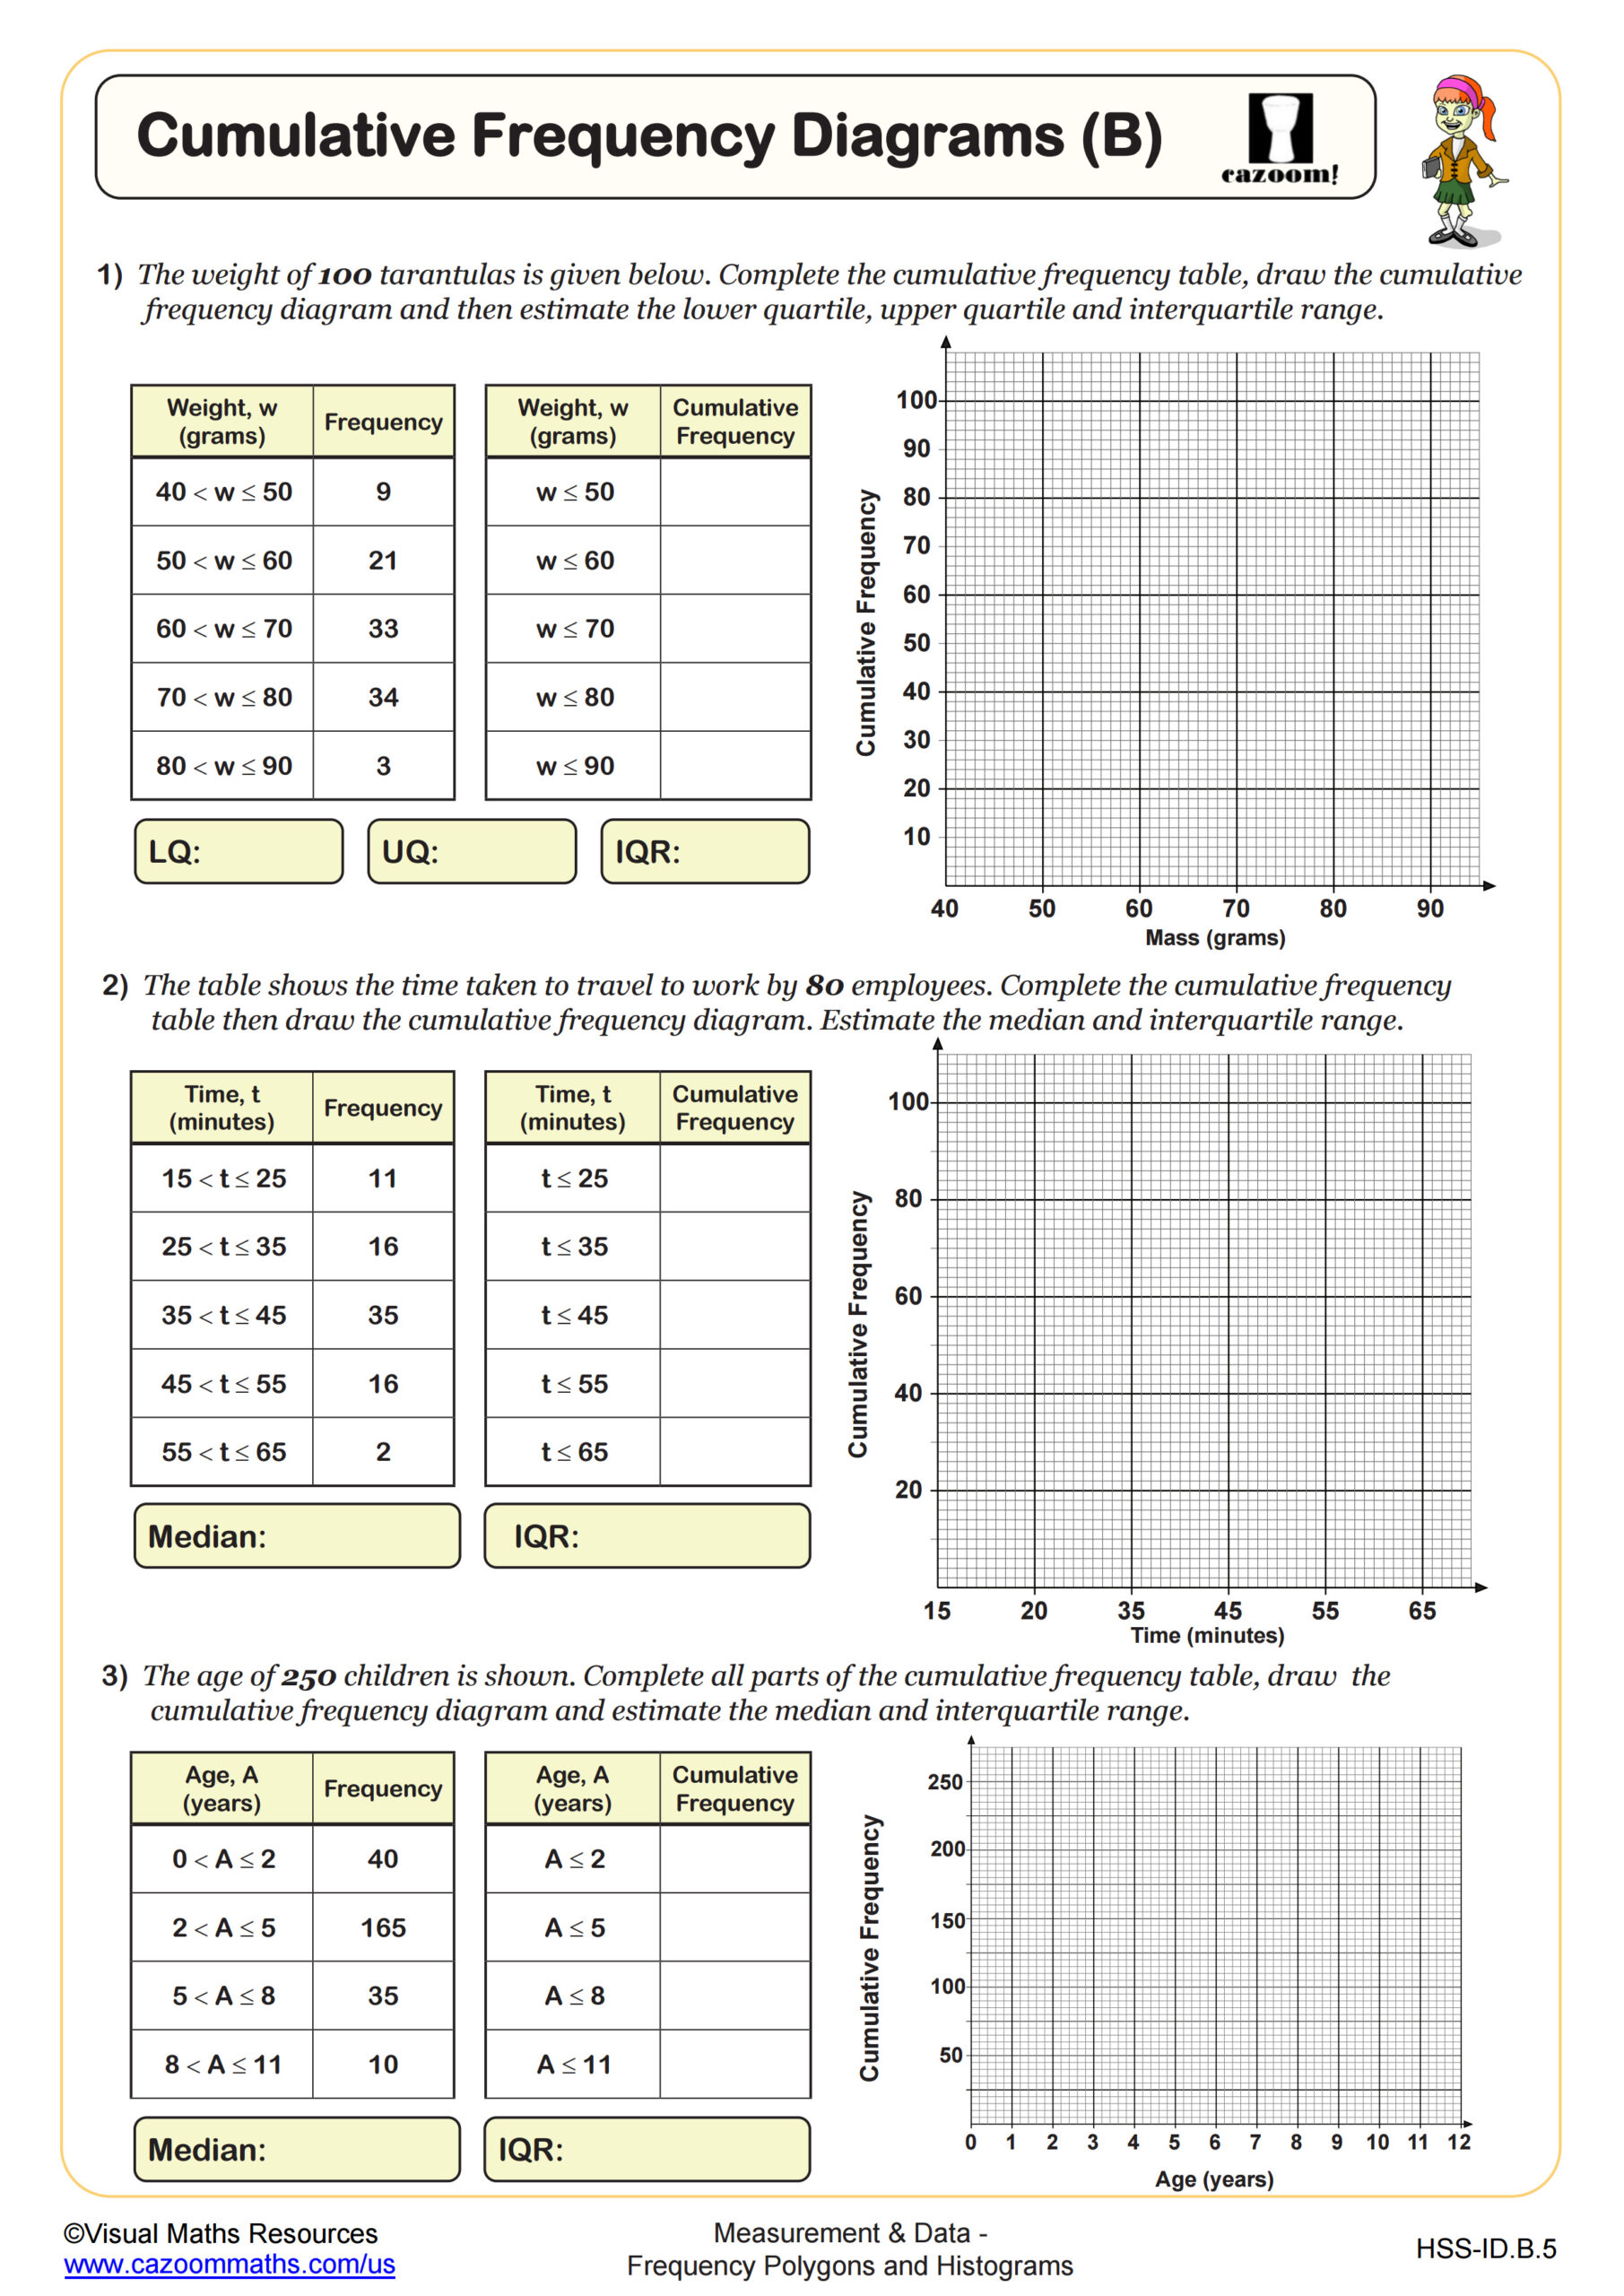
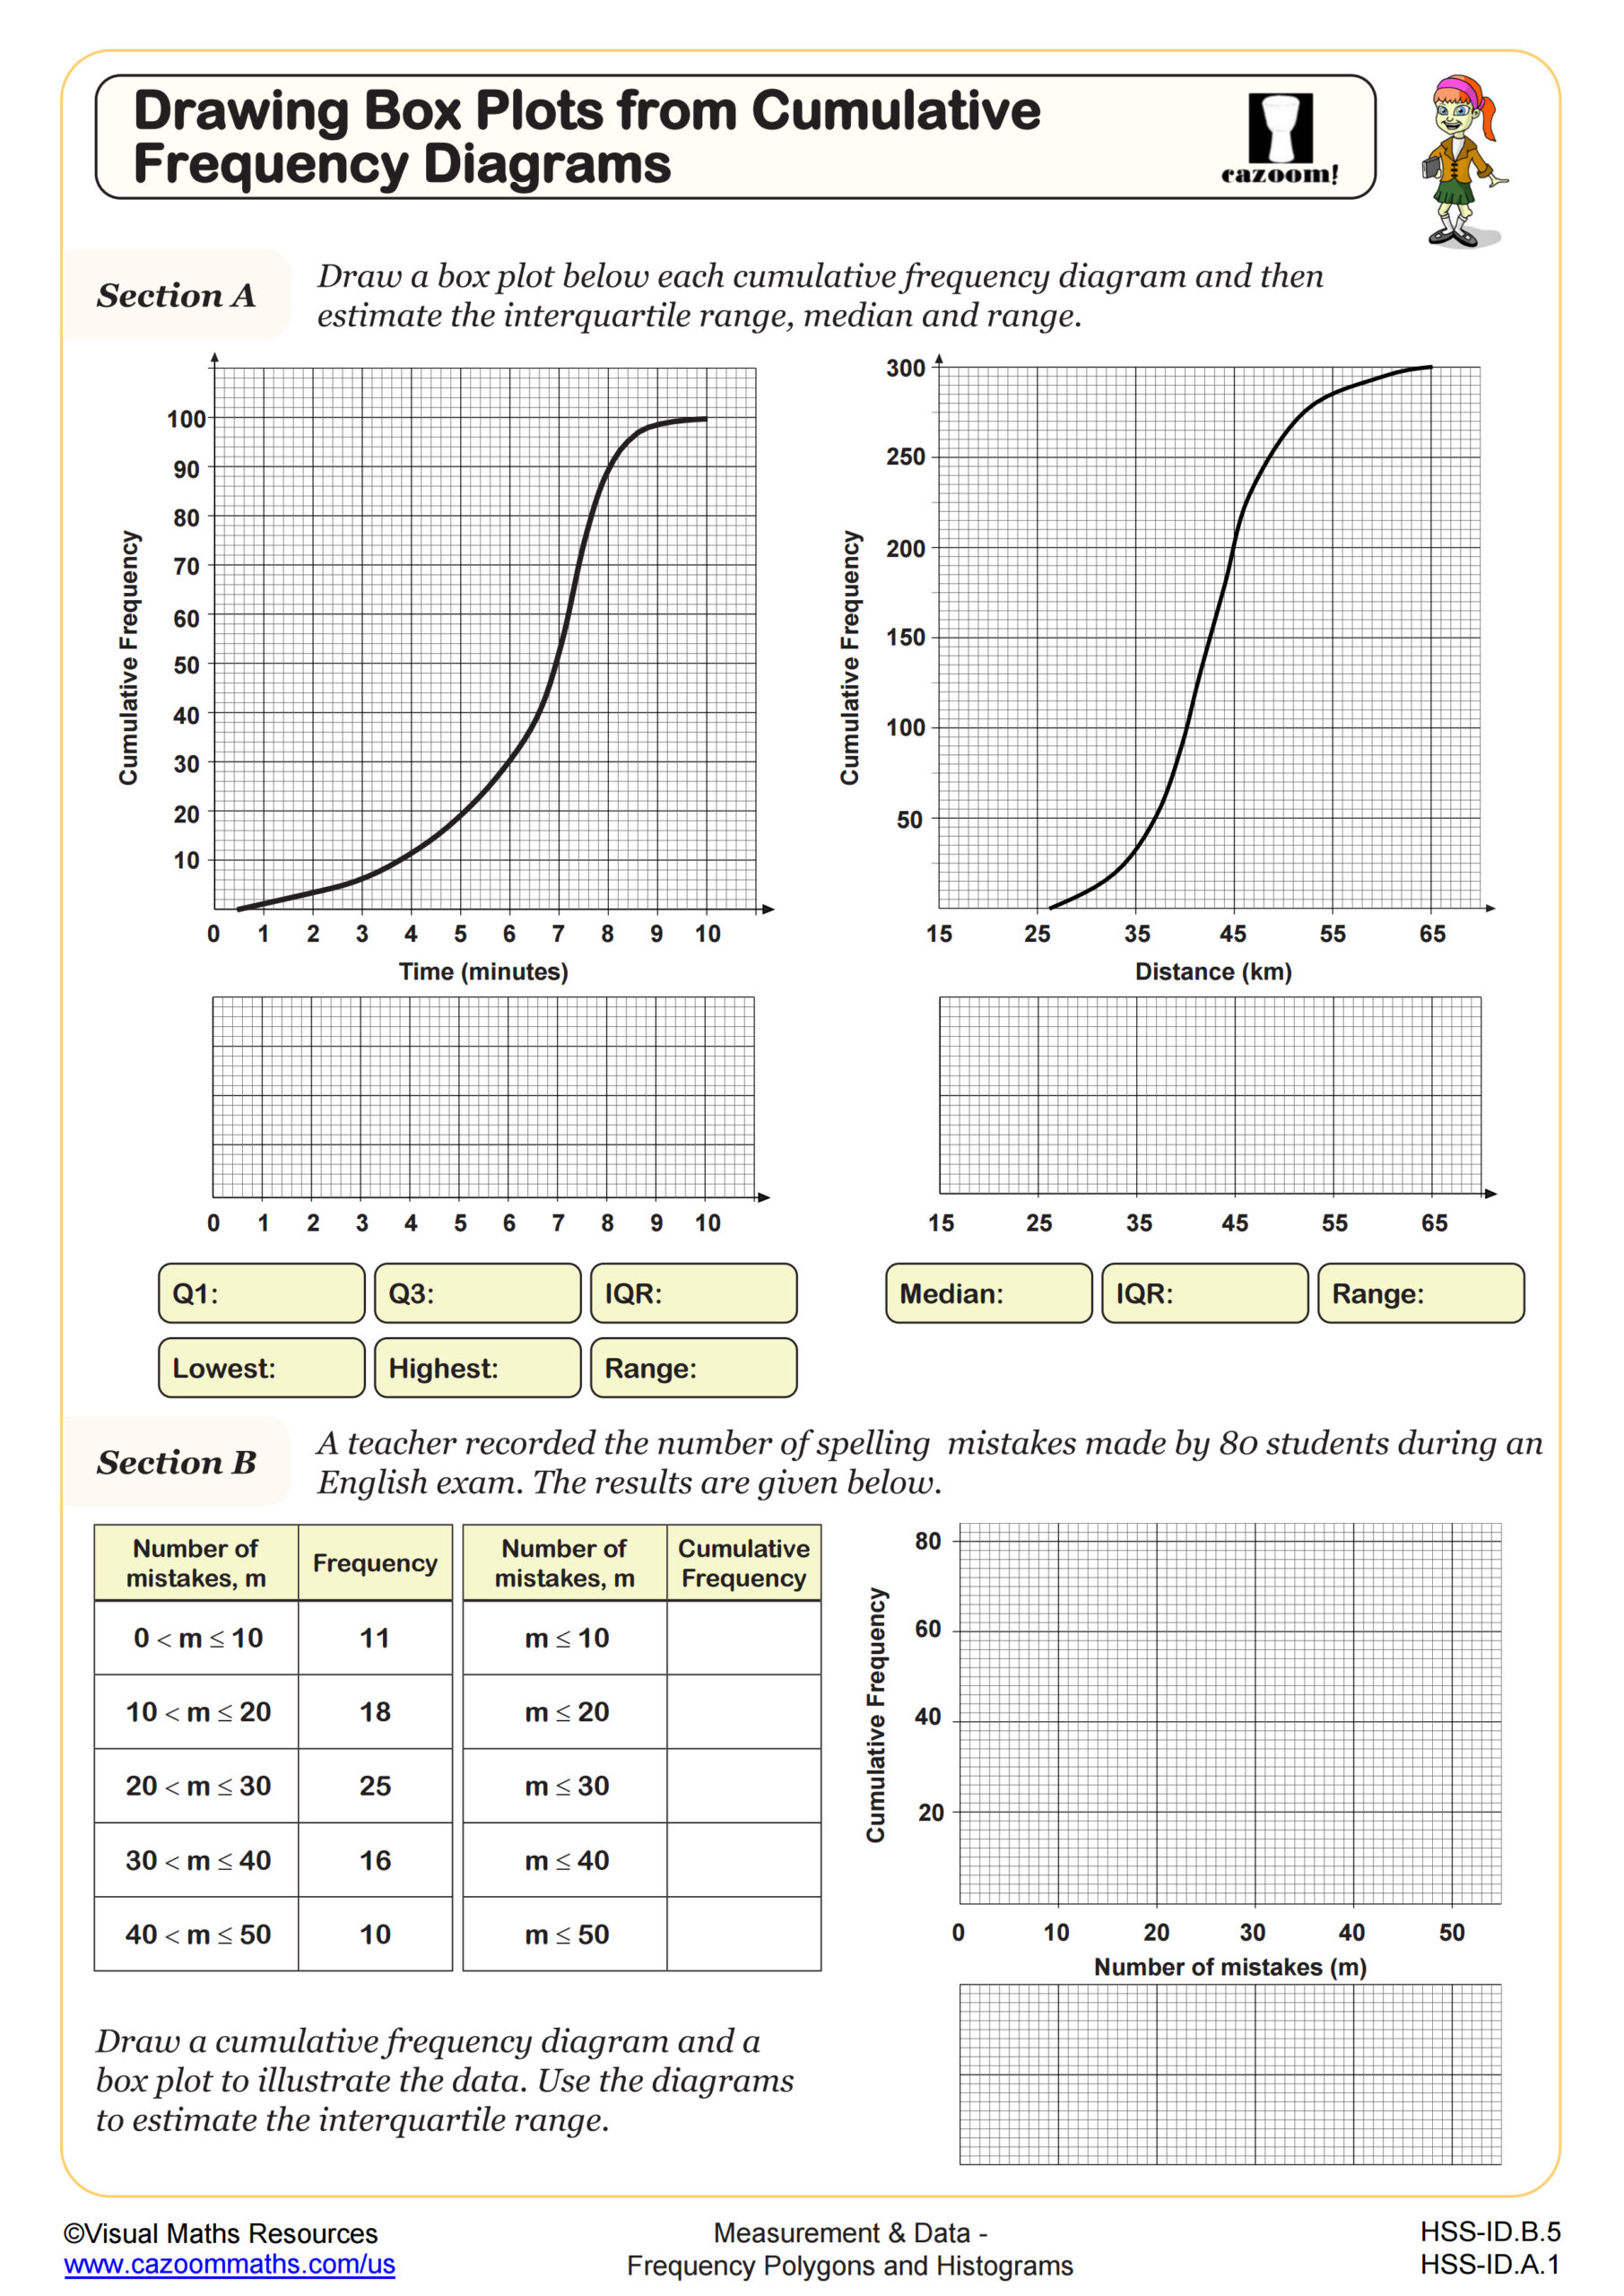
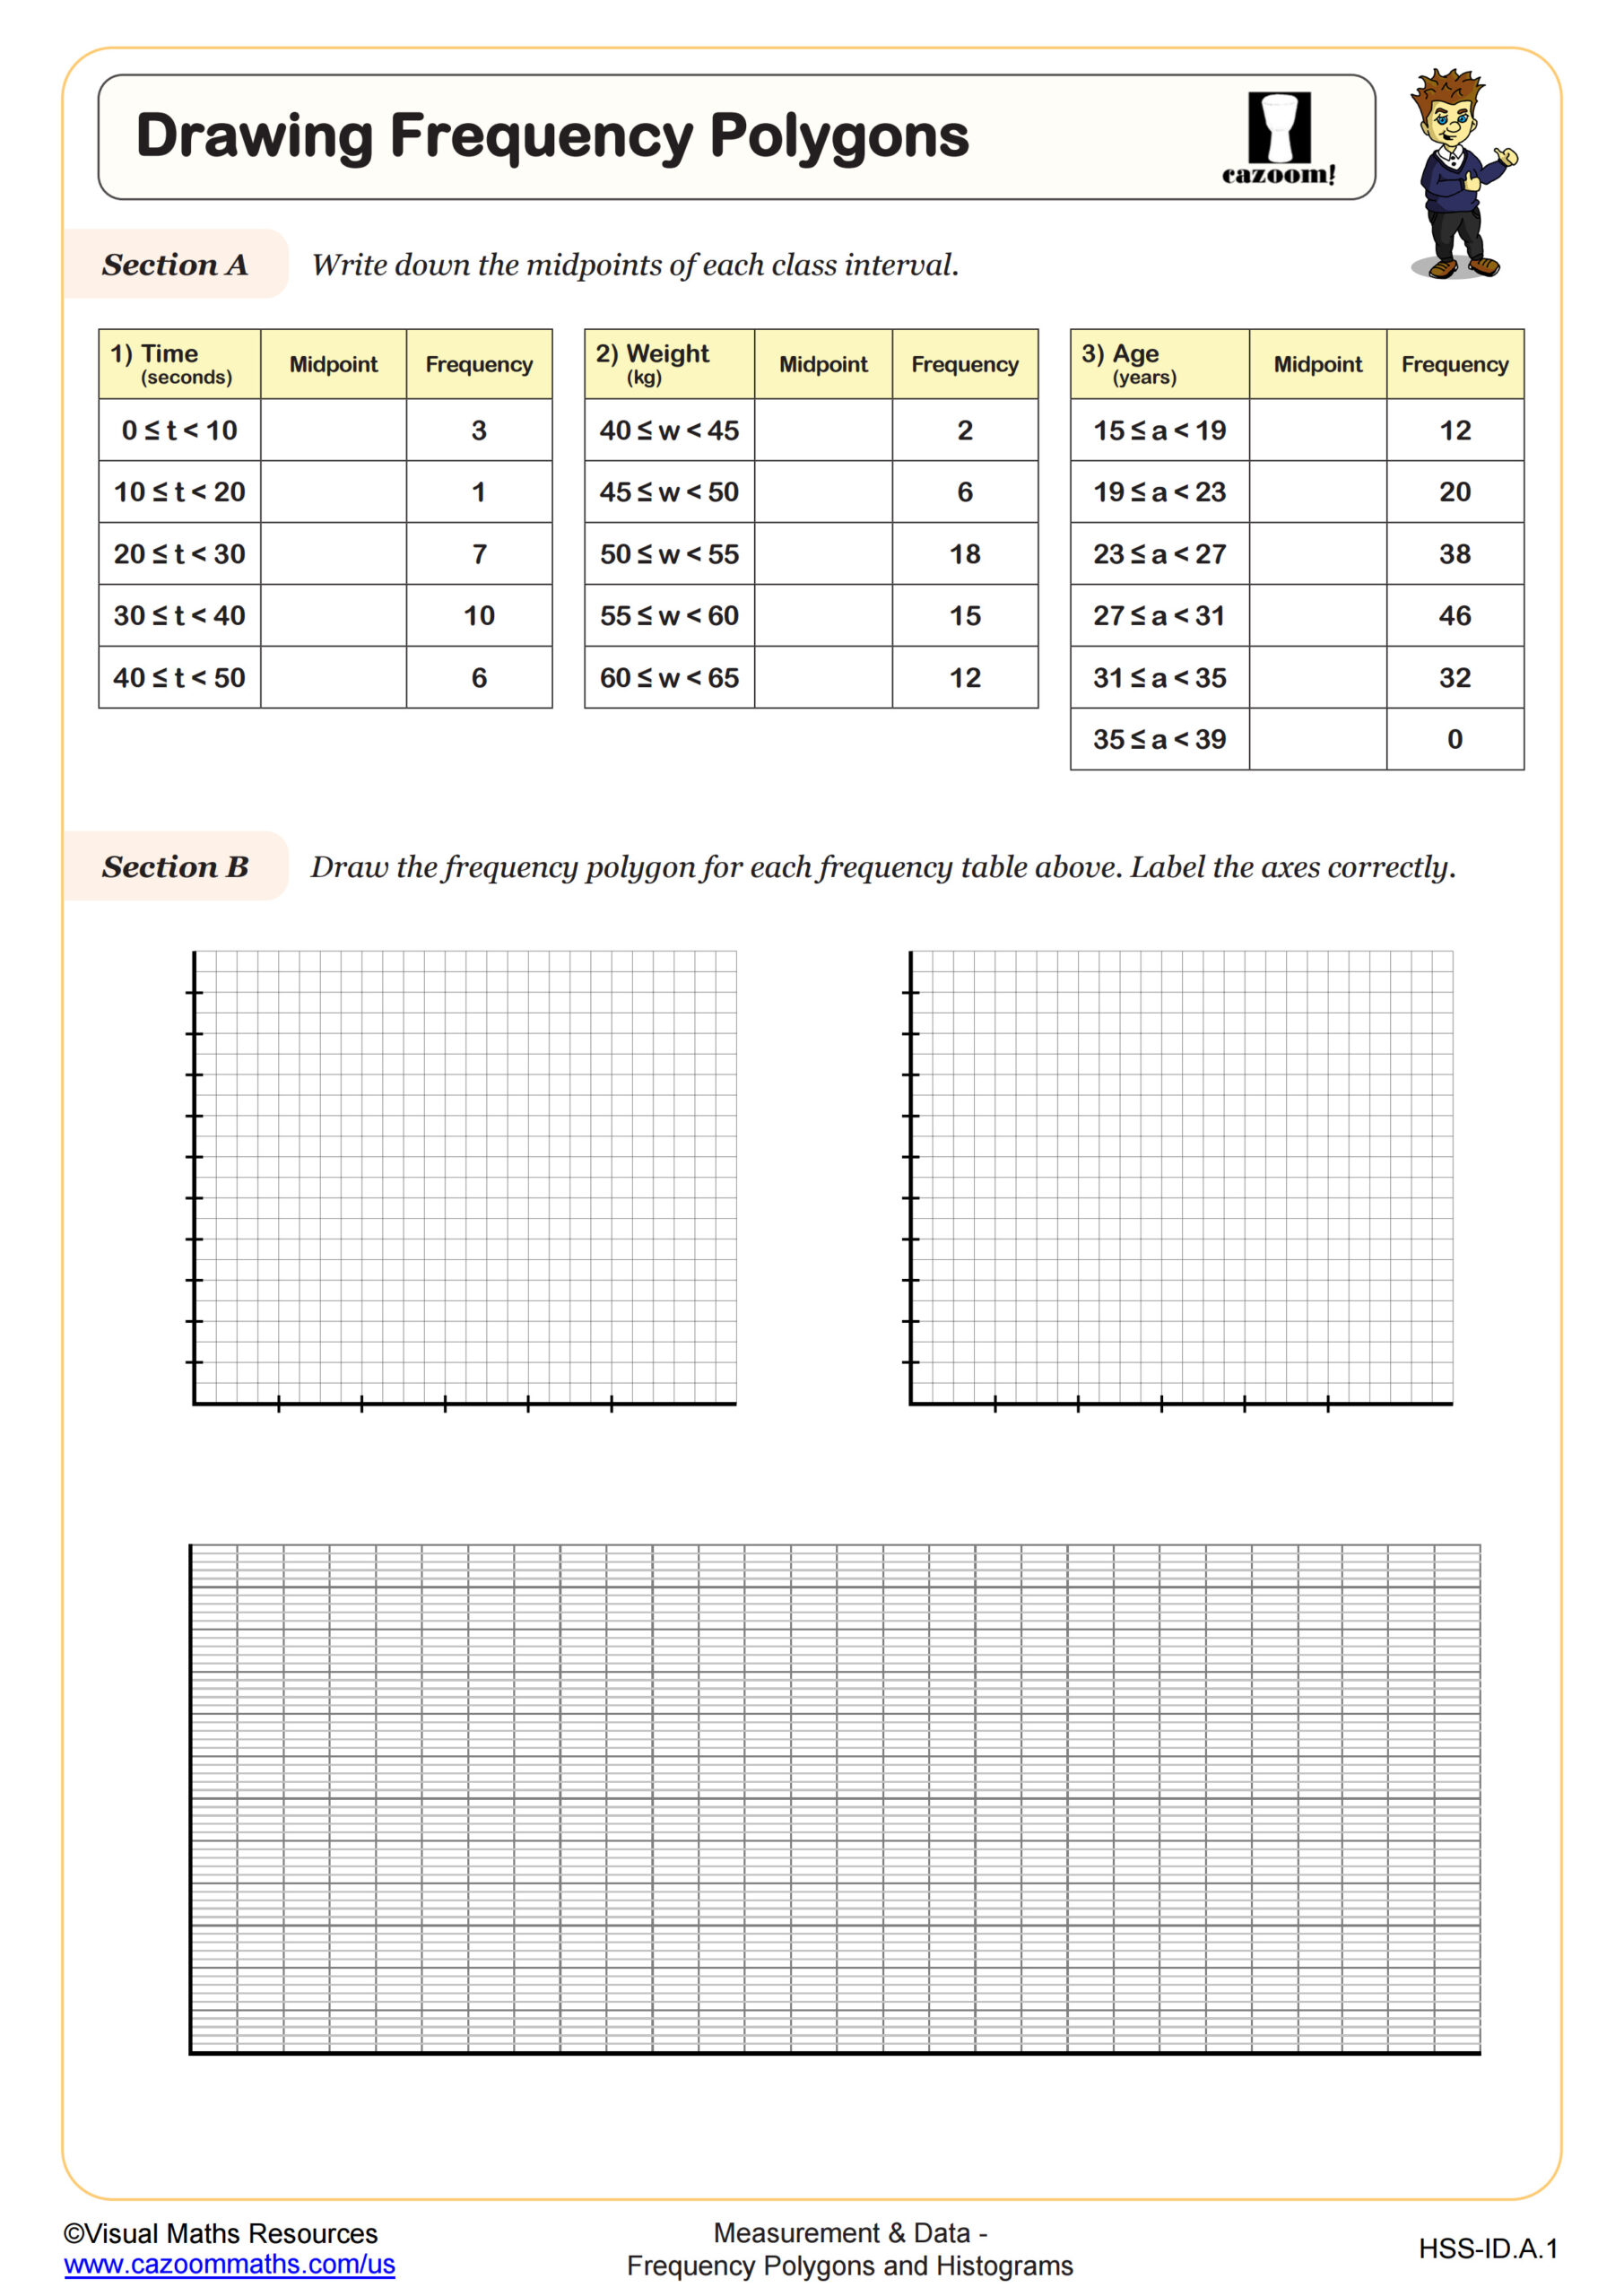
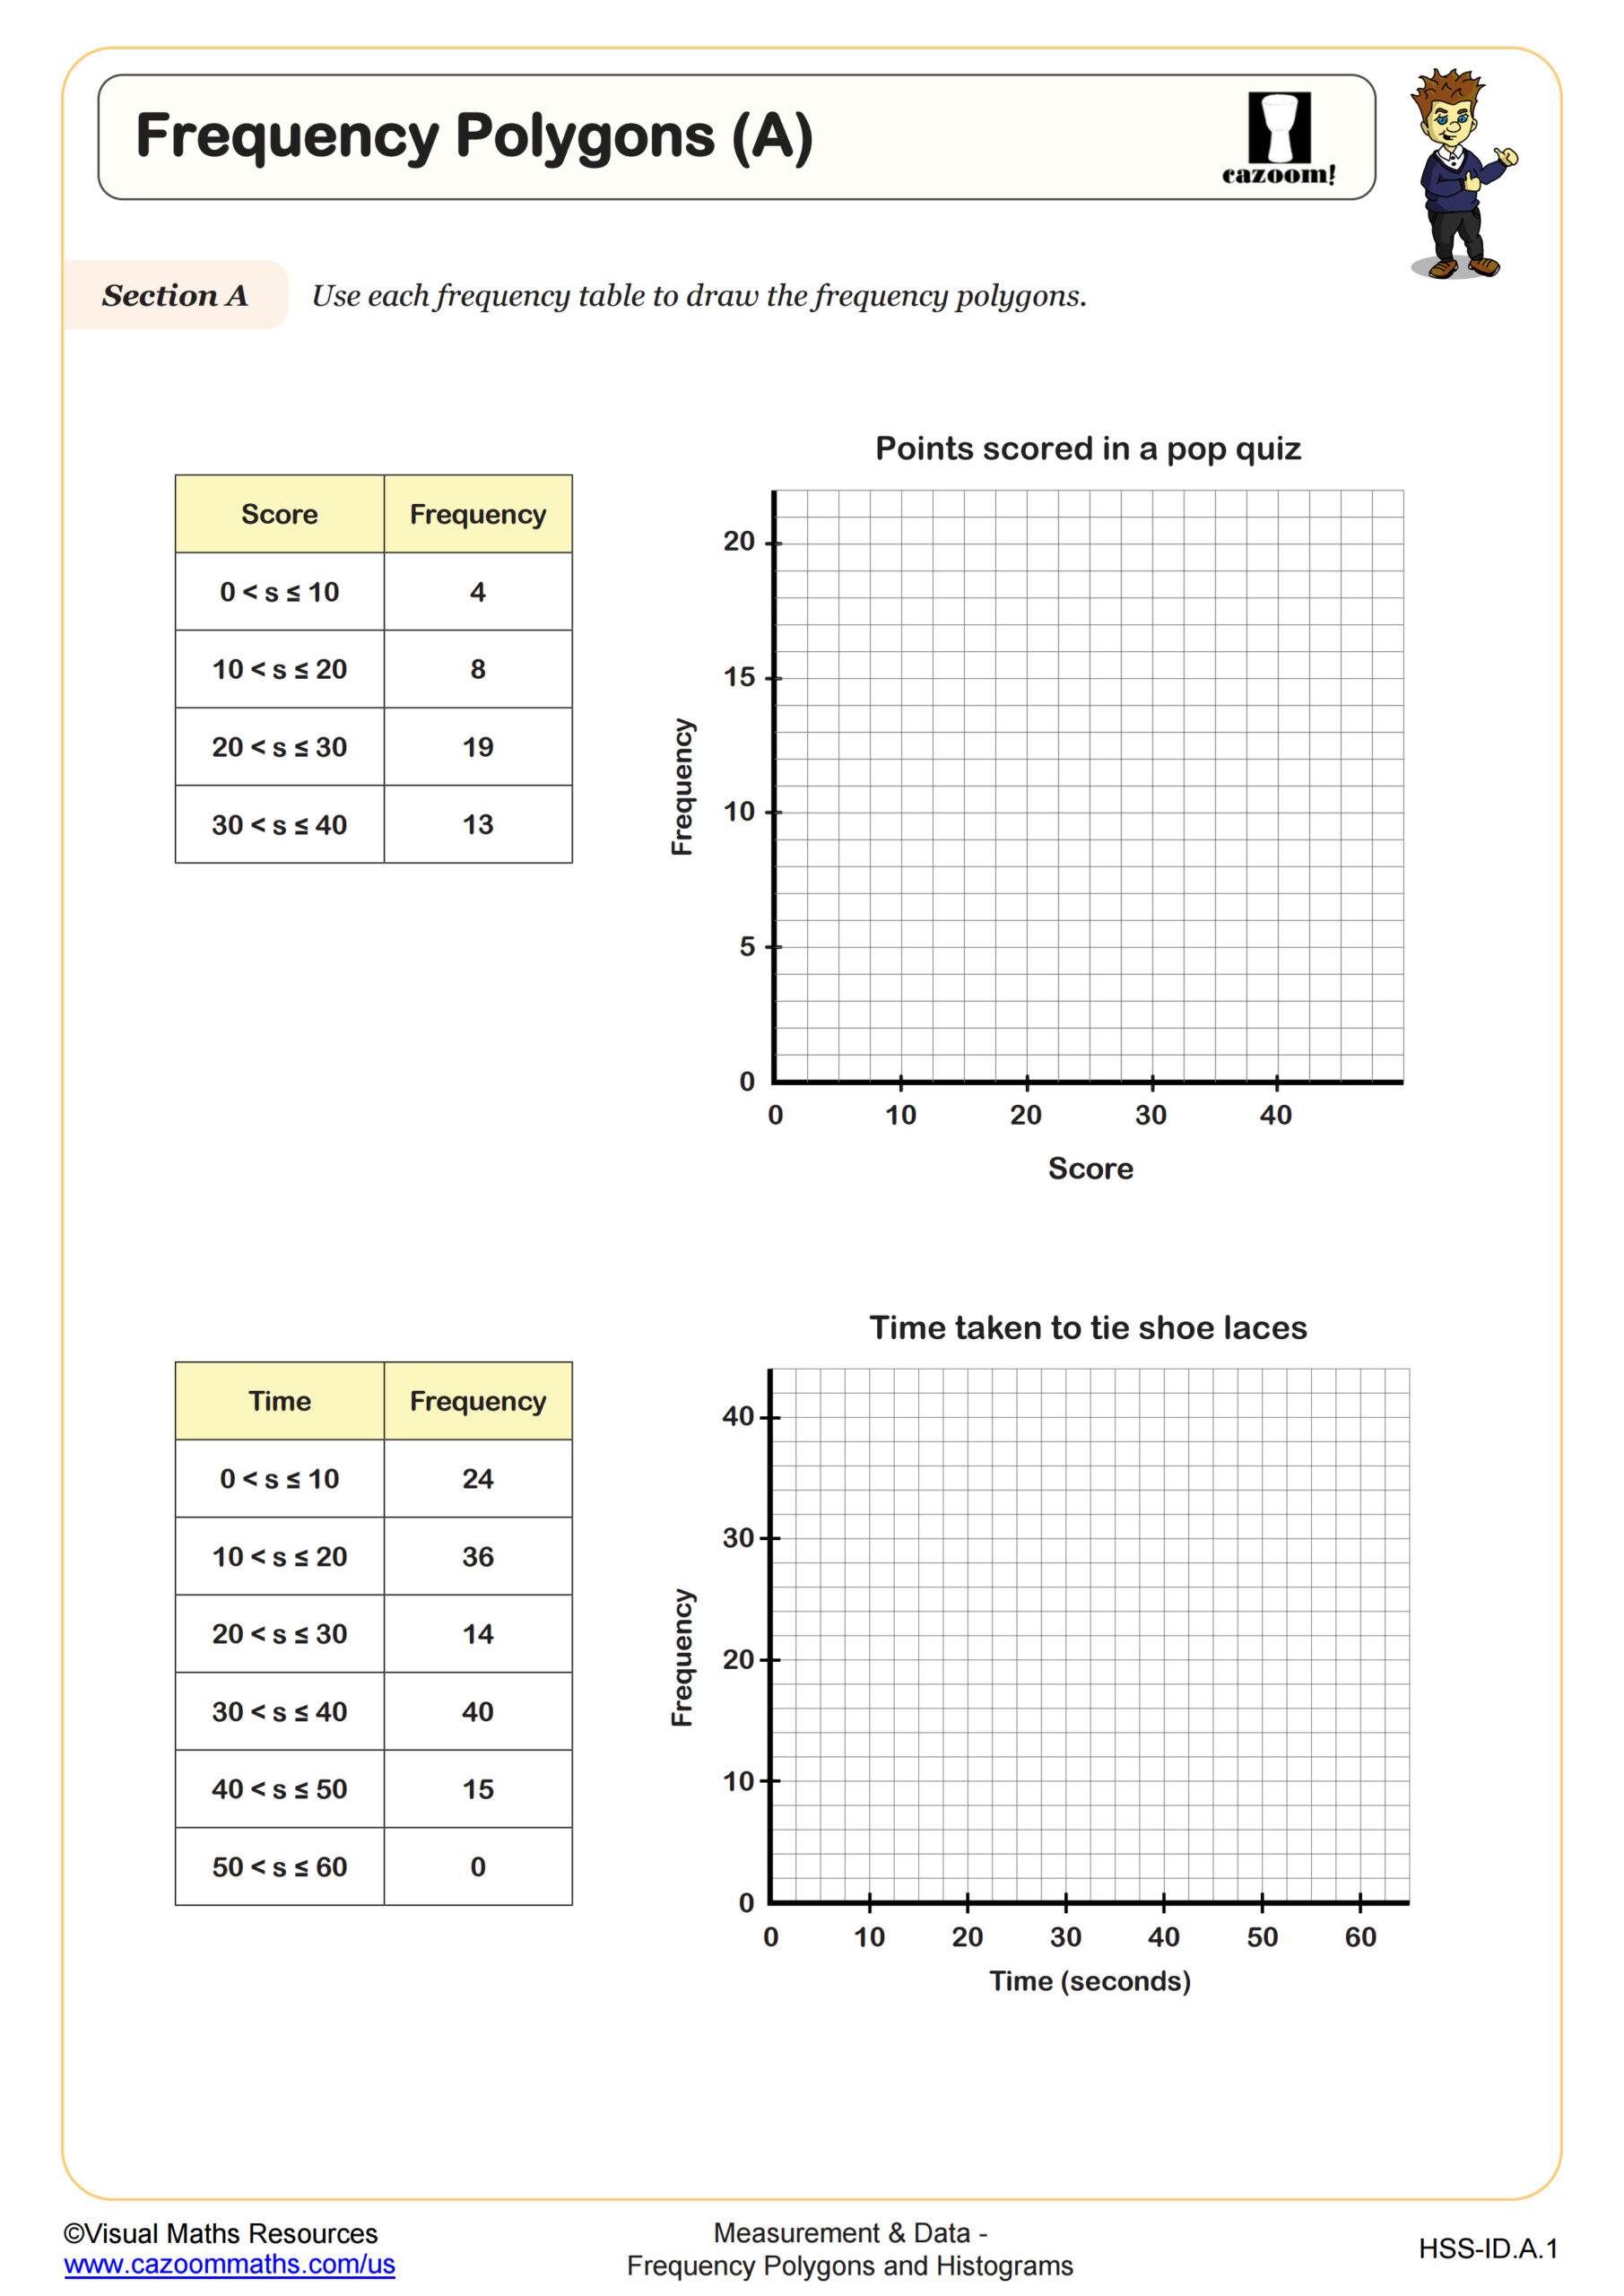
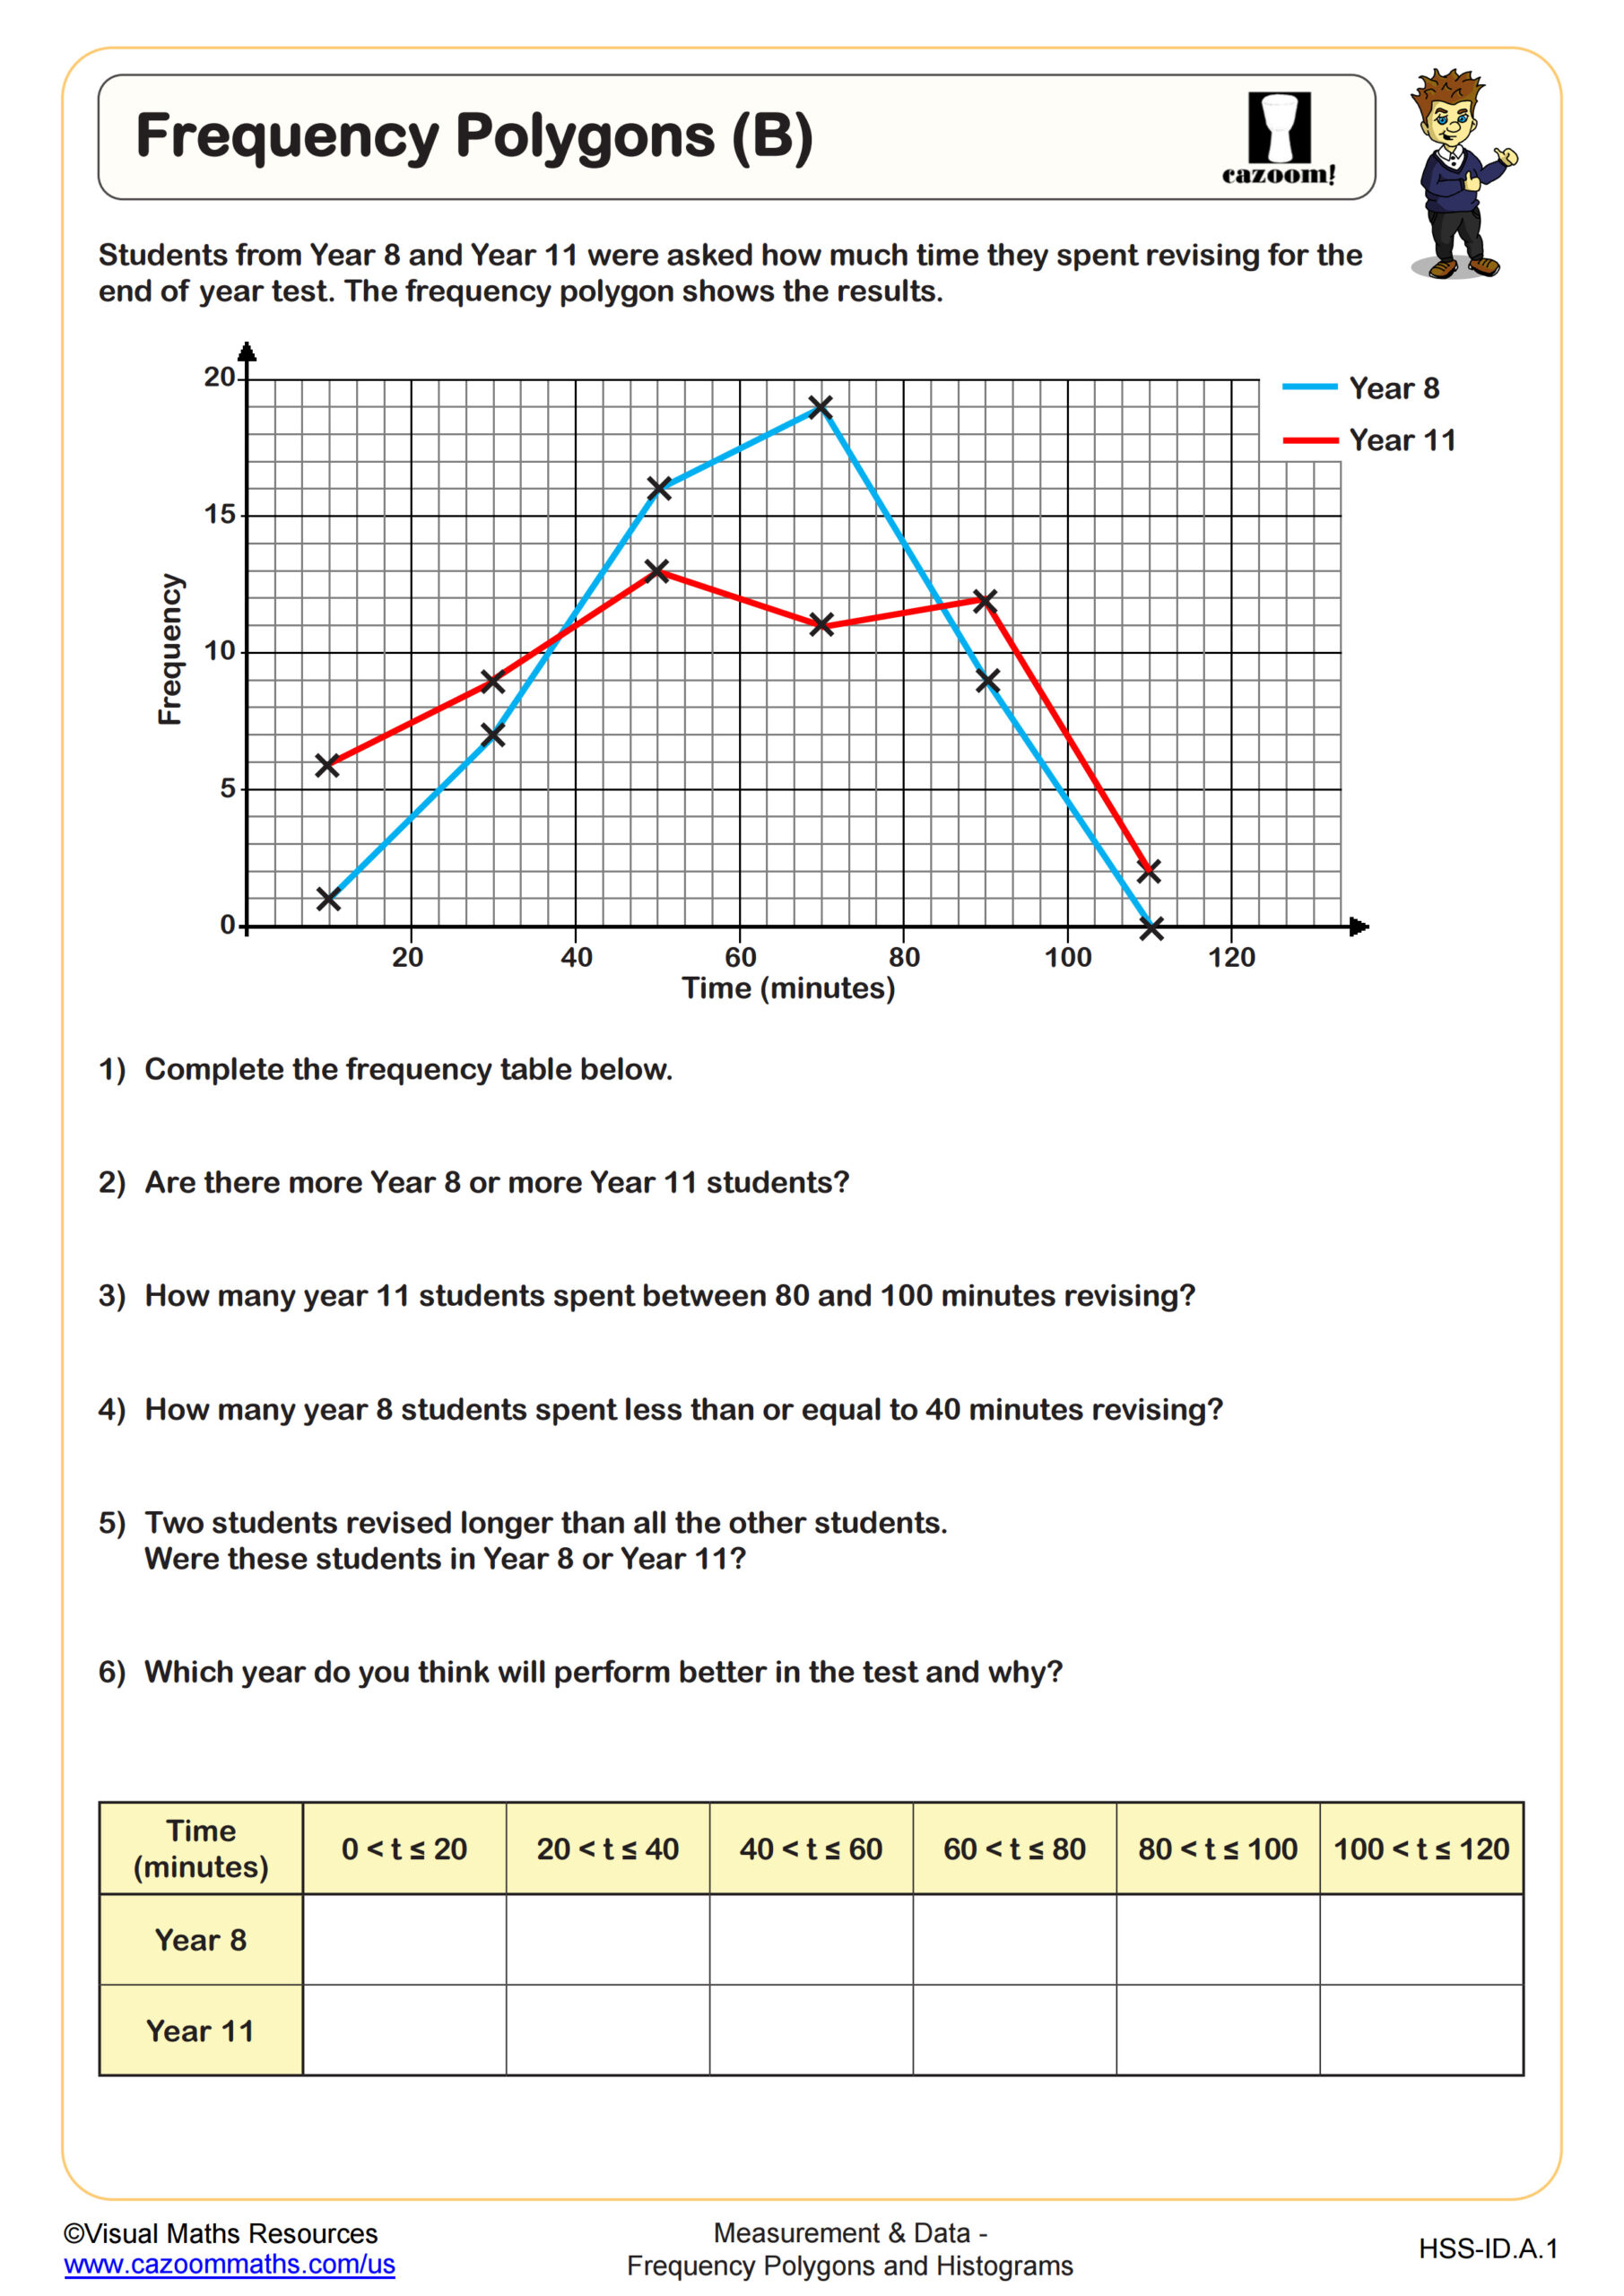
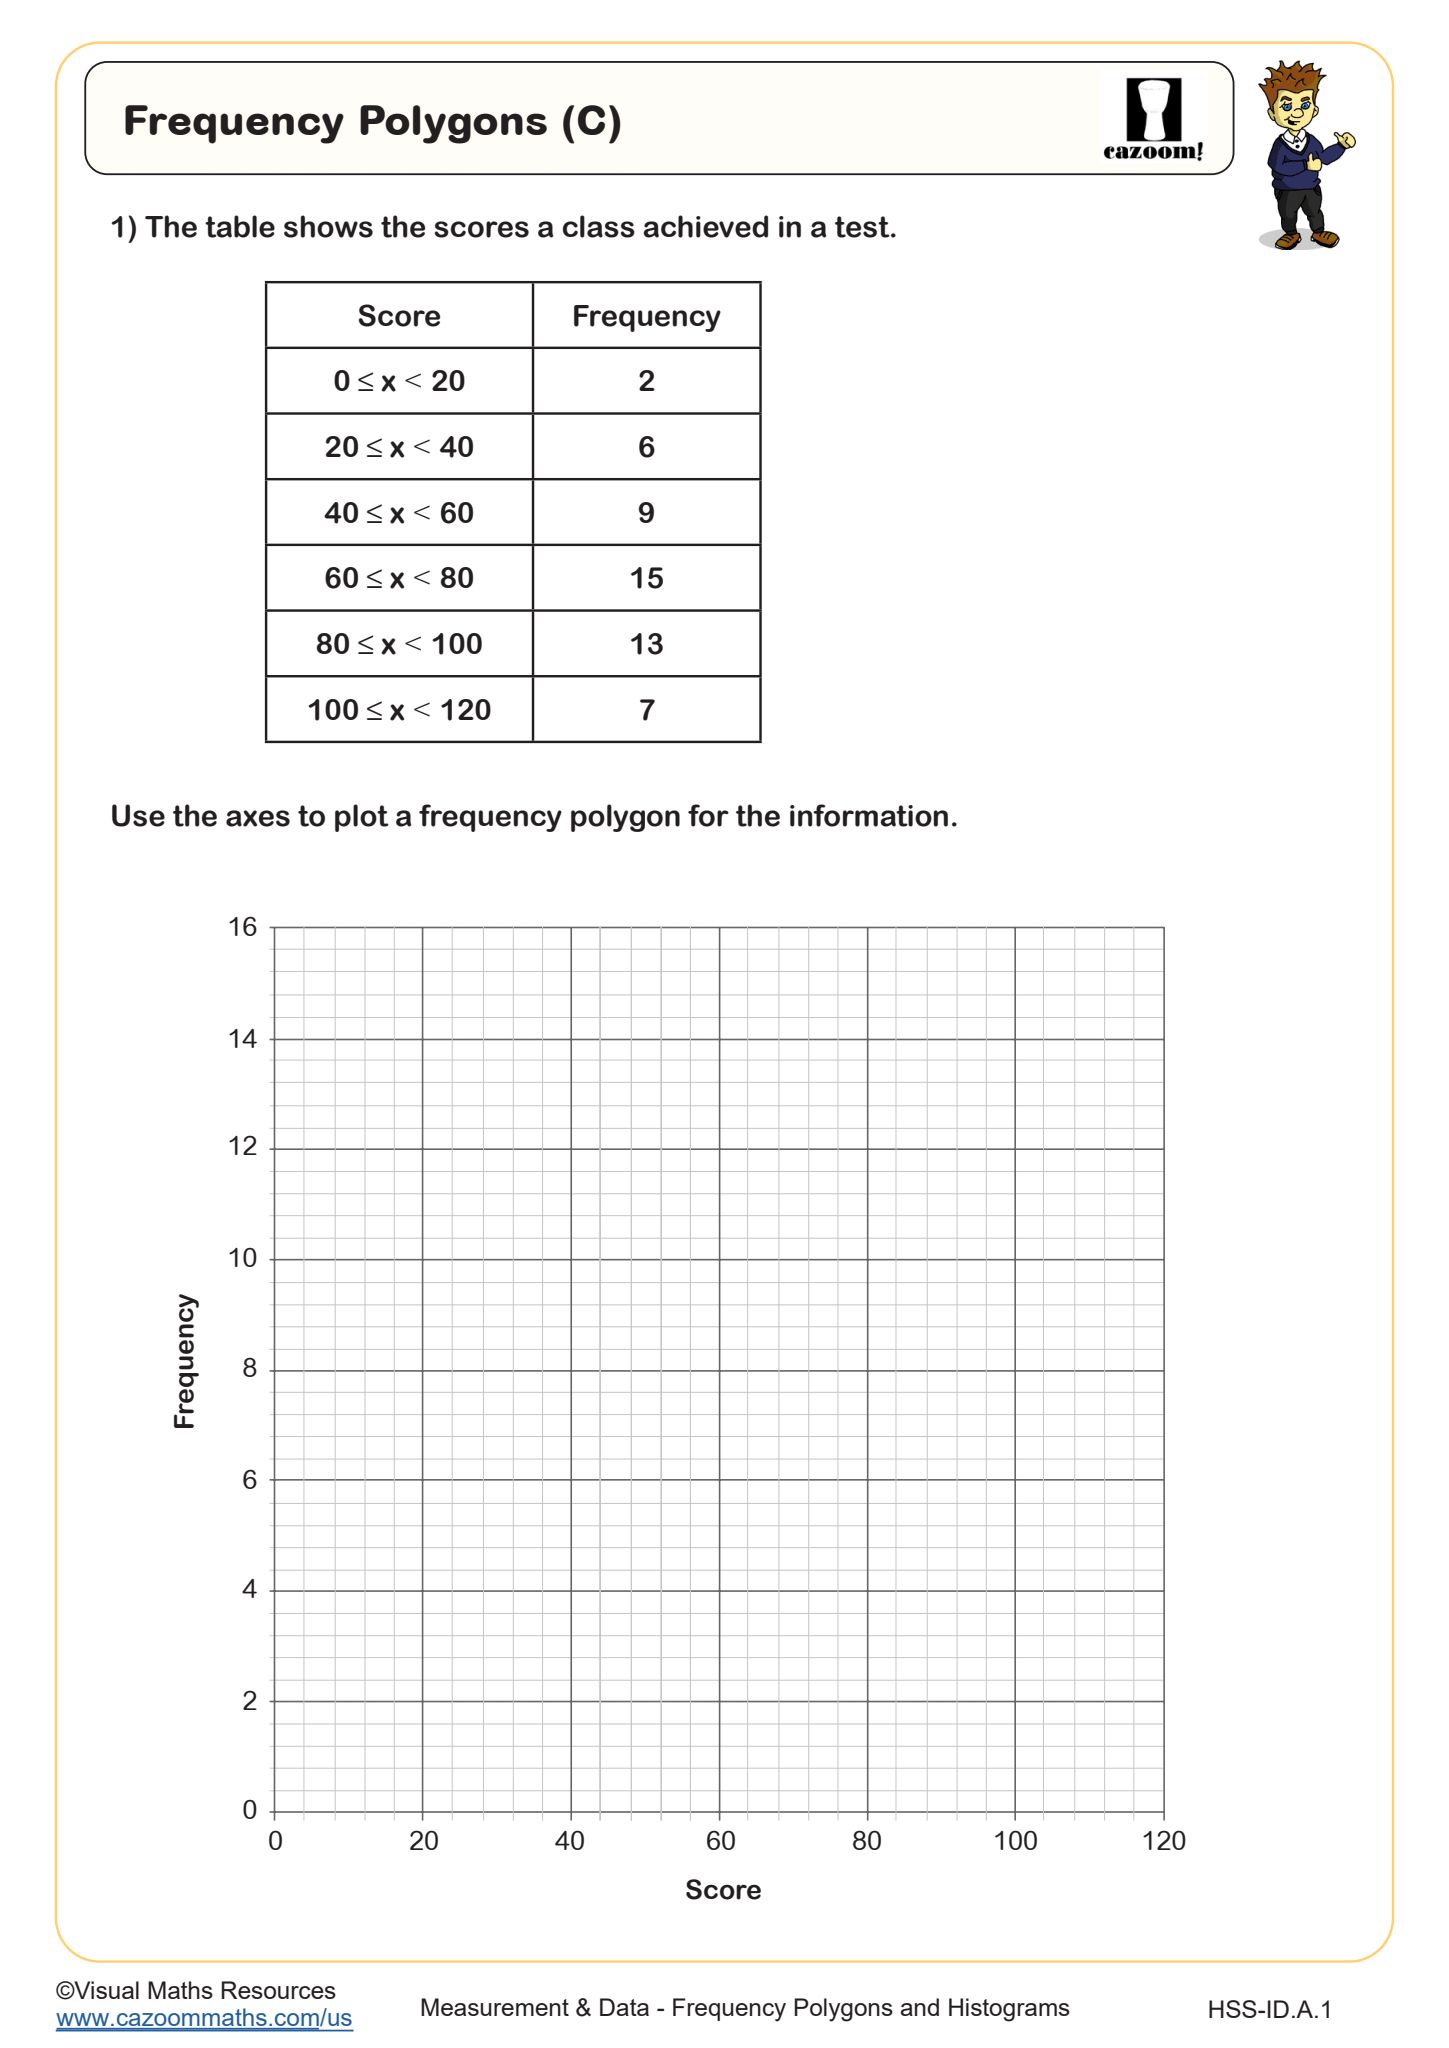
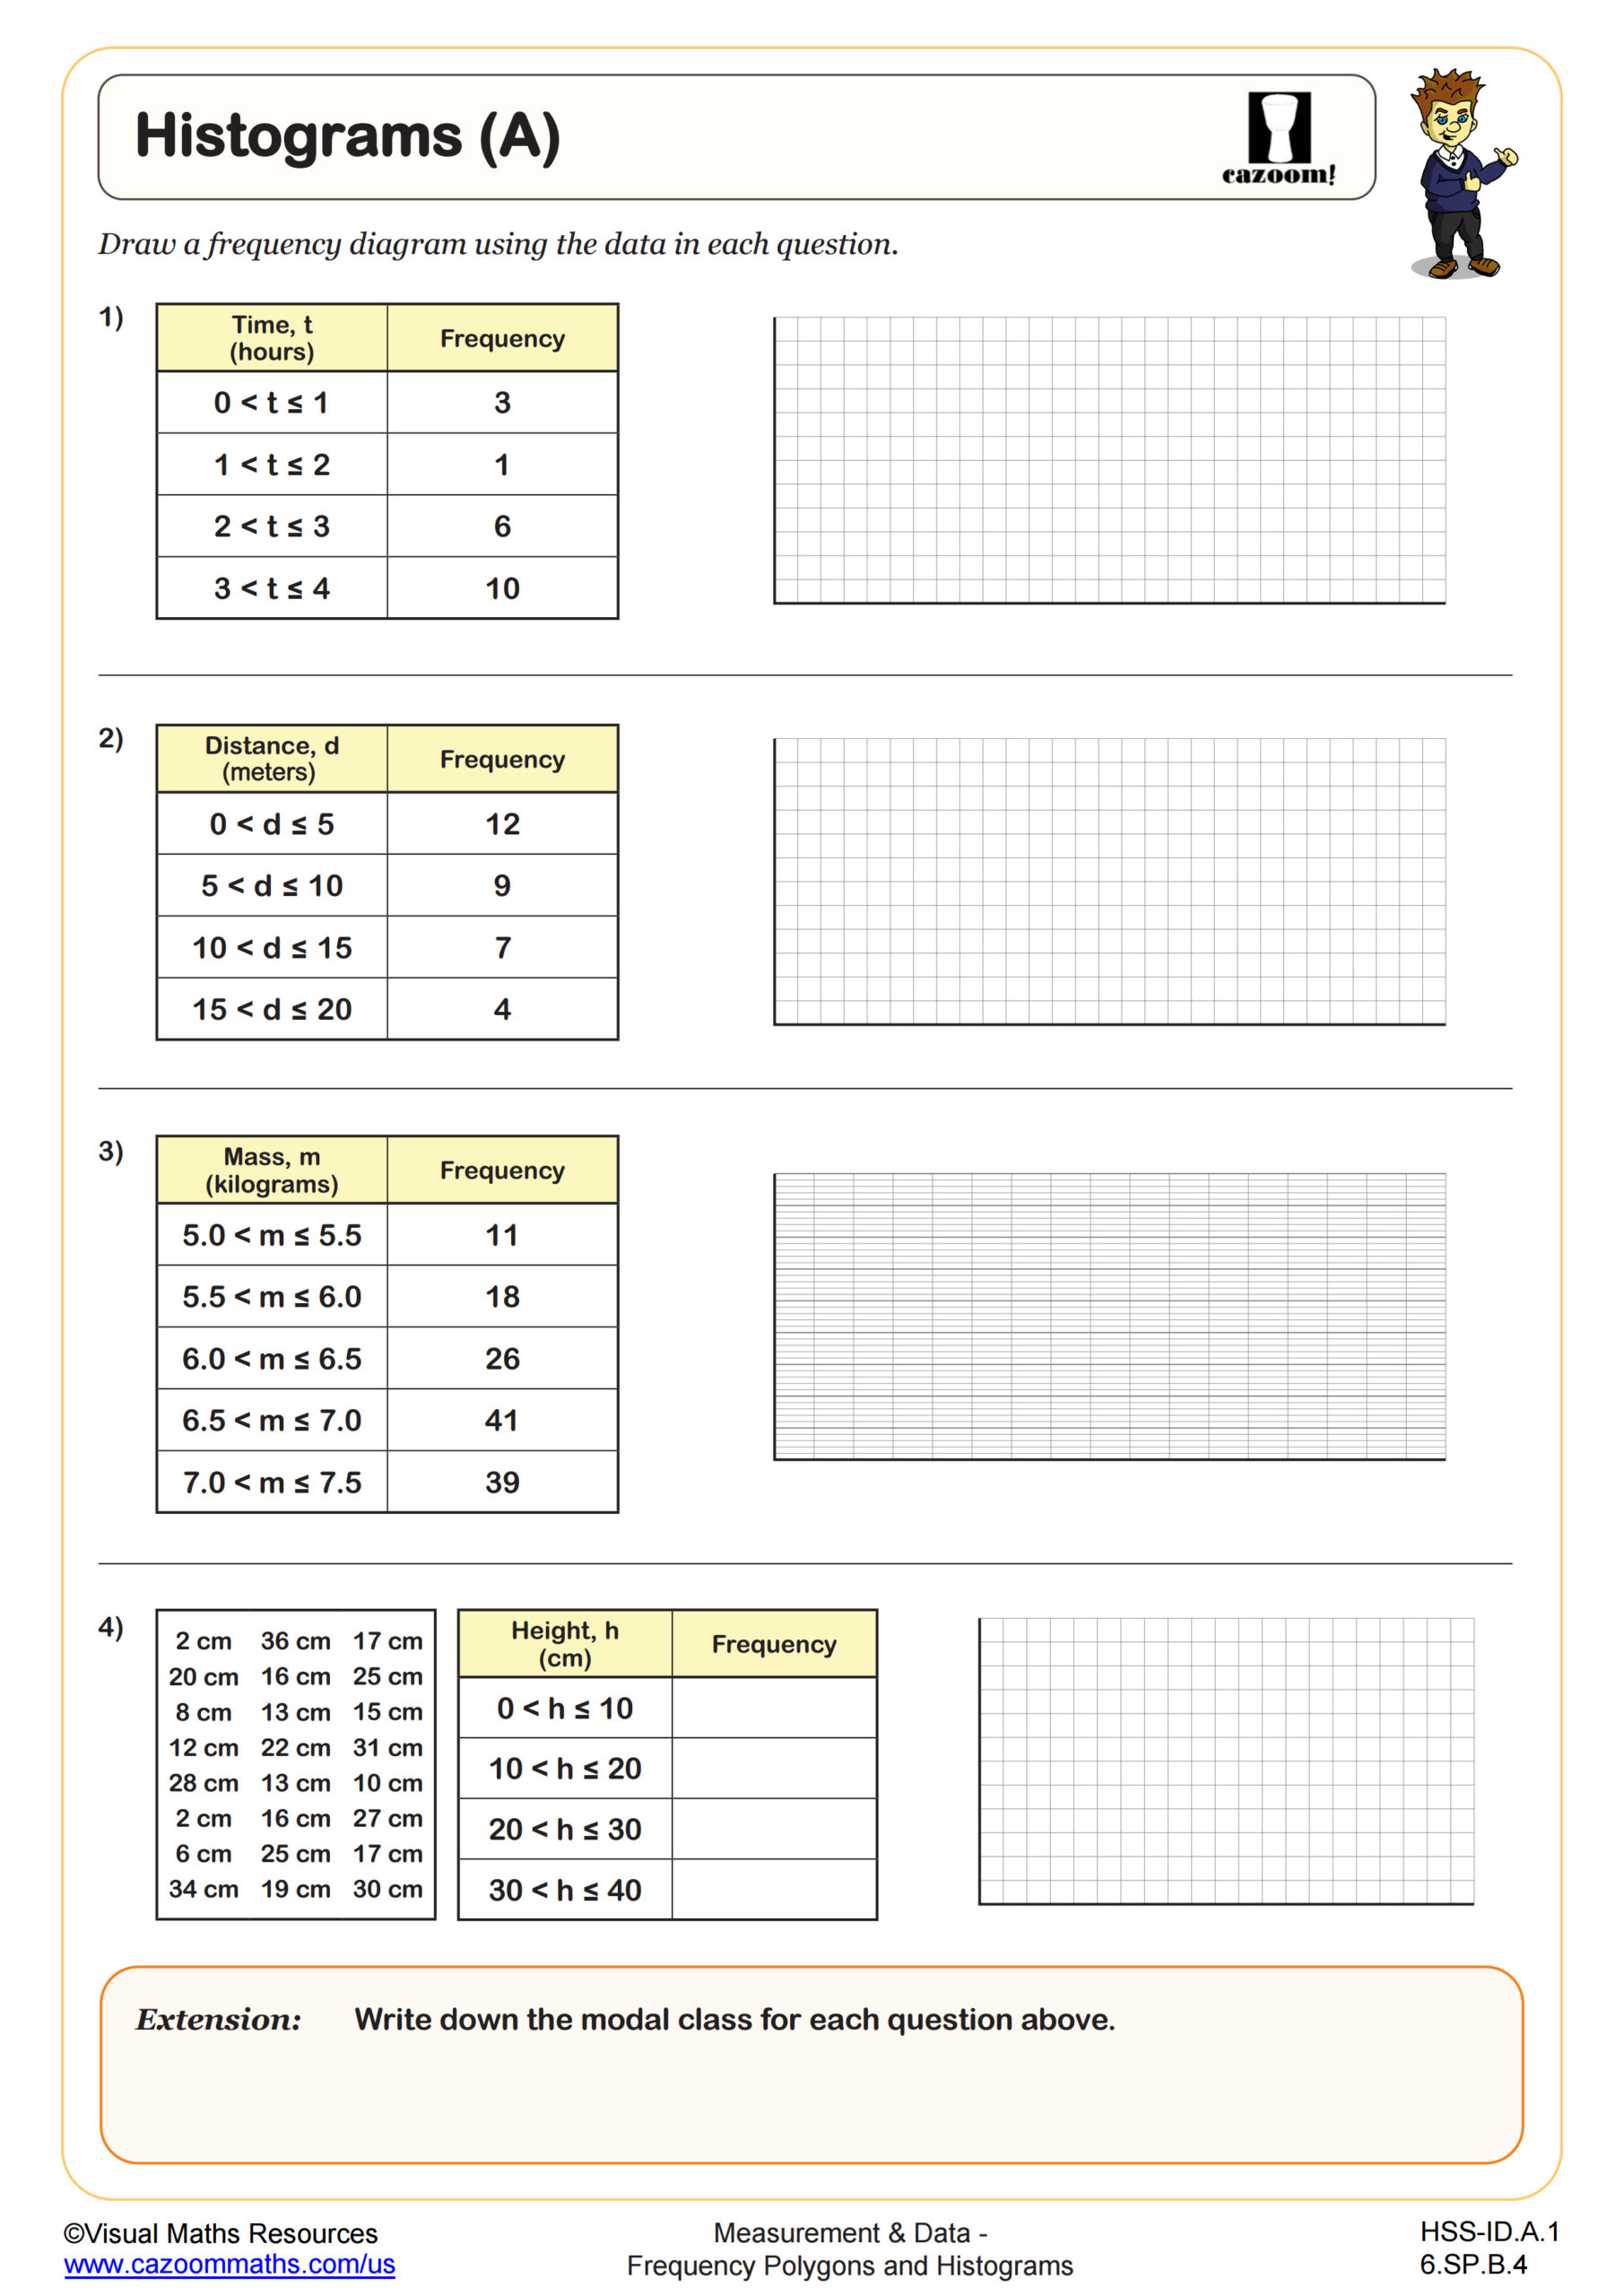
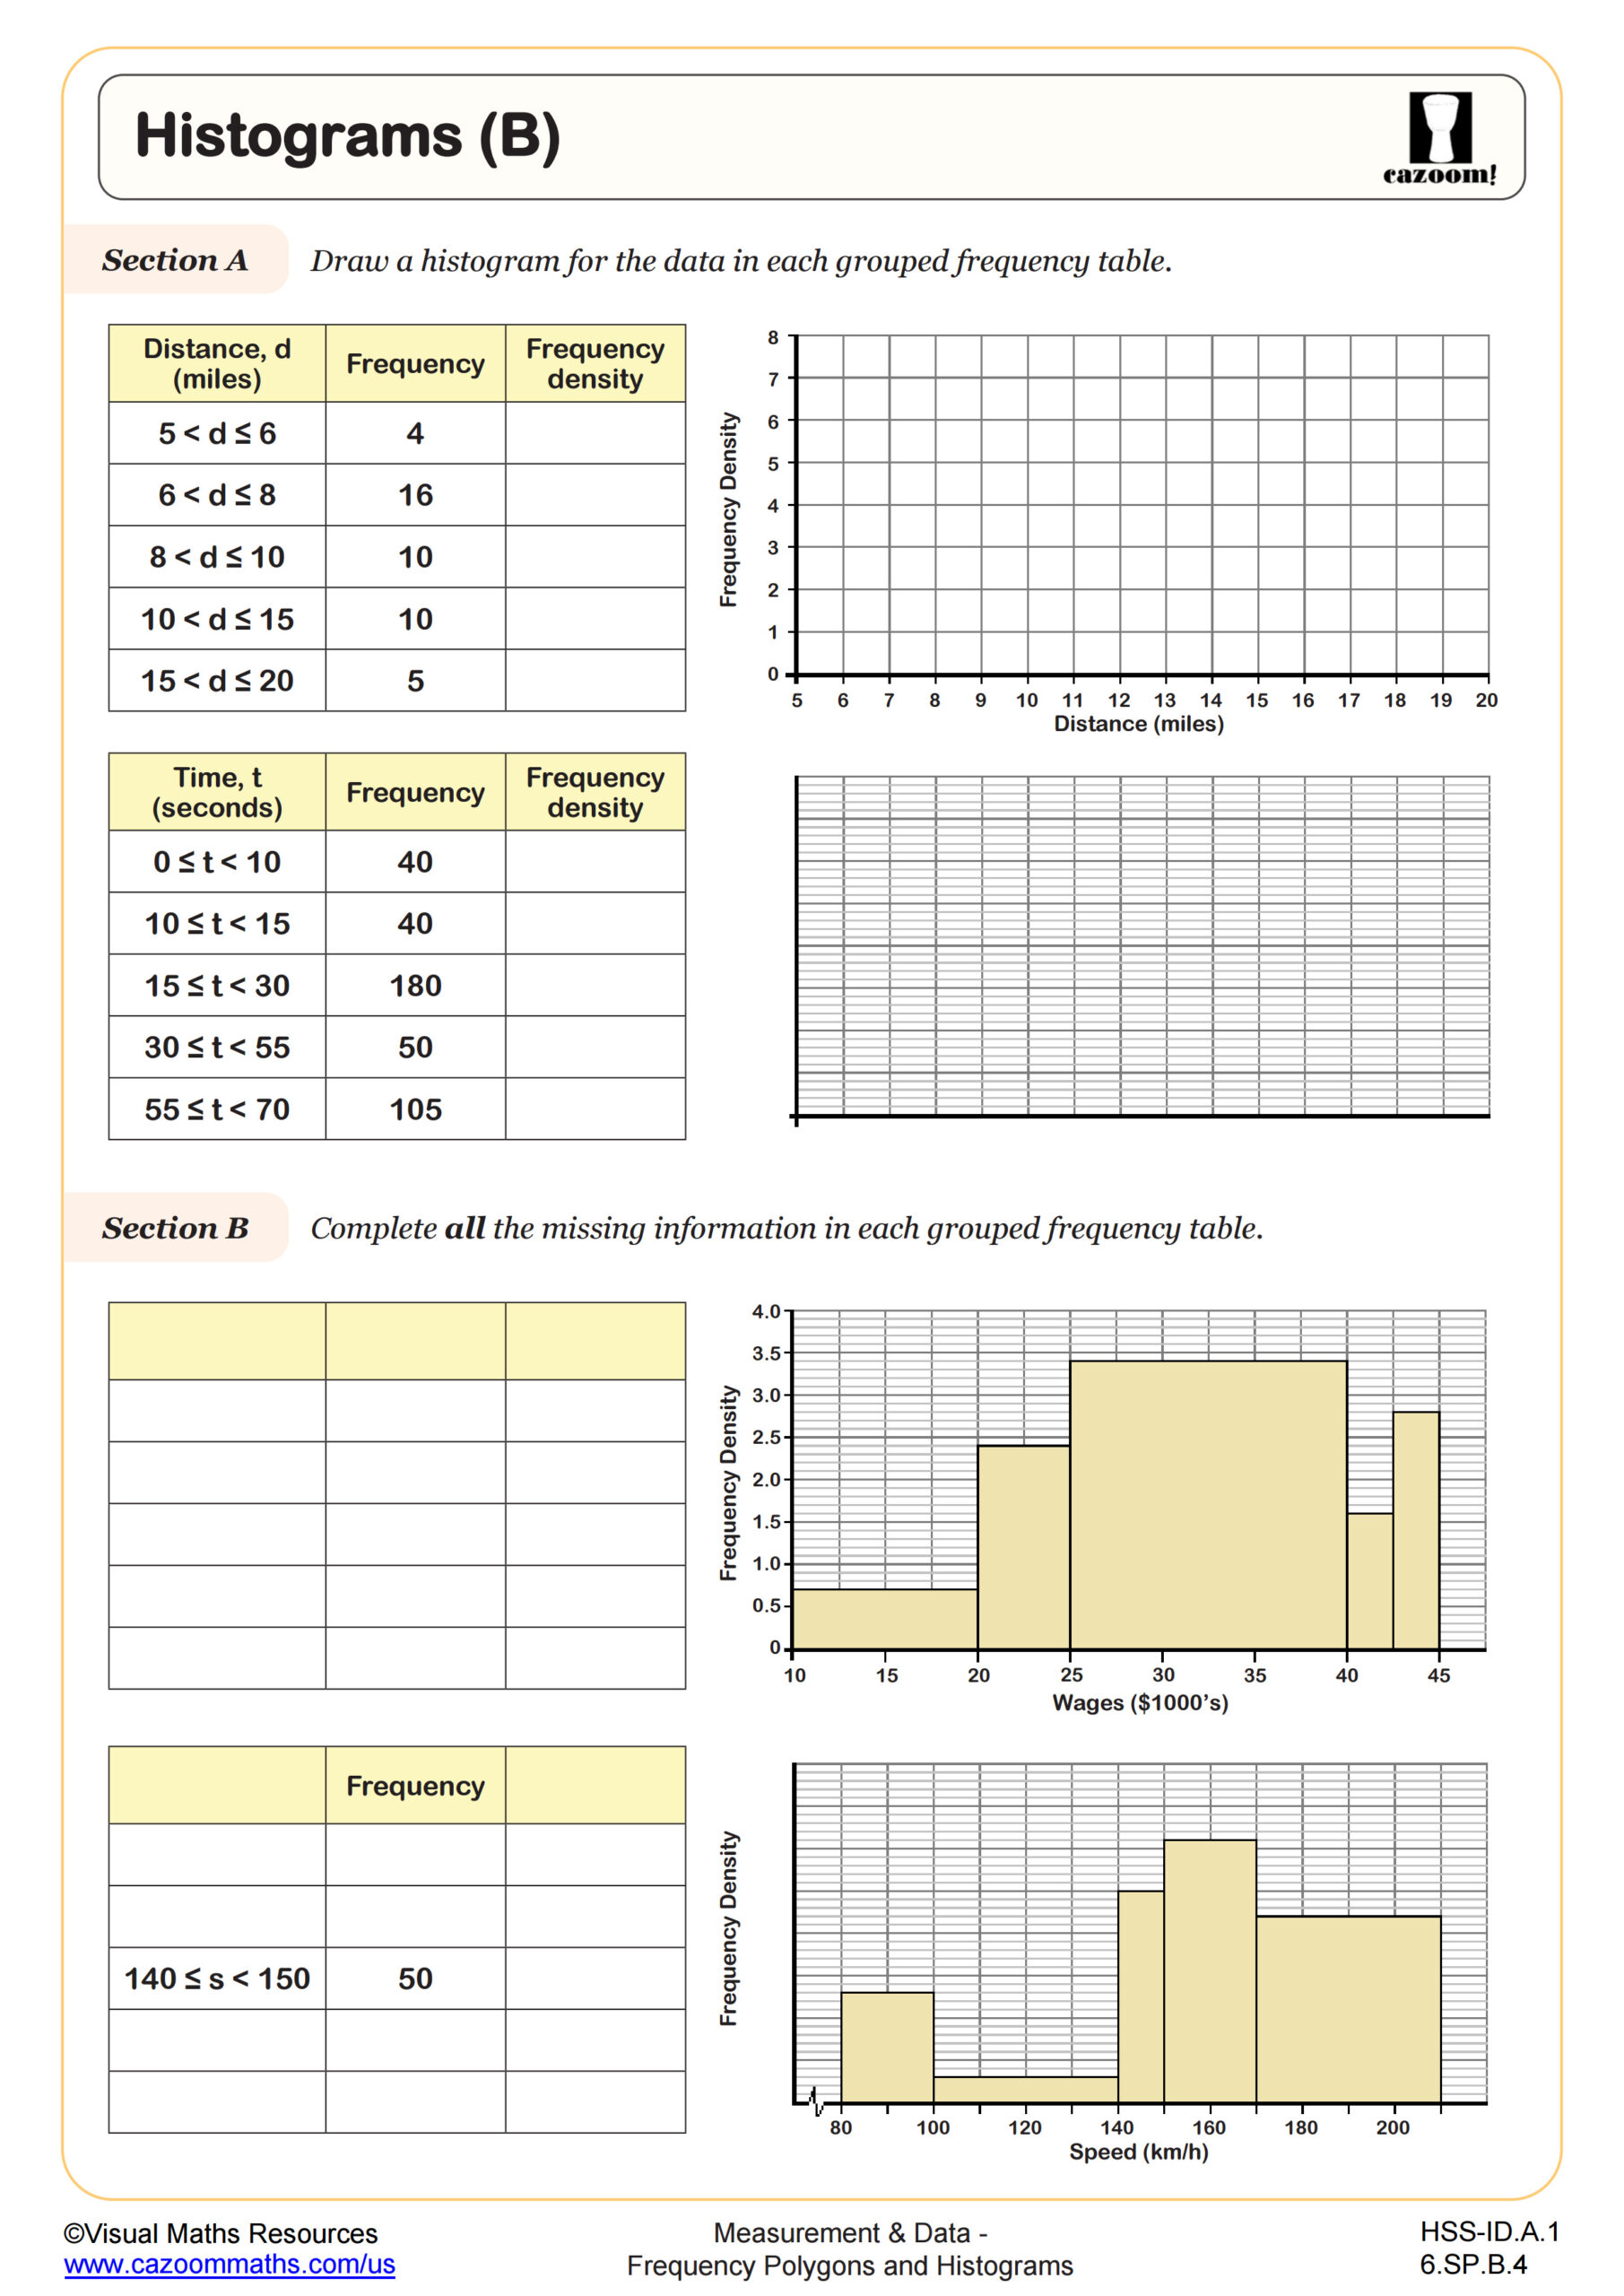
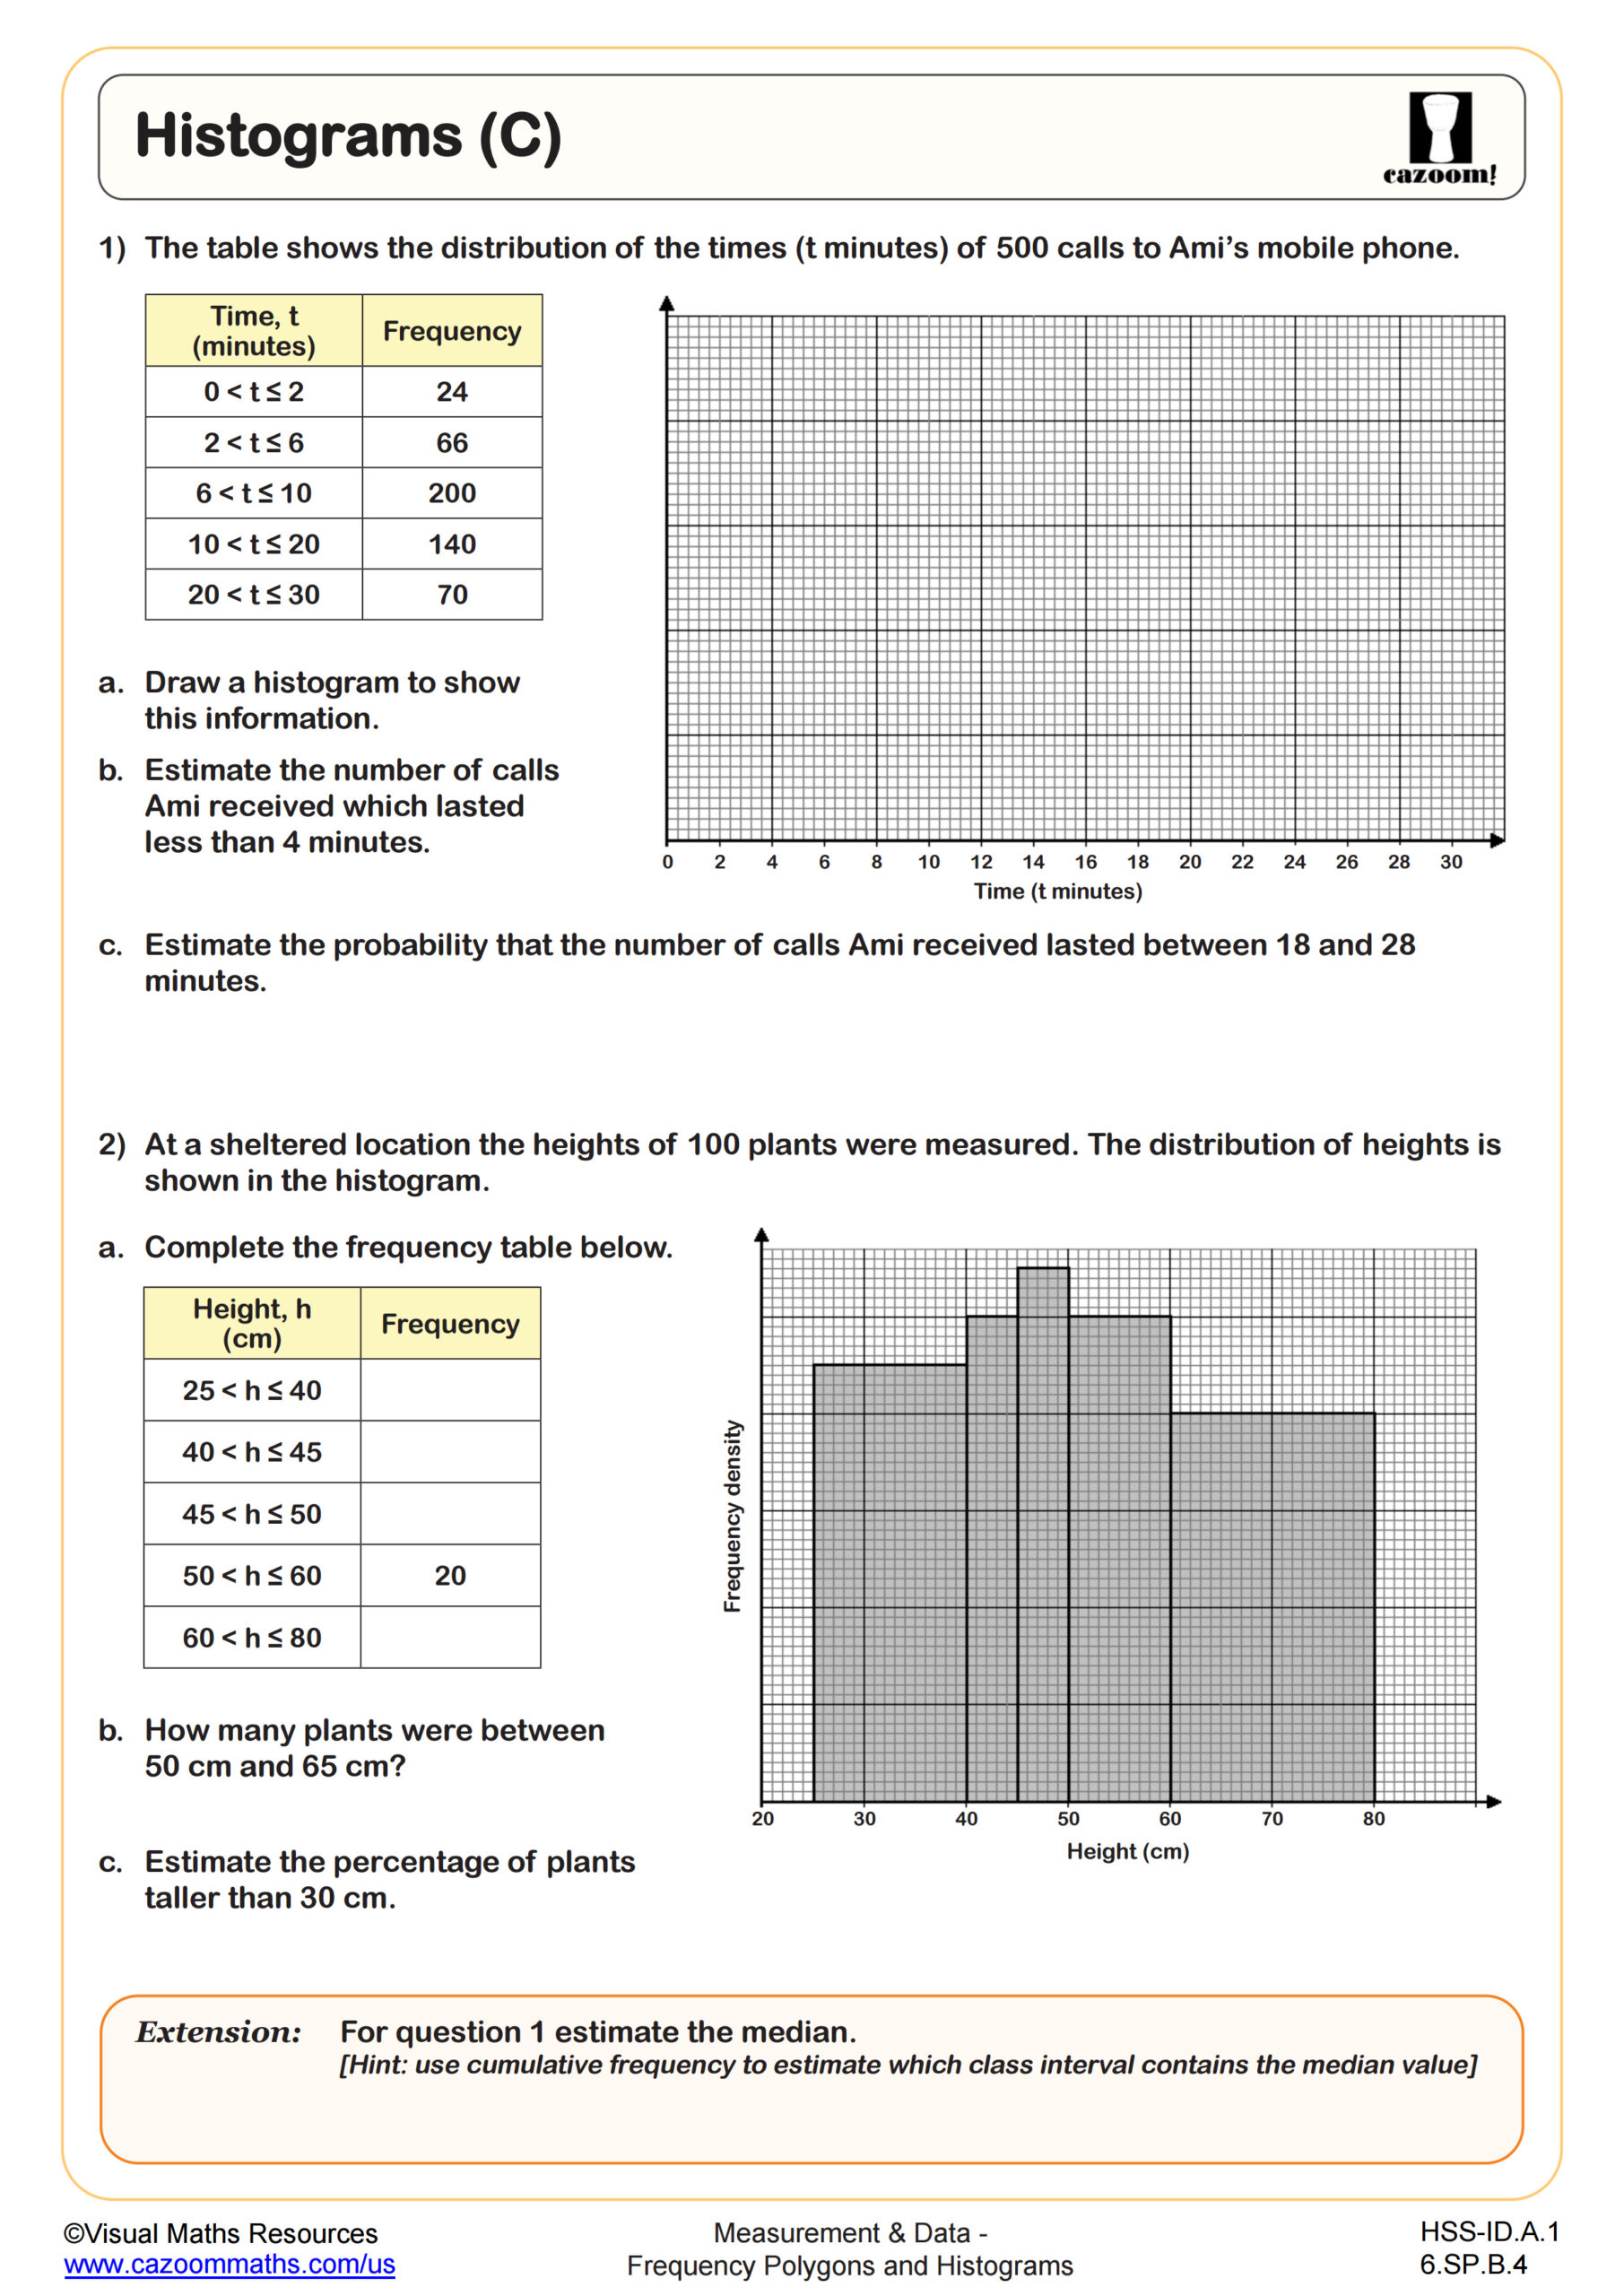
These worksheets guide students from simple frequency tables to the creation of complex statistical diagrams. Learners begin with relatable examples before advancing to grouped data, histograms, and cumulative frequency curves. Each worksheet includes detailed answer sheets that show every step of calculation and construction. This collection covers frequency tables, polygons, histograms, and box plots, building analytical and visual data skills through progressive, practical exercises.
Support Long-Term Success With Cazoom Math Frequency Polygons and Histograms Activities
Teachers save hours of prep time with these ready-to-use worksheets that fit directly into lesson plans. Each worksheet offers multiple difficulty levels, making differentiation straightforward for mixed-ability classes. The problems progress gradually, allowing struggling students to build skills while advanced learners tackle extension questions.
Solution keys show complete working methods, helping teachers identify where students make errors in their reasoning. This detail makes grading faster and provides clear examples for reteaching concepts. Teachers use these worksheets for homework assignments, preparing for quizzes, and conducting quick formative assessments. The variety of question types keeps retrieval practice fresh throughout the unit.
How Frequency Polygons and Histograms Build Everyday Math Confidence
Students apply histogram and frequency polygon skills when analyzing real-world data distributions. They interpret weather patterns, compare test score spreads, and understand population demographics through these graphs. Statistical visualization enables students to critically evaluate information in news reports and research studies. These techniques remain essential across numerous career fields.
•Tracking patient recovery in healthcare
•Studying traffic patterns for city planning
•Monitoring stock price movements
•Measuring environmental climate changes