High School Two-Way Tables and Pictograms Worksheets
All worksheets are created by the team of experienced teachers at Cazoom Math.
What topics are covered in tables and pictographs practice?
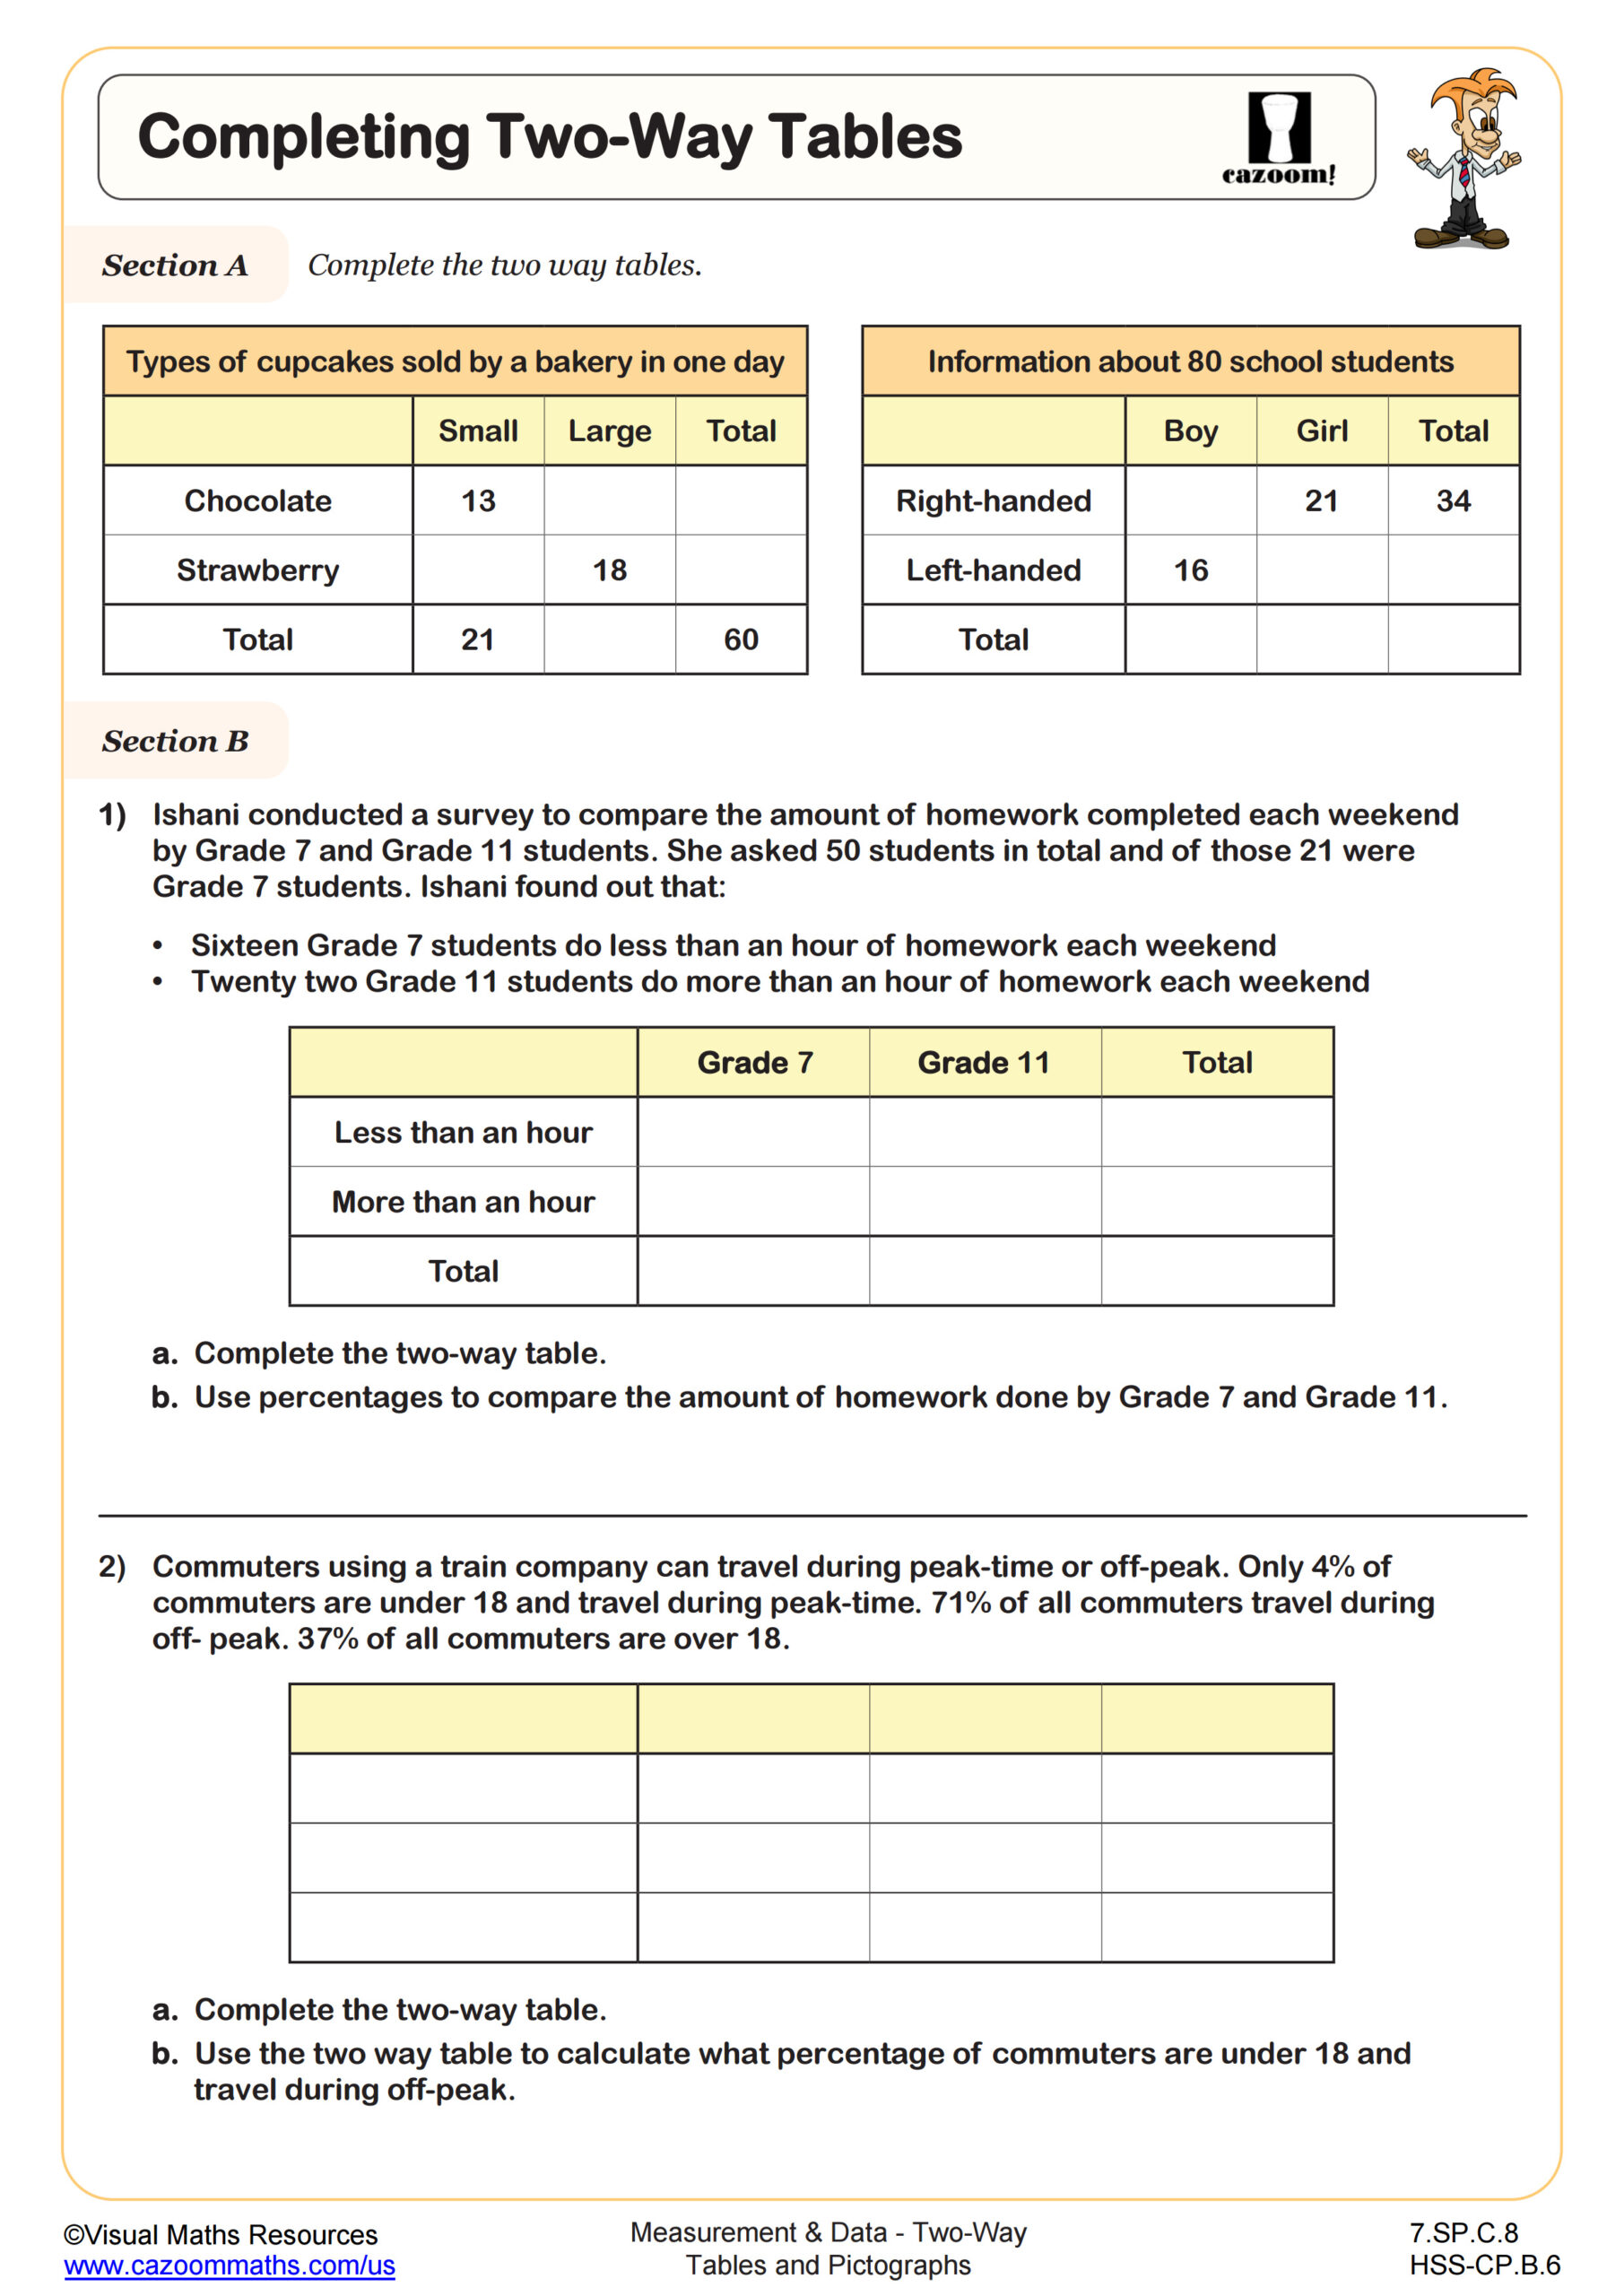
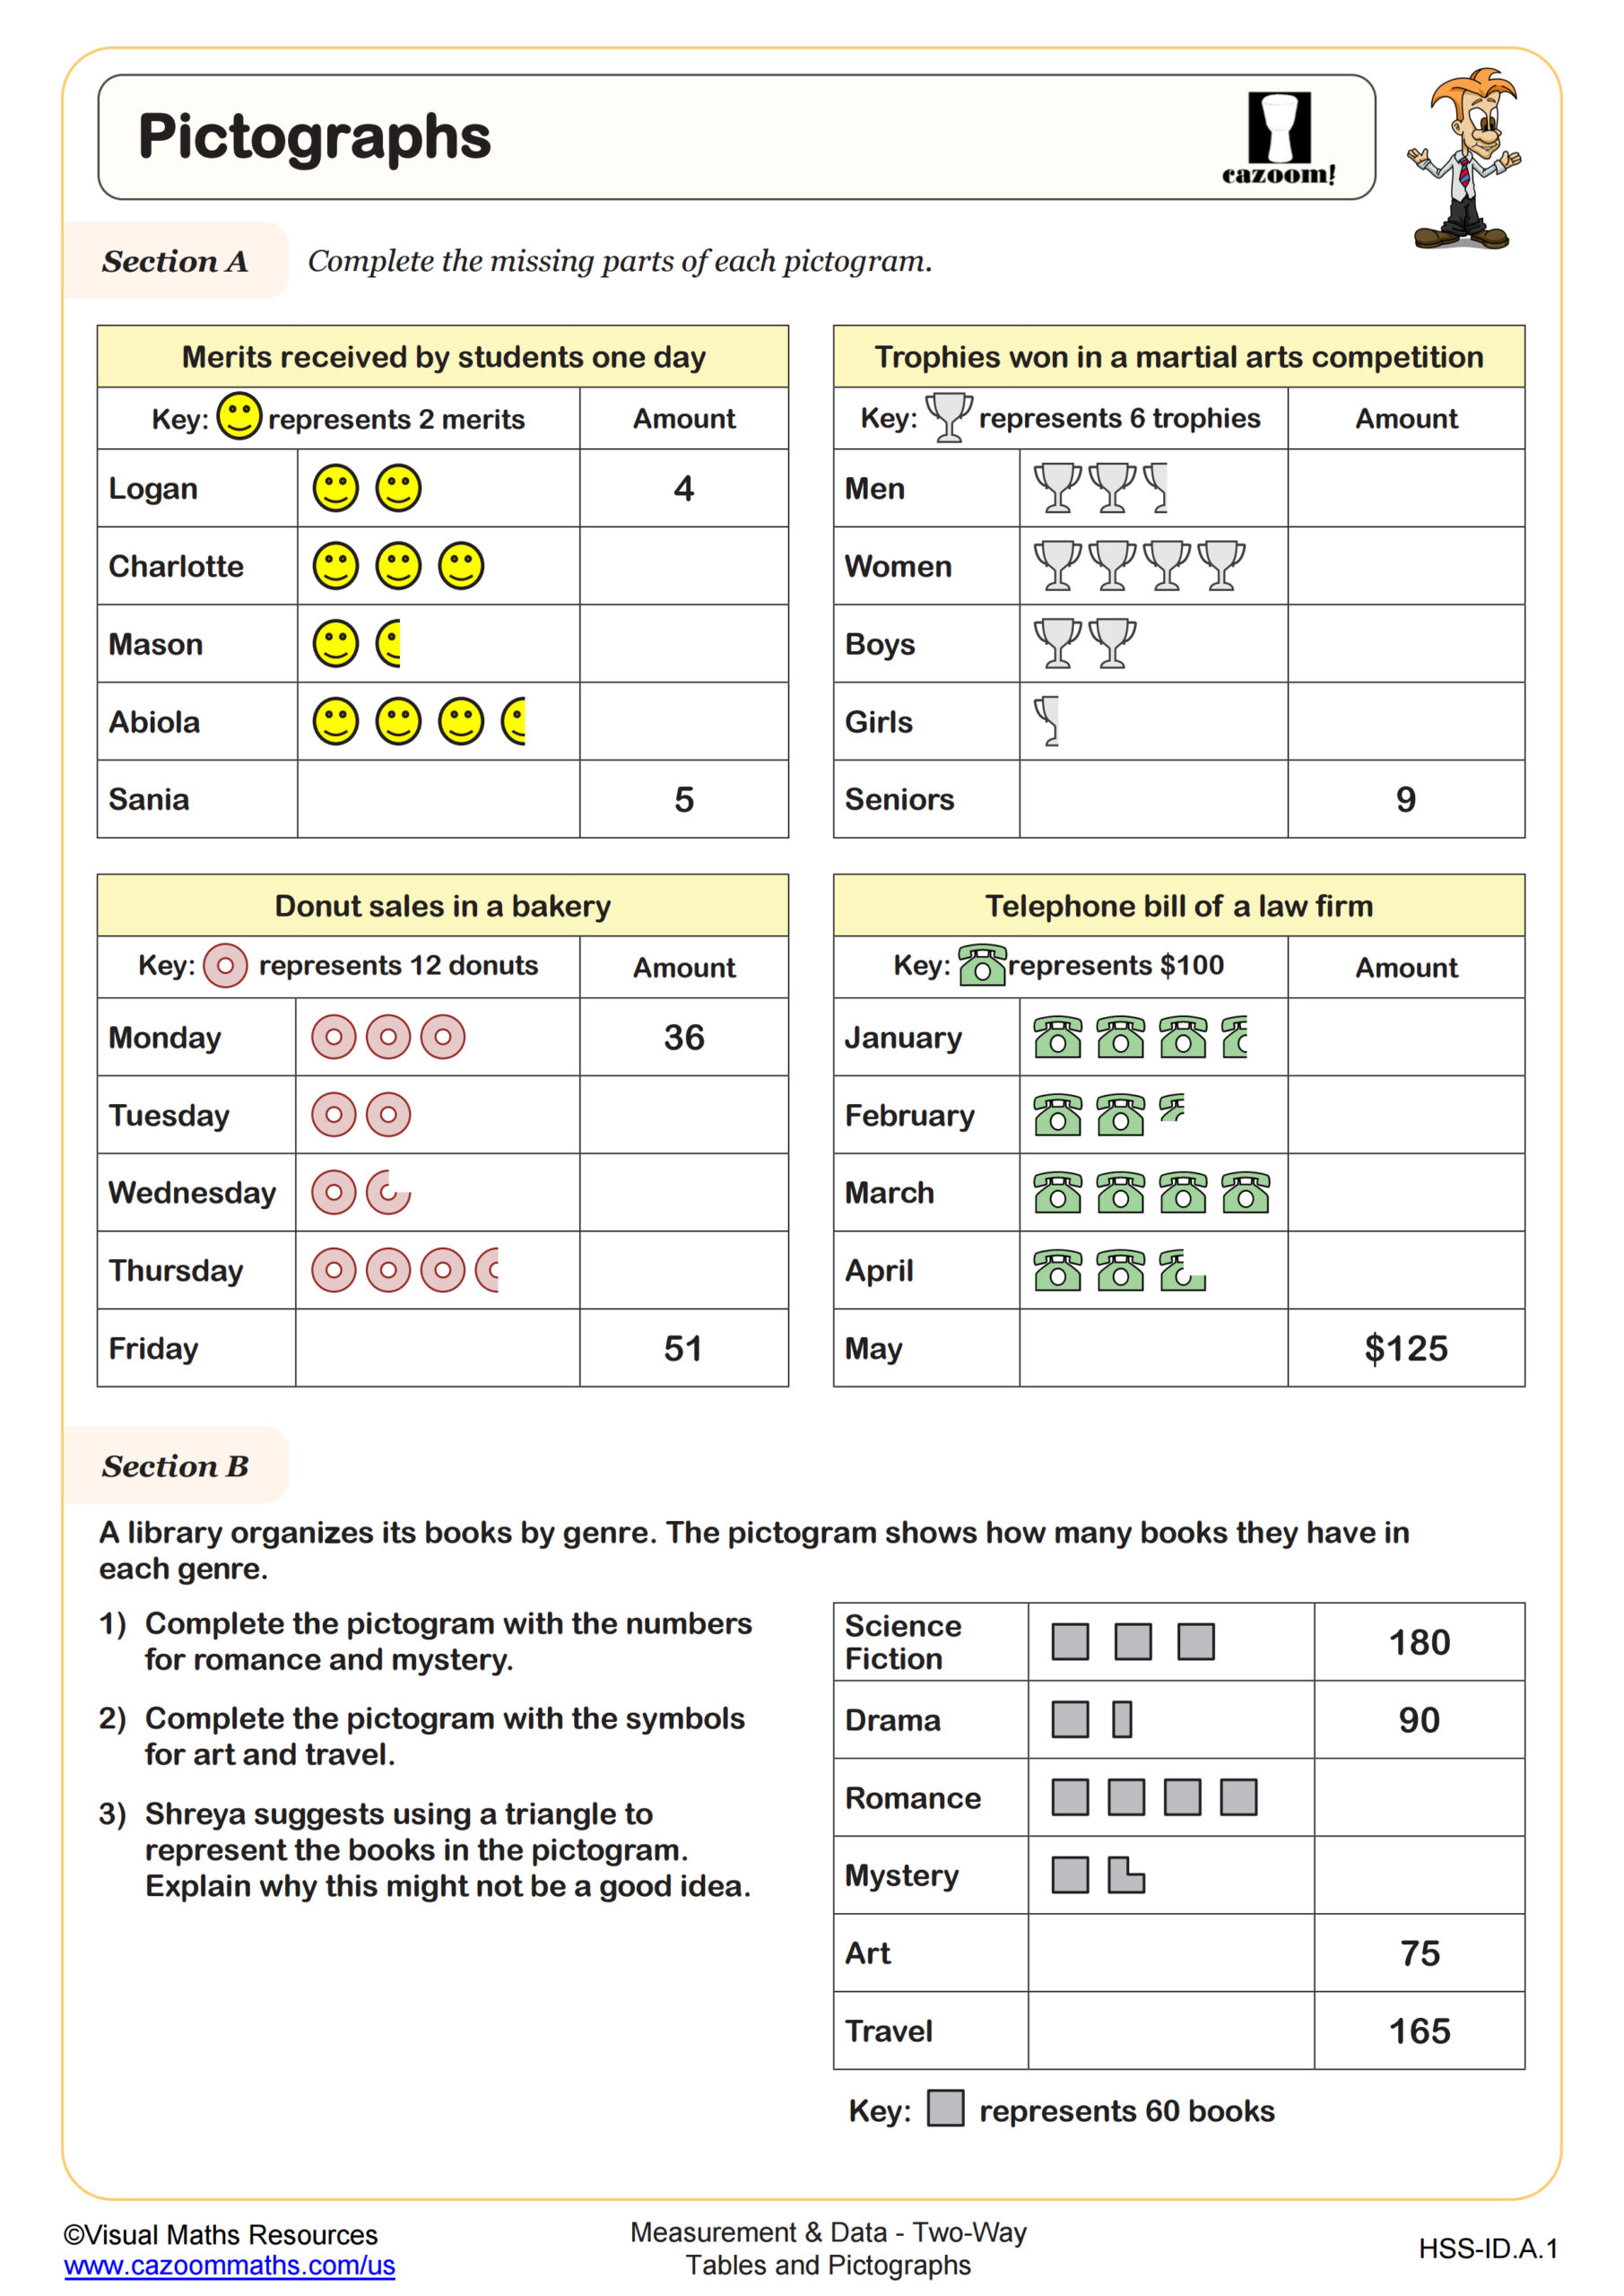
High school tables and pictographs worksheets align with Common Core standards for interpreting categorical and quantitative data. Students practice constructing two-way frequency tables, calculating joint and marginal frequencies, and analyzing relationships between variables. Pictograph exercises focus on scale interpretation, data representation, and drawing conclusions from visual displays.
Teachers notice students frequently miscalculate when pictograph symbols represent values other than one unit. For example, when each symbol equals 10 students, learners often count symbols instead of multiplying by the scale factor. This error appears most commonly in word problems requiring data extraction from complex pictographs with multiple categories.
How do high school two-way tables connect to earlier grade levels?
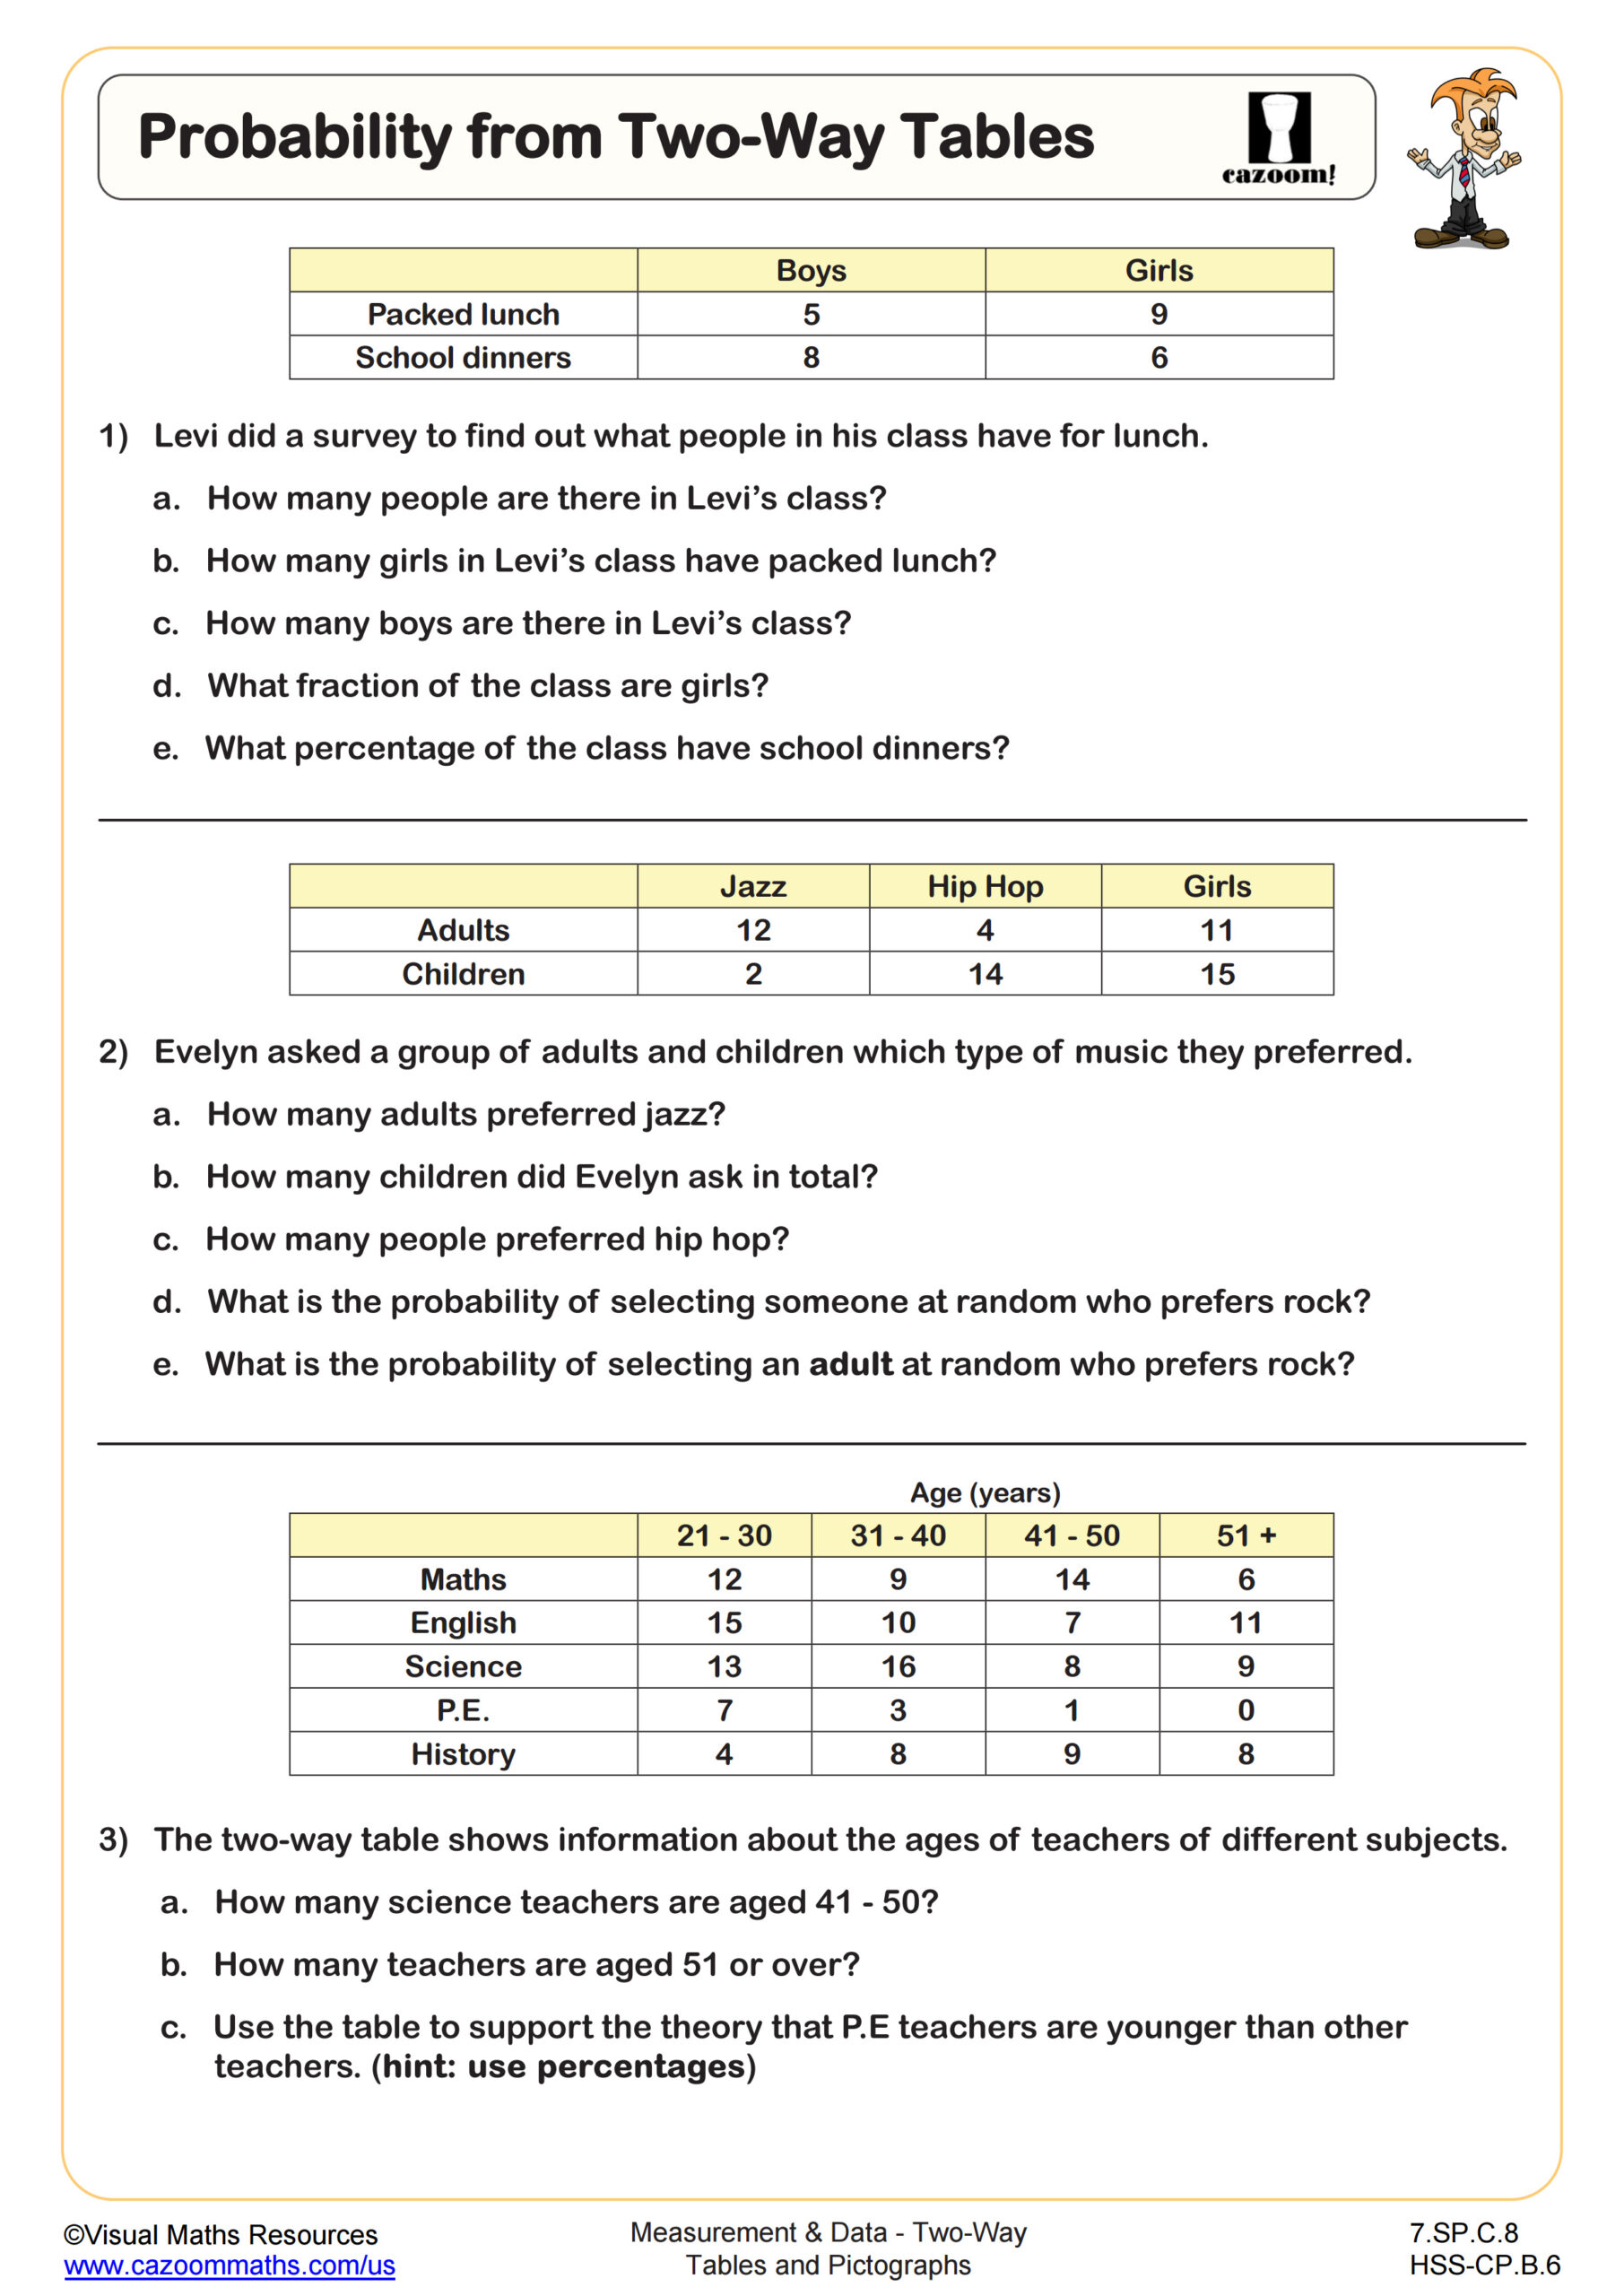
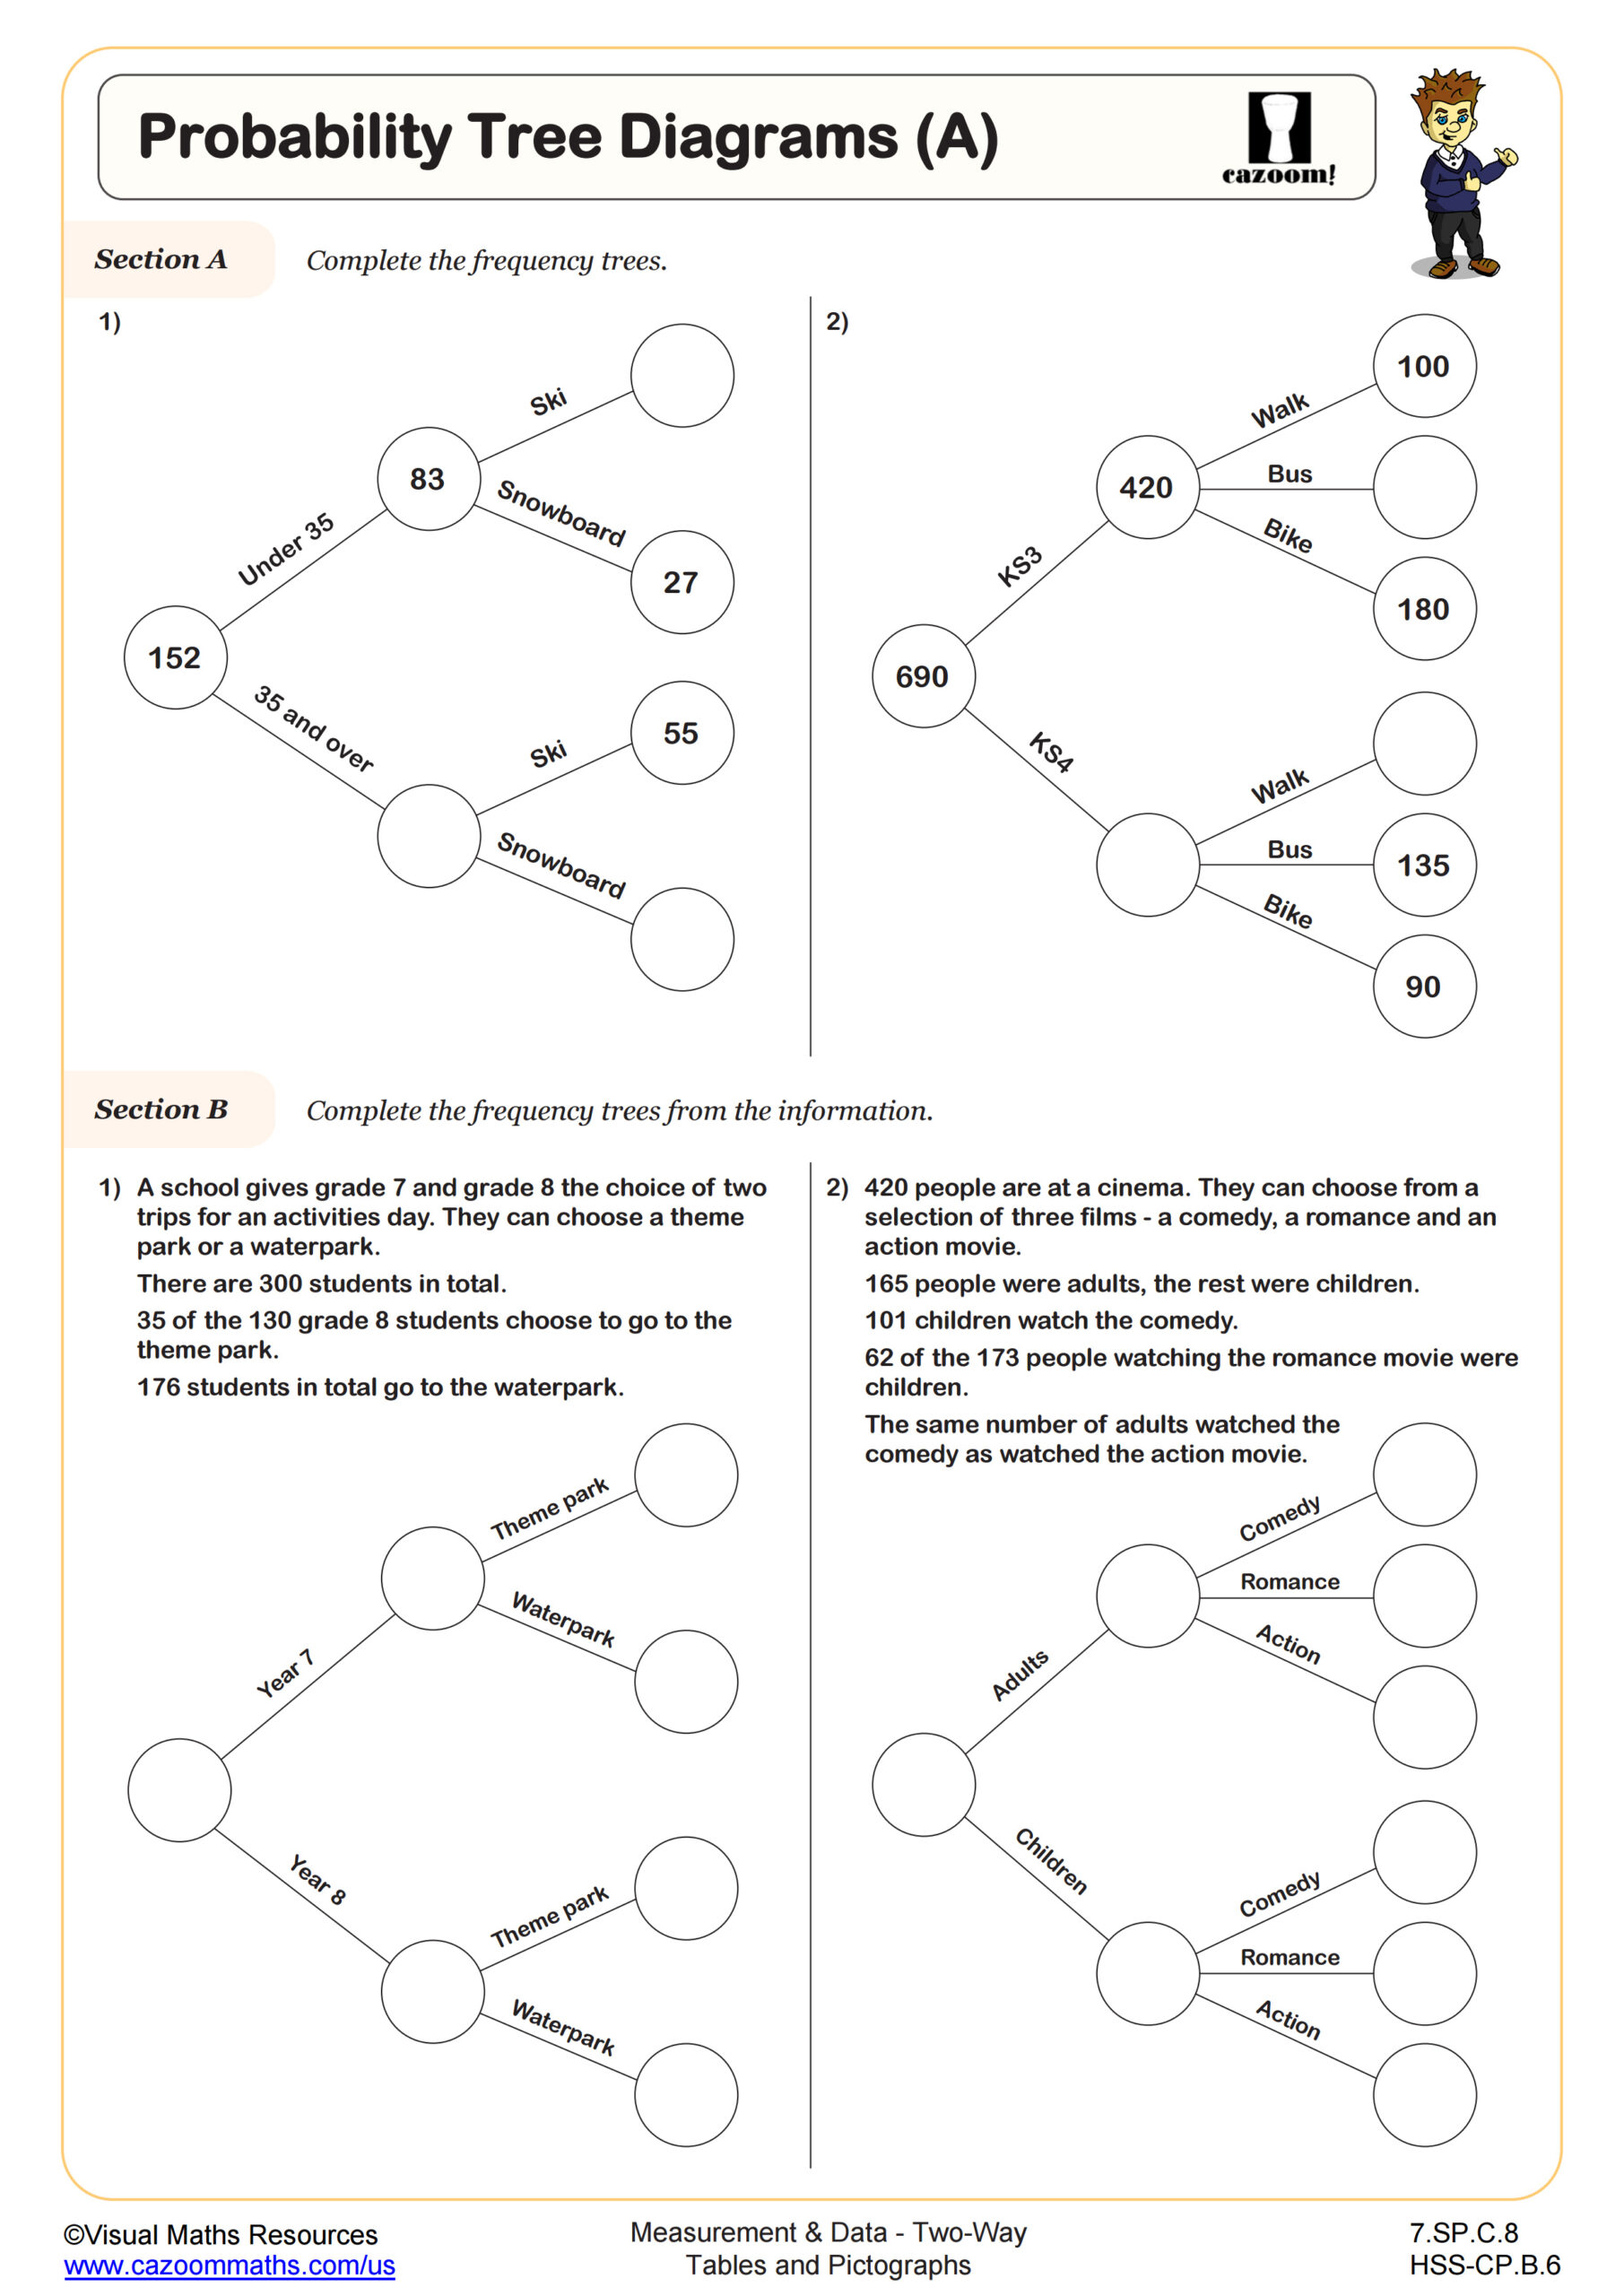
Two-way tables build directly on middle school frequency table foundations from grades 6-8. High school students extend this knowledge to analyze bivariate categorical data and calculate conditional probabilities. The progression moves from simple data organization to sophisticated statistical reasoning about associations between variables.
Many teachers find that students who mastered basic frequency tables in middle school still struggle with two-way table interpretation. The challenge lies in understanding joint versus marginal distributions. Students often confuse row totals with column totals when calculating conditional probabilities, requiring explicit instruction on table navigation and systematic problem-solving approaches.
Why do students find pictograph scale interpretation challenging?
Pictograph scales require proportional reasoning skills that many high school students haven't fully developed. When symbols represent fractional parts or large quantities, students must multiply rather than count, creating cognitive load that leads to calculation errors. This challenge intensifies when pictographs combine multiple data sets with different scales.
Classroom observations reveal that students perform better with pictographs when they first estimate answers before calculating. Teachers who incorporate this strategy see fewer computational mistakes. Additionally, having students create their own pictographs with specified scales reinforces the relationship between symbol quantity and actual data values, improving overall comprehension of scaled representations.
How can teachers maximize student success with these worksheets?
Effective implementation begins with modeling proper table construction and pictograph interpretation before independent practice. Teachers should demonstrate systematic approaches for reading data, such as always identifying row and column labels before extracting values. Pairing visual learners with analytical thinkers during collaborative exercises enhances comprehension for both learning styles.
Answer keys serve multiple purposes beyond grading. Teachers can use them to identify common error patterns across the class and adjust instruction accordingly. When students self-check their work using answer keys, they develop metacognitive skills and catch mistakes before formal assessment. This approach builds confidence while maintaining accountability for accurate data interpretation.