High School Two-Way Tables and Pictograms Worksheets
All worksheets are created by the team of experienced teachers at Cazoom Math.
What Are Two-Way Tables and Why Do High School Students Study Them?
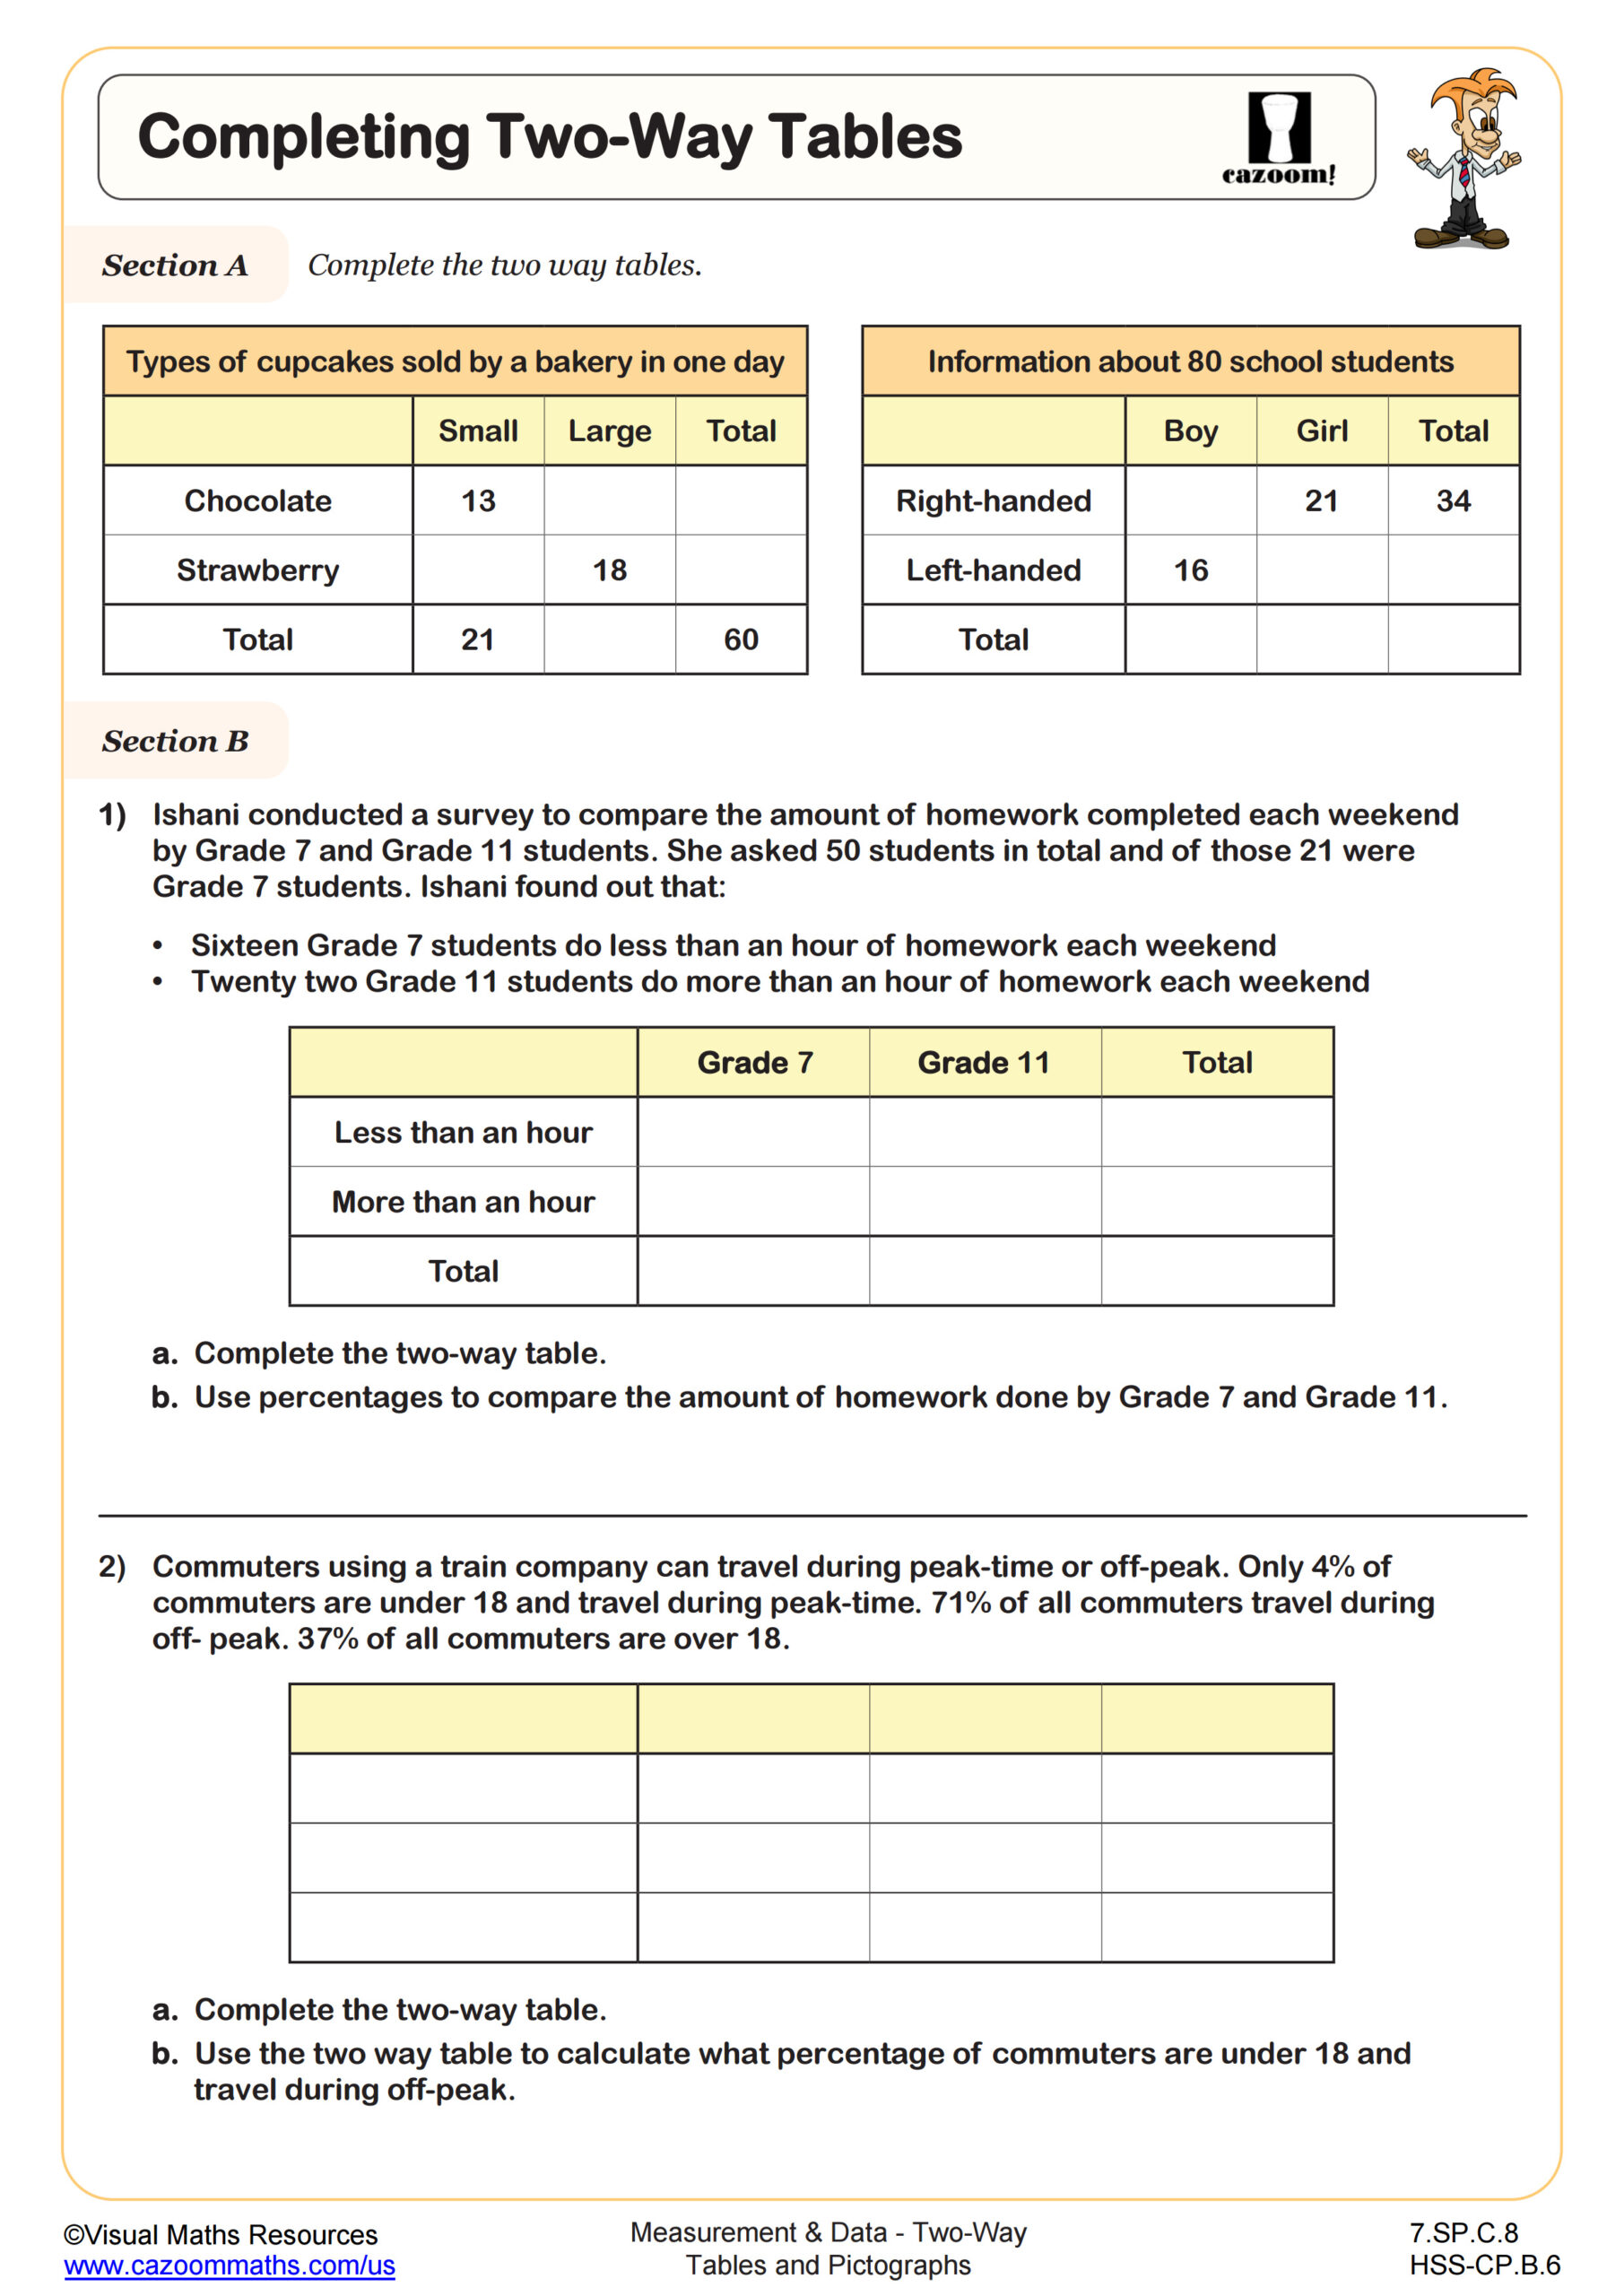
Two-way tables, also called contingency tables, organize categorical data by displaying the frequency of observations that fall into two different categories simultaneously. High school students encounter these in Algebra I through Precalculus as part of statistics and probability standards, where they learn to identify patterns, calculate relative frequencies, and determine conditional probabilities from organized data sets.
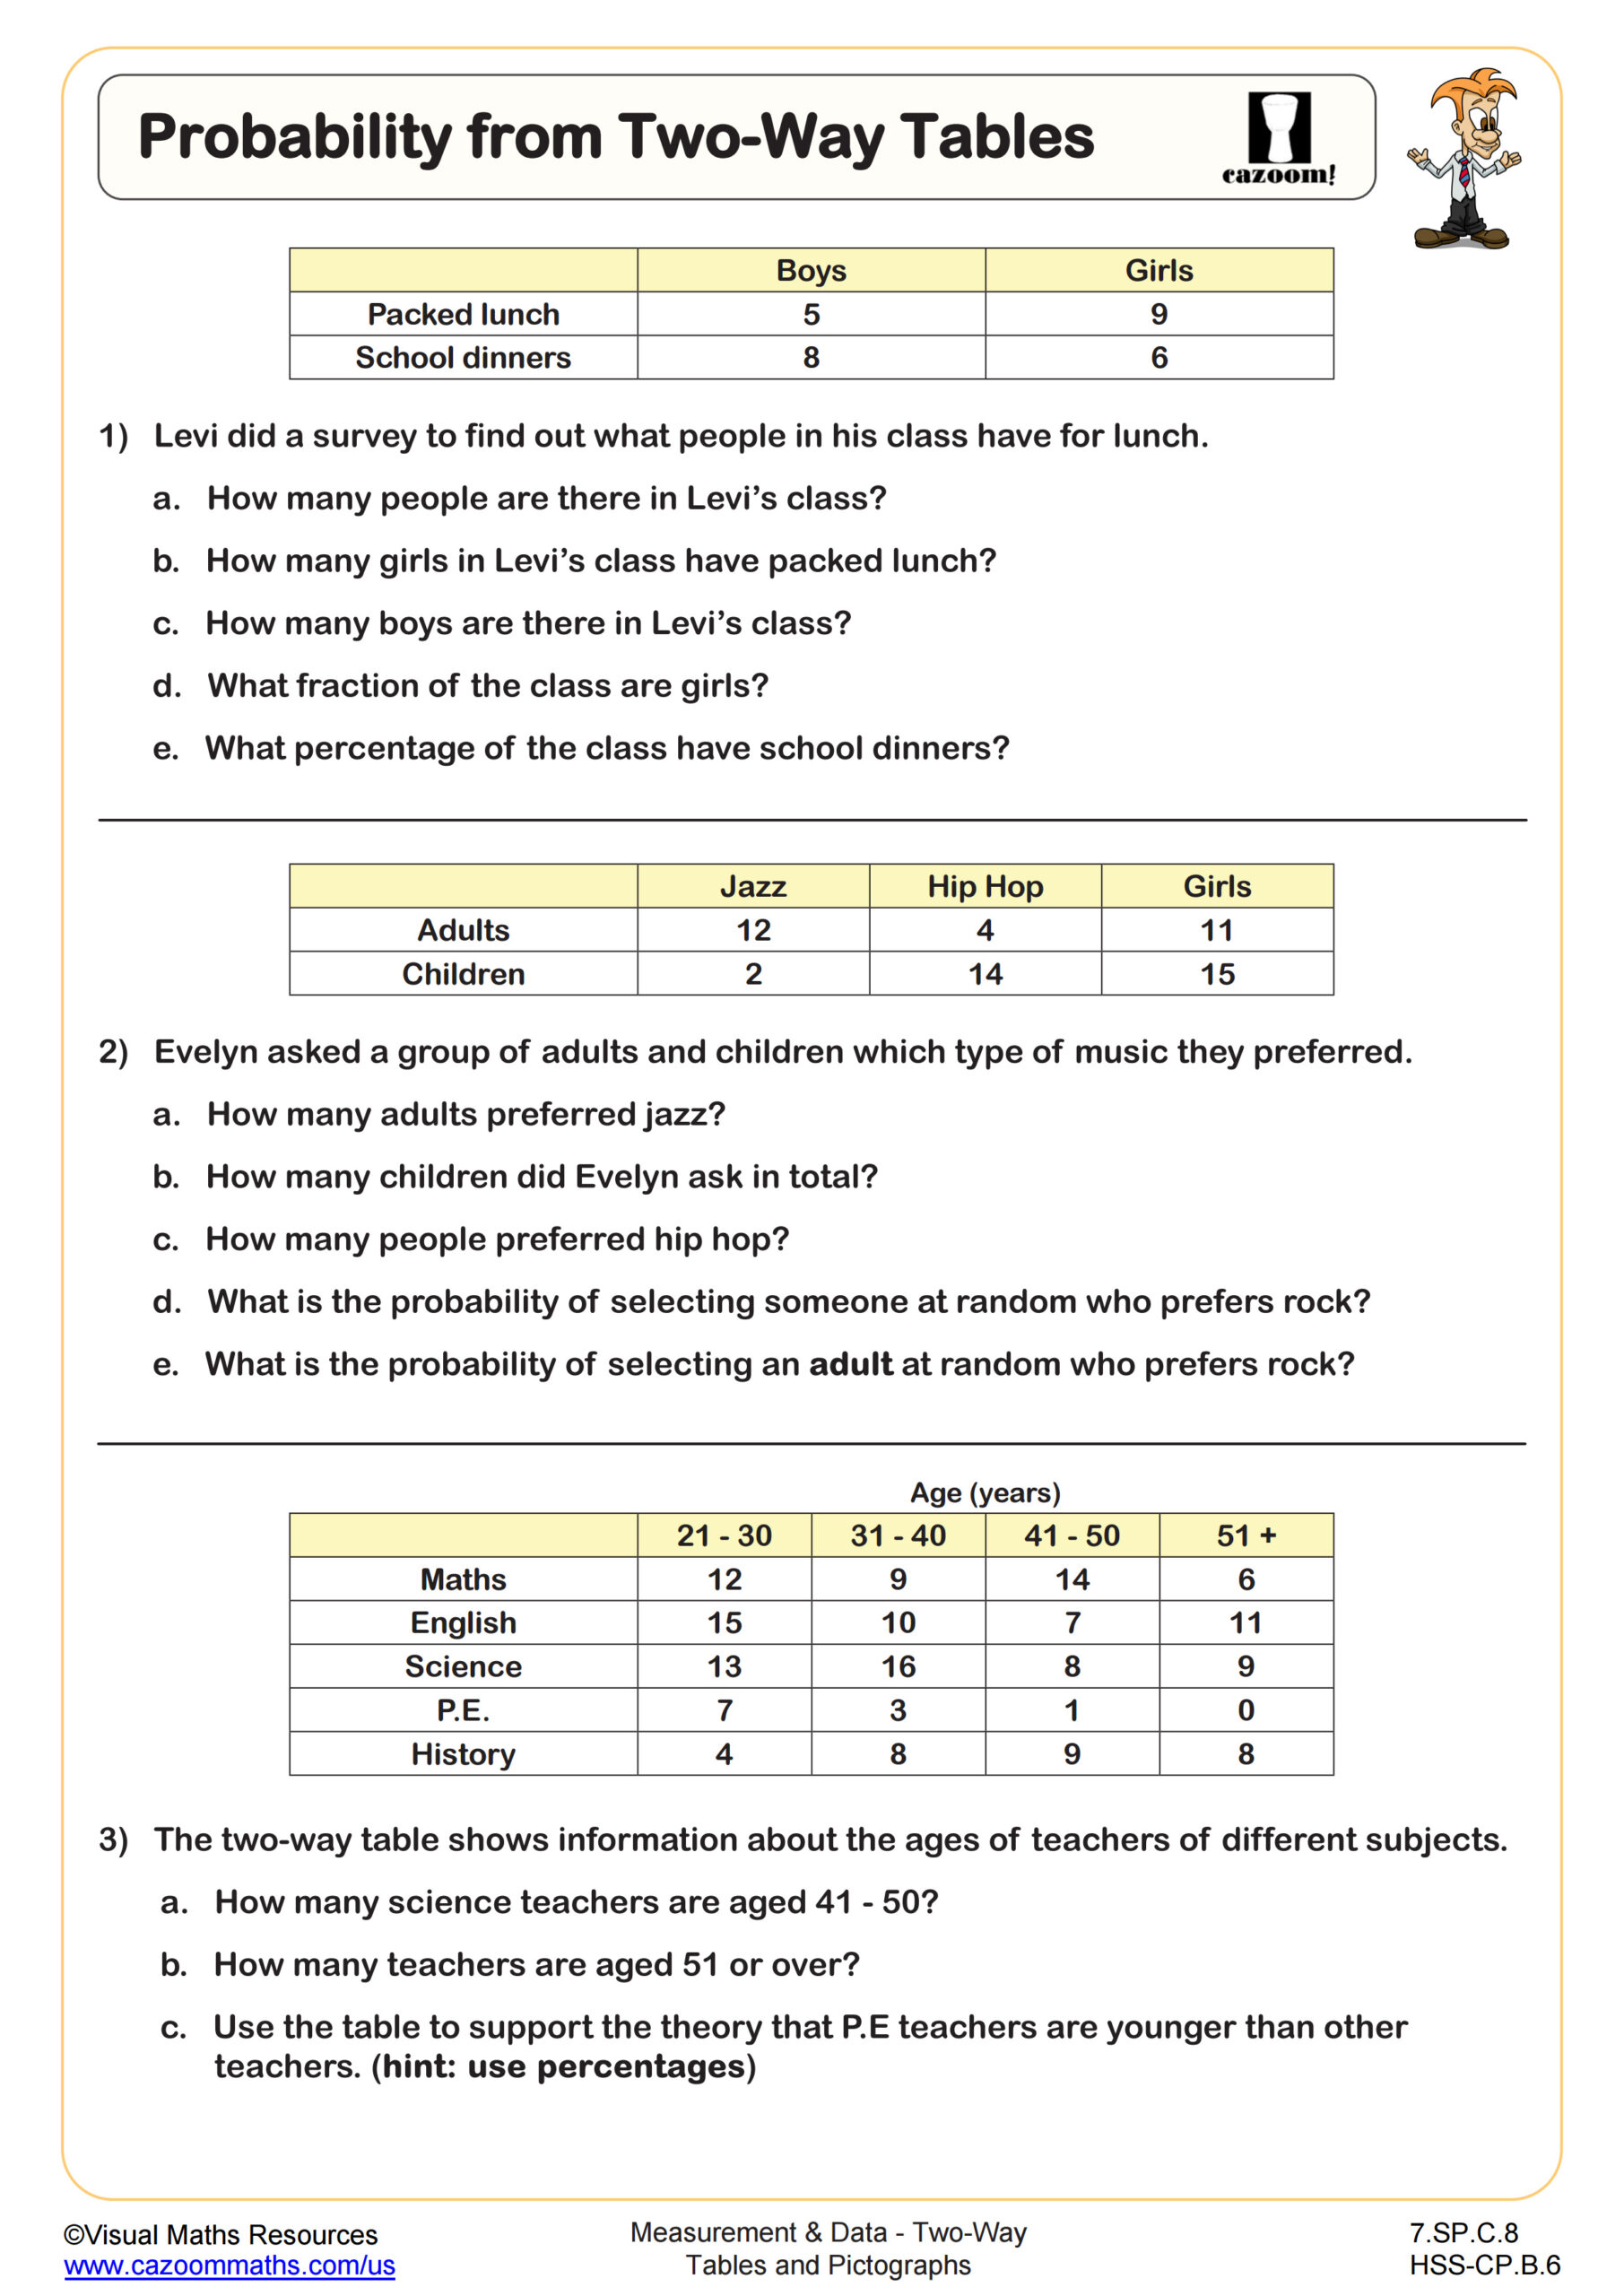
Teachers frequently notice that students initially treat two-way tables like simple addition charts, forgetting that the marginal totals provide context for calculating meaningful probabilities. Students lose points on standardized tests when they identify a cell value but fail to divide by the correct total, such as using the grand total when the question asks for a probability within a specific category. The breakthrough typically happens when students start labeling their work with "out of" language before calculating.
Which Grade Levels Cover Two-Way Tables and Pictograms?
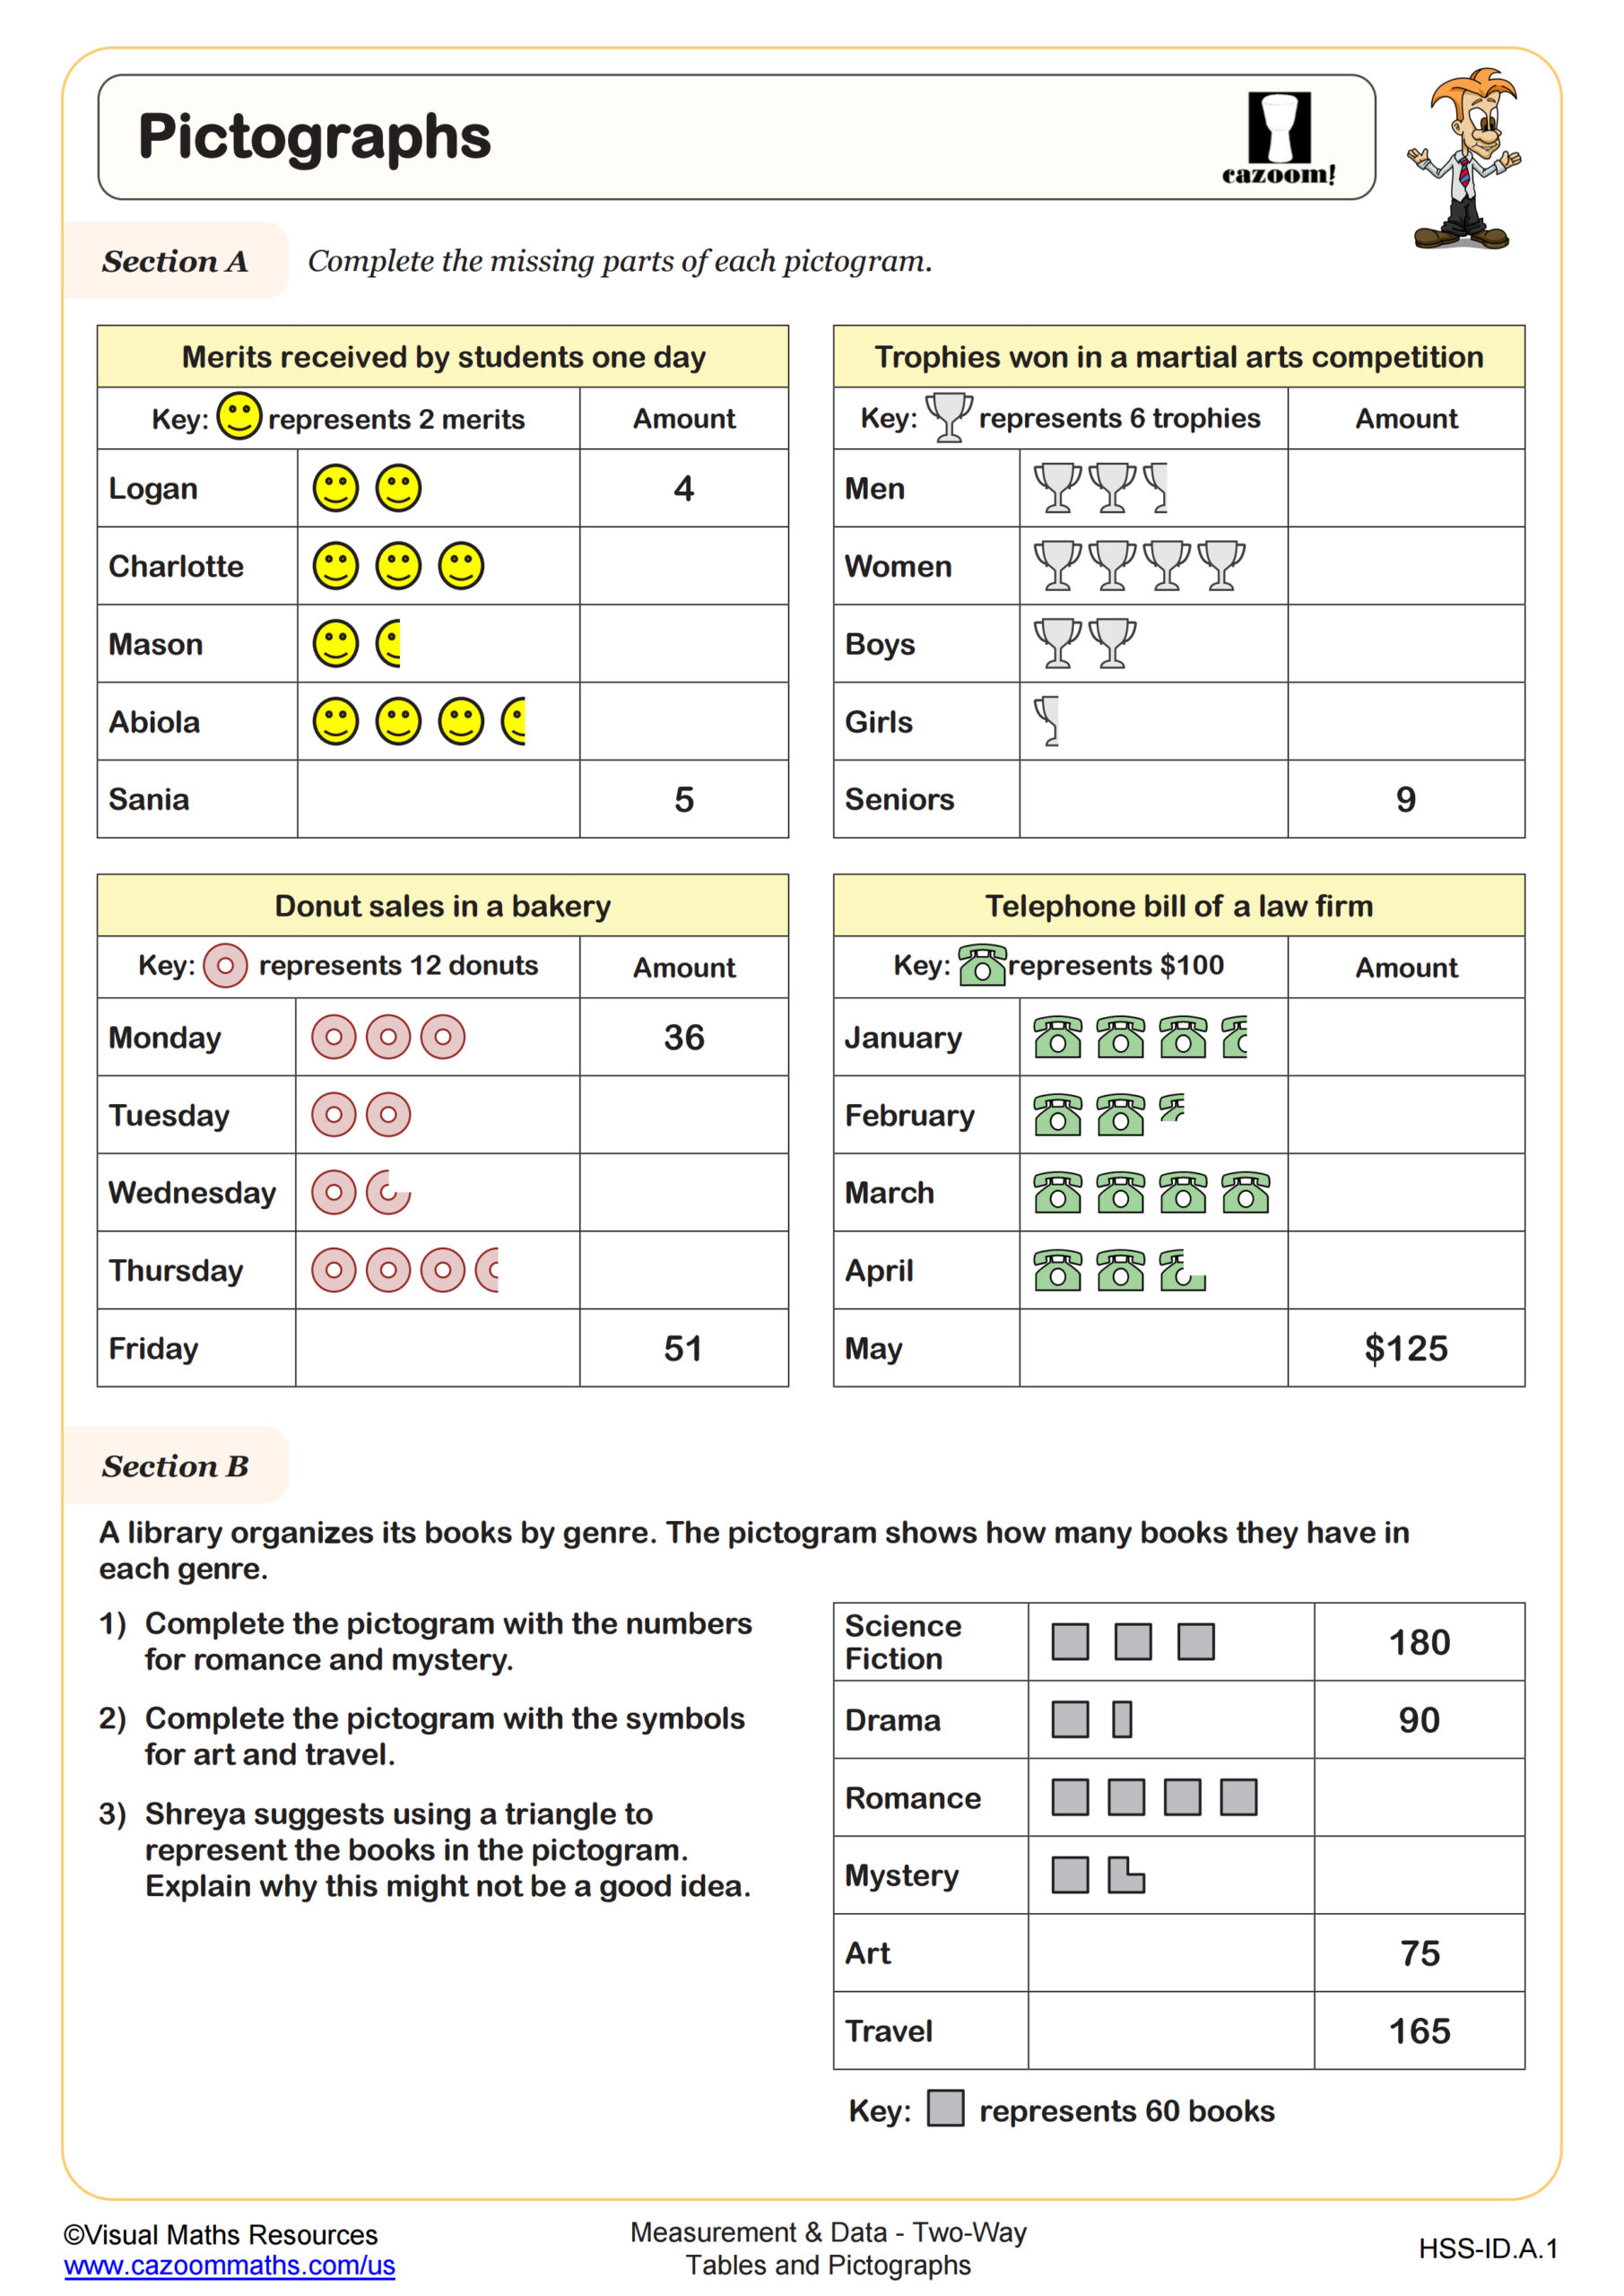
These worksheets align with high school mathematics courses including Algebra I, Algebra II, Geometry, Precalculus, and Integrated Math I, II, and III. While pictograms appear in elementary grades with simple one-to-one correspondence, high school versions require students to interpret scaled symbols and extract data for further analysis, including probability calculations that connect to Common Core standards for conditional probability and independence.
The progression deepens across grade levels as students move from simply completing tables to analyzing relationships between variables. Algebra I students focus on reading and constructing two-way tables with basic probability calculations, while Algebra II and Precalculus students work with conditional probability, independence testing, and tree diagrams that model sequential events. Integrated Math courses spiral through these concepts, building complexity each year.
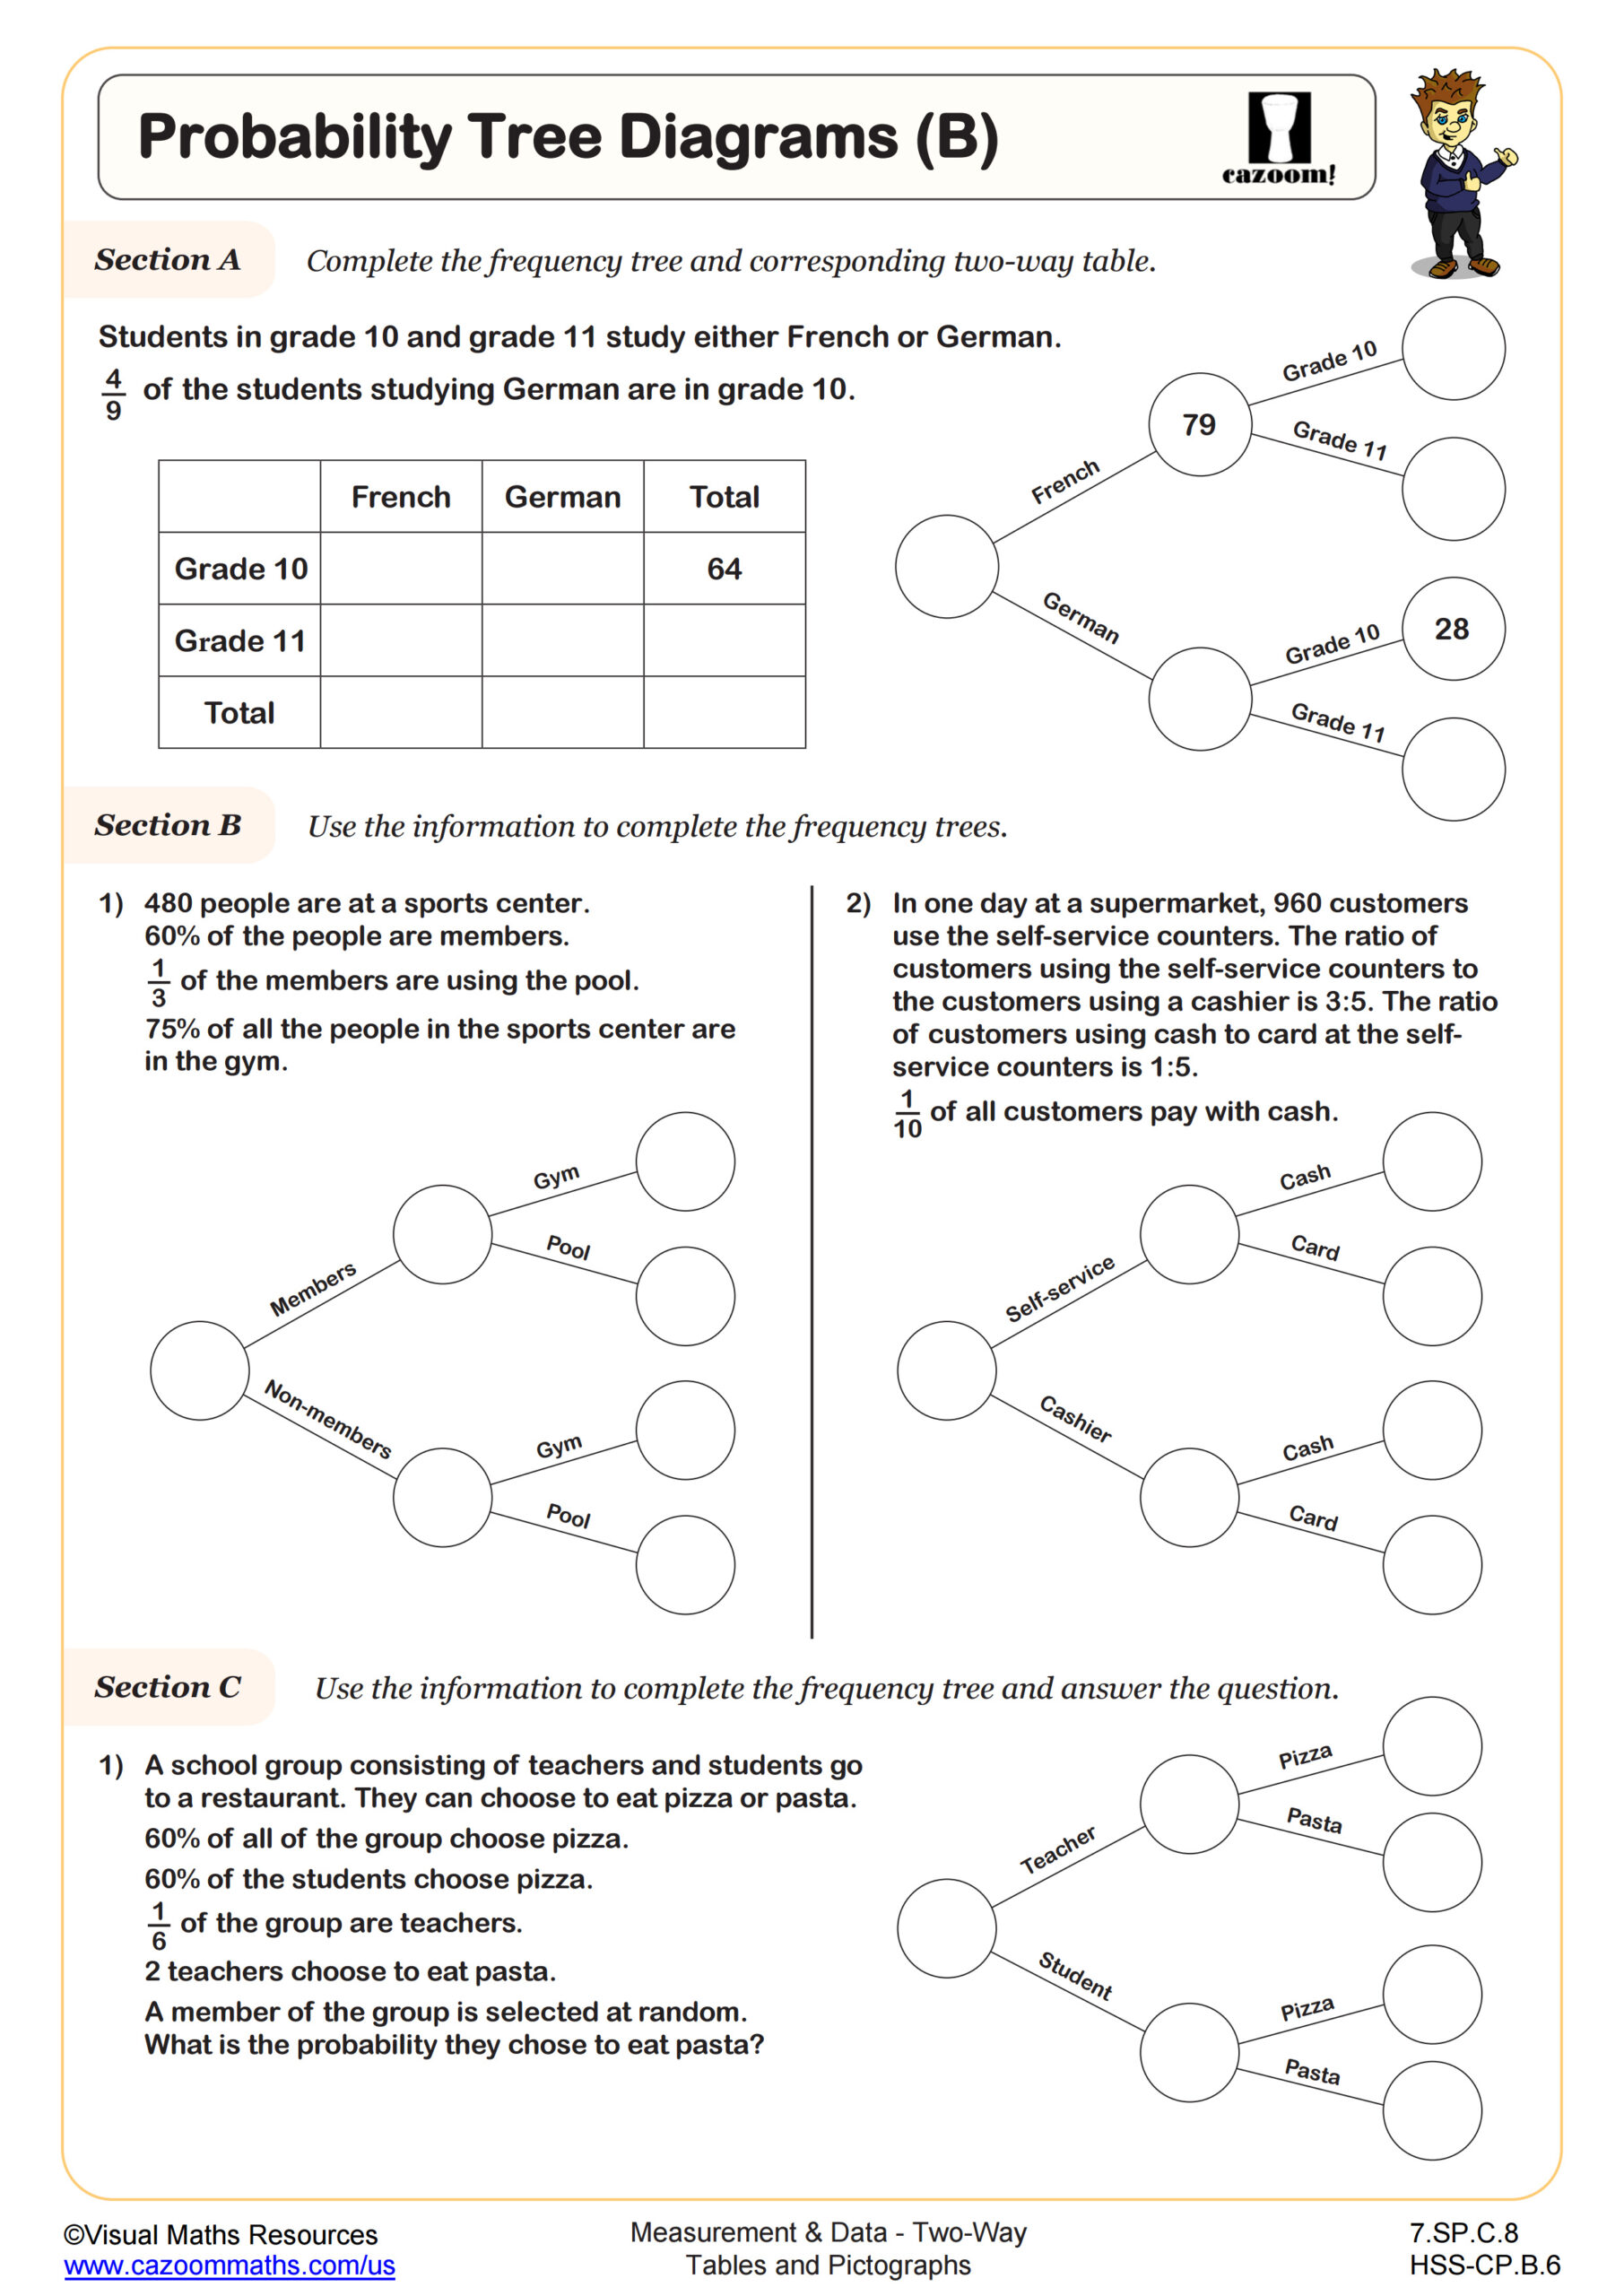
How Do Probability Tree Diagrams Connect to Two-Way Tables?
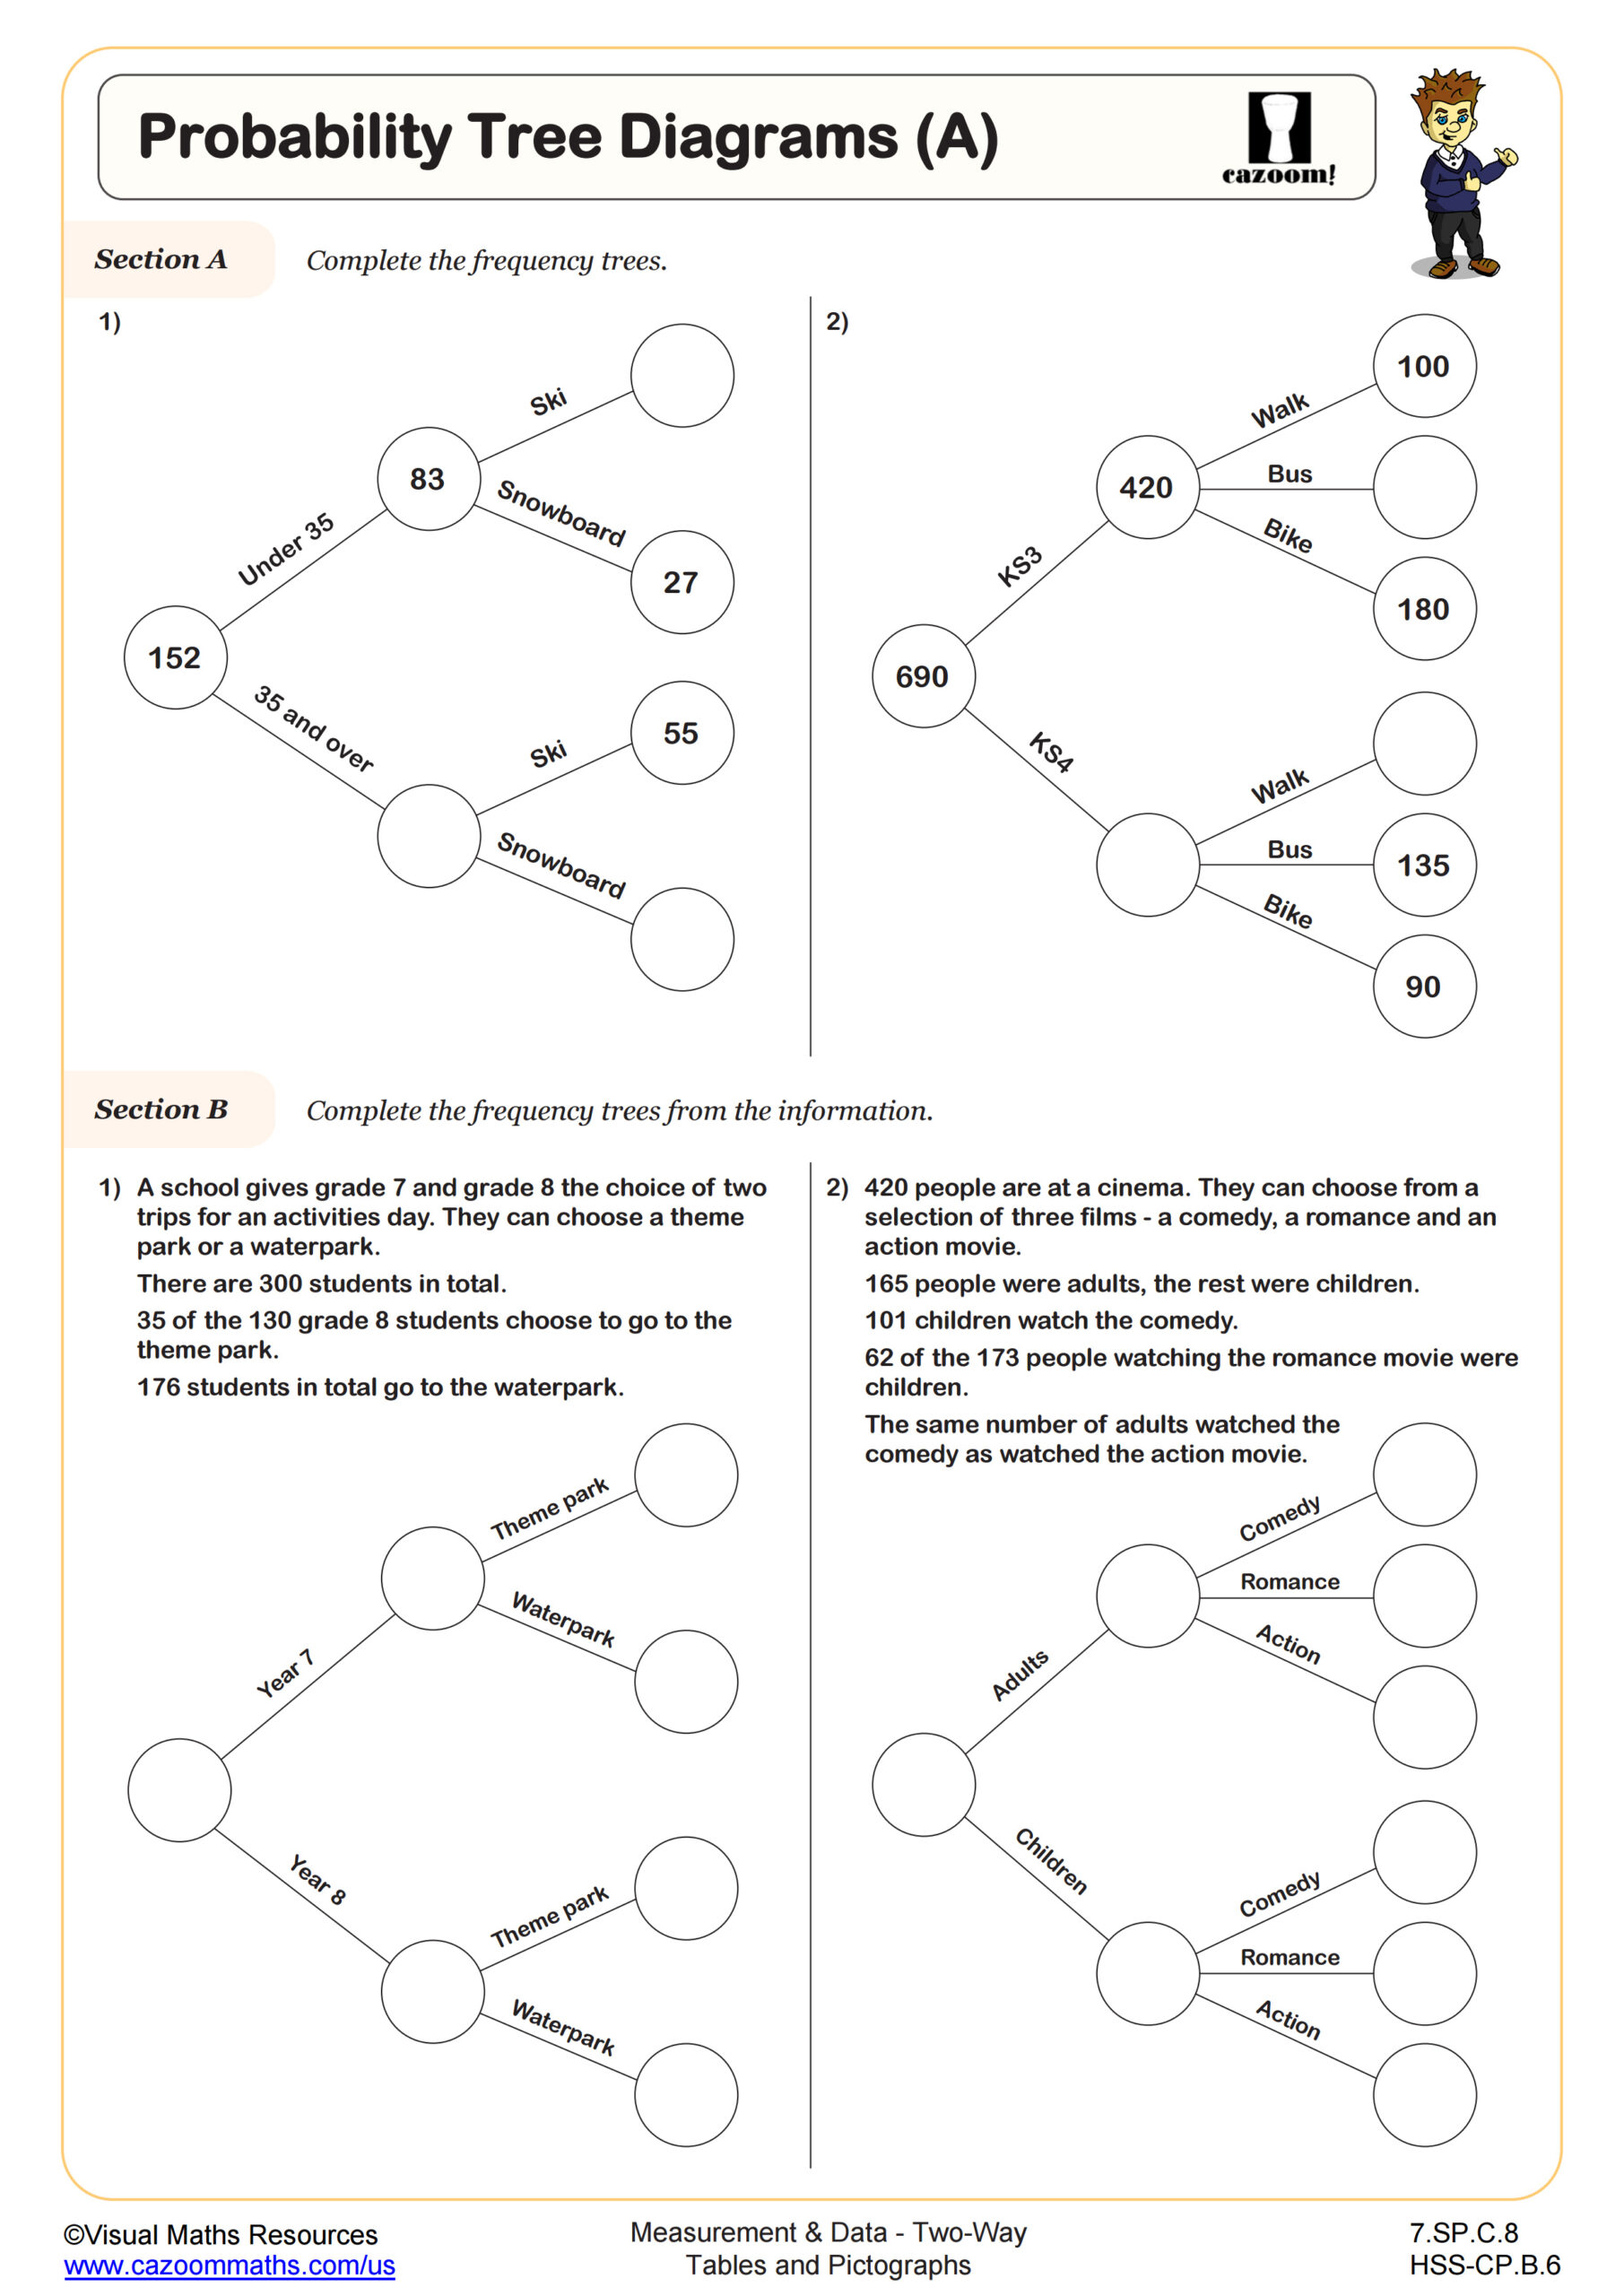
Probability tree diagrams provide a visual method for calculating probabilities of sequential or compound events by mapping all possible outcomes along branches, with probabilities labeled on each path. Students multiply along branches to find the probability of a specific sequence and add across endpoints to determine overall probabilities for events that can occur through multiple pathways. This connects directly to two-way tables because the same data can be represented in either format.
Public health professionals use tree diagrams to calculate diagnostic accuracy rates when medical tests have known sensitivity and specificity values. For example, understanding the probability that a positive test result truly indicates disease requires conditional probability thinking that students develop through these worksheets. This same reasoning appears in quality control testing, weather forecasting models, and machine learning algorithms that assess classification accuracy, making tree diagram fluency valuable for STEM careers.
How Can Teachers Use These Two-Way Table Worksheets in the Classroom?
The worksheets provide structured practice that builds from foundational table completion to complex probability applications, allowing teachers to assign problems that match current instructional focus. Complete answer keys enable students to check their work during independent practice or allow teachers to quickly review common errors during whole-class discussion. The progression from completing tables to interpreting pictographs to calculating probabilities mirrors the cognitive scaffolding students need.
Many teachers find these worksheets effective for intervention with students who struggle during data analysis units or as review before chapter assessments and state tests. They work well in paired activities where one student completes the table while another calculates probabilities, then partners compare answers using the key. Teachers also assign specific subtopics as homework to reinforce lessons on conditional probability or use the tree diagram worksheets during stations rotations when differentiating instruction across multiple probability representations.