Integrated Math 1 Real Life Graphs Worksheets
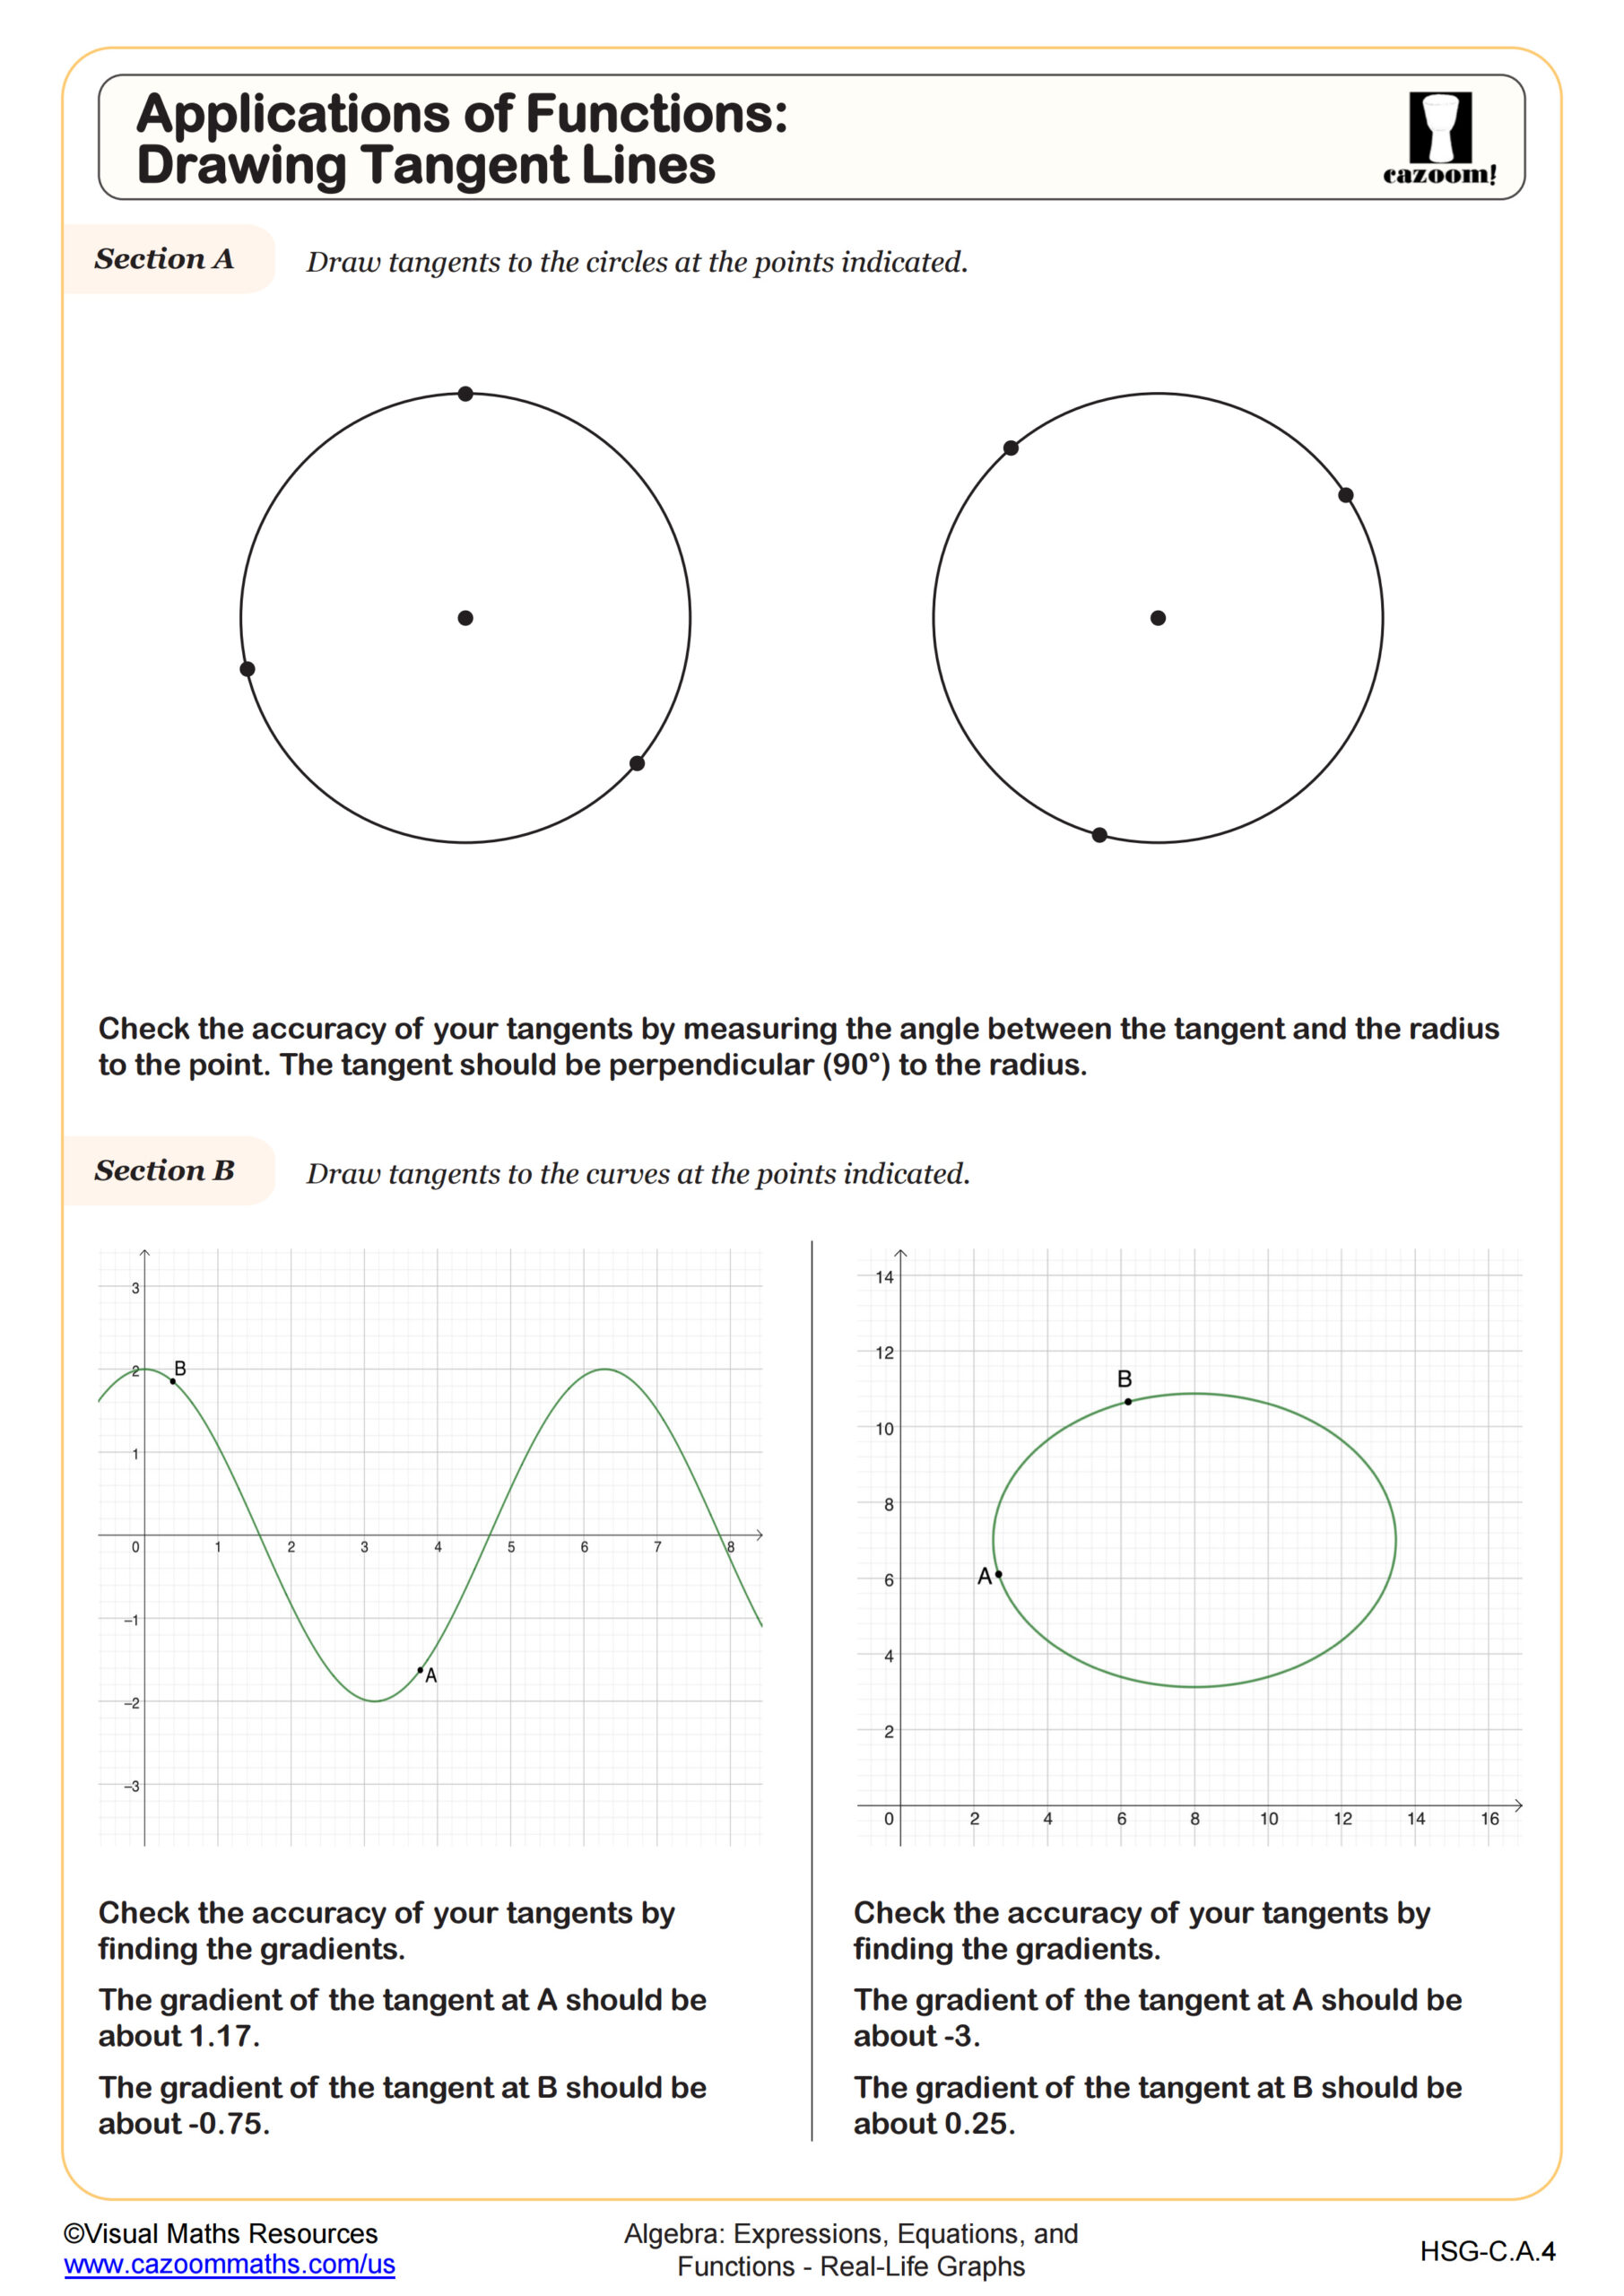
Applications of Functions: Drawing Tangent Lines
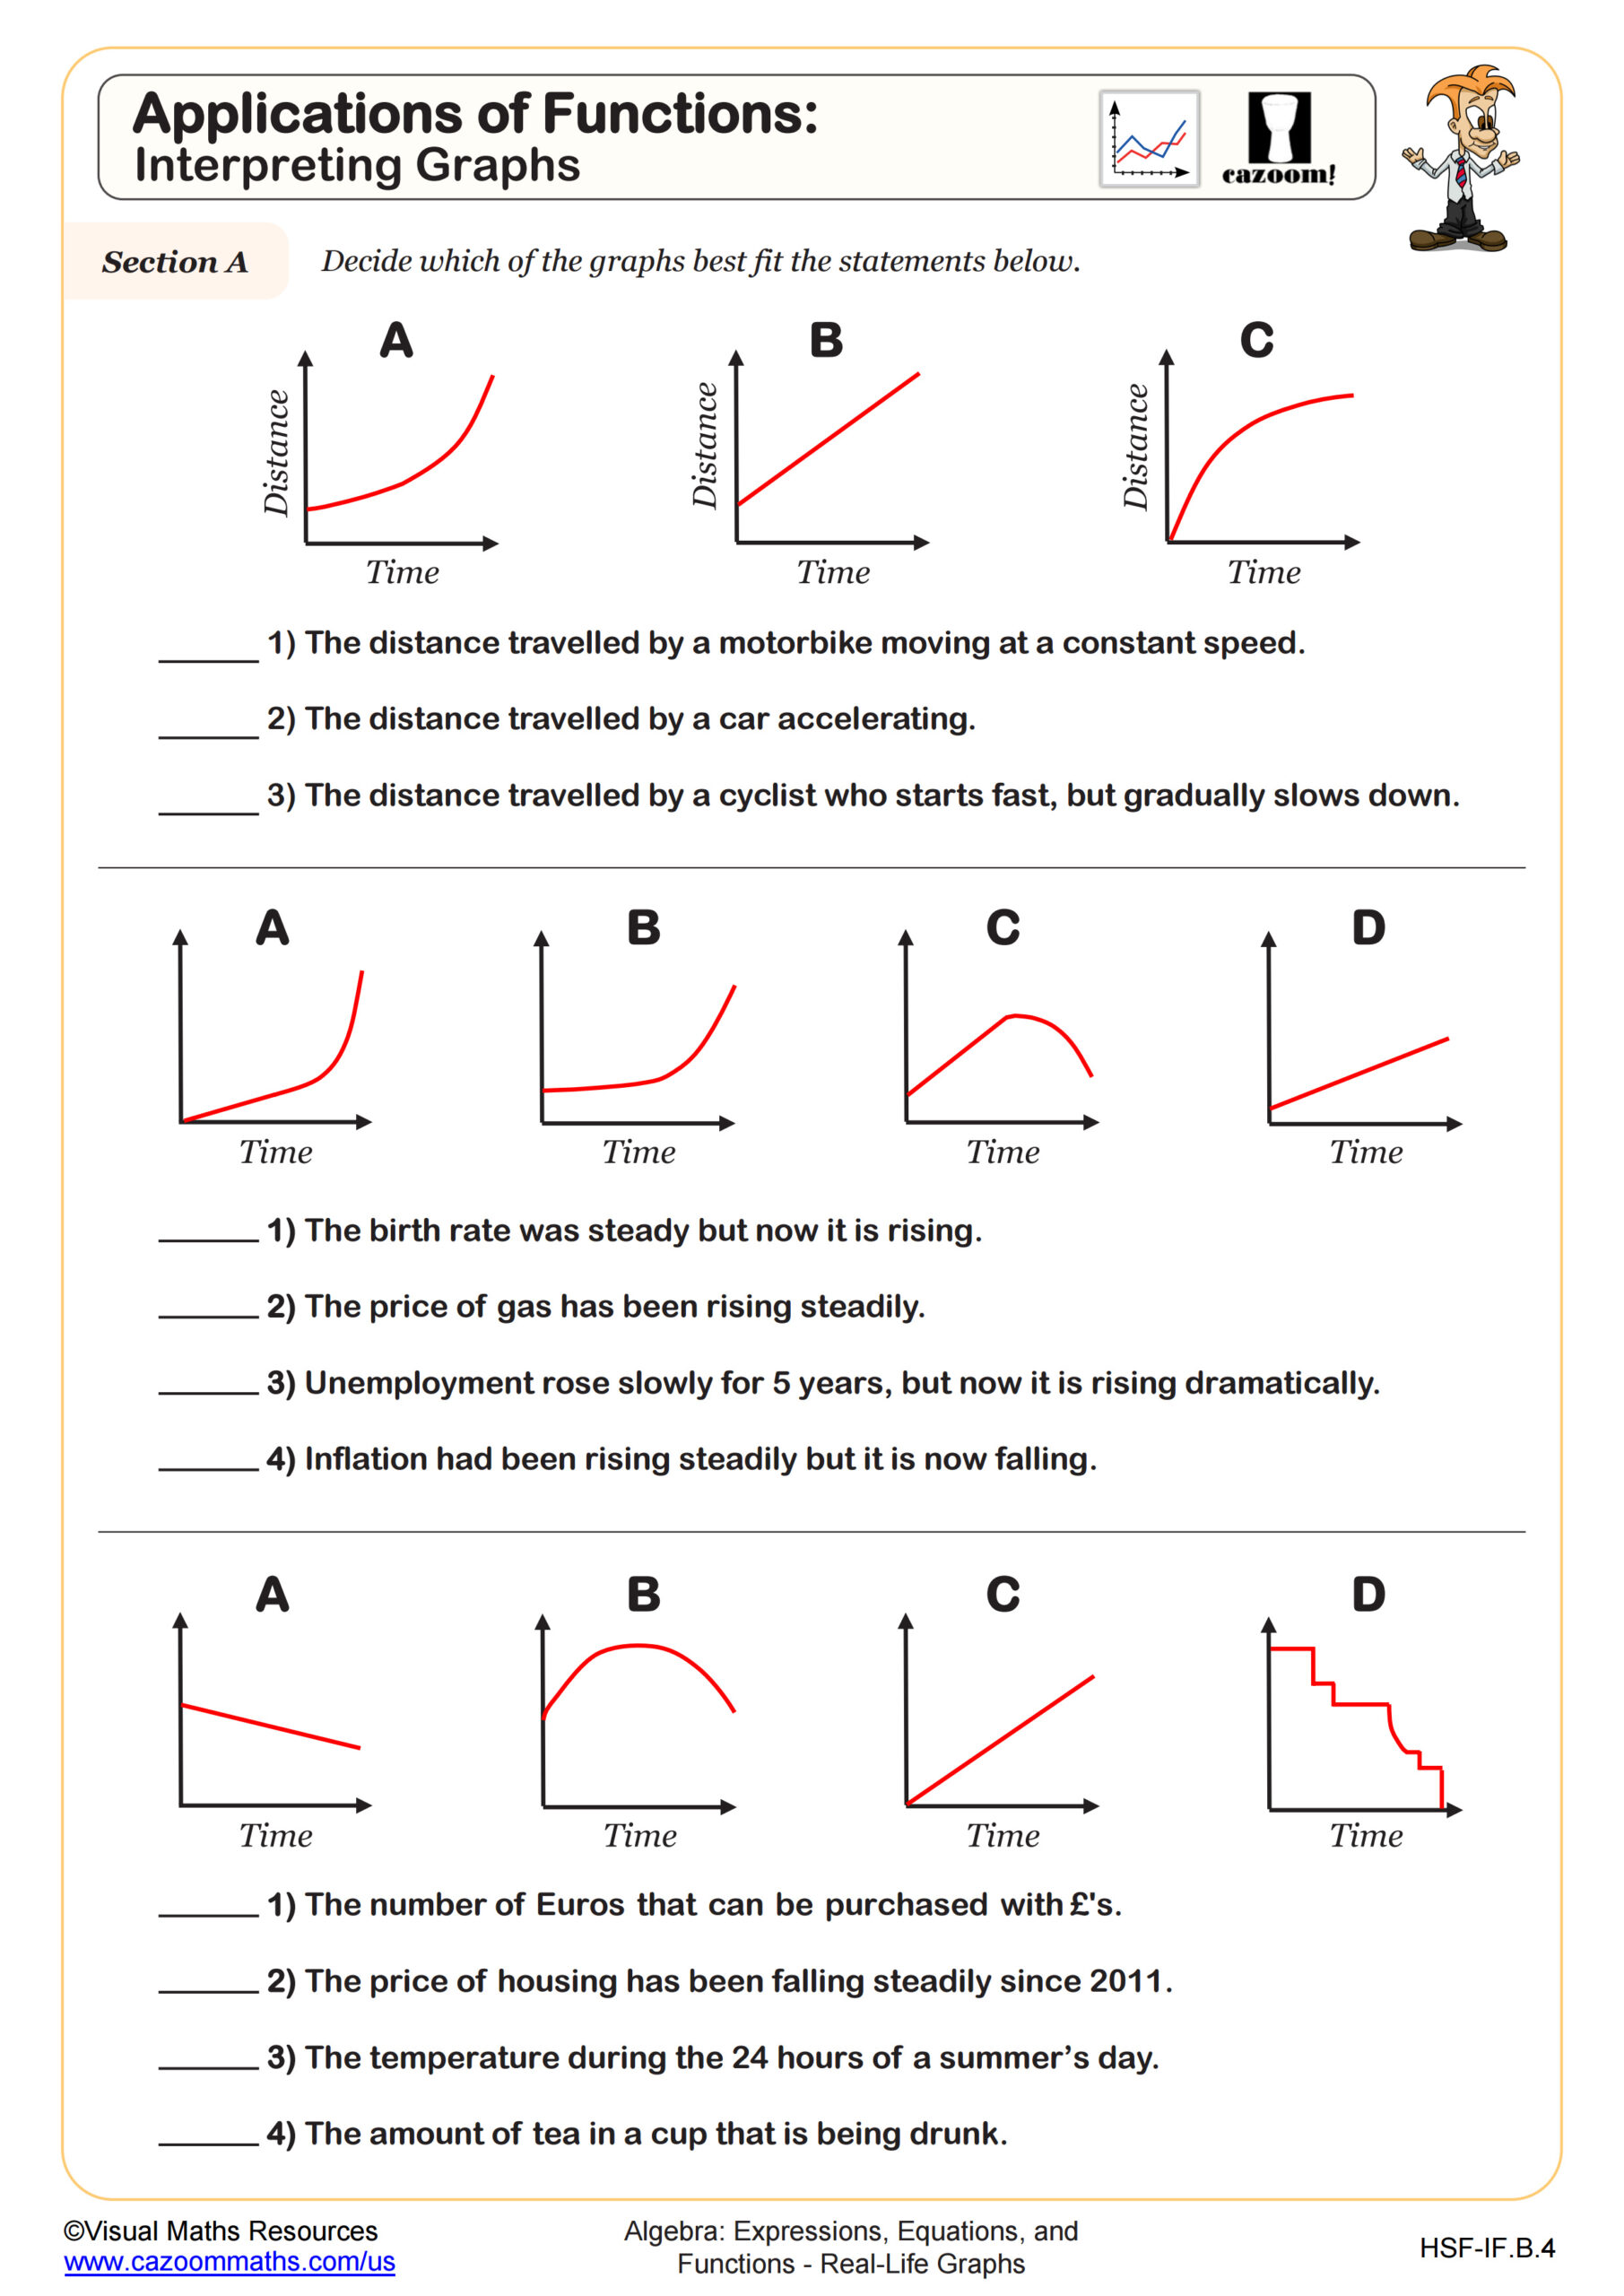
Applications of Functions: Interpreting Graphs
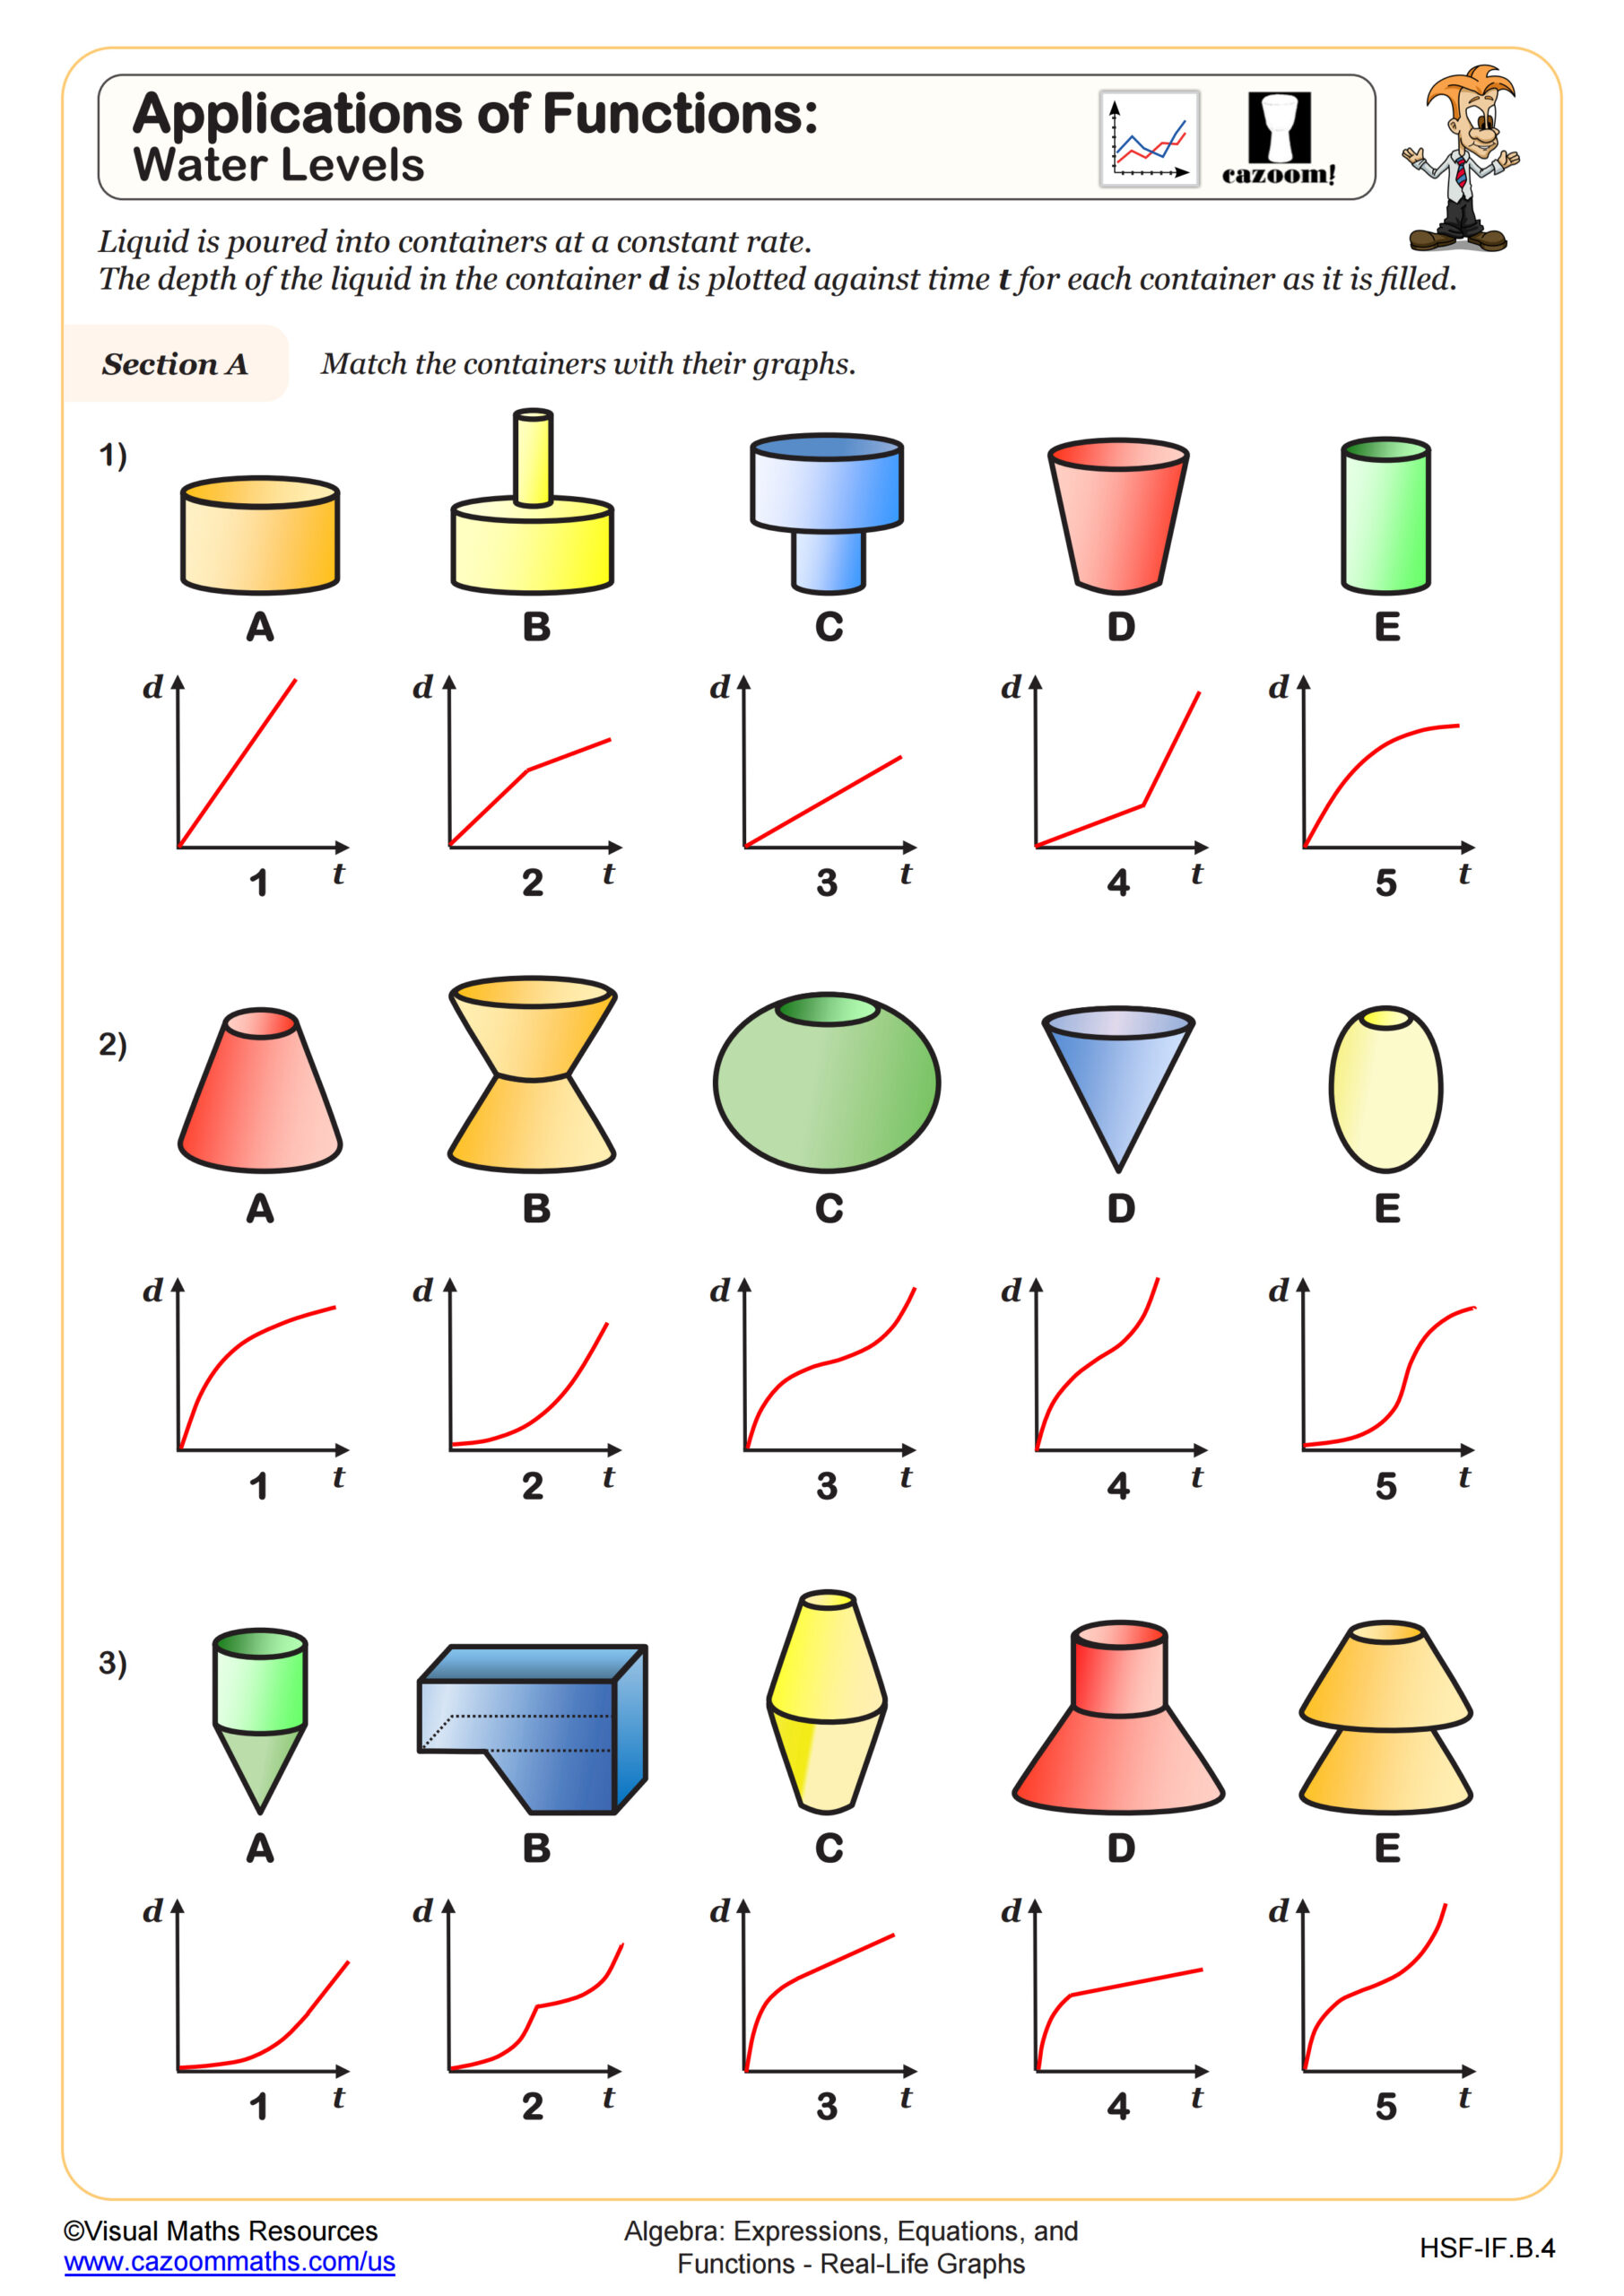
Applications of Functions: Water Levels
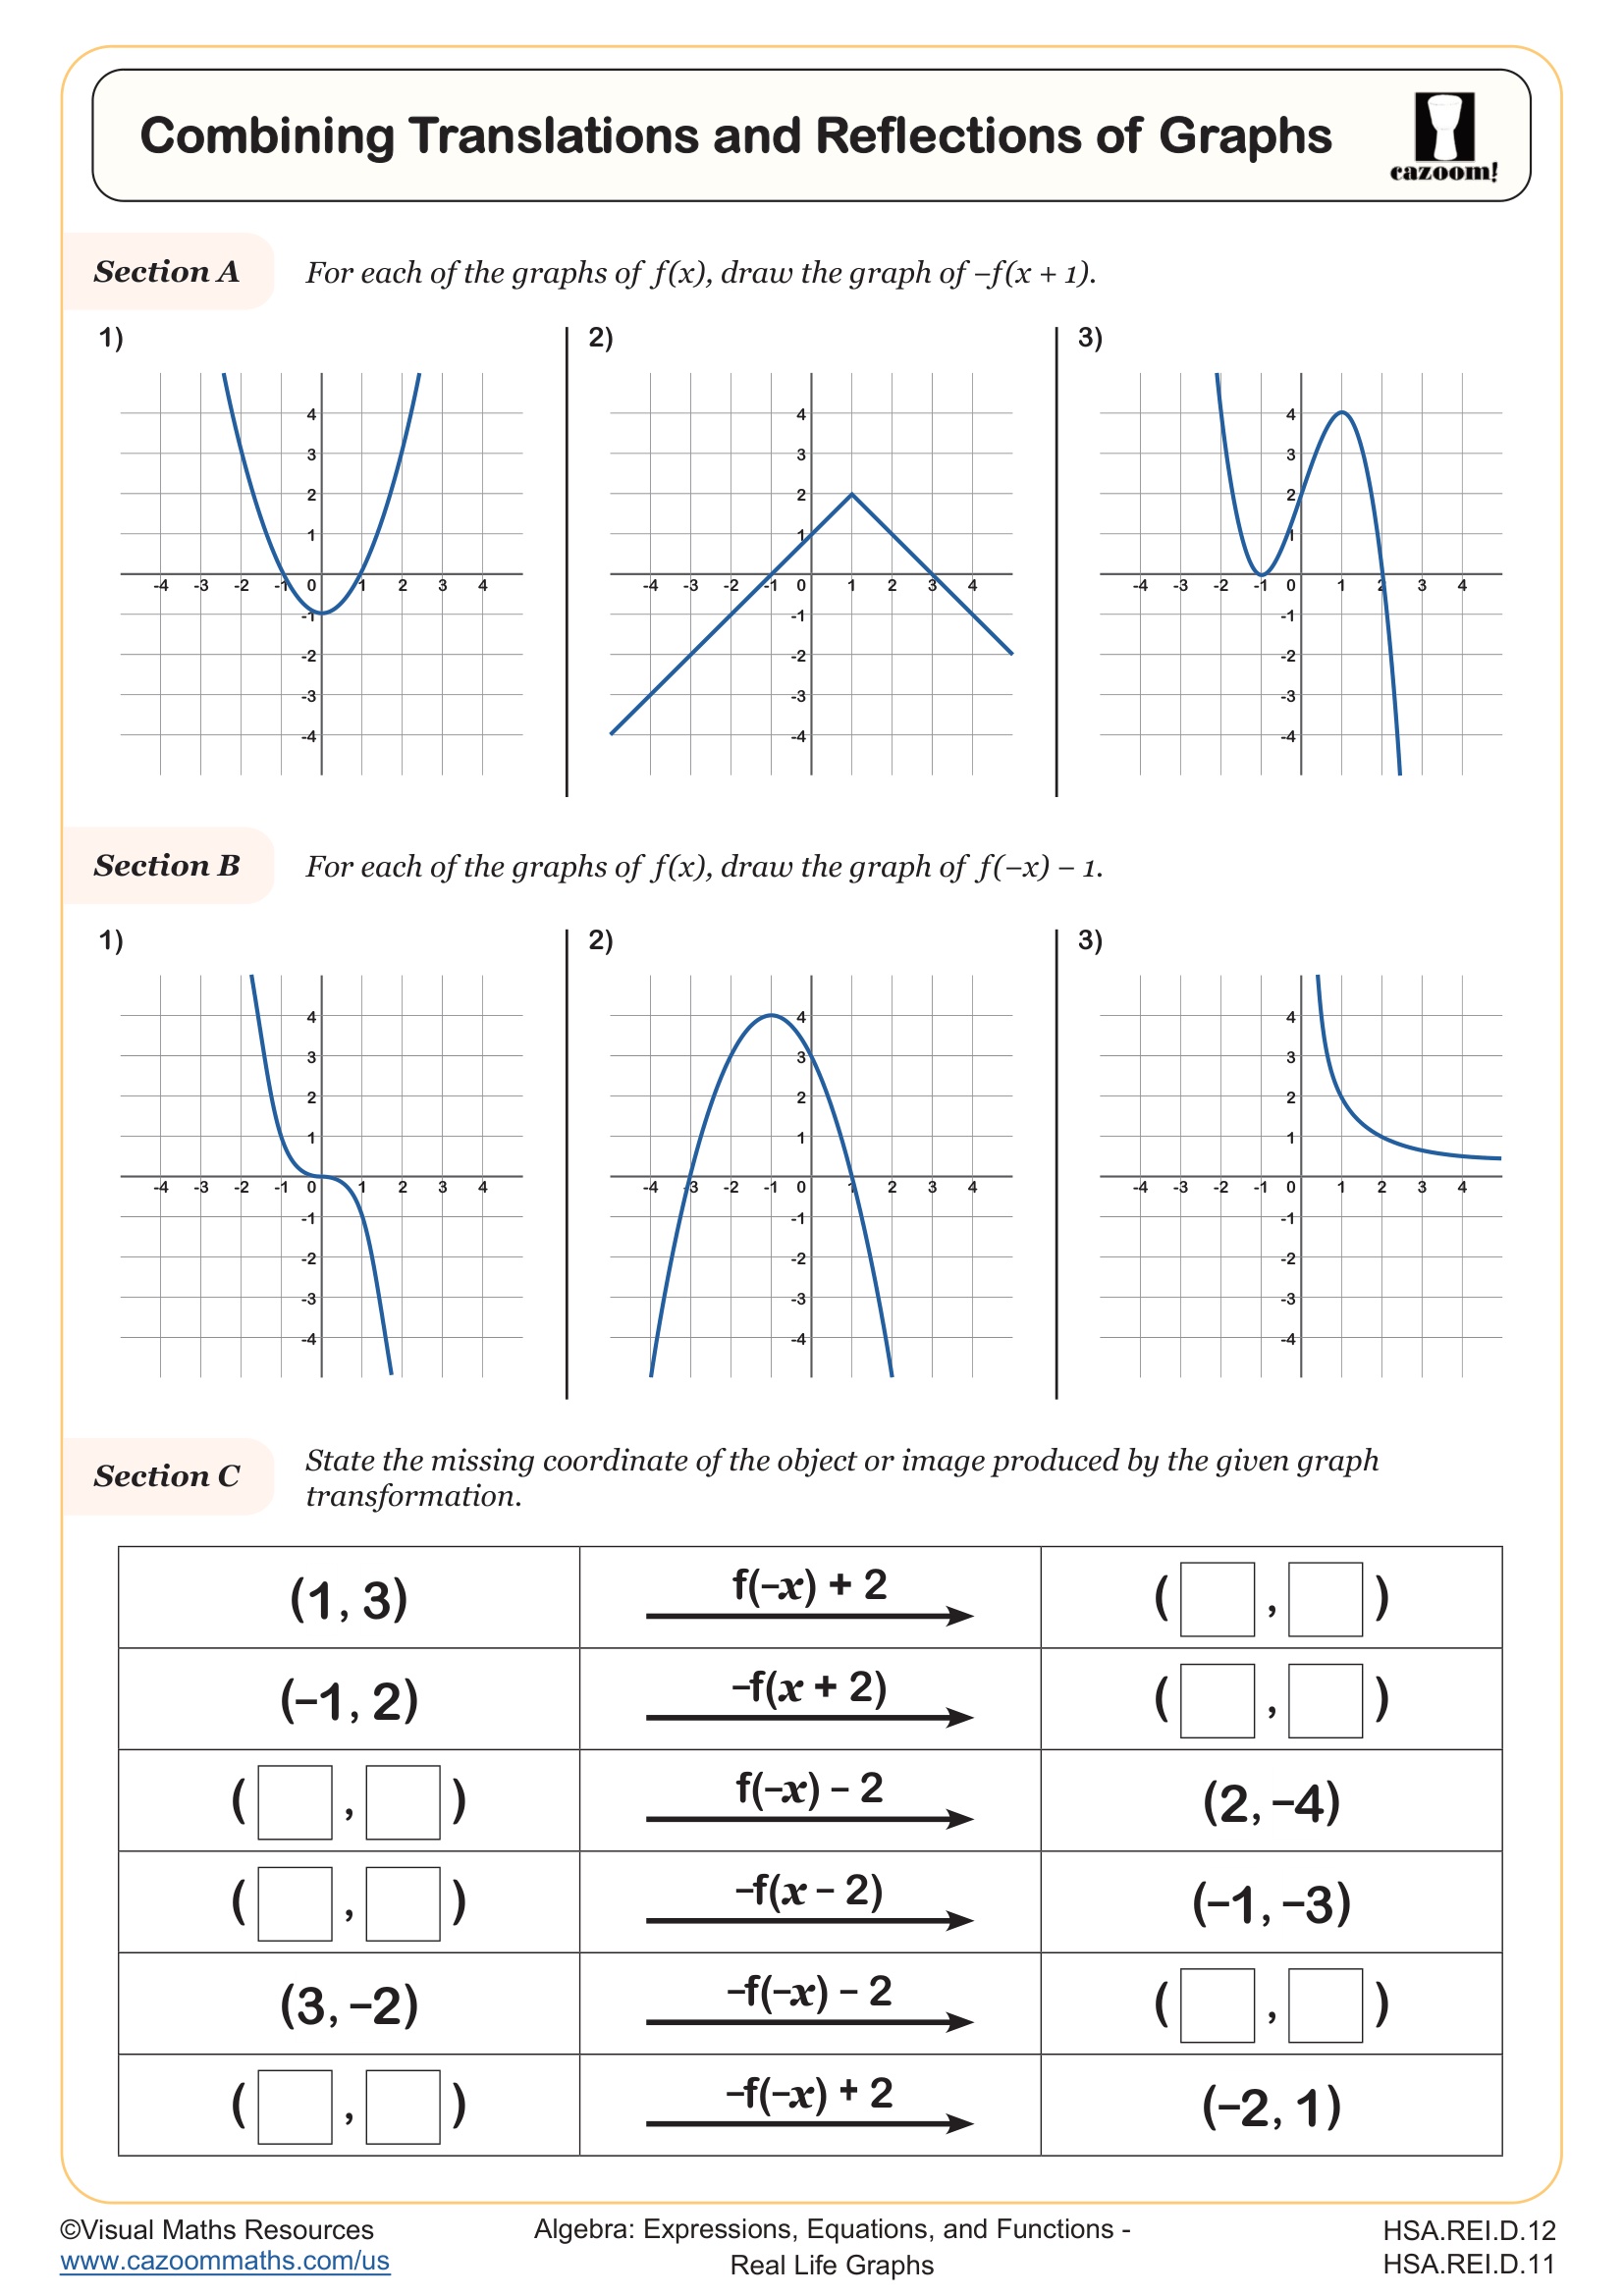
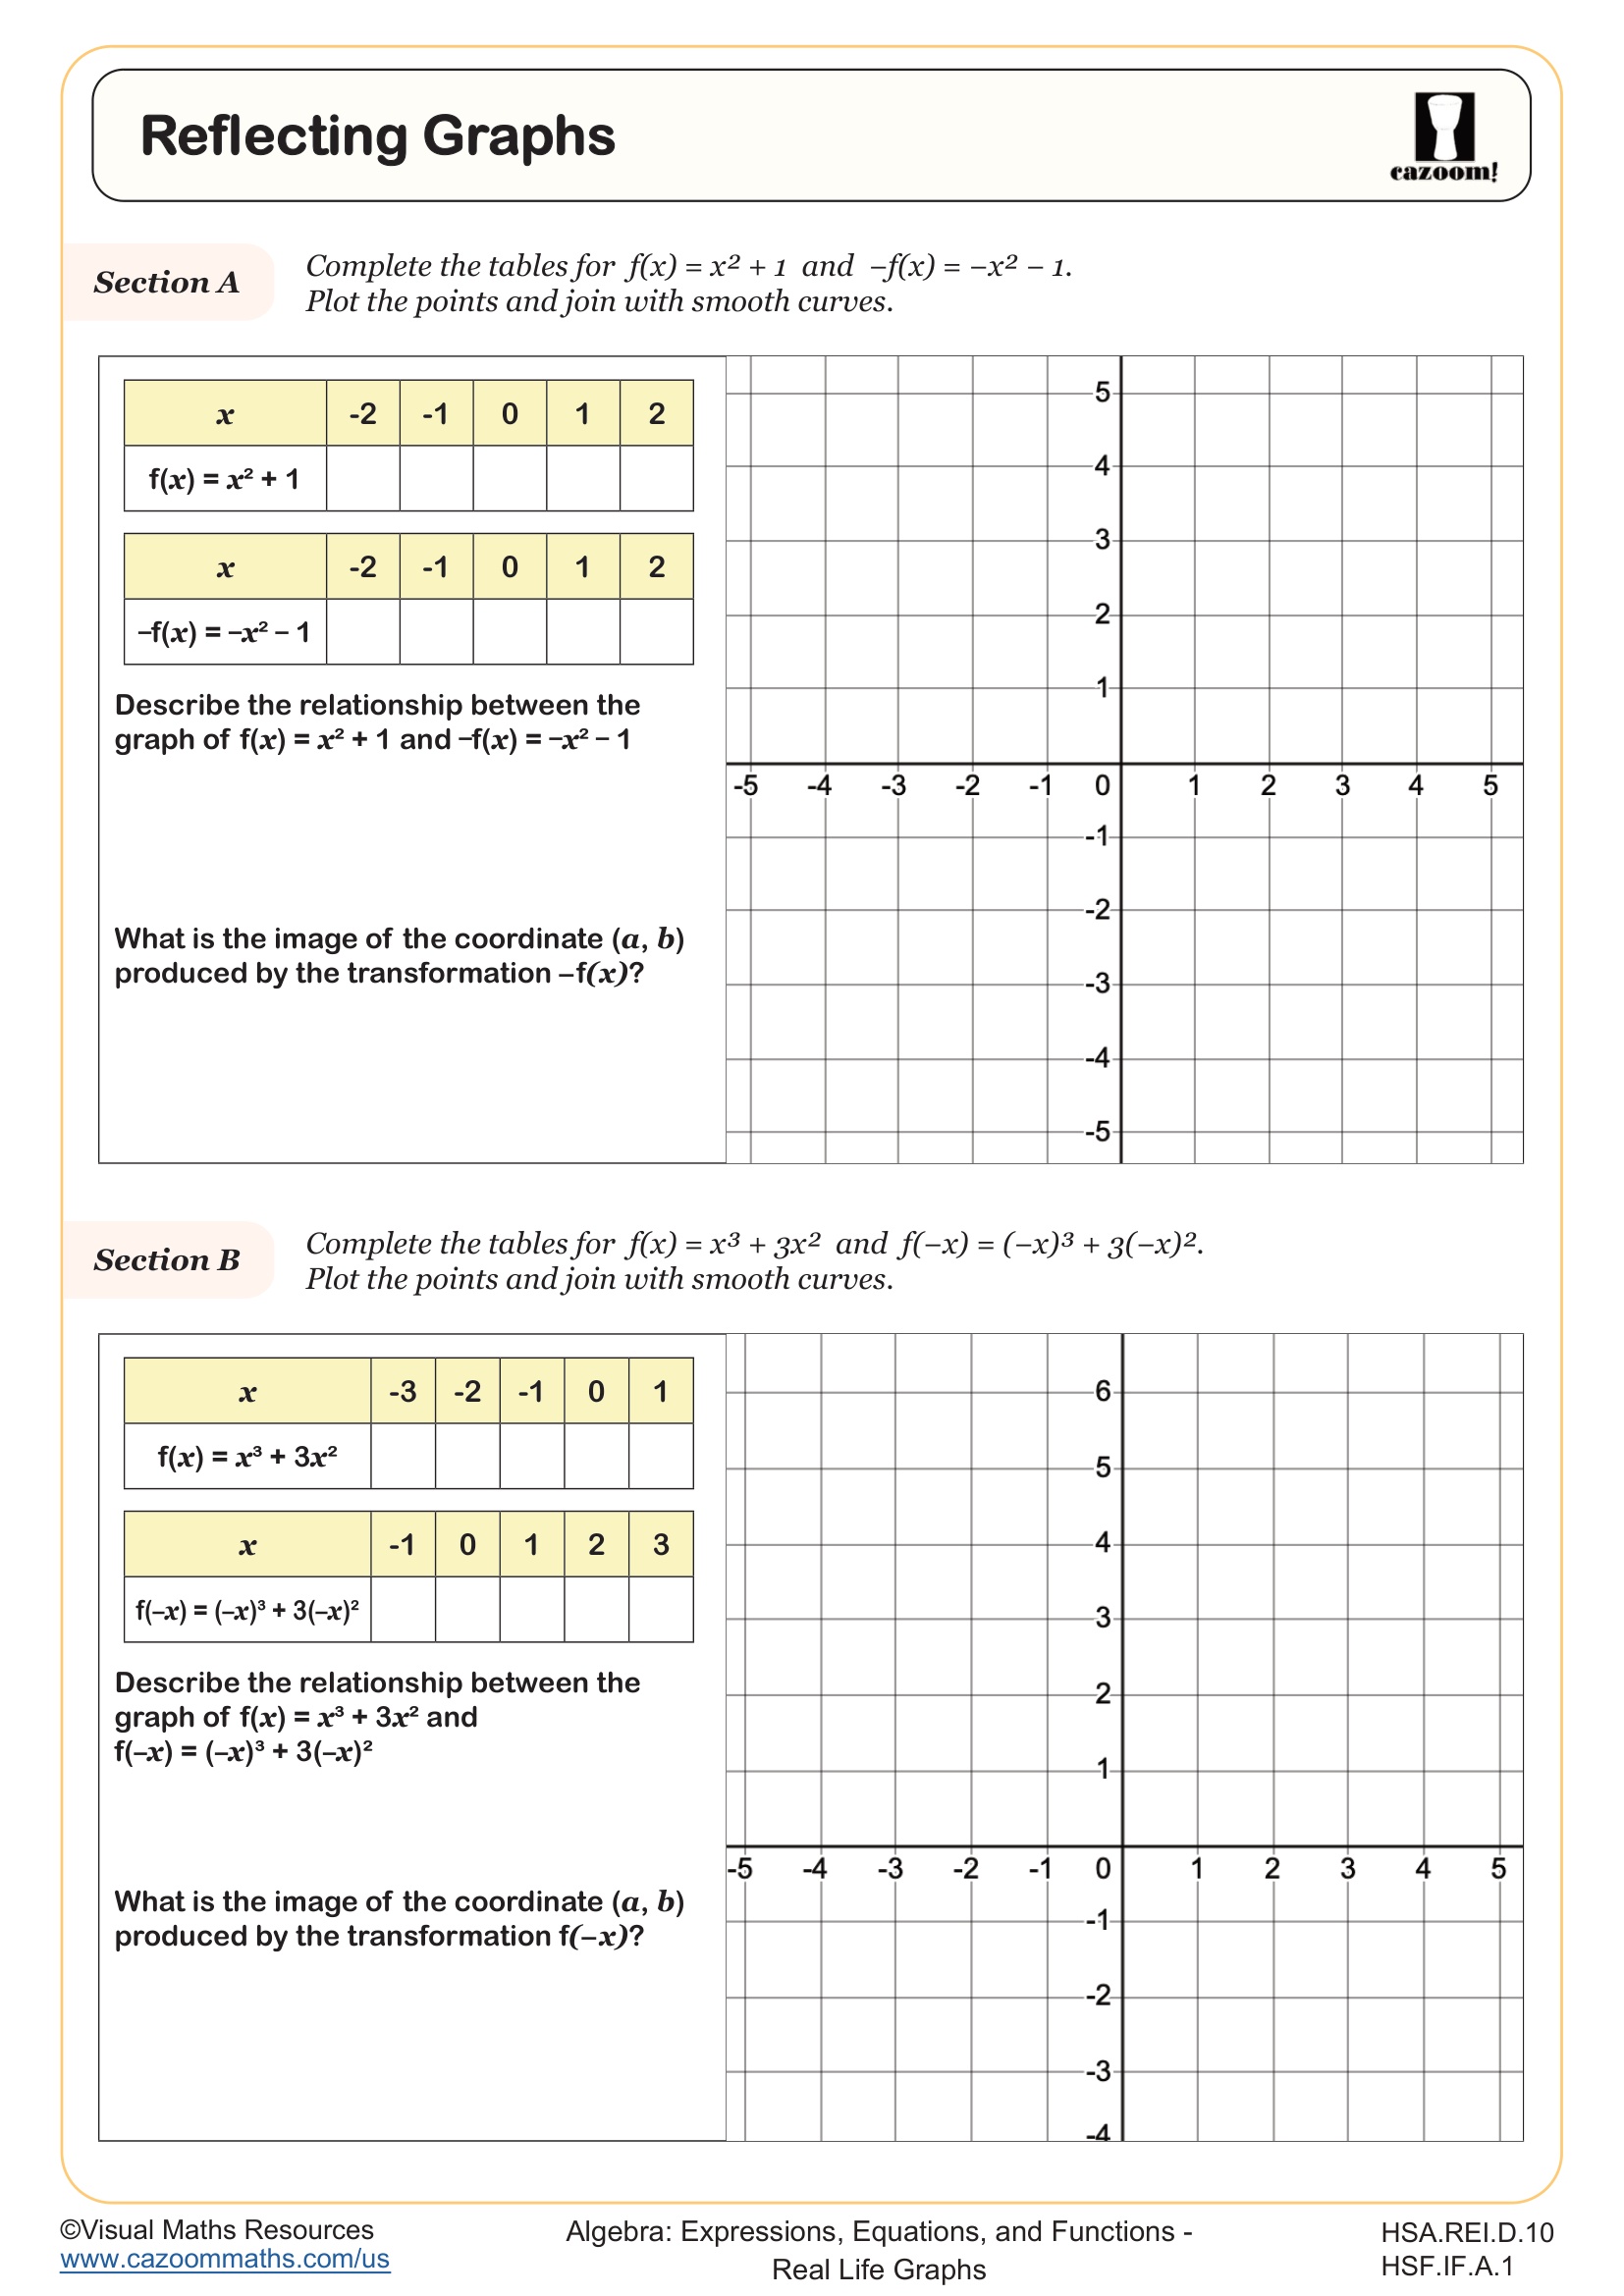
Combining Translations and Reflections of Graphs
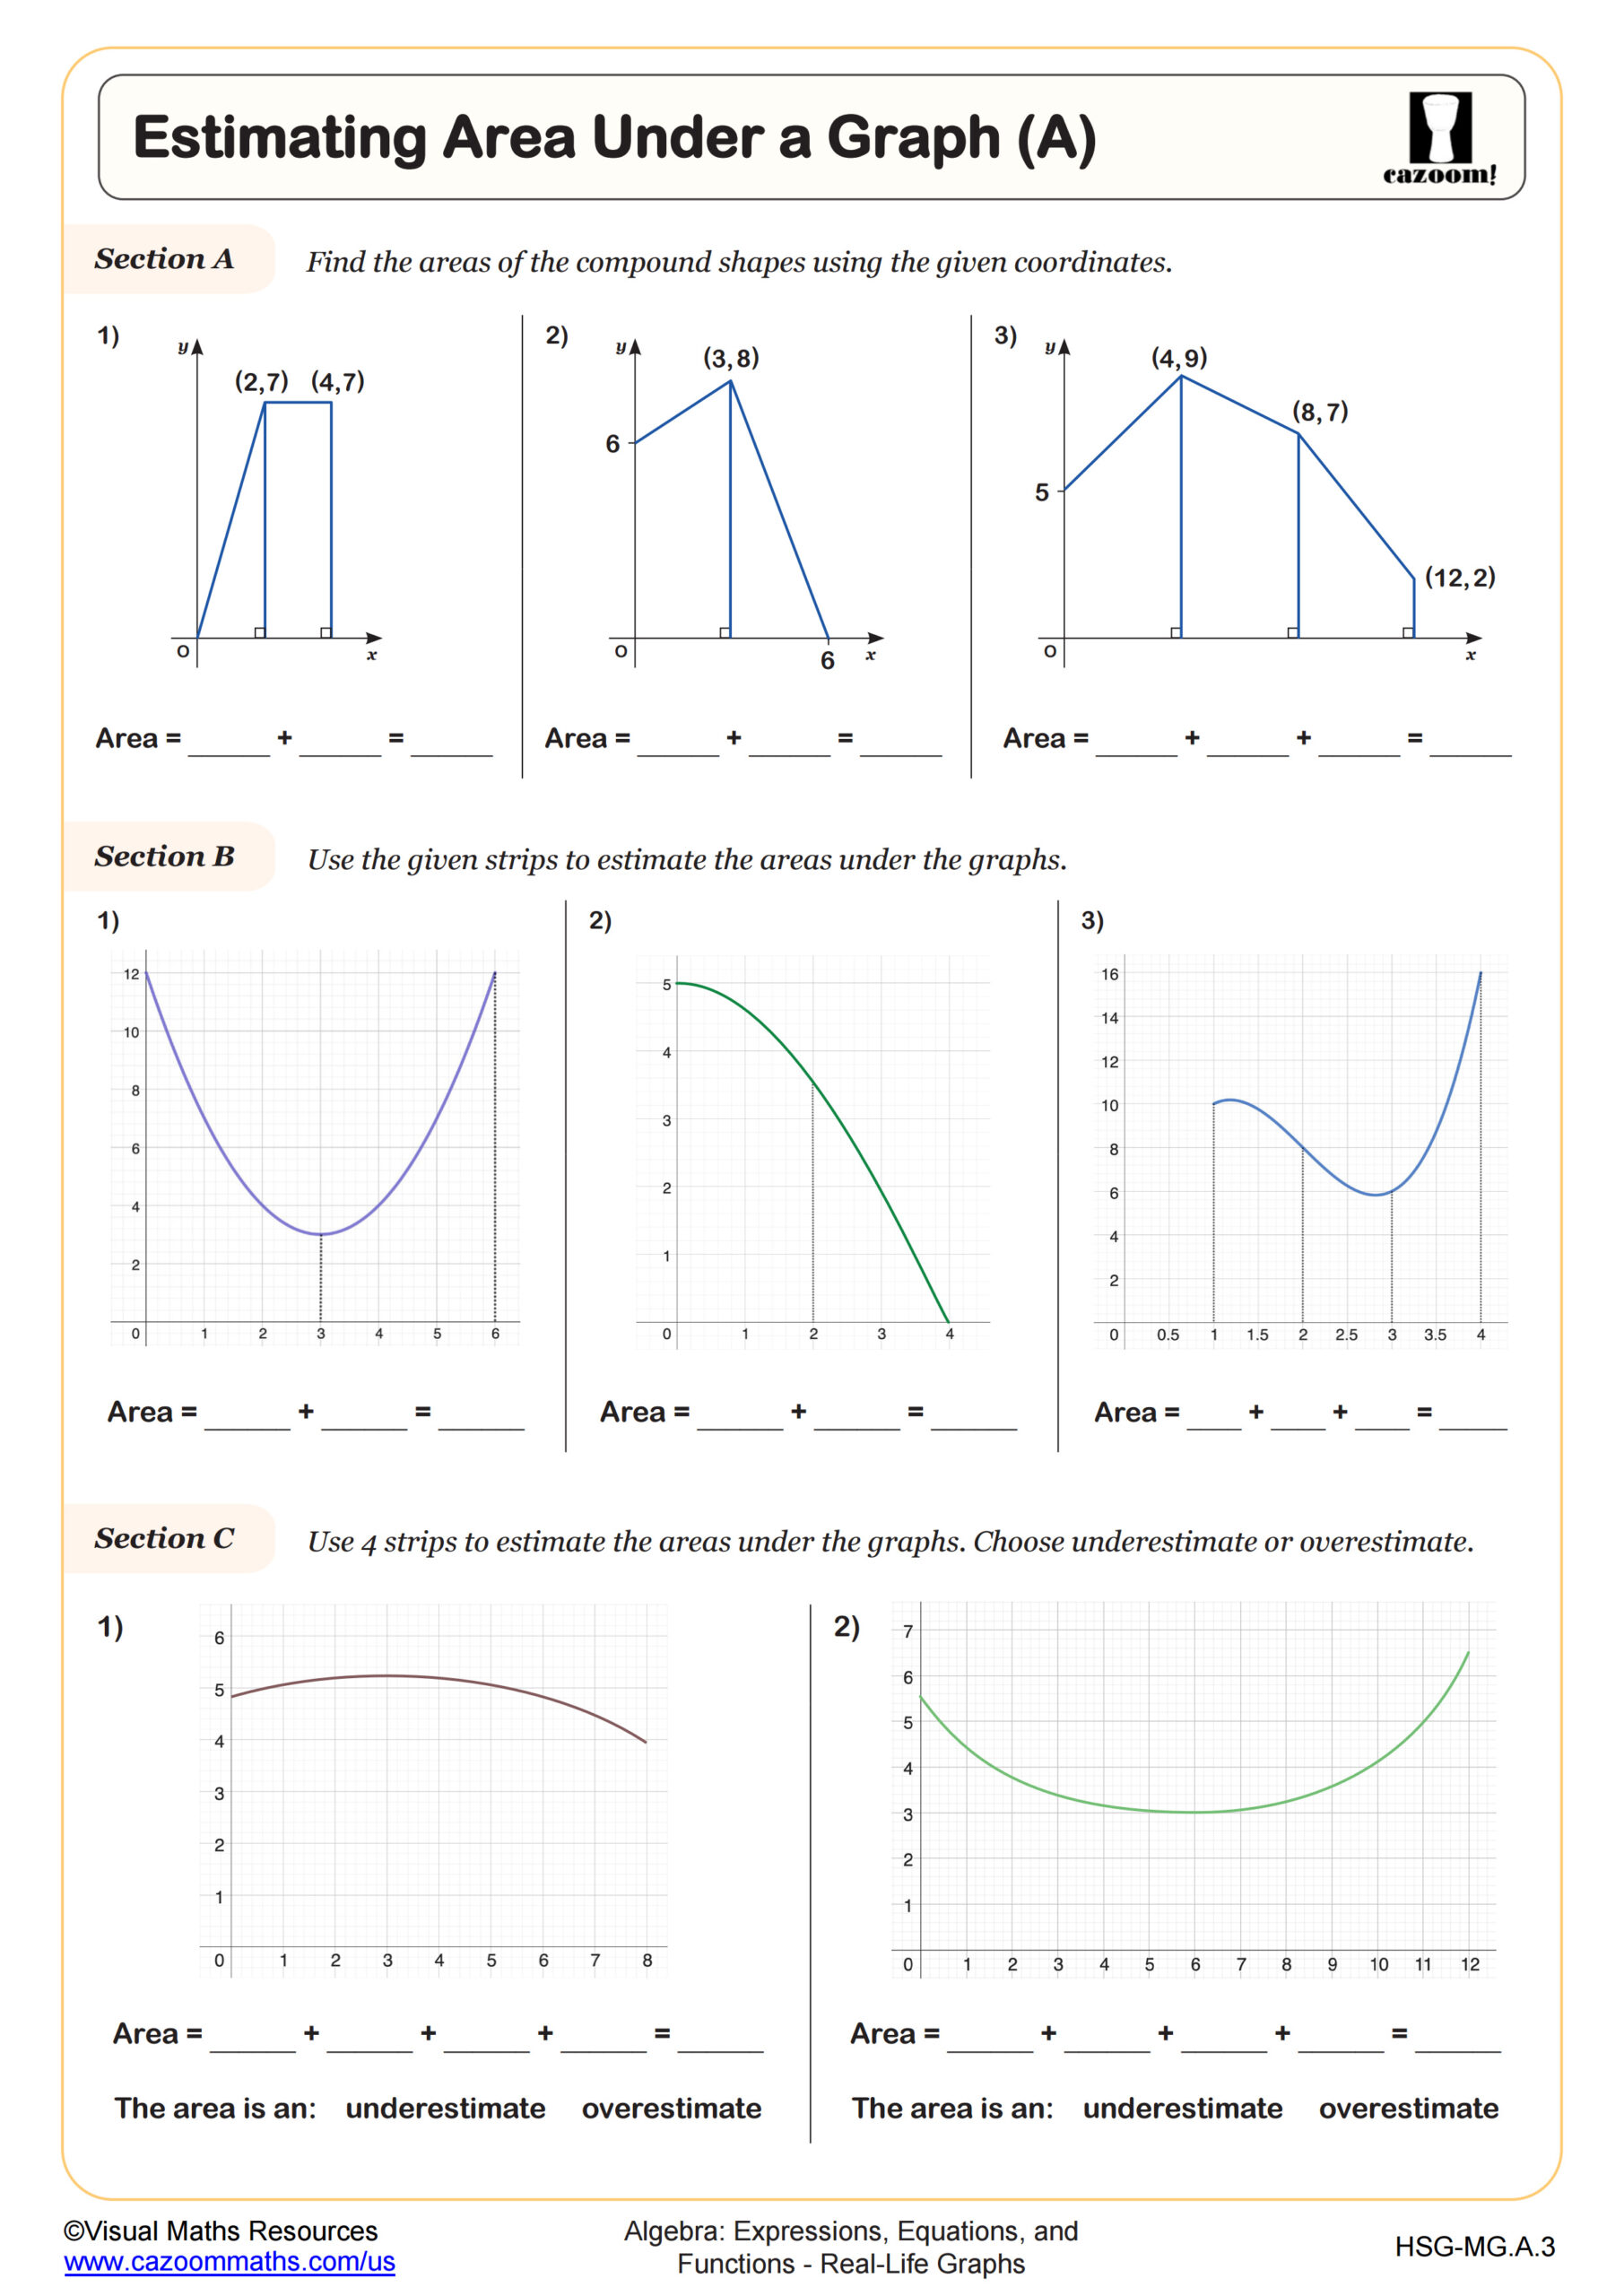
Estimating Area Under a Graph (A)
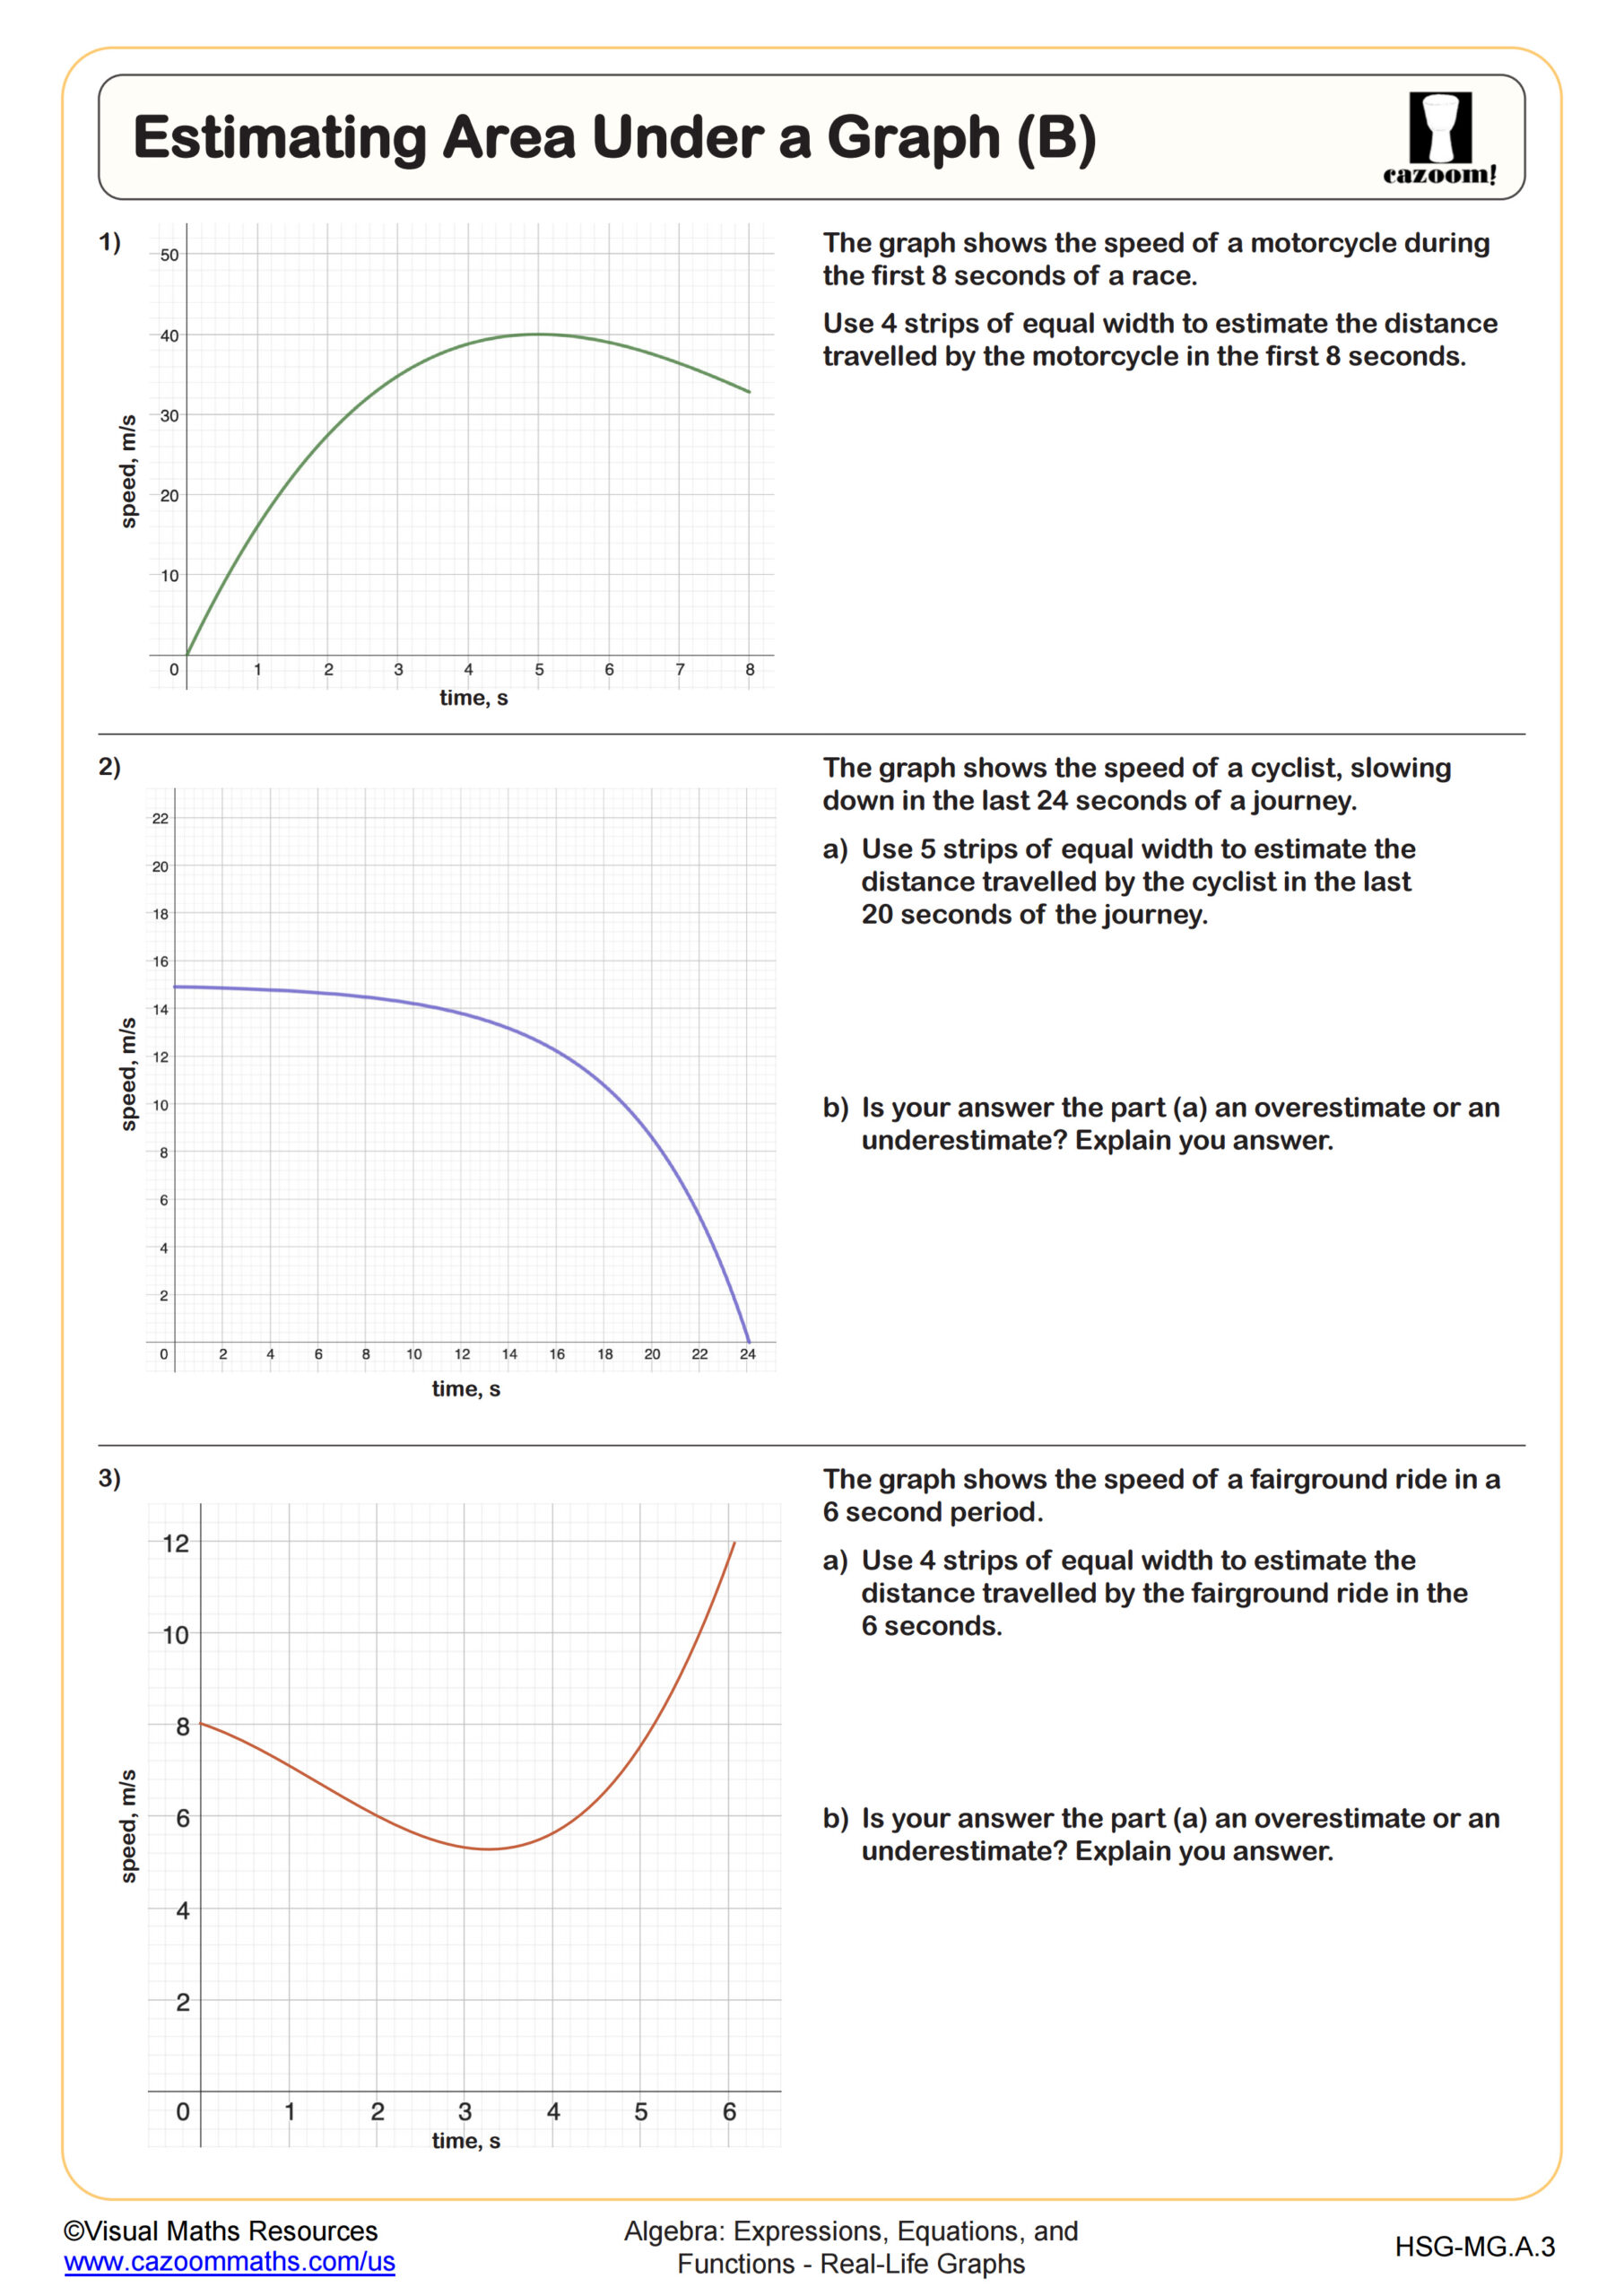
Estimating Area Under a Graph (B)
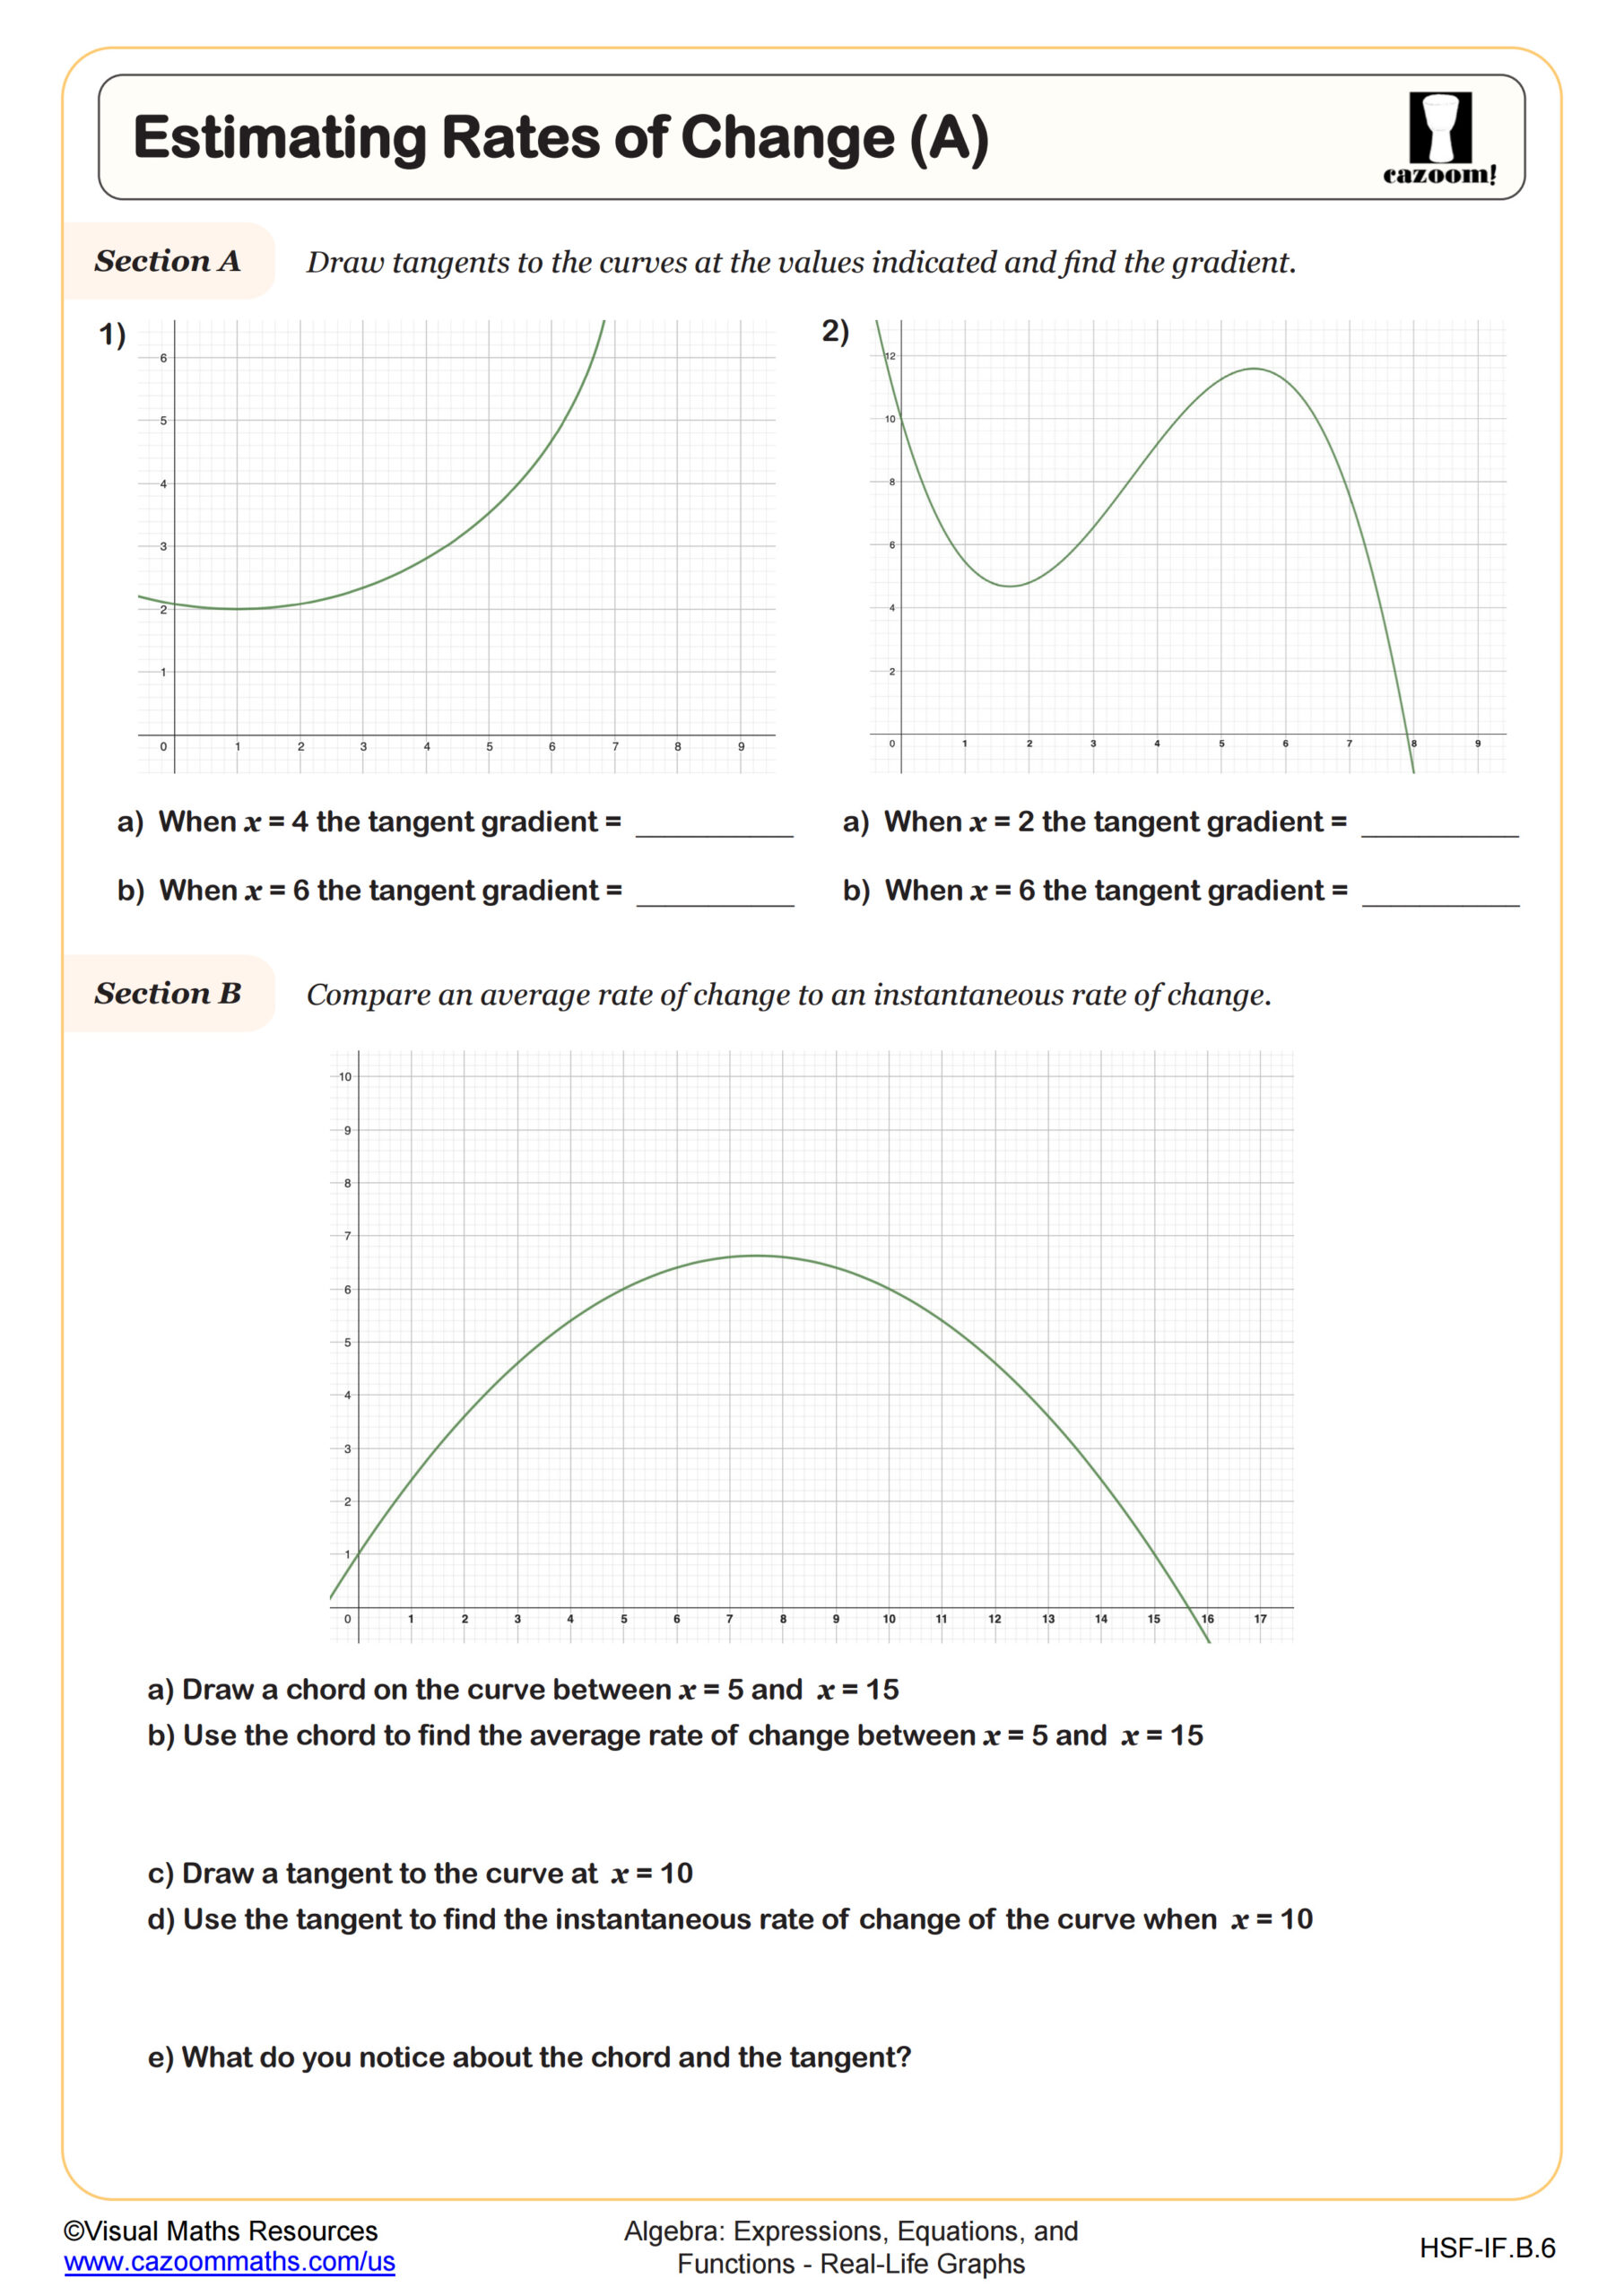
Estimating Rates of Change (A)
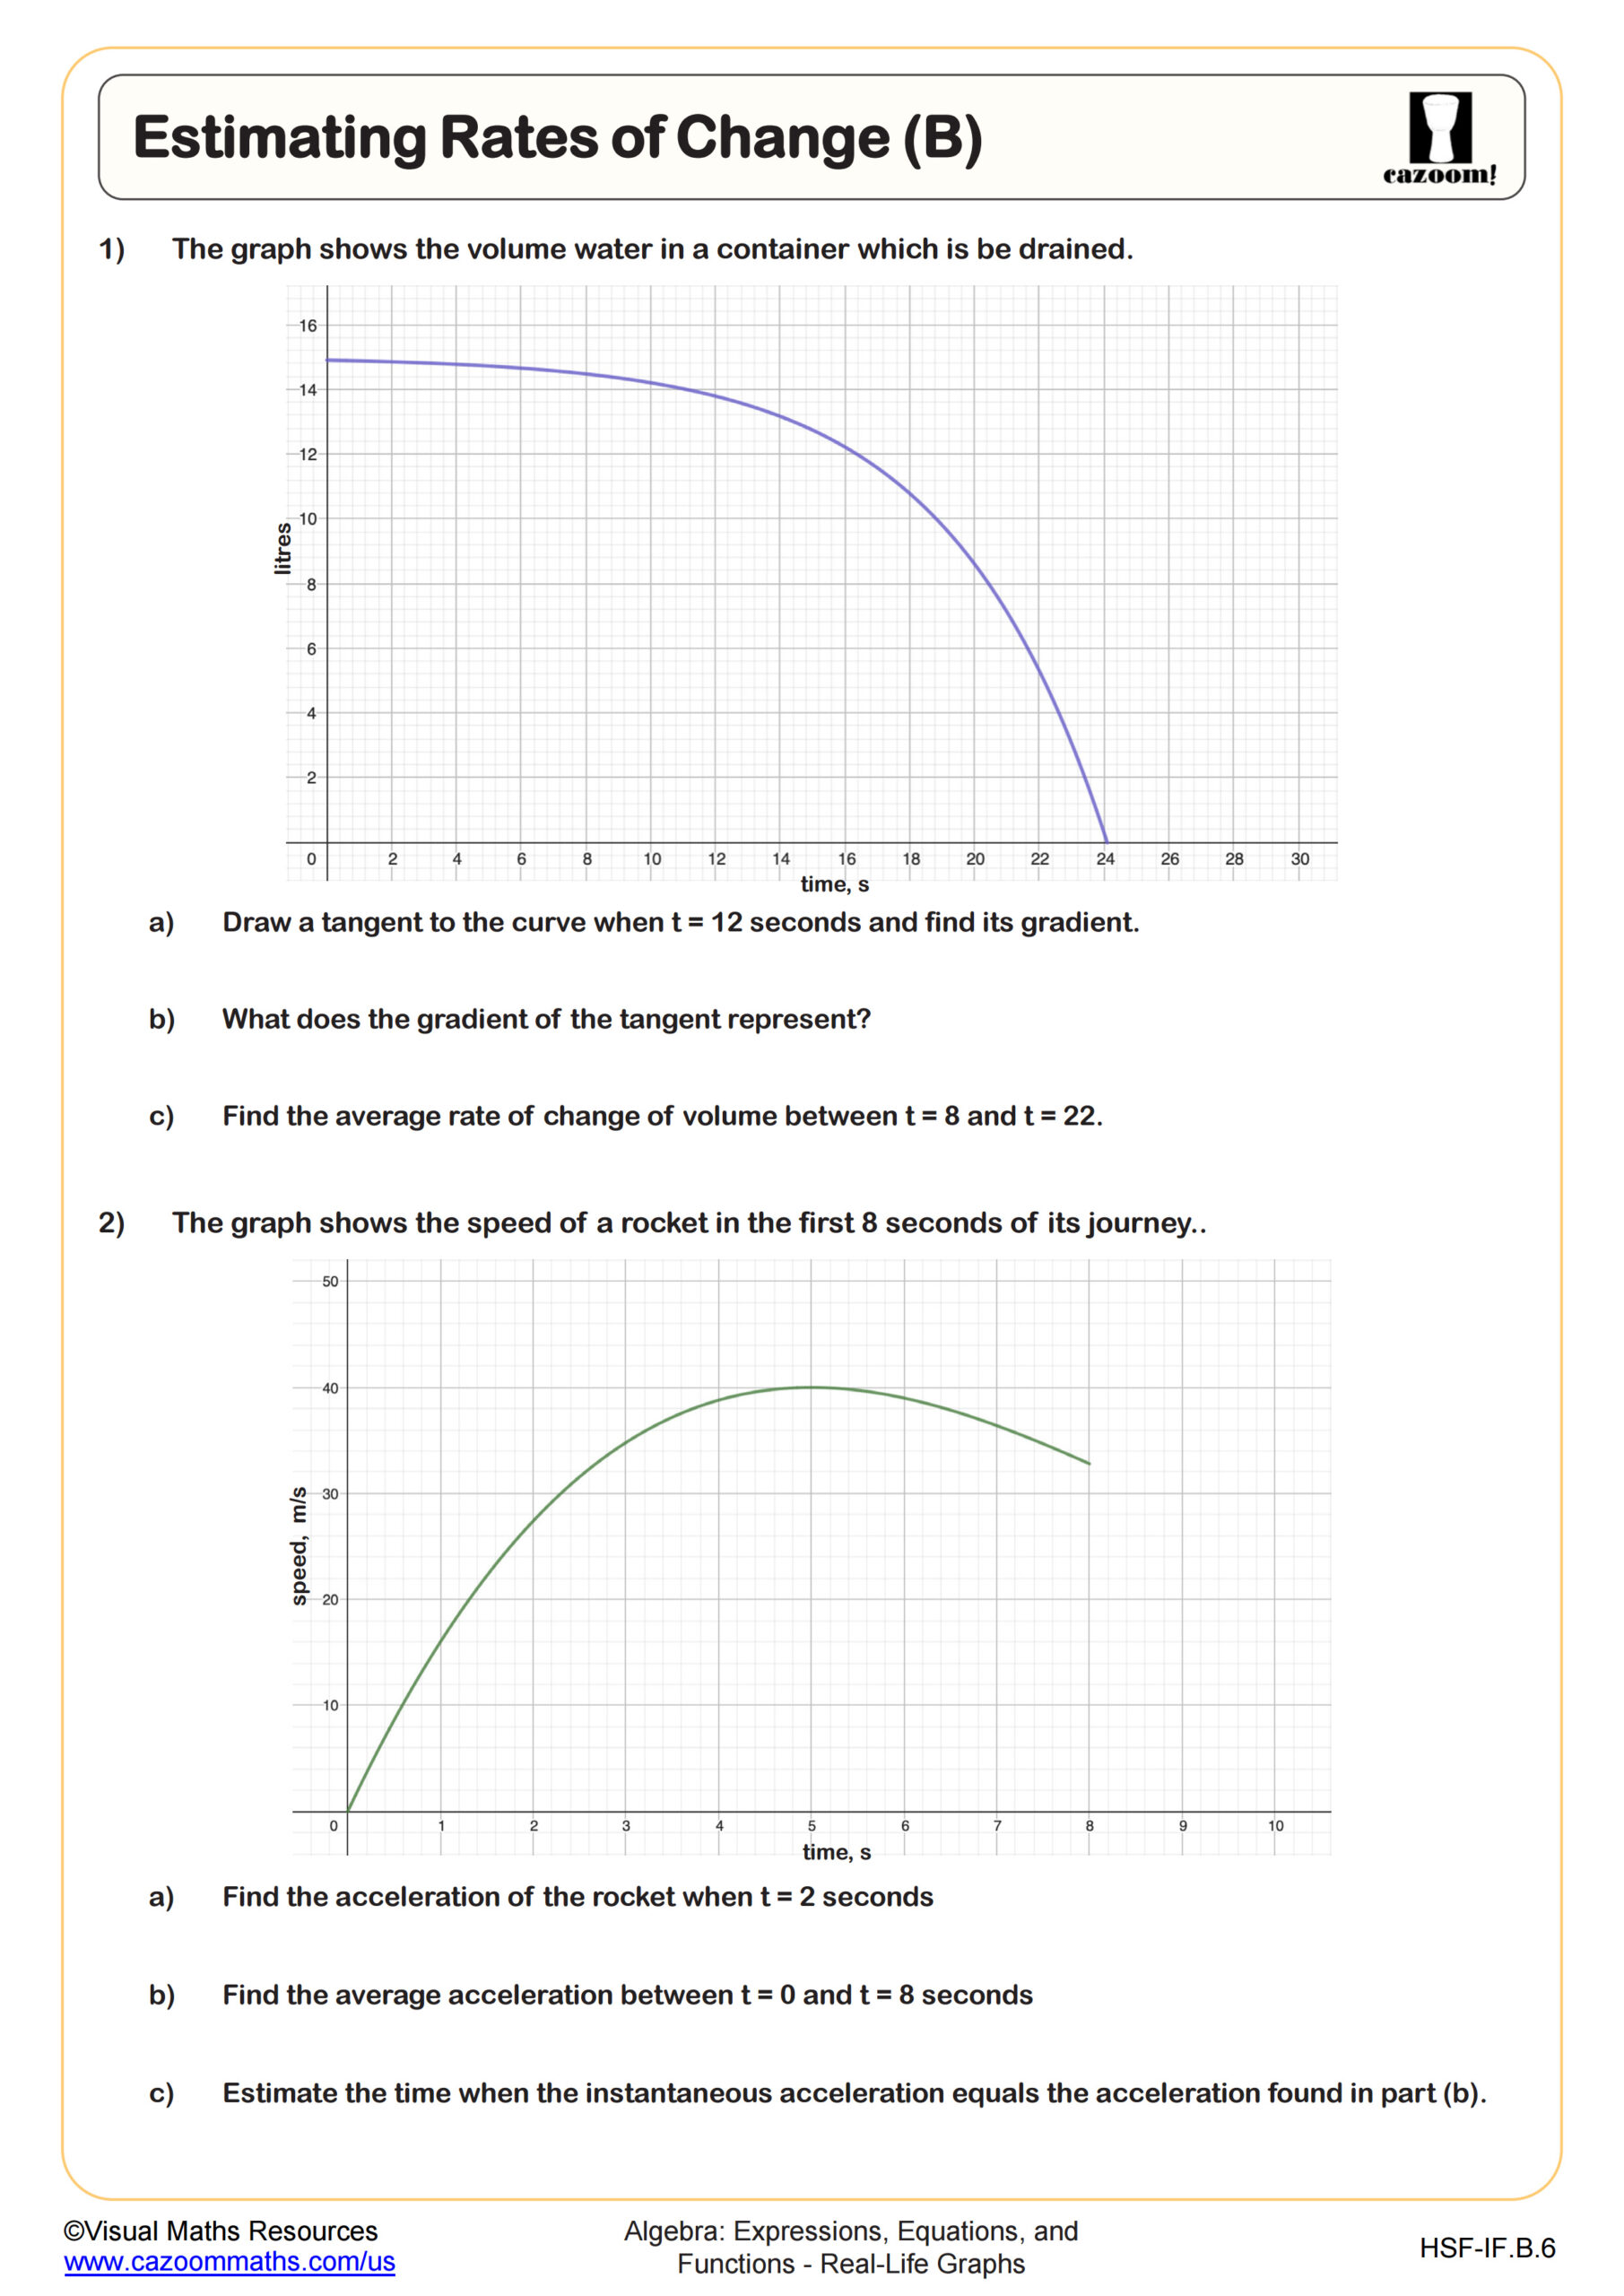
Estimating Rates of Change (B)
Reflecting Graphs
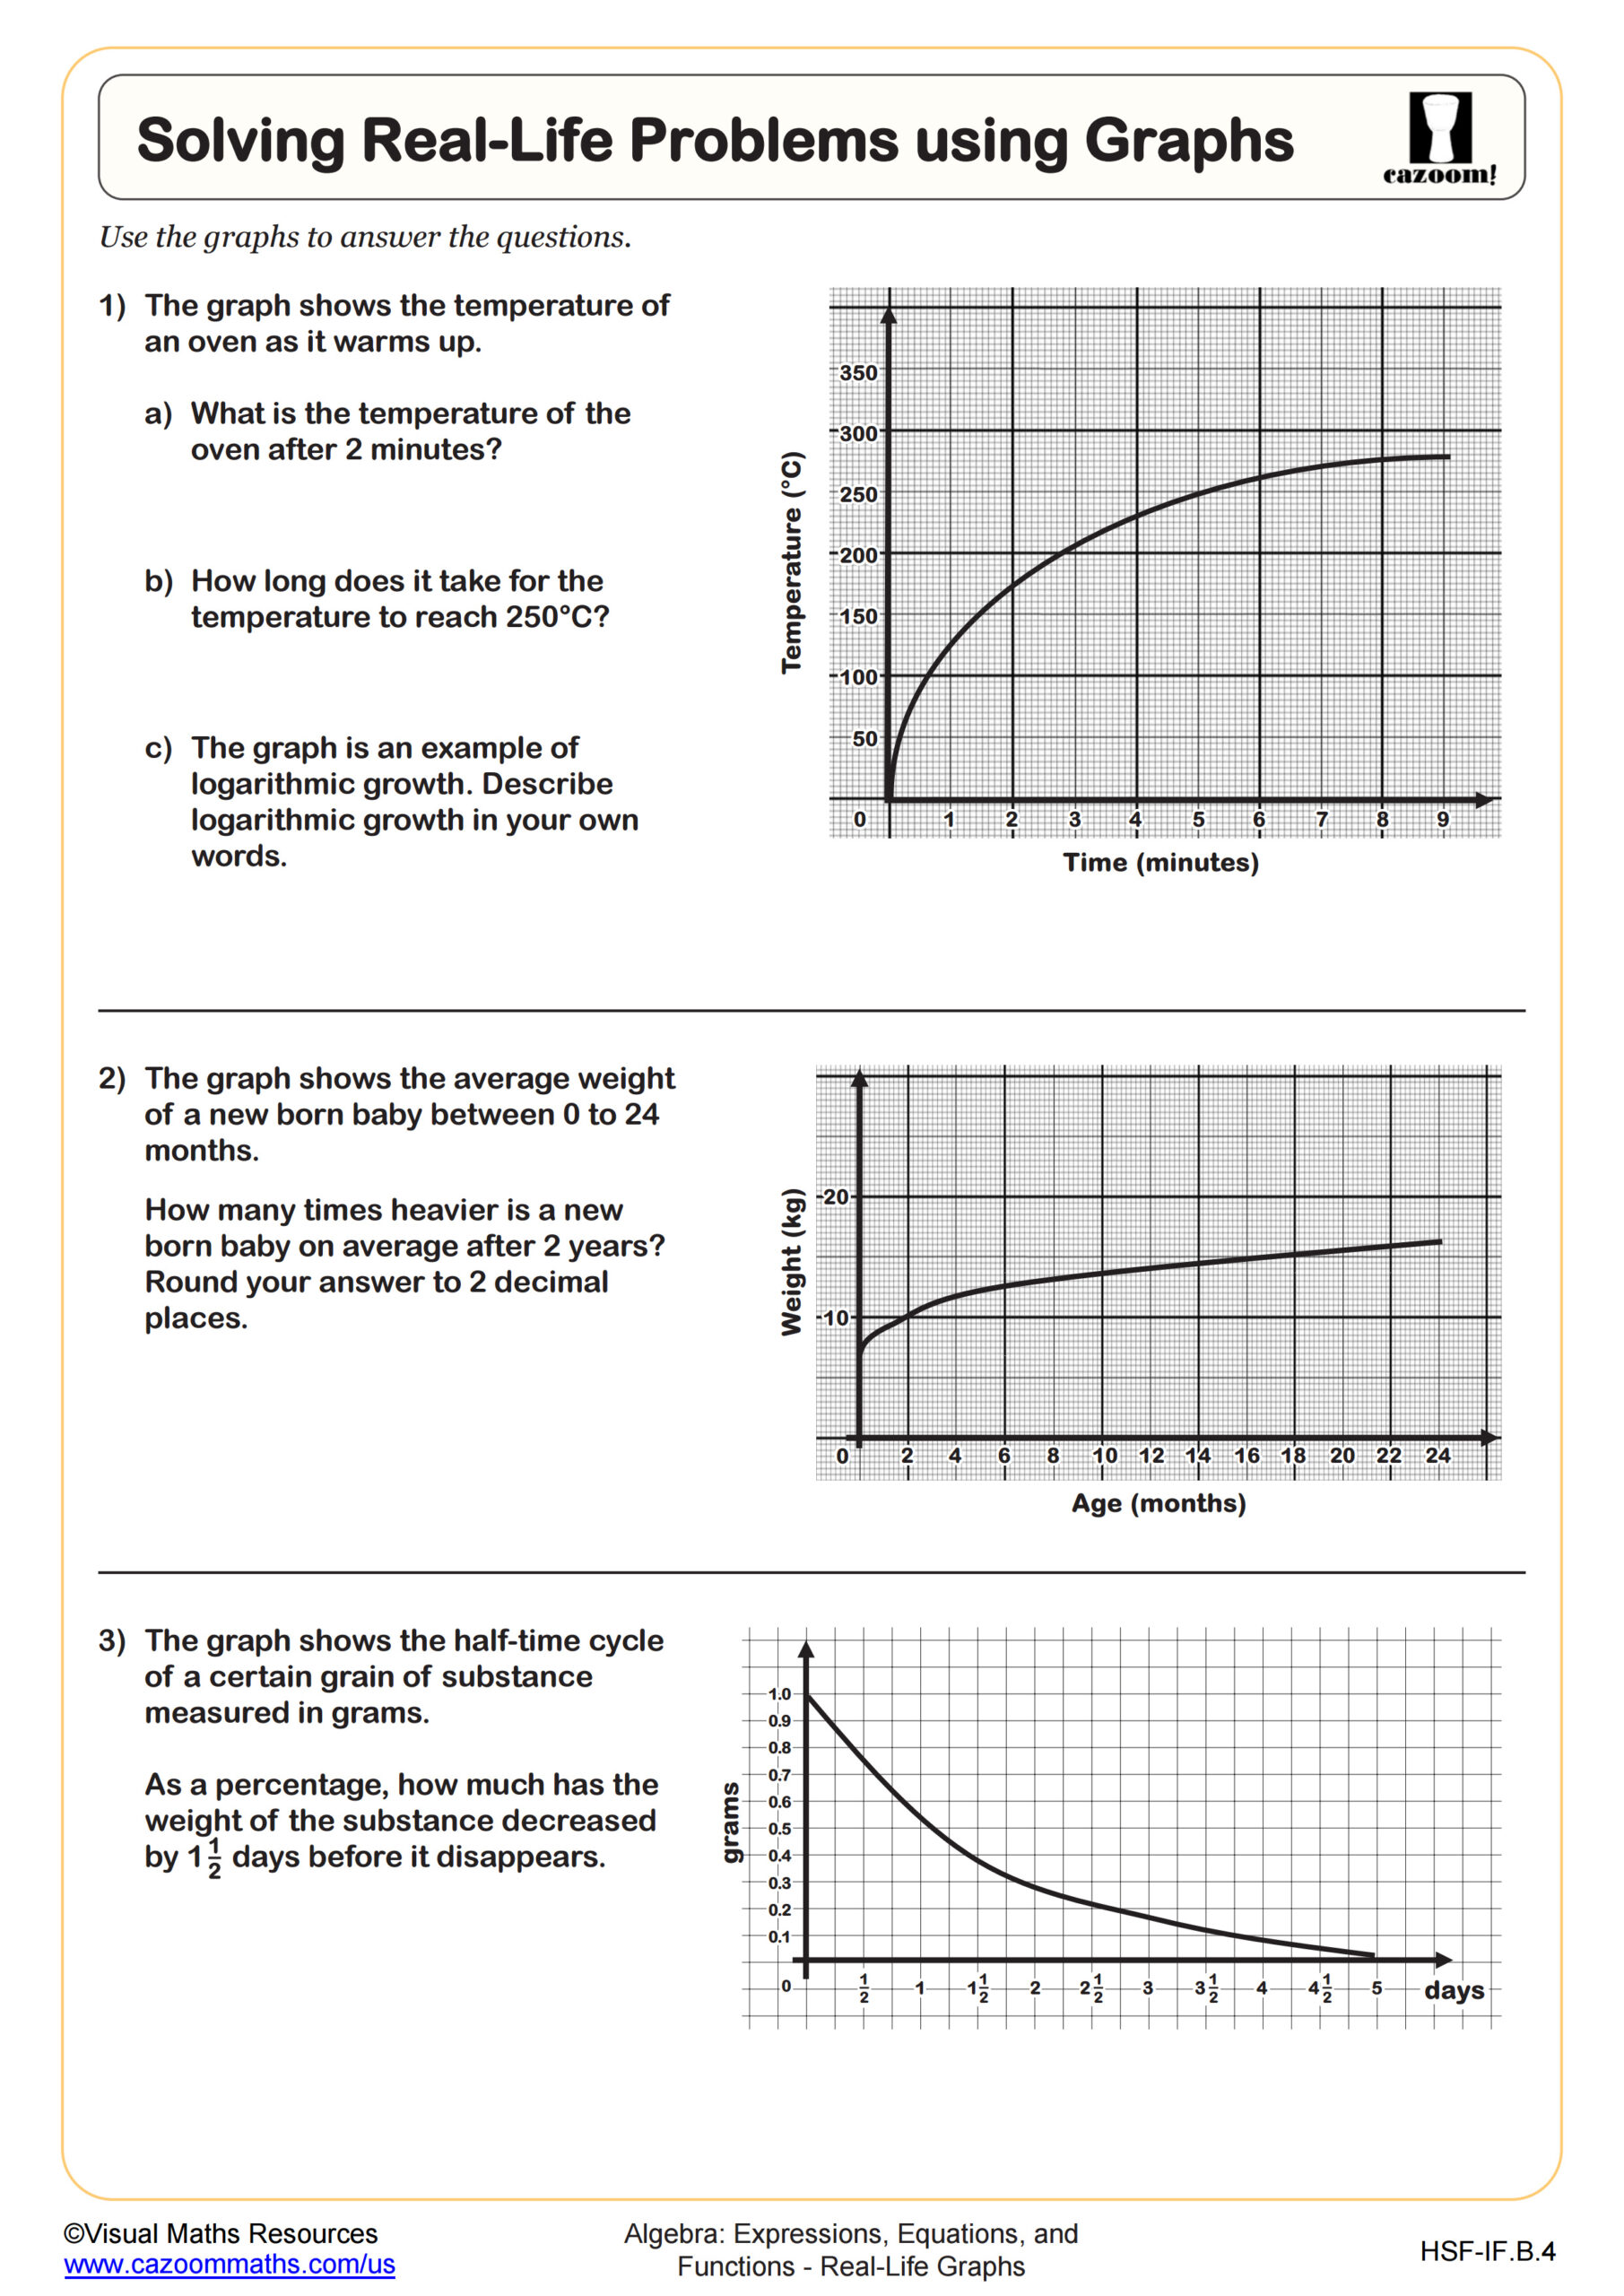
Solving Real-Life Problems using Graphs
All worksheets are created by the team of experienced teachers at Cazoom Math.
What Real Life Graph Skills Do Integrated Math 1 Students Practice?
Integrated Math 1 students work with graphs representing real-world contexts, focusing on interpreting relationships between variables rather than just plotting coordinates. This includes analyzing distance-time graphs, understanding how slope represents rate of change in practical situations, estimating area under curves to find total quantities, and connecting graph transformations to shifts in real-world scenarios. Students also practice identifying domain and range restrictions based on context, such as recognizing that negative time values don't make sense in most applications.
A common error occurs when students confuse the shape of a path with the shape of a distance-time graph. For example, when shown a graph of someone walking, students might think a curved line means the person walked along a curved path, when it actually indicates changing speed. Teachers address this by having students act out scenarios while others sketch the corresponding graphs, making the distinction between physical movement and graphical representation clear.
How Do Real Life Graphs Appear on the SAT and State Assessments?
Standardized tests present real life graphs within word problems that require multi-step reasoning. The SAT includes questions where students must interpret slopes as rates (miles per gallon, dollars per hour), identify maximum or minimum values from graphs, and compare two different scenarios shown graphically. State assessments aligned with Common Core ask students to match written descriptions to appropriate graphs, determine when one function exceeds another, and calculate quantities using graph features like intercepts and areas under curves.
Students lose points when they fail to read axis labels carefully or misinterpret what each axis represents. Test questions deliberately include distractors that seem correct if students reverse the variables. Another frequent mistake involves students who can read individual points accurately but struggle to describe overall trends or identify intervals where specific conditions hold true, such as when a quantity is increasing most rapidly.
What Does Estimating Rates of Change from Graphs Involve?
Estimating rates of change requires students to find the slope between two points on a curve, giving them the average rate over an interval. Students select appropriate points, calculate rise over run, and interpret the result with correct units based on the context. This skill prepares students for calculus concepts by introducing the idea that steeper sections of a graph indicate faster change. Teachers often see breakthrough moments when students realize that slope isn't just a number but represents something meaningful, like how many feet per second an object travels.
This skill appears throughout STEM fields where professionals analyze trends from data. Engineers examine velocity graphs to determine acceleration, epidemiologists study infection rate curves to predict disease spread, and financial analysts review stock price changes to assess volatility. College-bound students encounter rate of change extensively in physics courses when studying motion graphs, and understanding this concept from real-world graphs builds intuition for more abstract applications in calculus and differential equations.
How Can Teachers Use These Integrated Math 1 Worksheets Effectively?
The worksheets provide scaffolded practice that moves from basic graph interpretation to more complex applications involving transformations and multi-step problem solving. Earlier problems might ask students to read values directly from graphs, while later questions require estimating areas under curves or combining multiple transformations to model shifted scenarios. The included answer keys allow teachers to quickly identify which specific skills need reteaching, whether that's calculating slope from context or recognizing when a reflection changes the meaning of a real-world situation.
Many teachers use these worksheets during SAT preparation units since graph interpretation questions appear consistently on standardized tests. They work well for warm-up activities that activate prior knowledge before introducing related function topics, or as targeted intervention for students who struggle with contextual problems. Paired work proves effective because students benefit from verbalizing their reasoning about what graph features mean in real situations, helping partners catch errors in interpretation before they become ingrained habits.