Integrated Math 1 Statistics Worksheets
All worksheets are created by the team of experienced teachers at Cazoom Math.
What Statistics Skills Do Students Learn in Integrated Math 1?
Integrated Math 1 statistics focuses on organizing, representing, and interpreting categorical data using visual models and frequency tables. Students learn to read and construct two-way tables that display relationships between two categorical variables, calculate joint and marginal frequencies, and use Venn diagrams to solve problems involving set relationships and overlapping categories.
A common error occurs when students confuse joint frequencies with conditional frequencies in two-way tables. For example, when asked to find the probability that a student plays soccer given that they play an instrument, students often divide by the total number of students rather than by the number of students who play an instrument. Teachers find that explicitly labeling rows and columns with descriptive headers rather than generic variables helps students track which category they're working within.
How Does Statistics Appear on the SAT and State Assessments?
Standardized tests frequently assess statistics through data interpretation questions that require students to extract information from two-way tables, calculate relative frequencies, and determine whether associations exist between variables. The SAT Math section regularly includes questions where students must identify conditional probabilities from tables or interpret survey results displayed in frequency formats. State assessments aligned with Common Core emphasize statistical reasoning and the ability to explain what data representations reveal about real-world contexts.
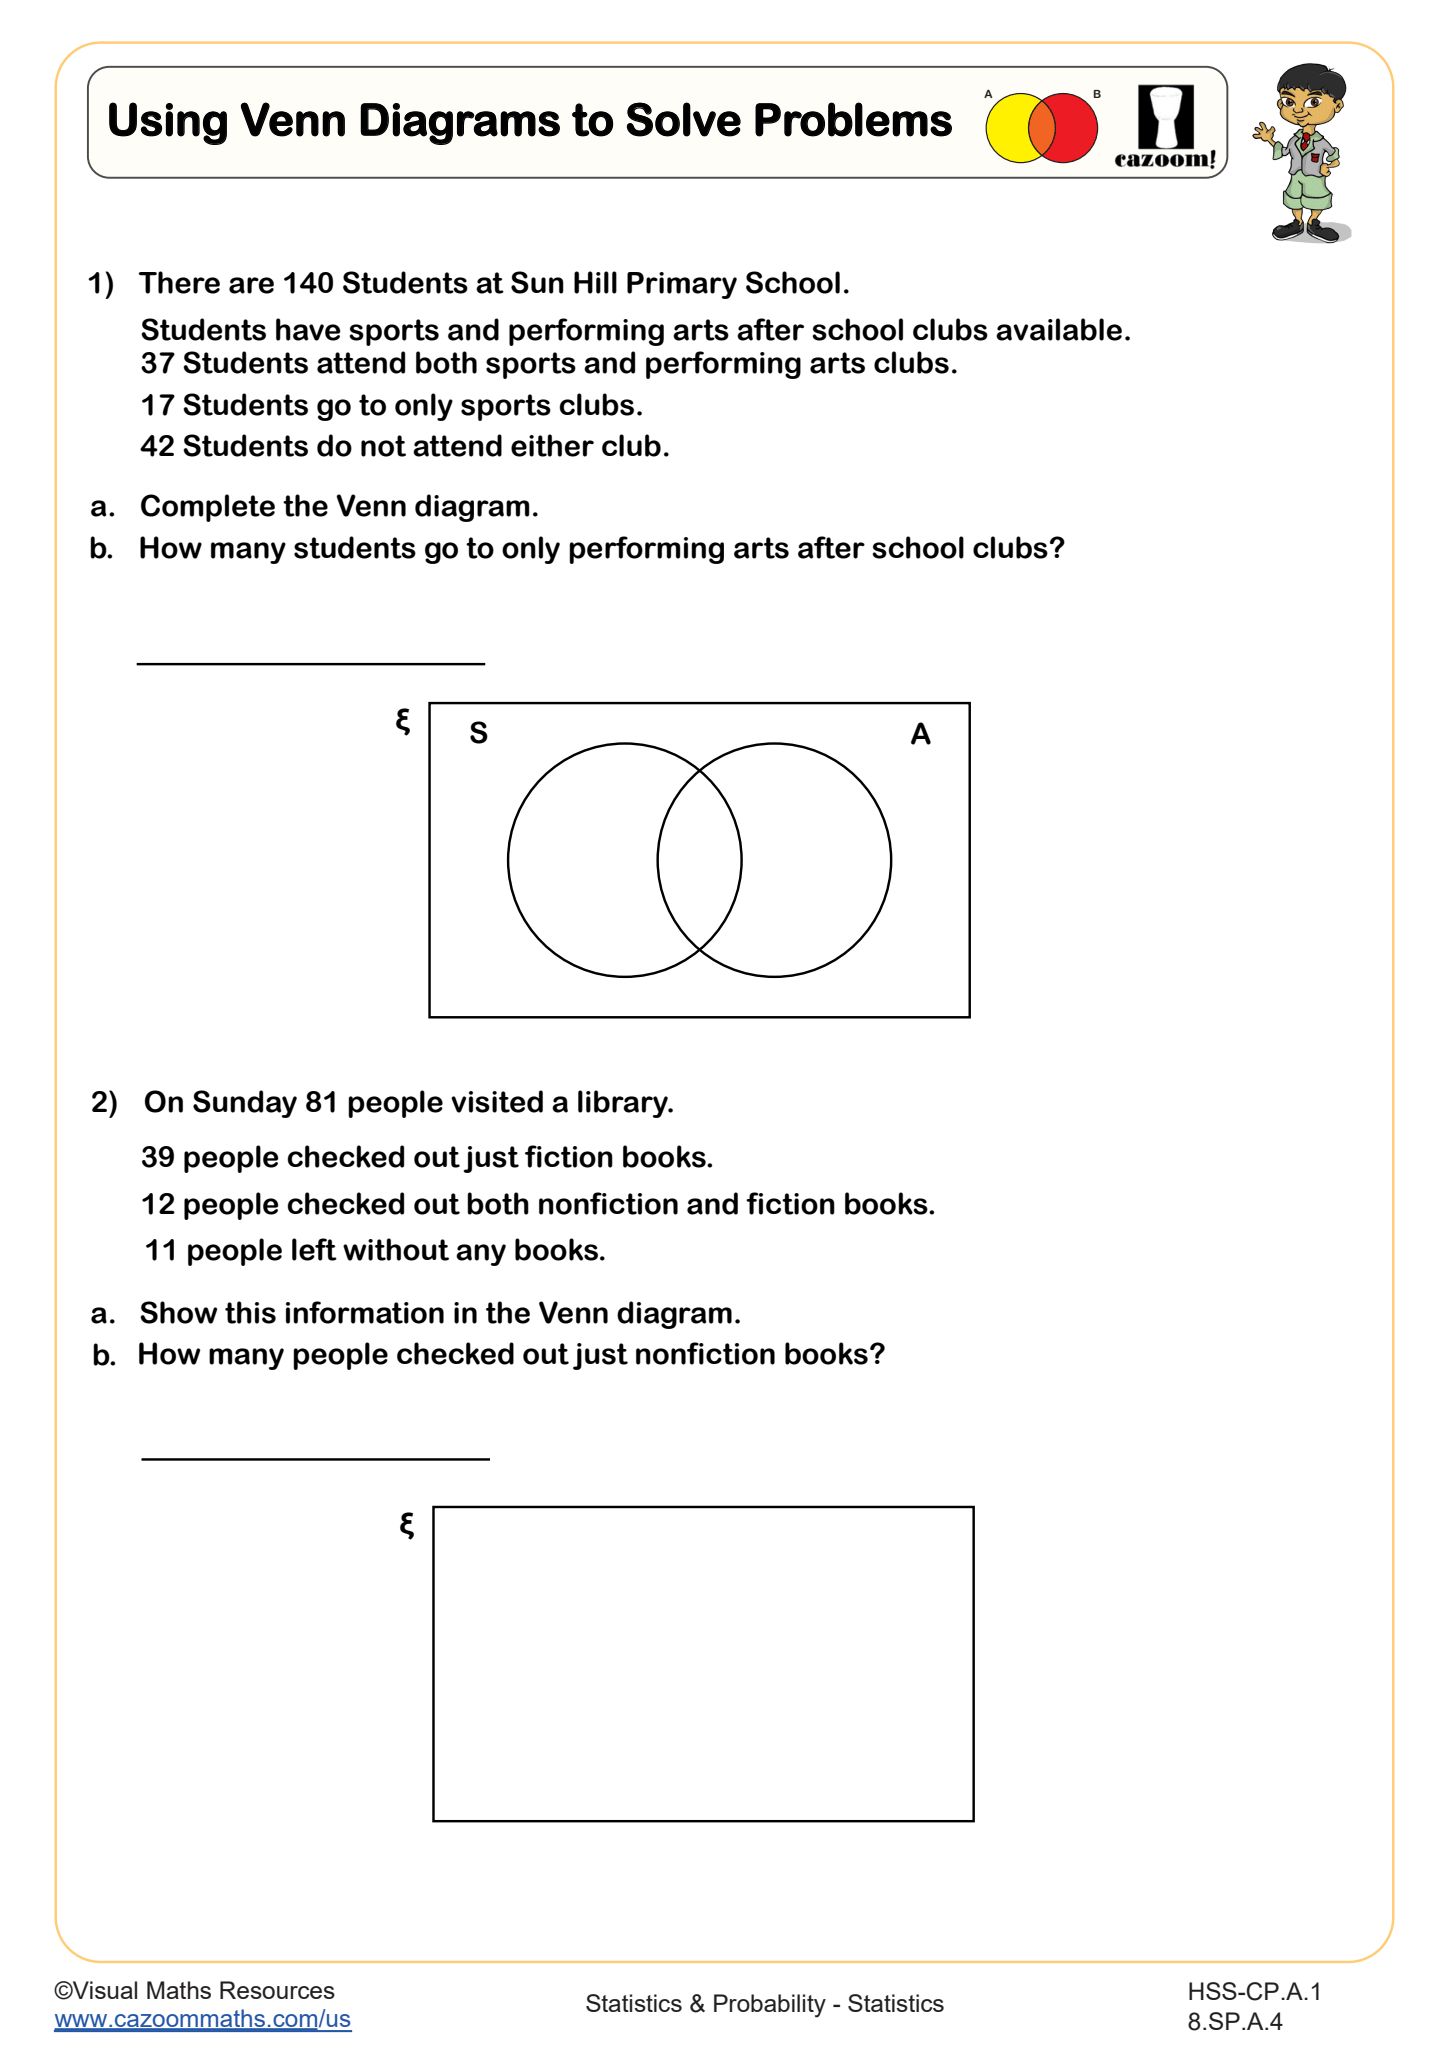
Students lose points when they misread table labels or fail to recognize whether a question asks for a count, a probability, or a percentage. Another testing pitfall involves Venn diagram problems where students correctly identify individual set sizes but forget to account for the intersection when calculating unions. Time pressure causes students to skip the critical step of checking whether their answers make logical sense within the context of the problem.
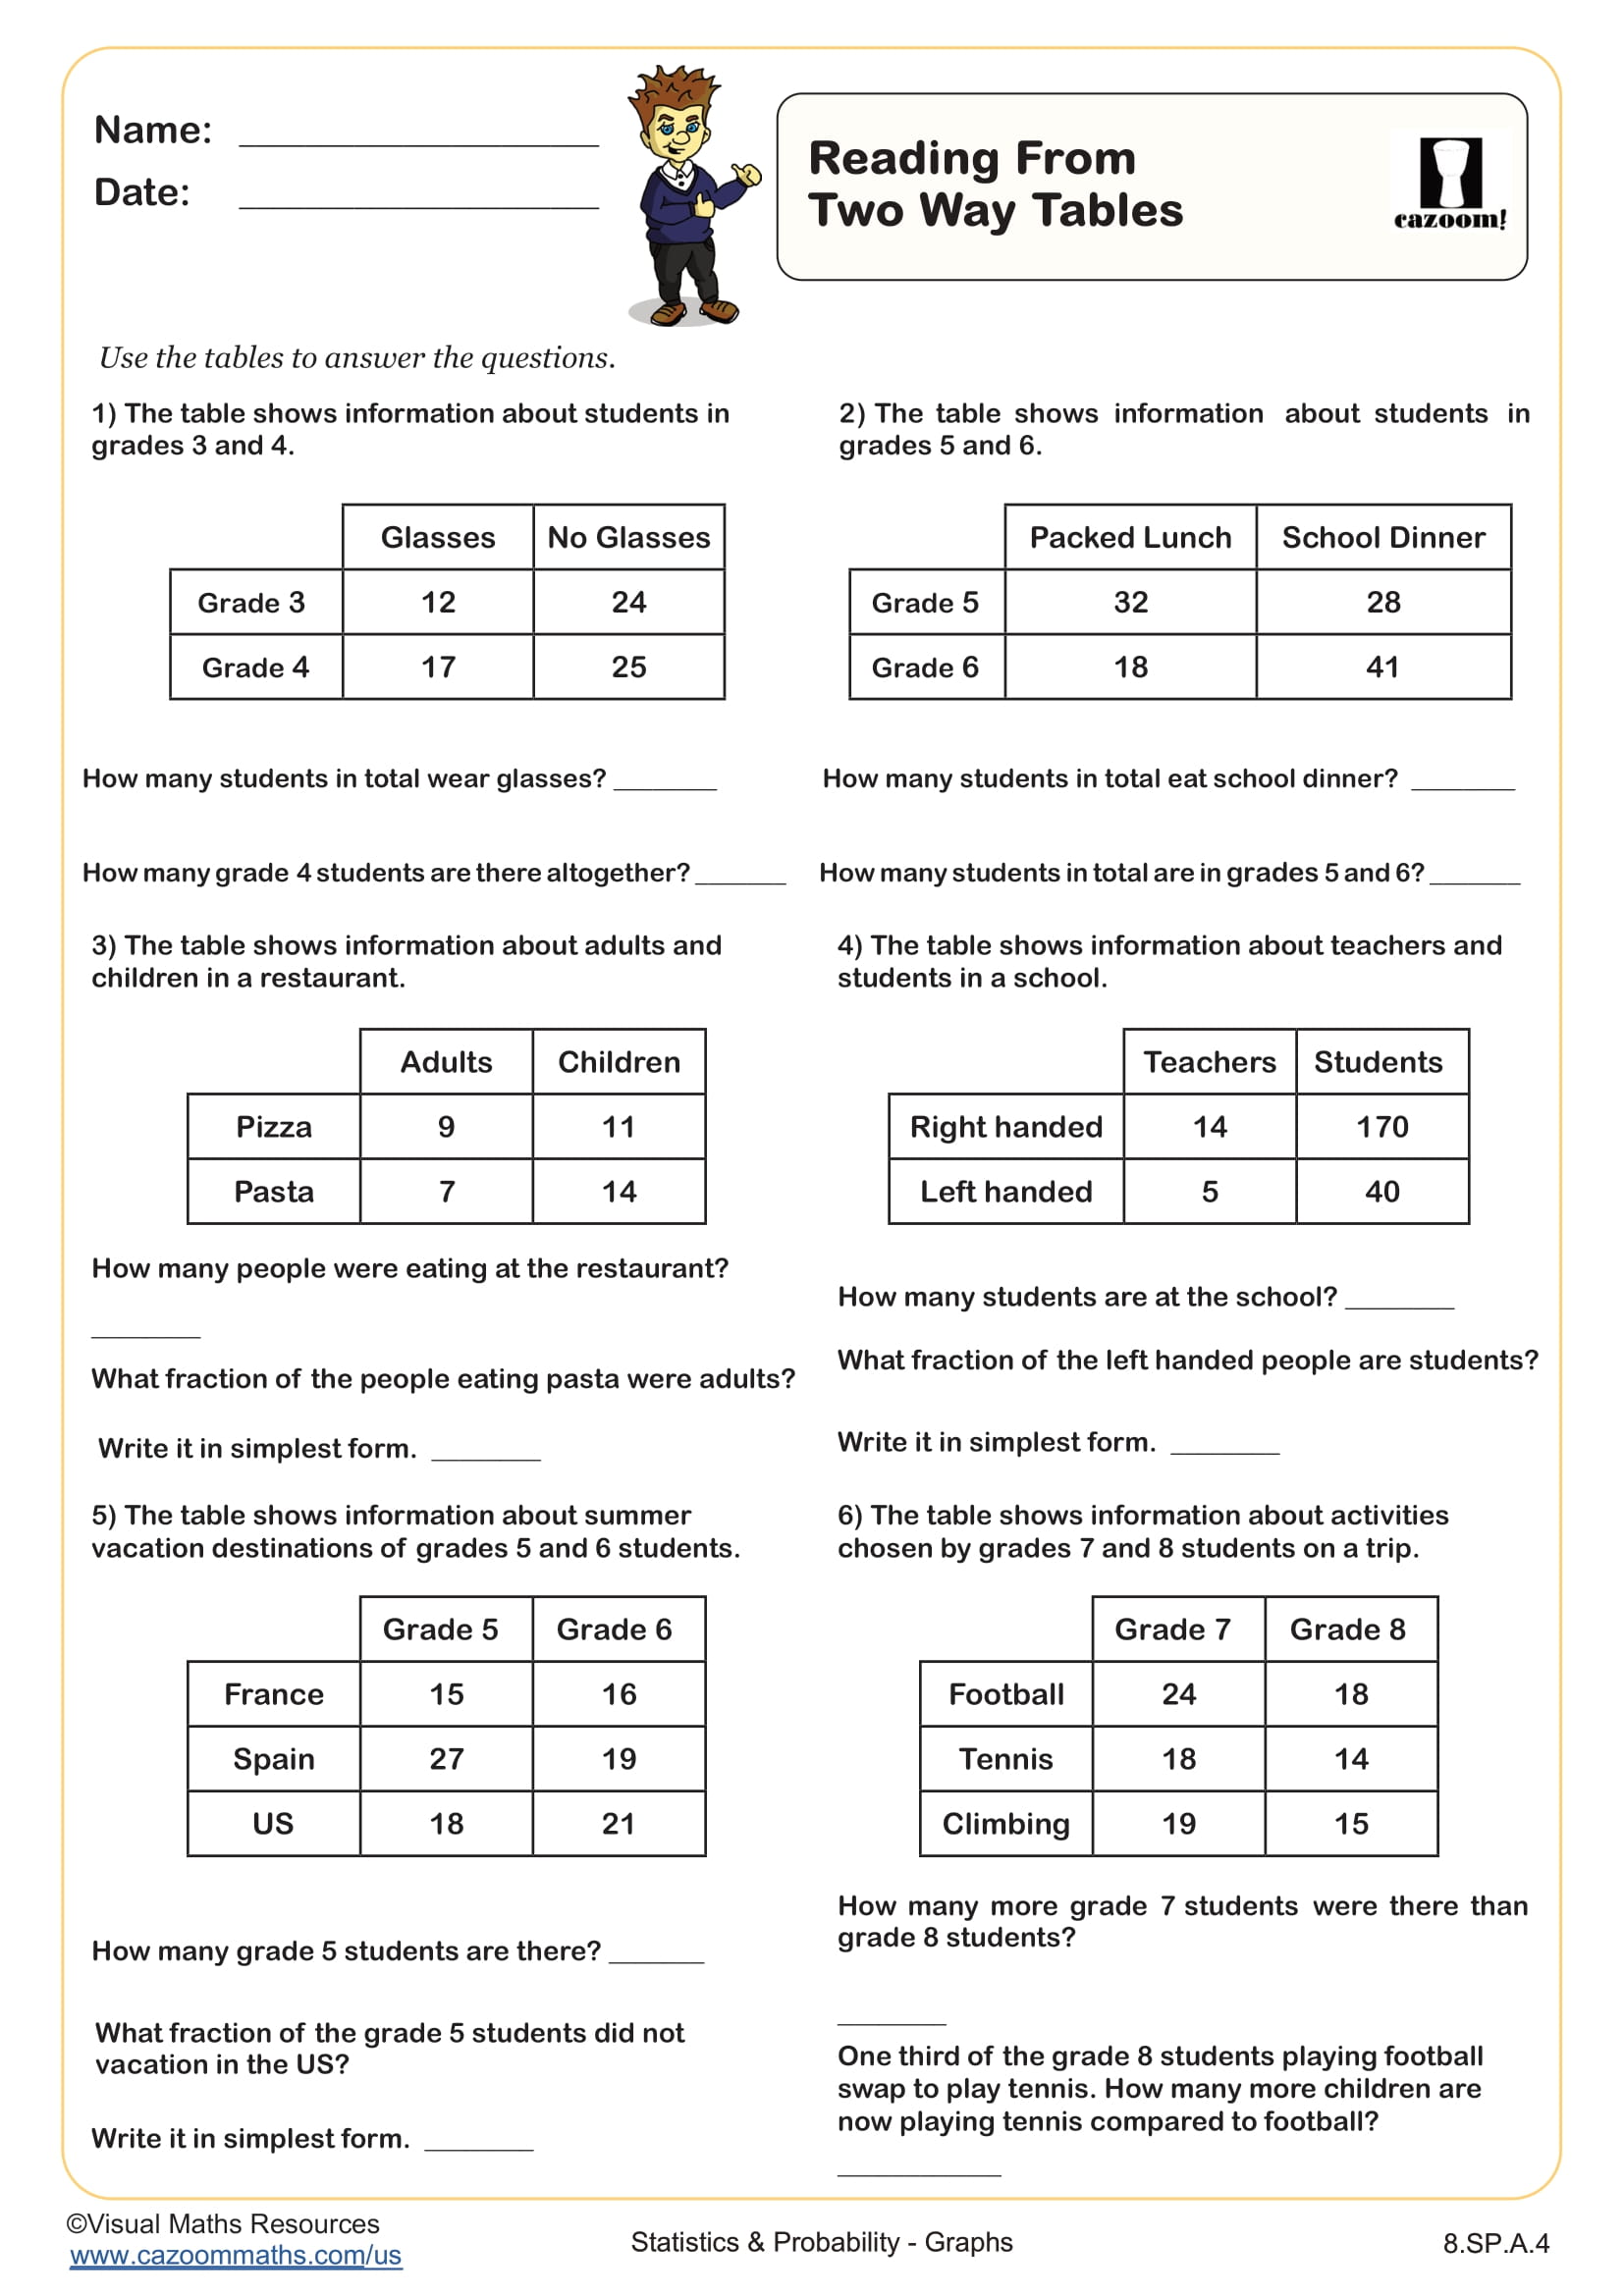
What Are Two-Way Tables and Why Do They Matter?
Two-way tables organize data by displaying the frequencies of observations that fall into categories defined by two different variables. Each cell shows how many data points share both the row category and the column category, while marginal totals along the edges show frequencies for single variables. This structure allows students to identify patterns, calculate conditional probabilities, and determine whether relationships exist between categorical variables like gender and career preference or age group and technology usage.
Two-way tables appear constantly in STEM fields and data-driven careers. Medical researchers use them to analyze treatment outcomes across patient demographics, marketing professionals examine consumer preferences by geographic region, and quality control engineers track defect rates across production shifts. Understanding how to construct and interpret these tables prepares students for statistics courses in college and equips them with analytical tools for fields ranging from public health to business analytics.
How Can Teachers Use These Statistics Worksheets in Integrated Math 1?
These worksheets provide structured practice with reading two-way tables and solving Venn diagram problems, skills that students need to master before tackling more complex probability and data analysis topics. The answer keys allow teachers to implement self-checking stations where students verify their work immediately, identify errors, and rework problems before misconceptions solidify. The progression from straightforward table reading to multi-step problem solving helps students build confidence with categorical data.
Many teachers use these worksheets for differentiated instruction, assigning two-way table problems to students who need concrete organizational structures while challenging advanced learners with Venn diagram problems involving three sets or complement relationships. The worksheets work well as warm-up activities to activate prior knowledge before introducing relative frequency or as targeted review before unit assessments. Paired work encourages students to verbalize their reasoning about which frequencies to use for specific calculations, strengthening conceptual understanding beyond procedural memorization.