Middle School Bivariate Data Worksheets
All worksheets are created by the team of experienced teachers at Cazoom Math.
What topics are covered in a bivariate data worksheet?
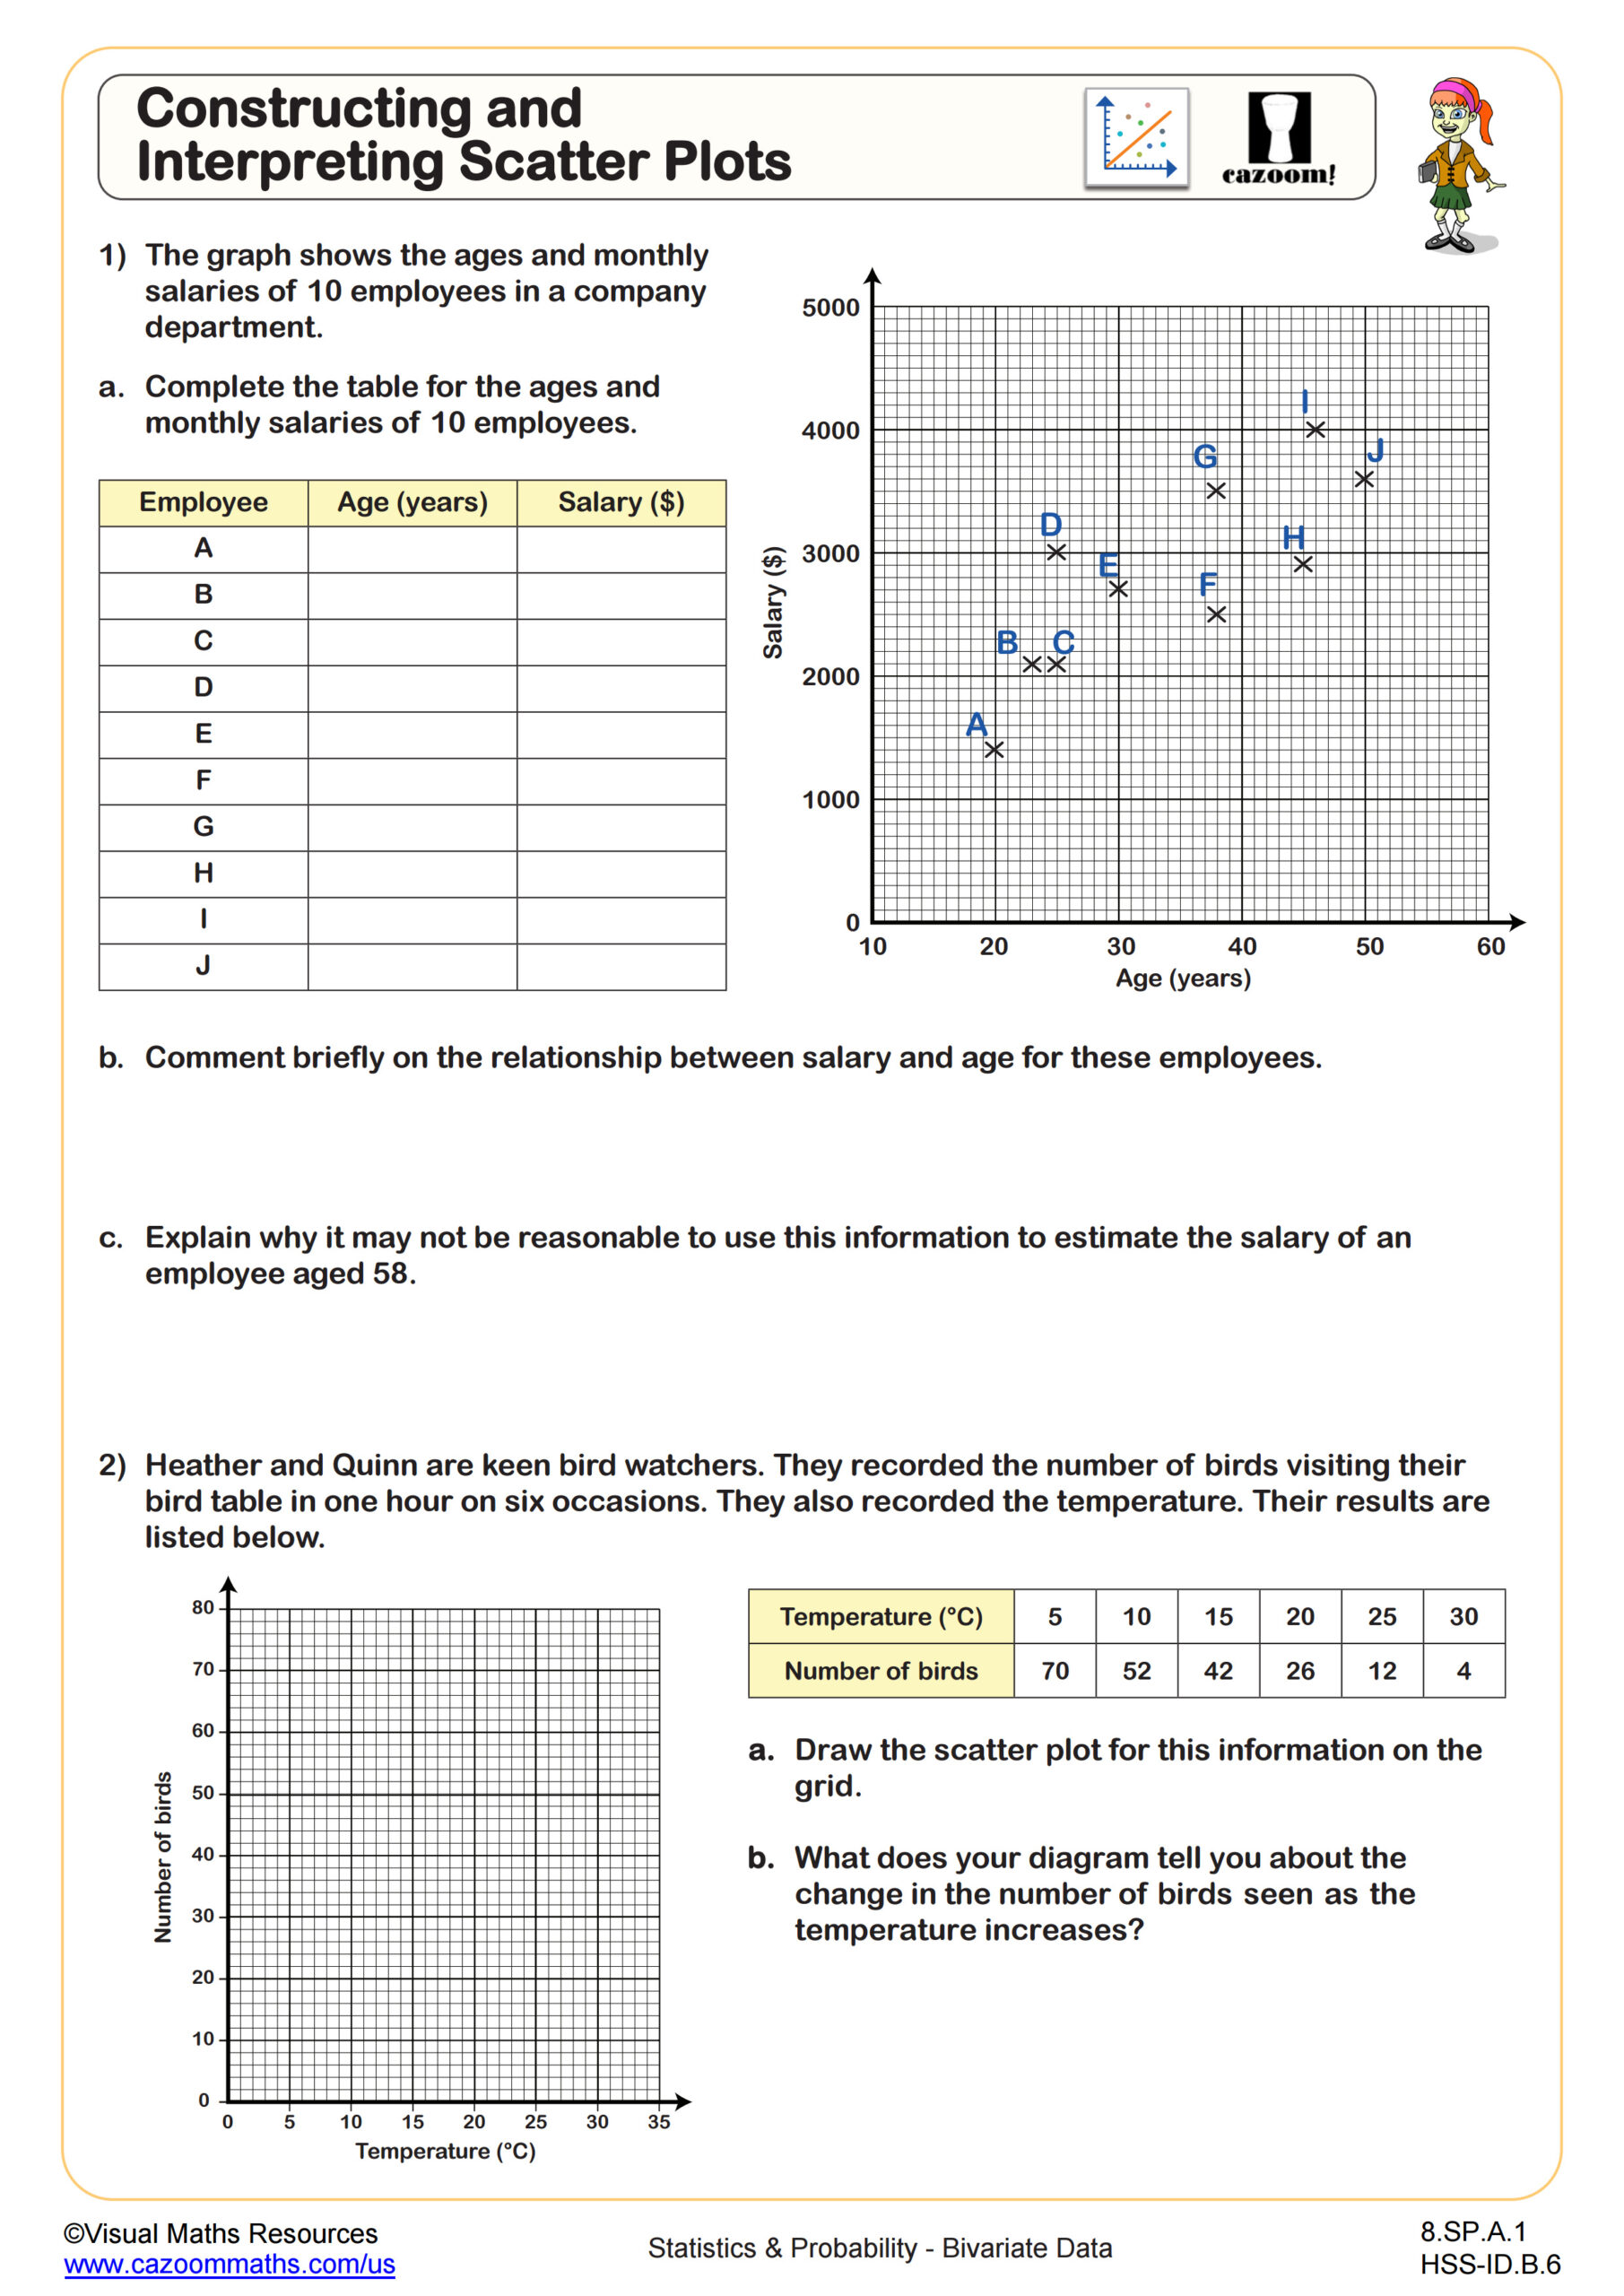
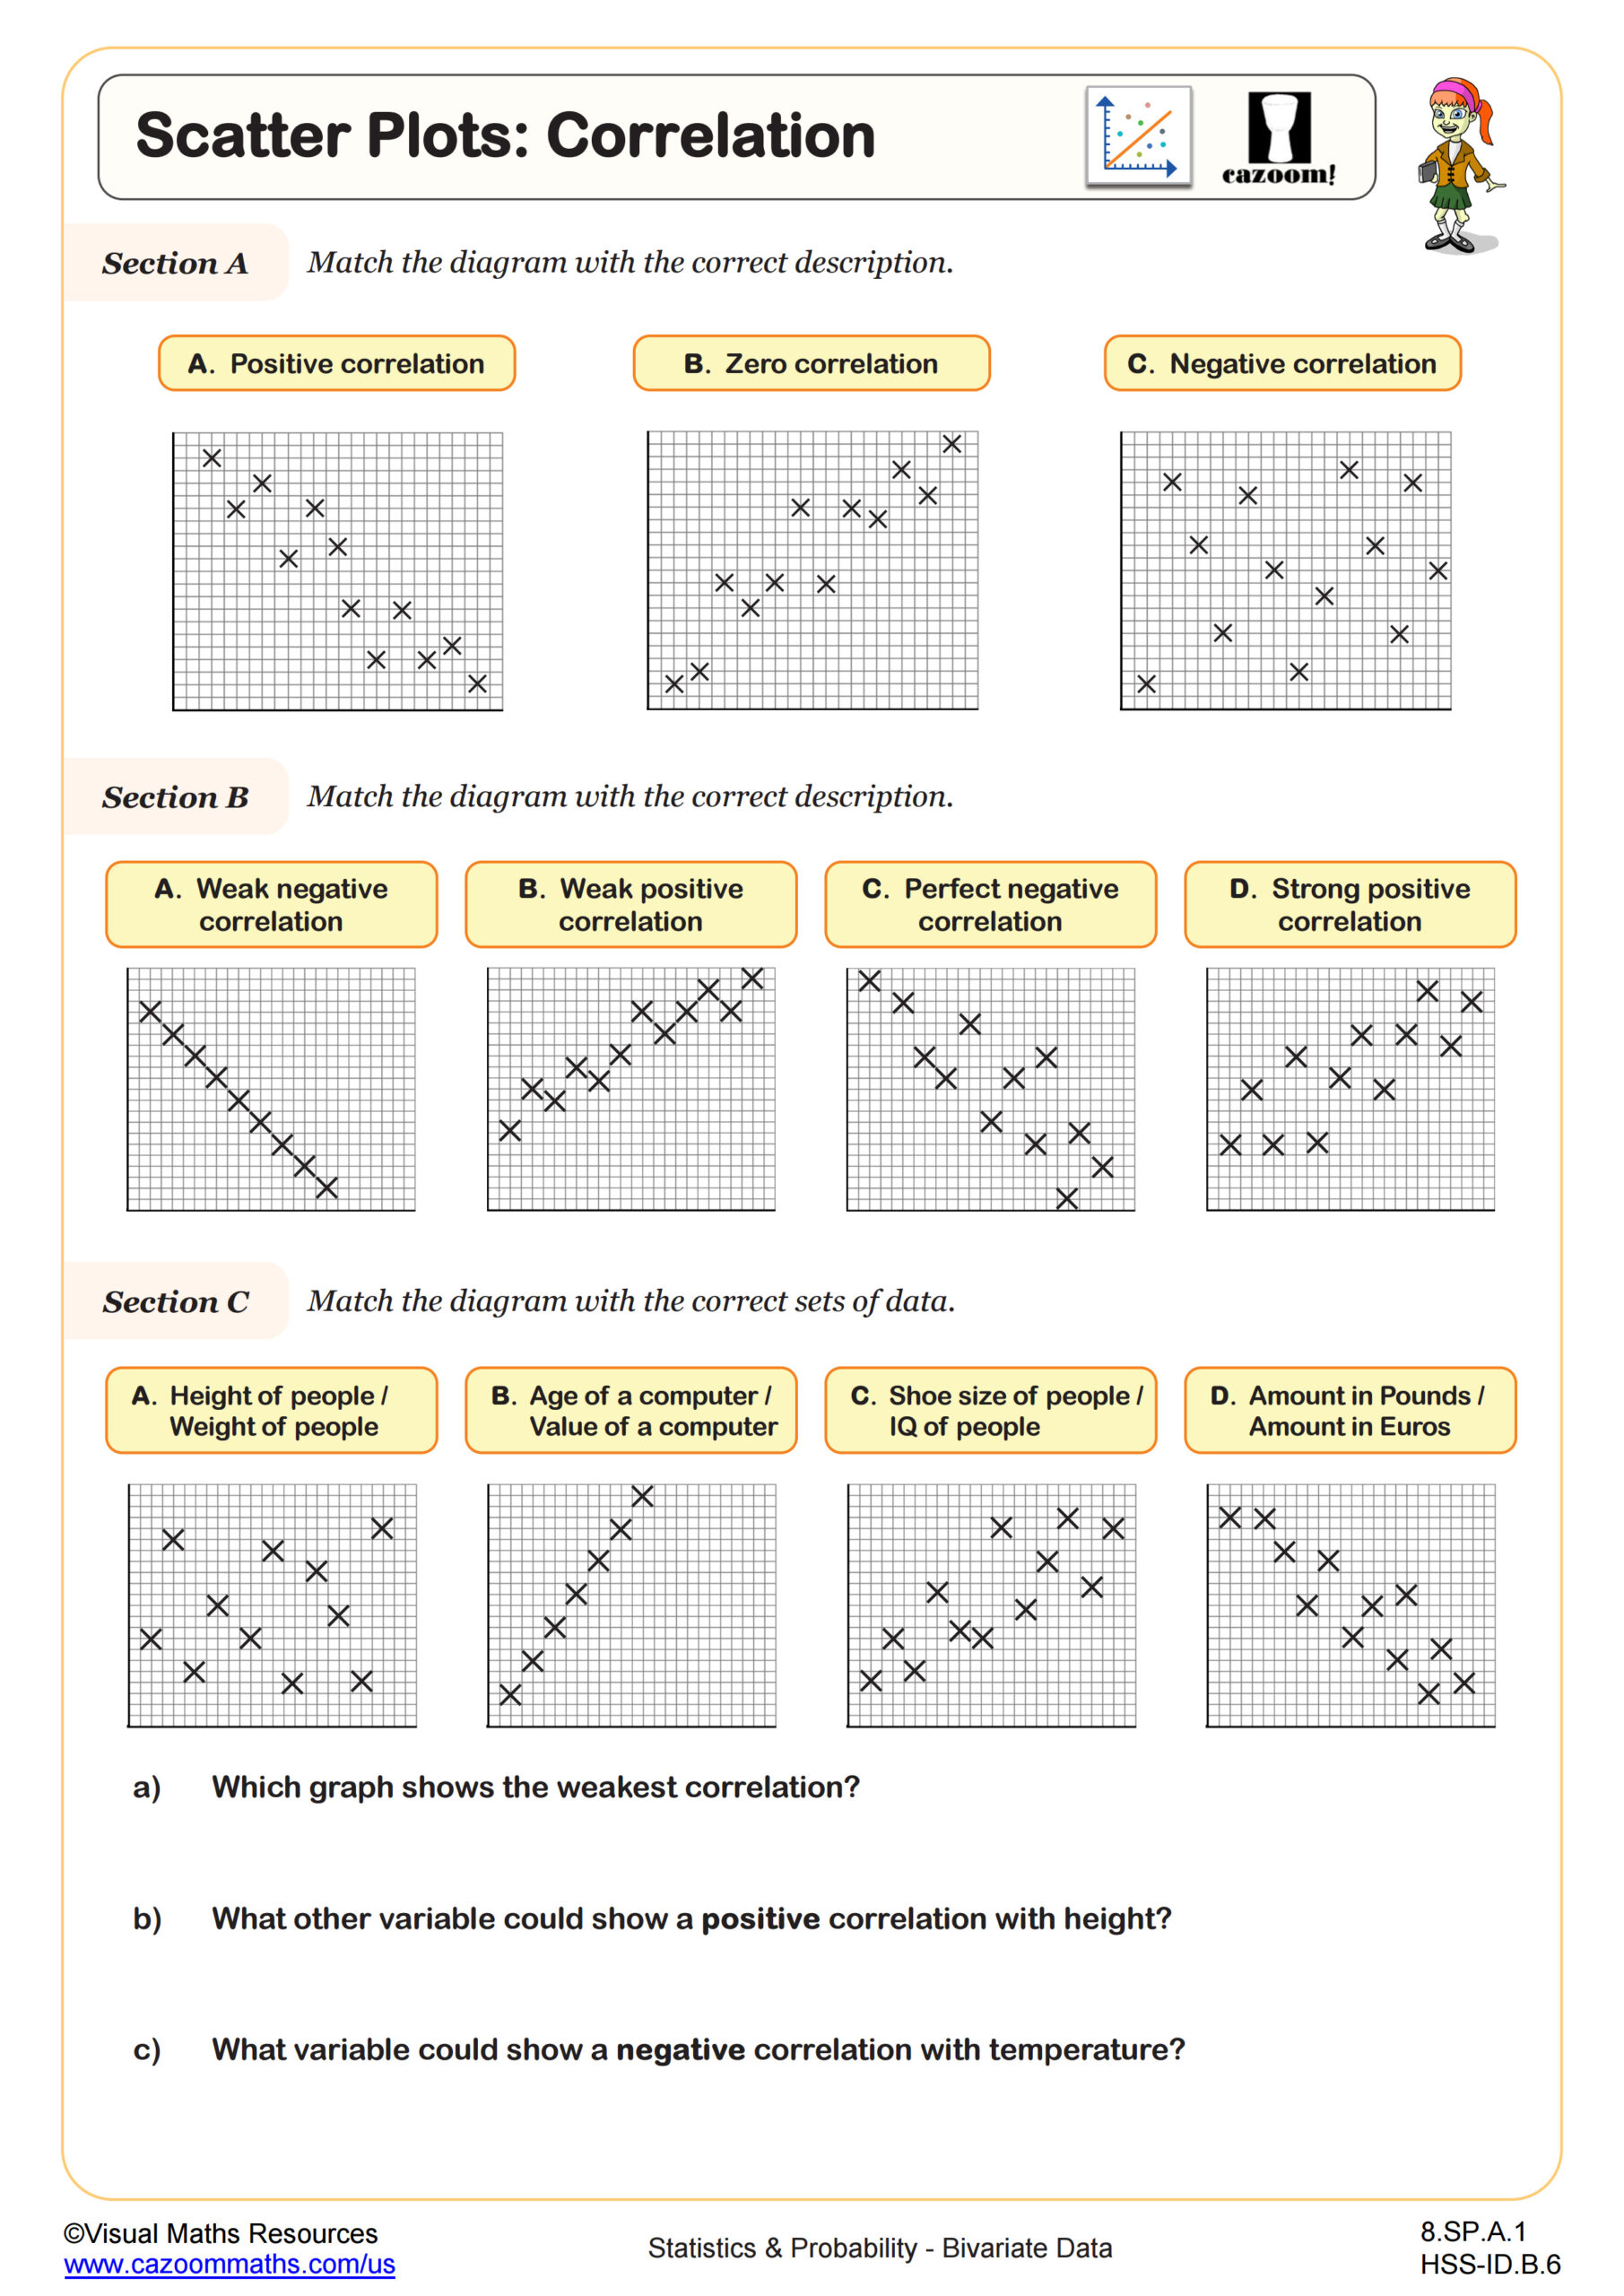
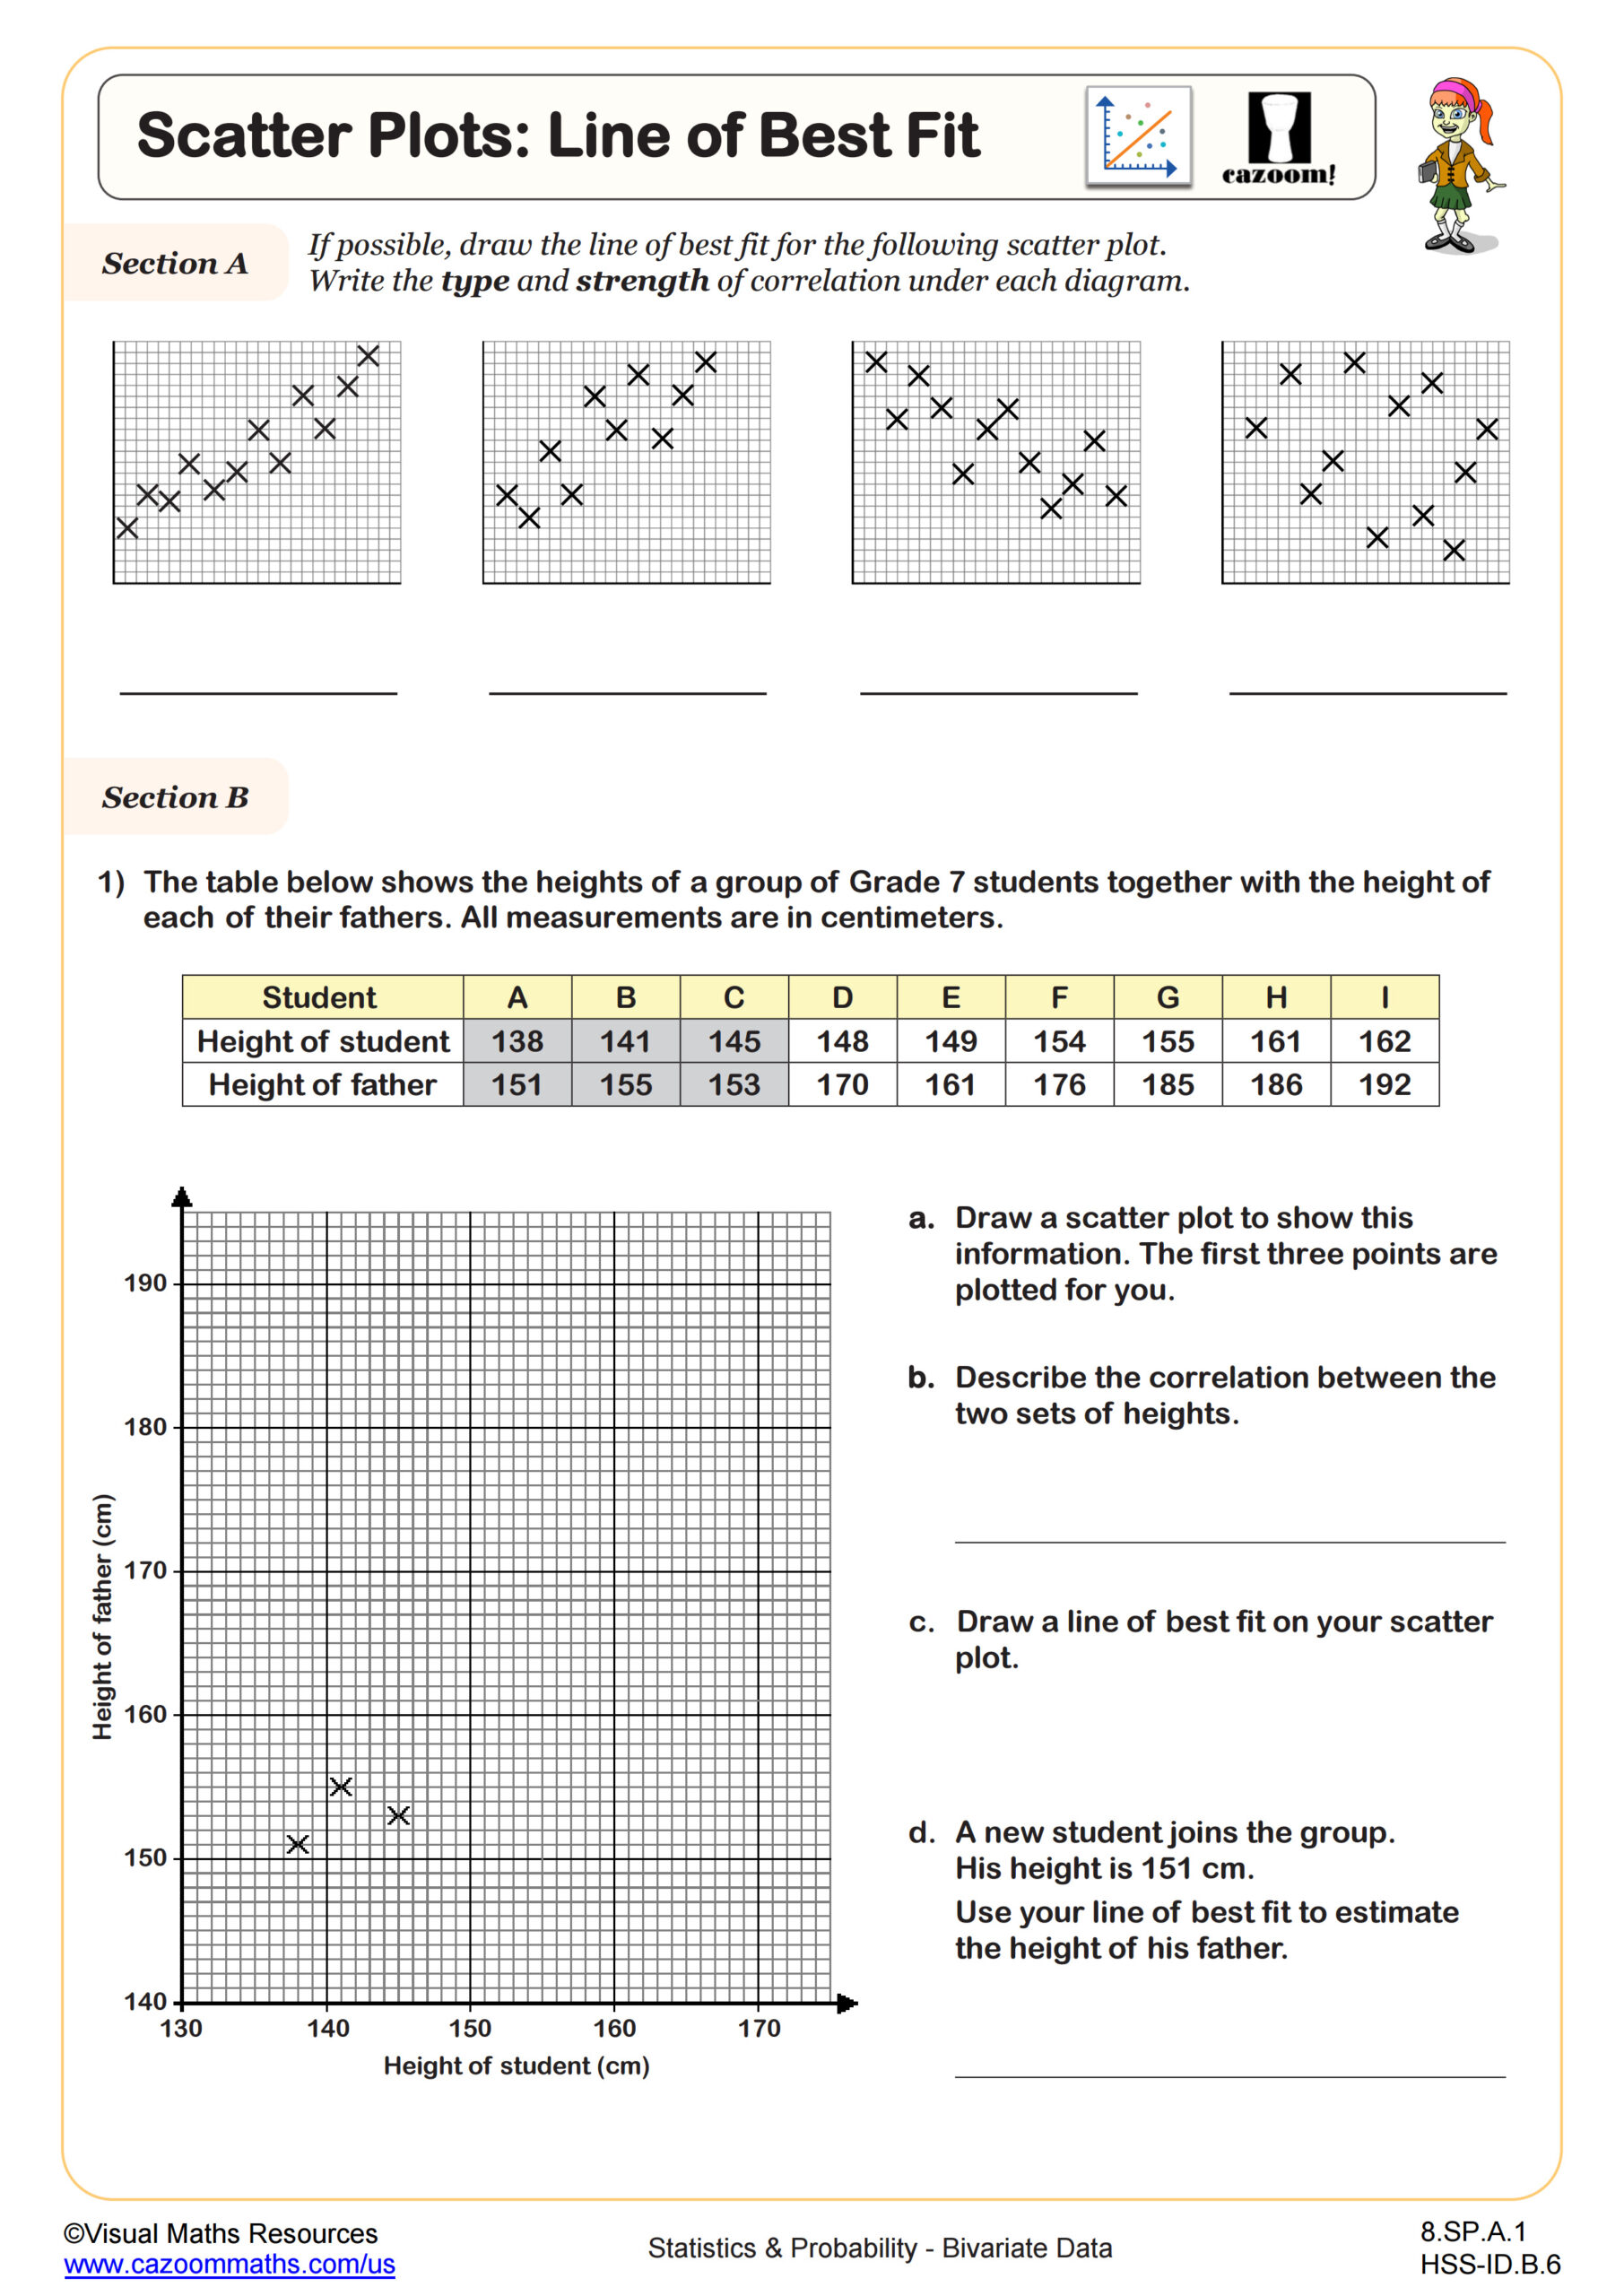
A thorough bivariate data worksheet typically covers scatter plots, correlation types (positive, negative, no correlation), lines of best fit, and two-way frequency tables. These align with Common Core standards 8.SP.A.1 through 8.SP.A.3, which focus on constructing and interpreting scatter plots and understanding linear associations between variables.
Teachers notice students often confuse correlation with causation when analyzing bivariate data. The worksheets address this misconception by including questions that require students to explain whether observed relationships suggest causation or simply correlation, preparing them for more advanced statistical reasoning in high school.
What grade levels use bivariate data worksheets?
Bivariate data worksheets are primarily designed for grades 6-8, though some concepts appear as early as grade 5 in advanced programs and extend into high school statistics courses. Grade 6 students typically work with simple scatter plots and basic correlation identification, while grades 7-8 tackle more complex analysis including trend lines and making predictions.
The progression moves from recognizing patterns in data to quantifying relationships and using them for predictions. Teachers find that starting with familiar contexts like height versus shoe size helps students grasp the concept before moving to more abstract datasets involving scientific measurements or economic indicators.
How do students learn to create accurate scatter plots?
Creating accurate scatter plots requires students to properly scale axes, plot points precisely, and choose appropriate intervals for both variables. Many worksheets begin with pre-scaled grids before advancing to problems where students must determine their own scales based on the data range.
Teachers consistently observe that students lose points by rushing through the axis labeling and scaling process. Common errors include starting axes at zero when the data doesn't warrant it, or choosing scales that compress the data too much to show meaningful patterns. Practice with varied datasets helps students develop judgment about appropriate scaling decisions.
How can teachers effectively use bivariate data worksheets with answers?
Teachers find these worksheets most effective when used for guided practice followed by independent work, with the answer keys serving as immediate feedback tools. Starting with collaborative work on the first few problems allows teachers to address common misconceptions before students practice independently.
The answer keys prove particularly valuable for self-assessment and peer review activities. Many teachers have students work in pairs to complete problems, then use the answer keys to check their work and discuss any discrepancies. This approach builds statistical reasoning skills while reducing grading time for teachers managing multiple math classes.