Middle School Cumulative Frequency and Box Plots Worksheets
All worksheets are created by the team of experienced teachers at Cazoom Math.
Struggling With Measurement and Data Skills? Cazoom Math Printable Resources Offer the Fix
Middle school students enter with prior knowledge of bar charts and basic tallies because they learned these concepts during their elementary education. The five-number summary extends the basic idea through its presentation in a condensed visual format known as a box plot. Students develop the ability to detect spread, outliers, and skewness through direct practice with reading and drawing diagrams instead of dealing with extensive numerical data. Regular practice enables people to identify patterns, which simplifies the process of calculating quartiles. The skills directly relate to high school statistics because they involve distribution comparison, hypothesis testing, and bivariate data exploration. Early mastery enables students to tackle advanced analytical work that they would encounter in later stages of their learning.
Curriculum Alignment: What Middle School Statistics Worksheets Include for Complete Learning
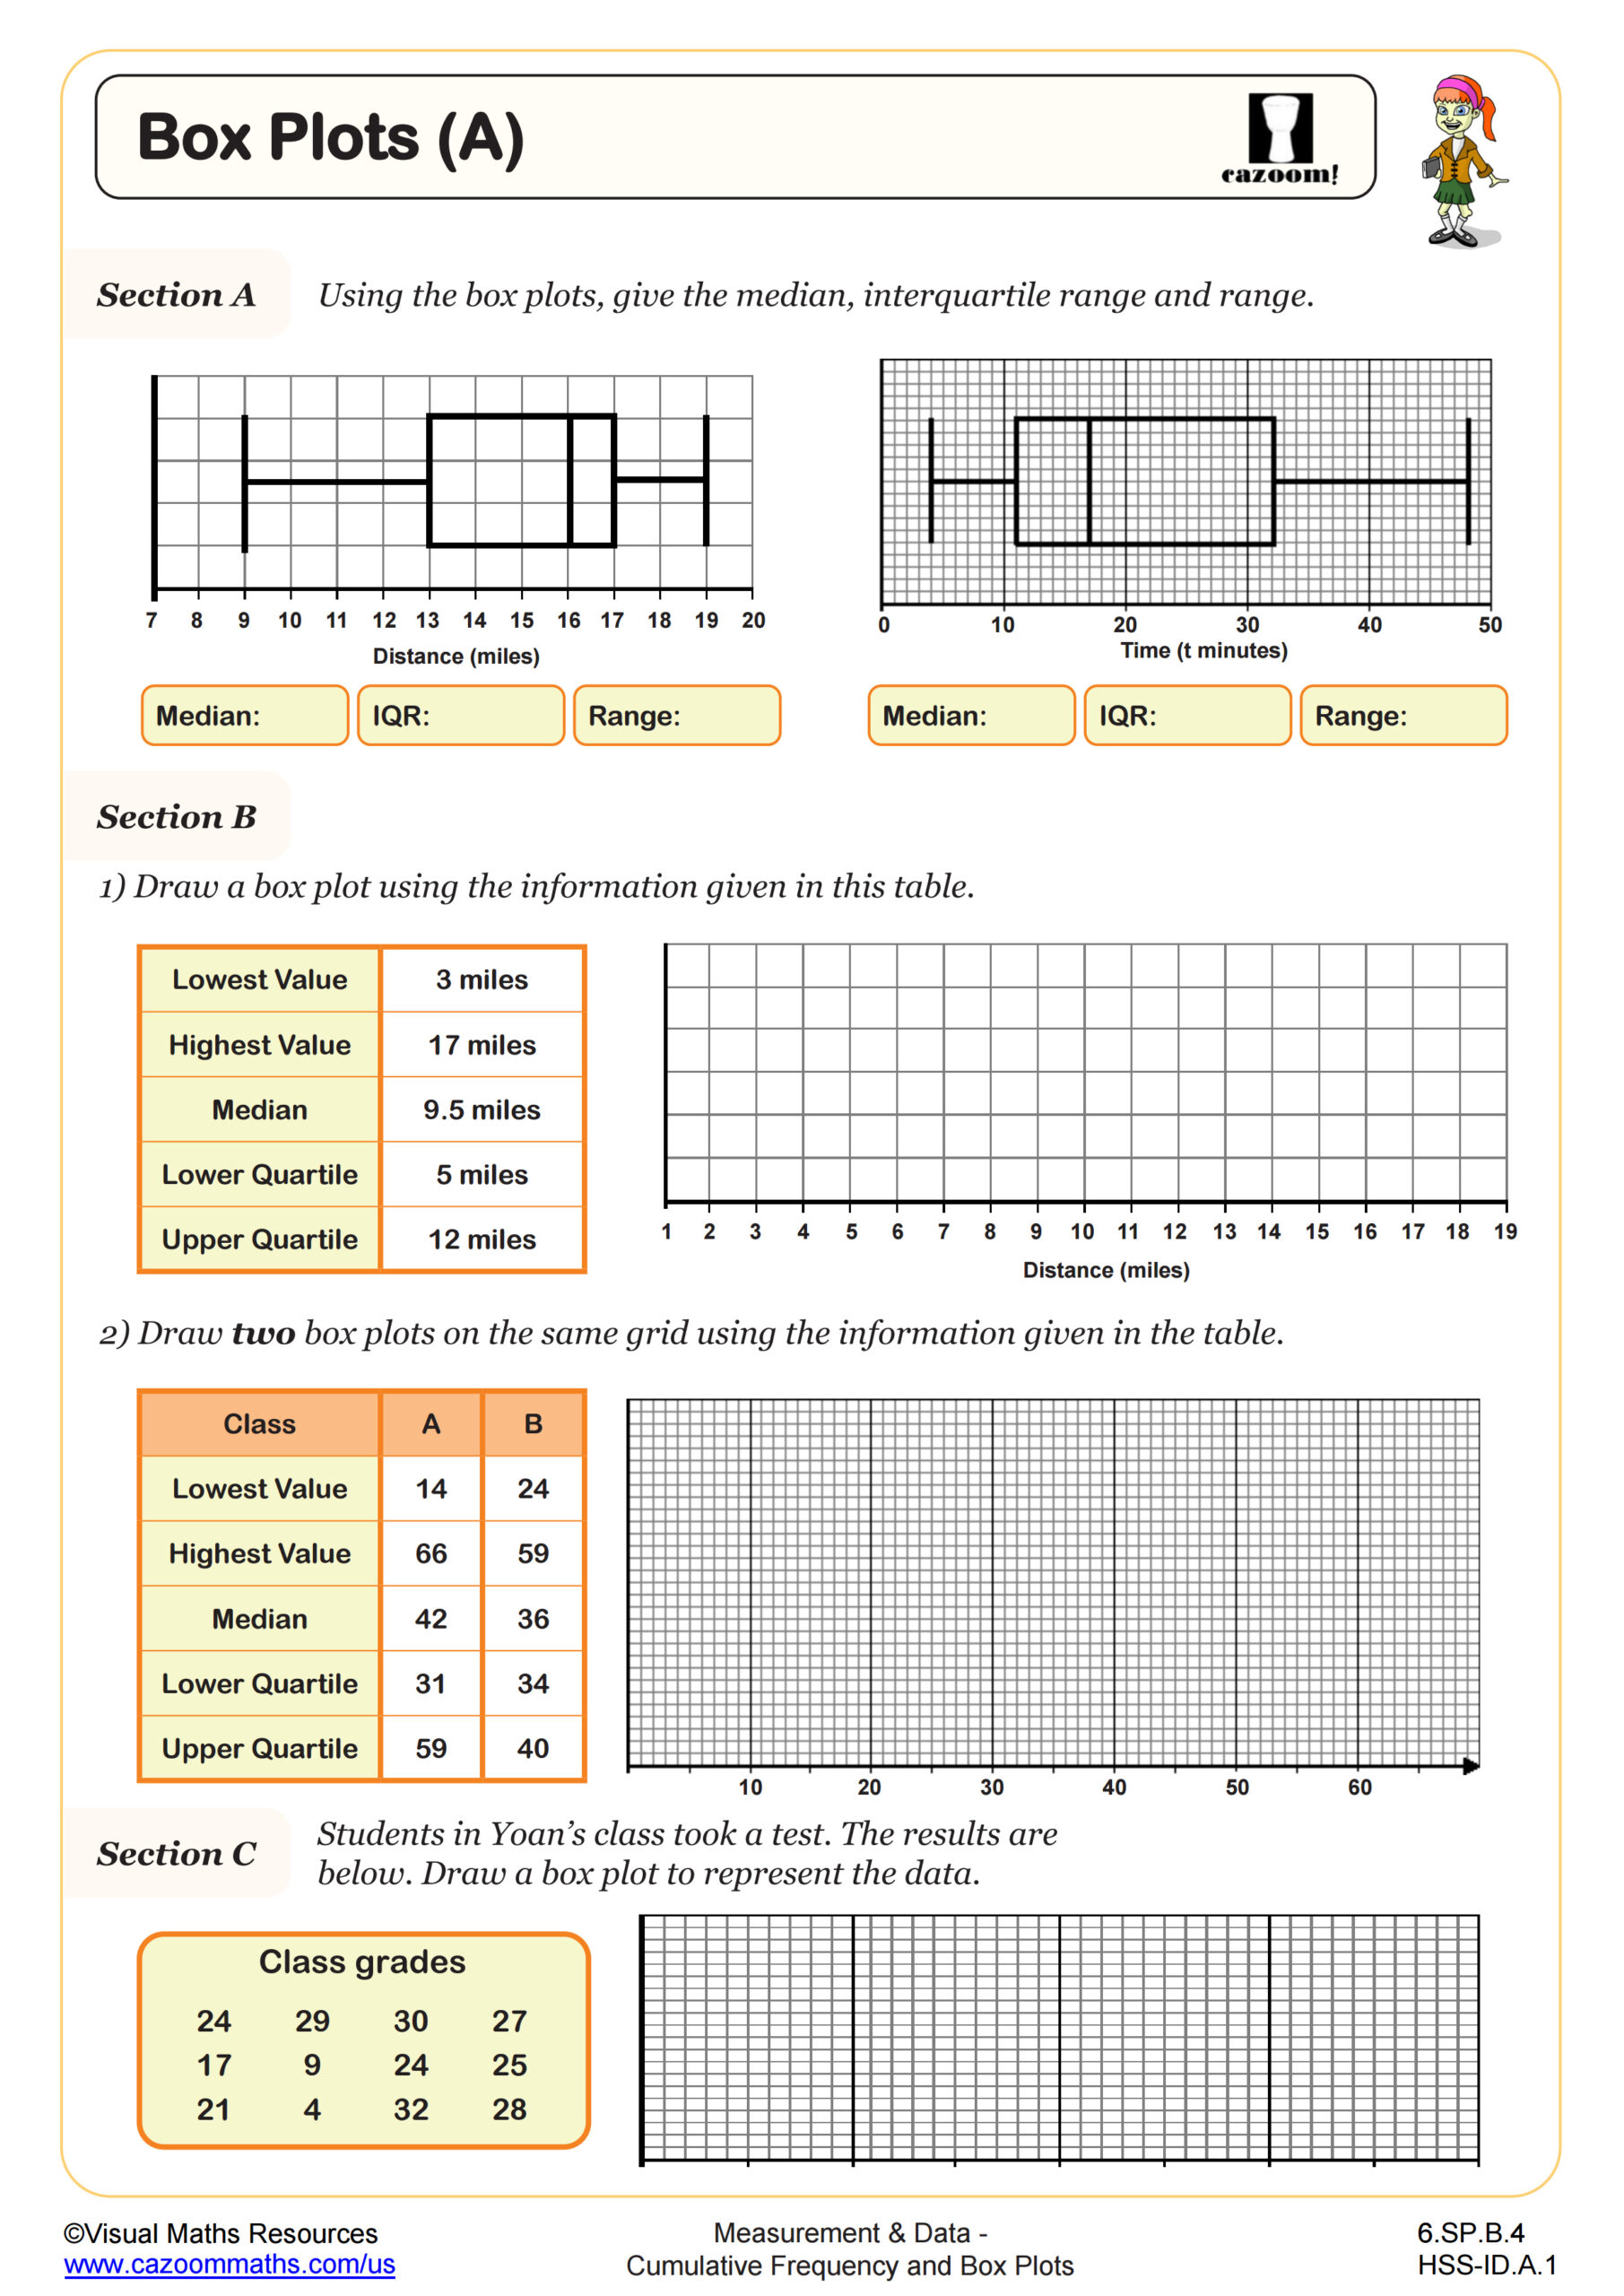
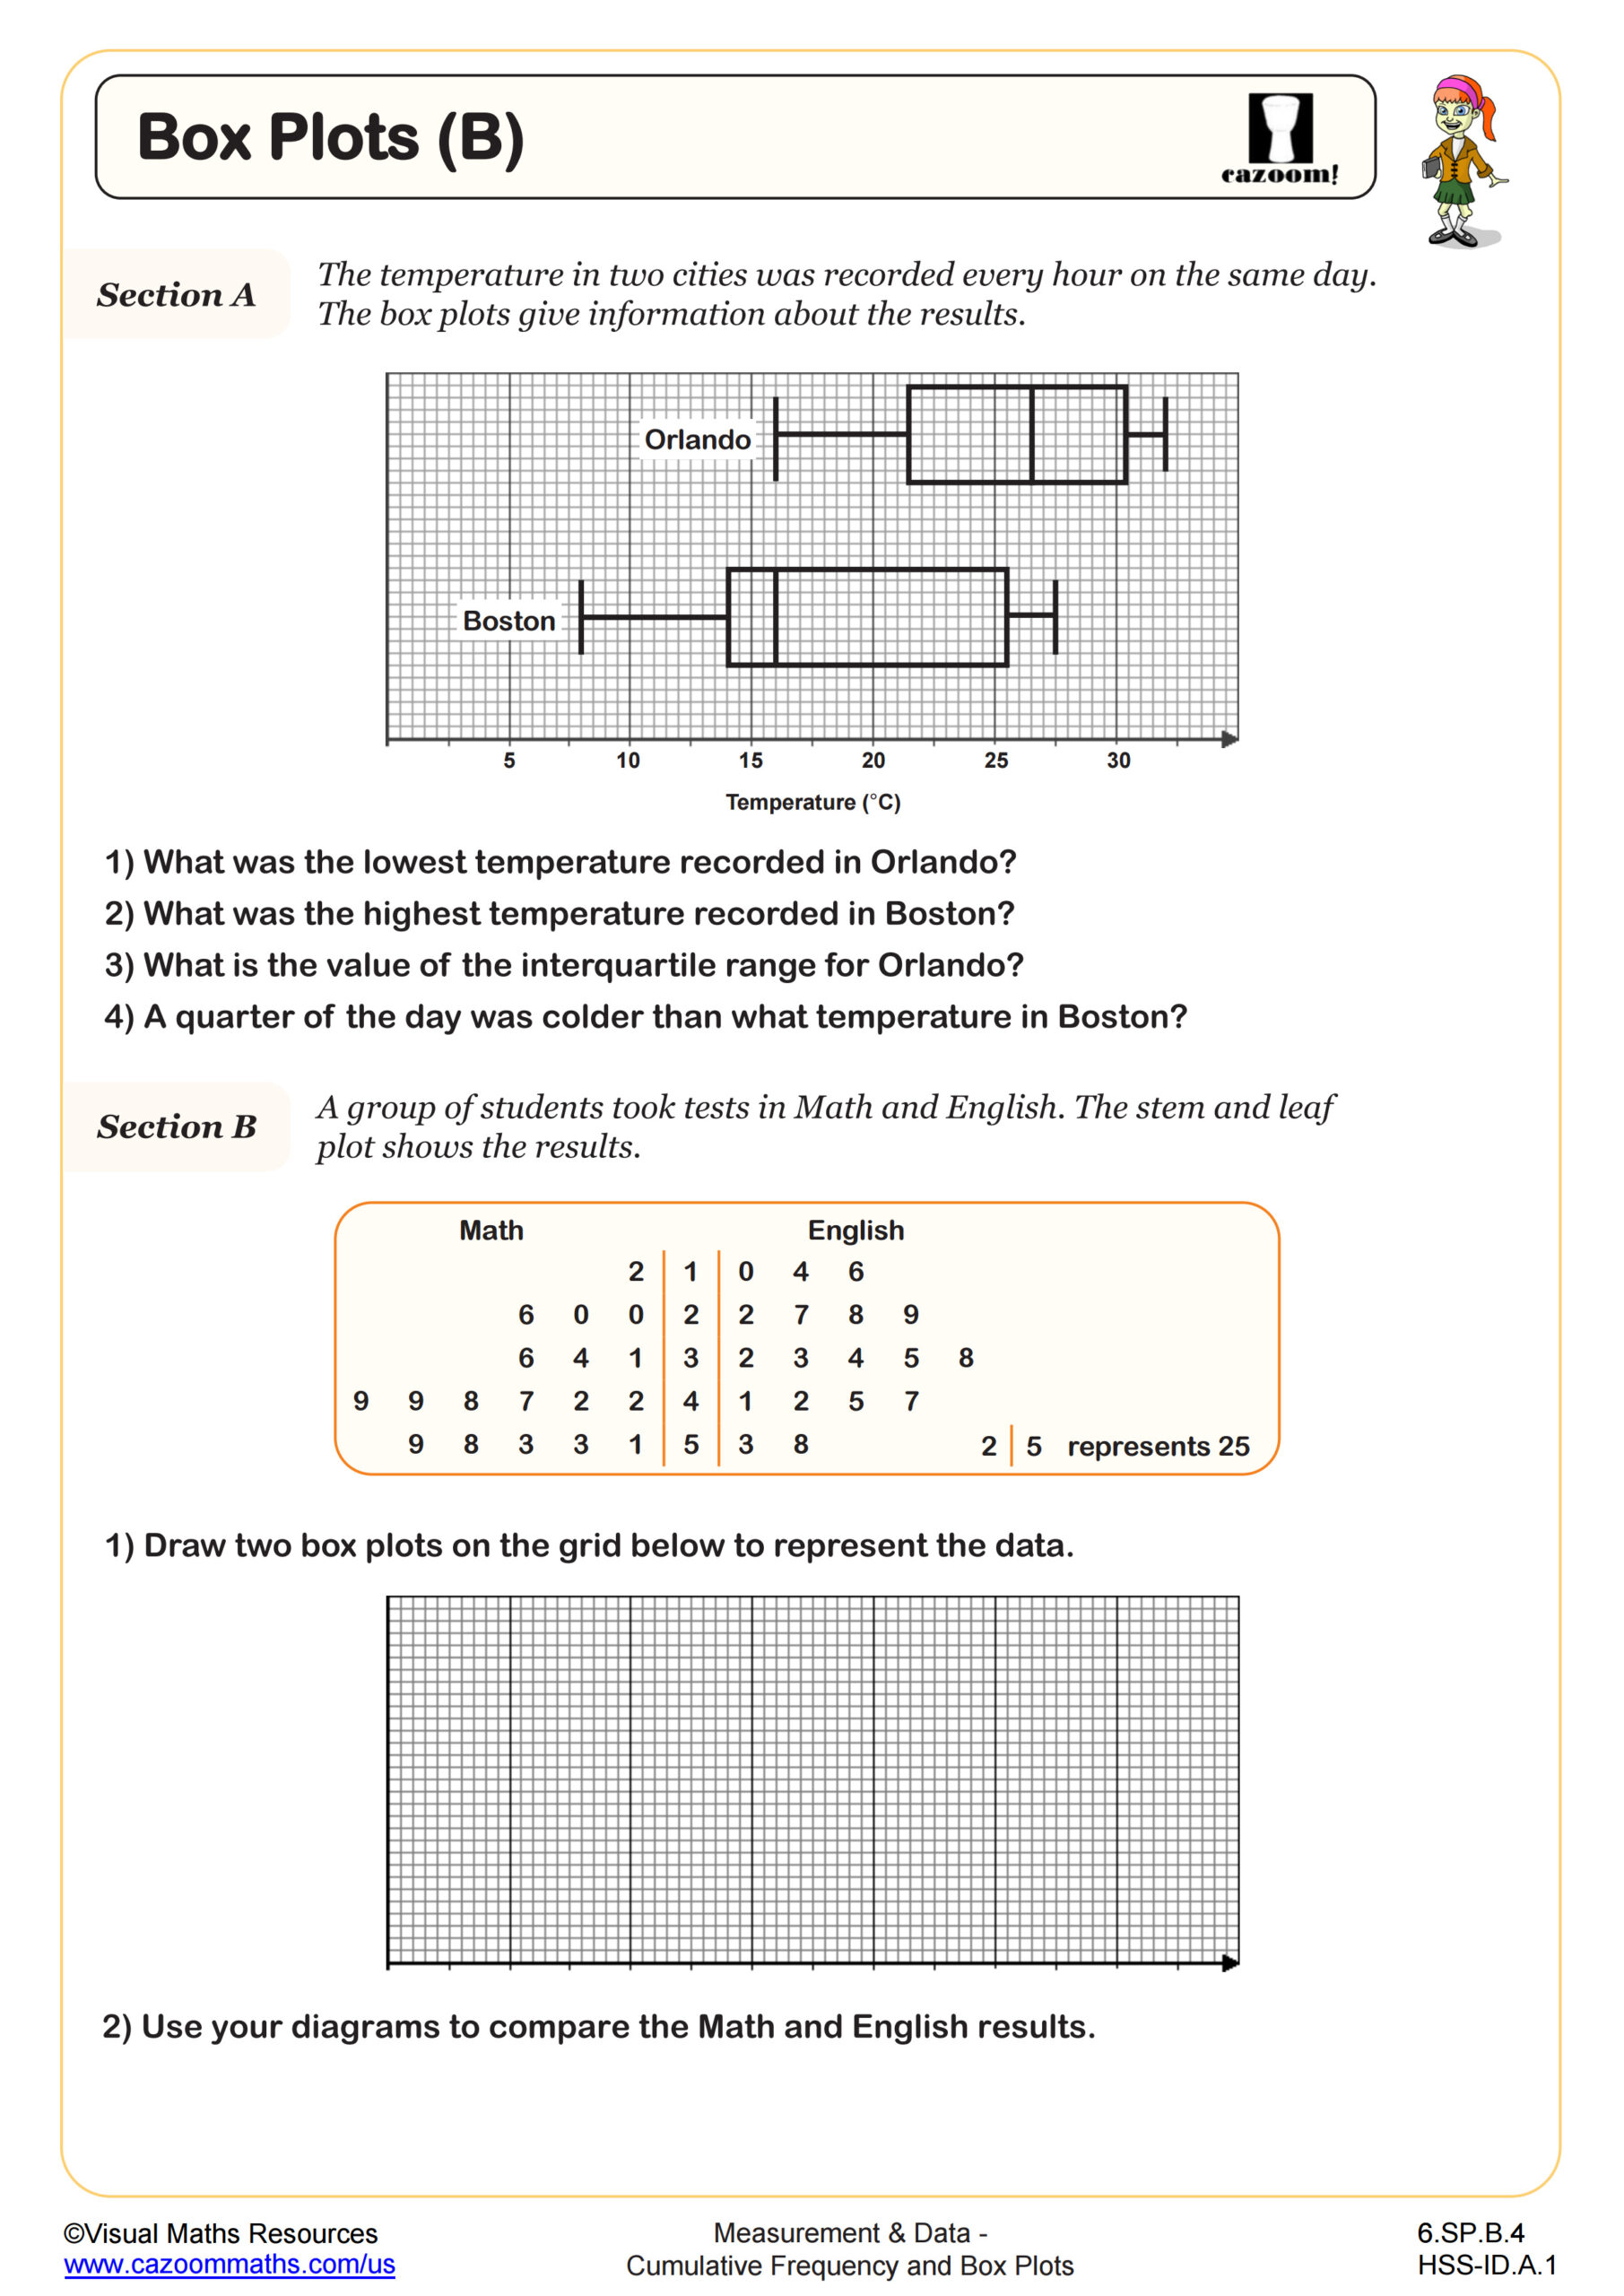
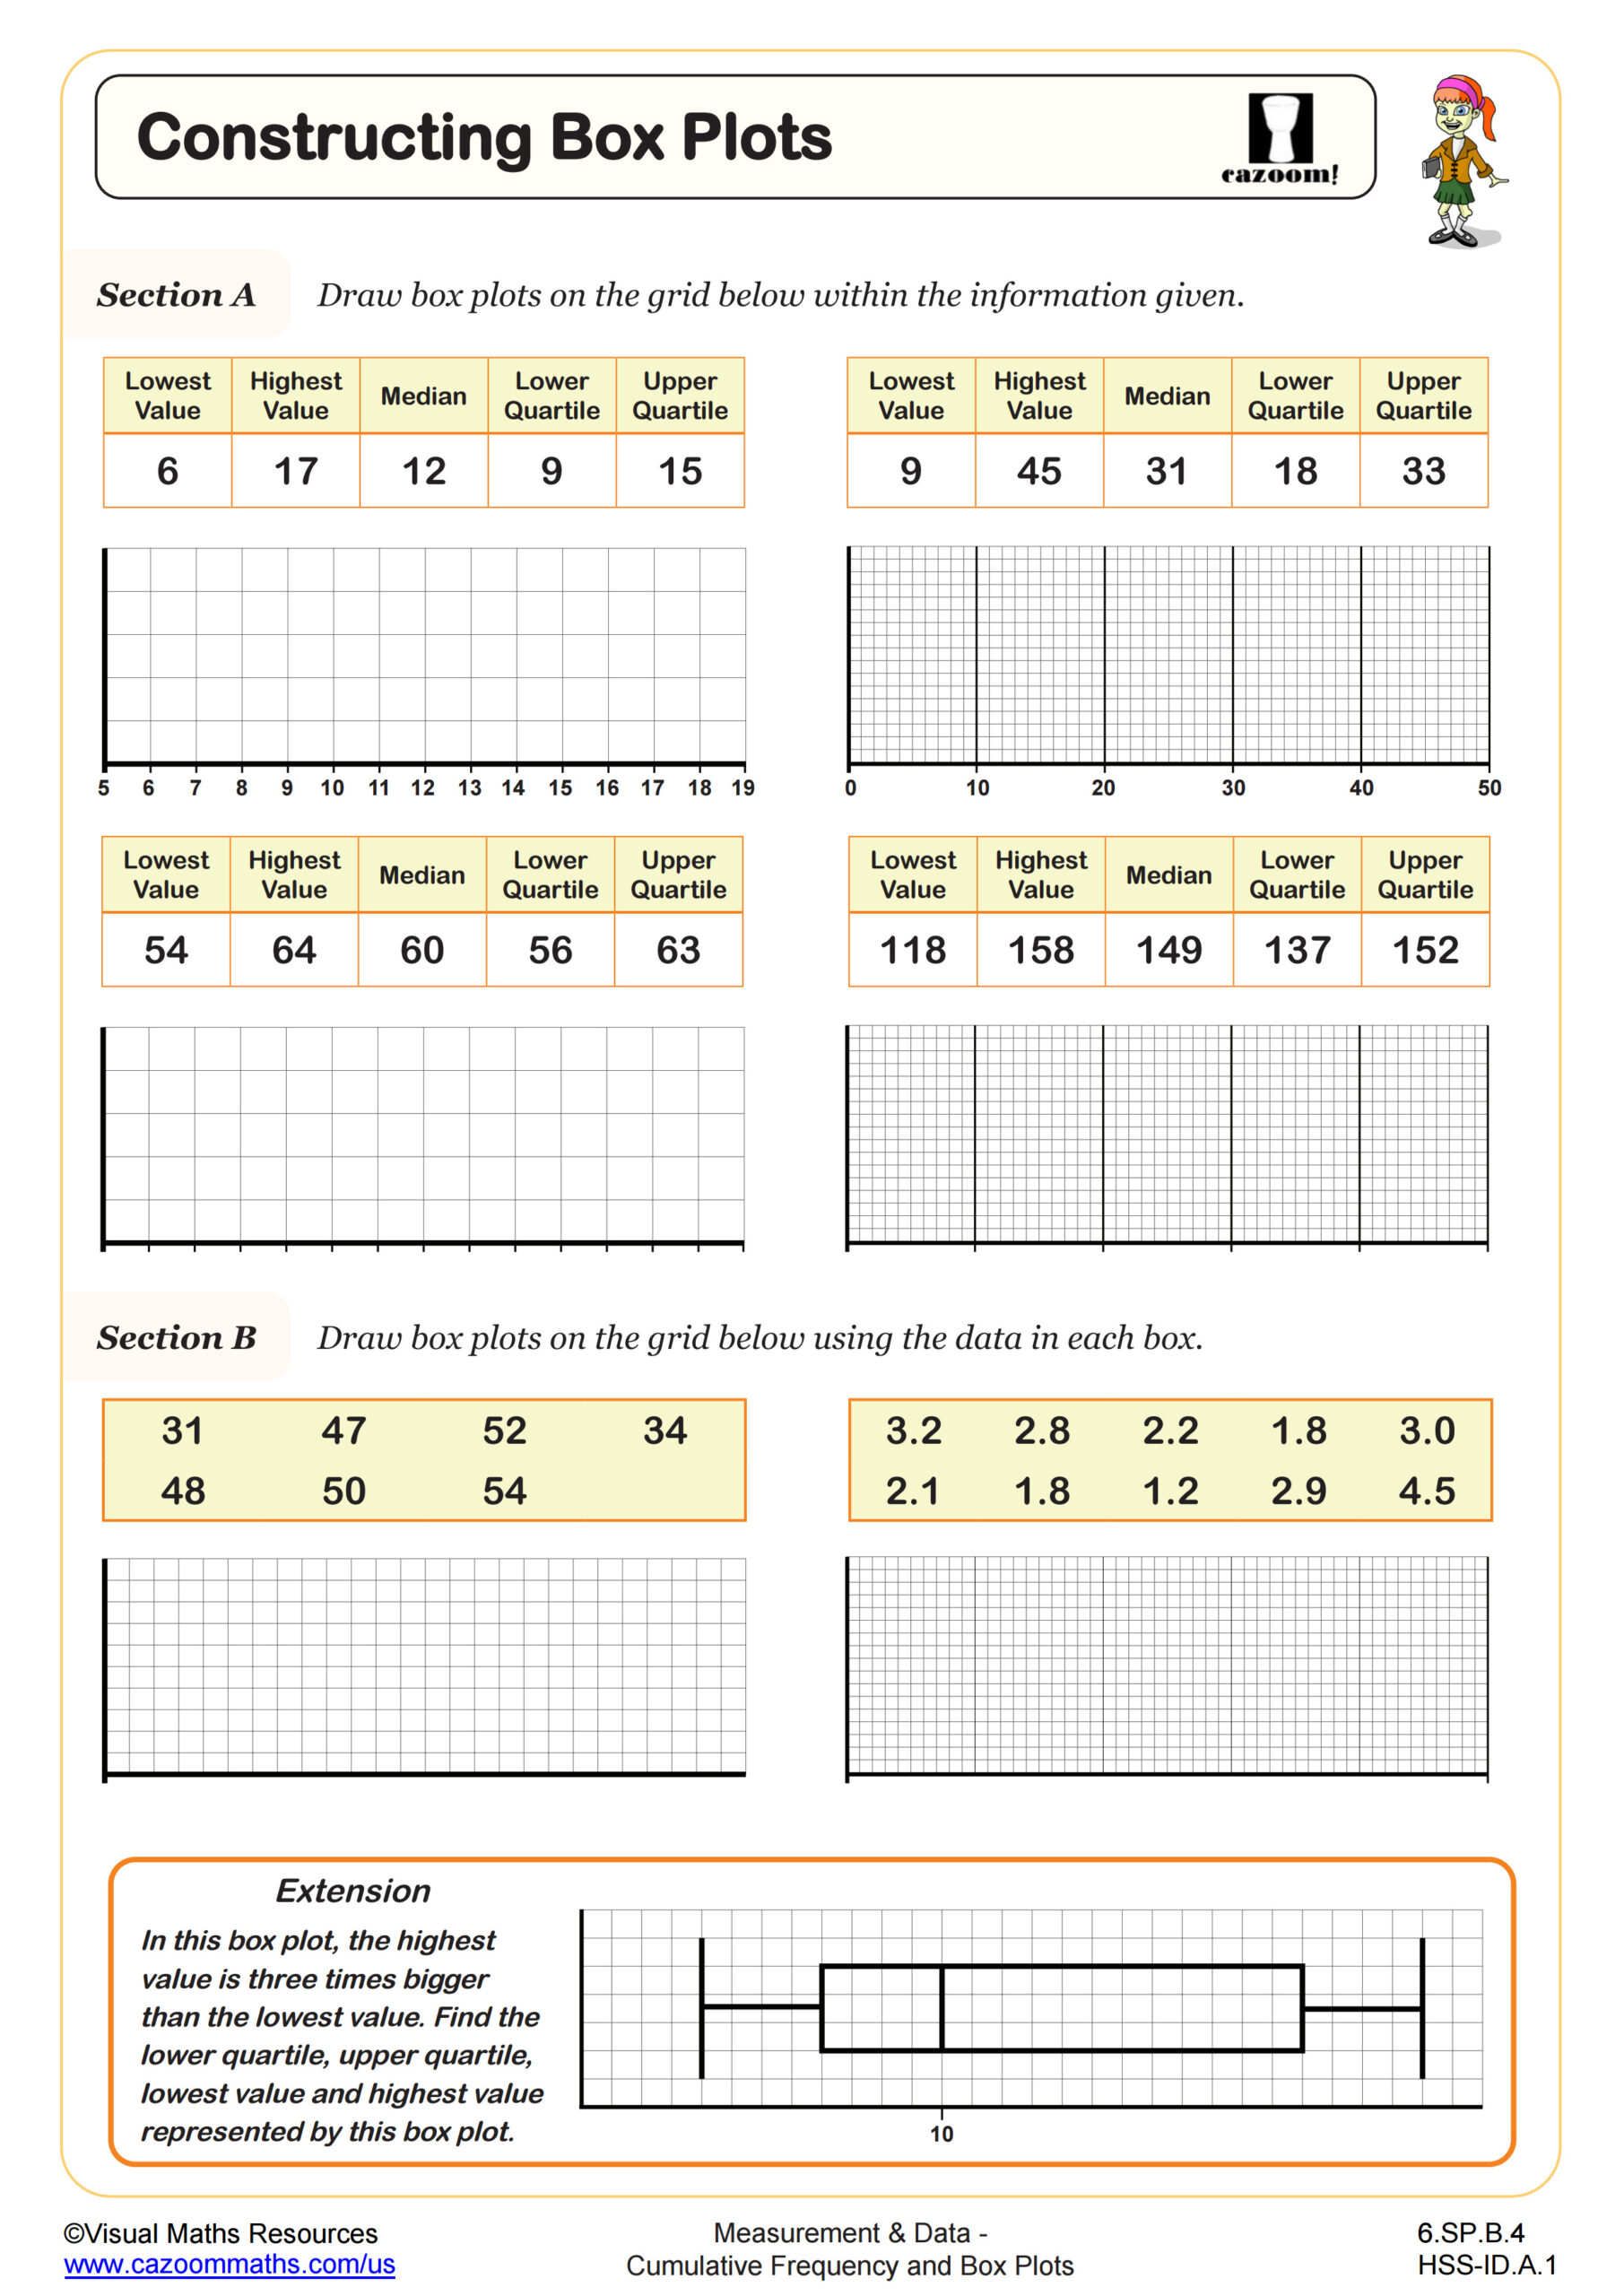
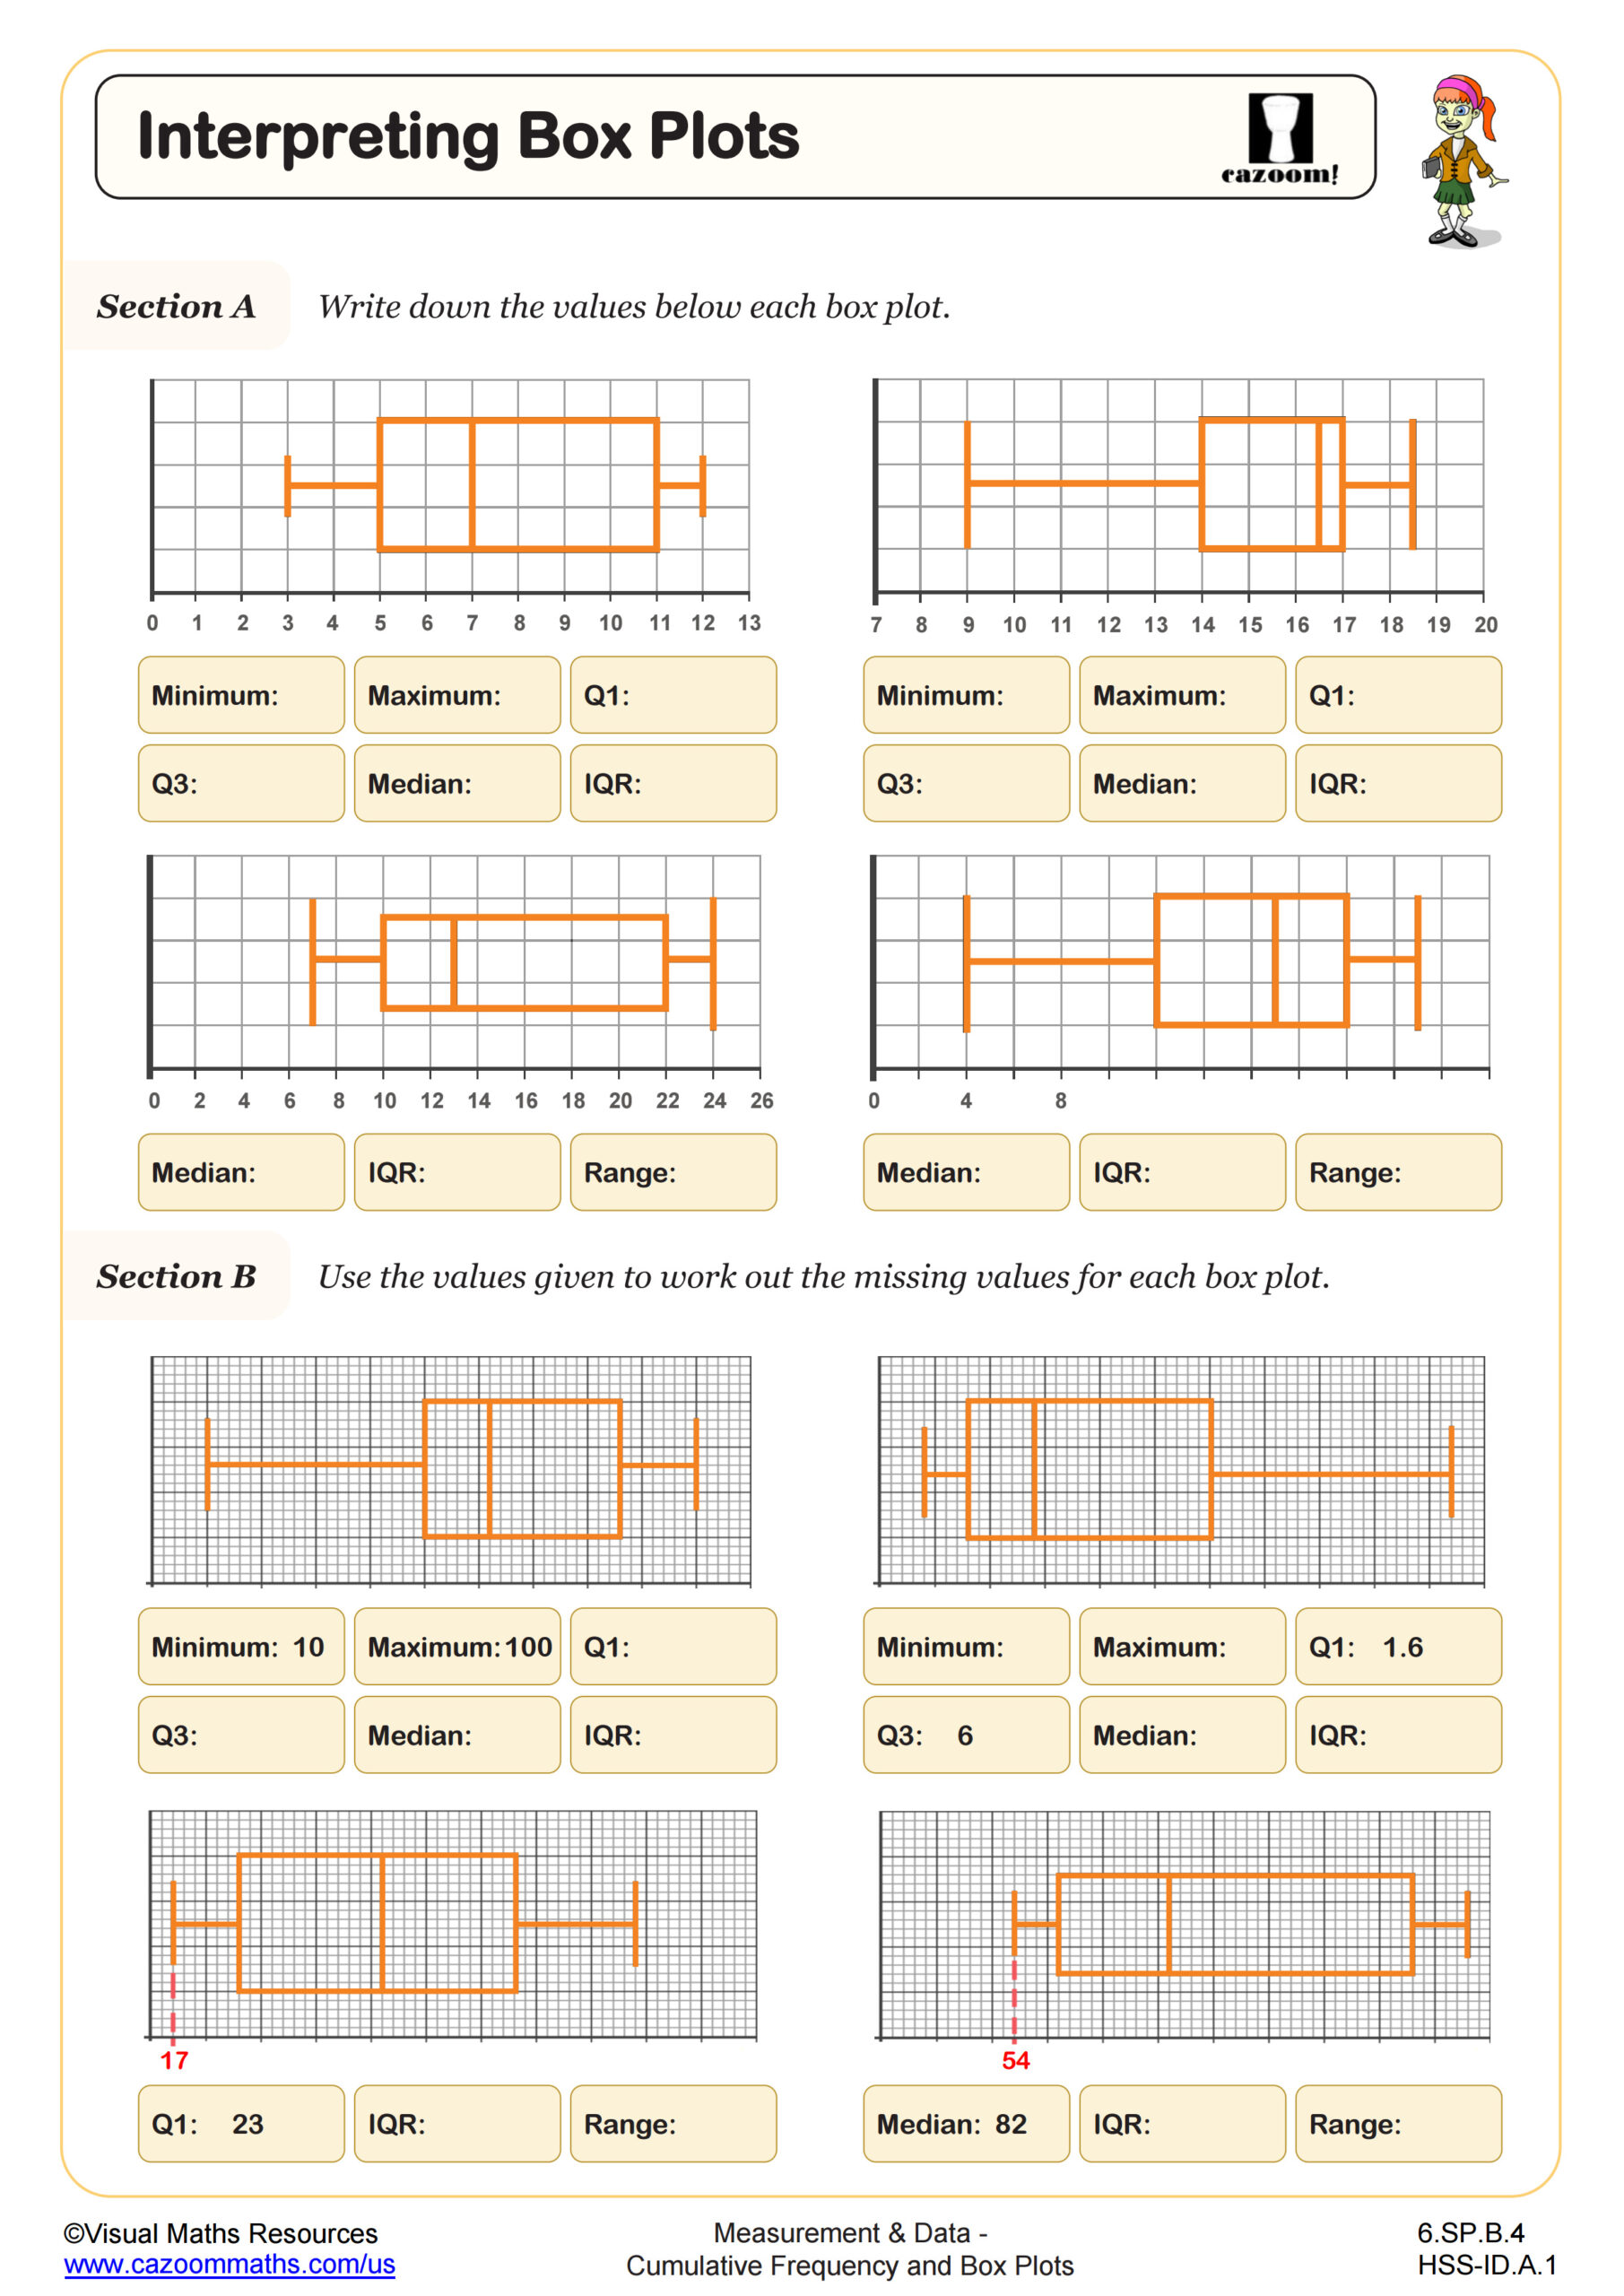
Students progress from identifying key data features to constructing and interpreting box plots independently. Early worksheets provide ordered lists for hands-on practice, while later sheets focus on calculating five-number summaries and comparing data sets. Each worksheet includes comprehensive solutions that demonstrate the reasoning process. This collection covers reading, constructing, and analyzing box plots, strengthening students’ understanding of data spread, variability, and interpretation.
What Role Do Cumulative Frequency and Box Plots Activities Play in Developing Math Skills?
The instant printing feature of worksheets enables teachers to plan their classes more efficiently through quick distribution. Teachers start by showing whole-group modeling through introductory sheets before students move on to work independently or with partners on the following problems. The lesson contains built-in differentiation because students who need assistance can work with a partner on guided examples. Yet, advanced learners can handle interpretation questions that need distribution comparison and anomaly detection. Answer sheets are provided for every worksheet and include step-by-step working, so students see precisely how to split data into quartiles and plot each value. The sheets work well for retrieval practice at the beginning of a new unit and also when teachers want to check student understanding before teaching standard deviation.
Where Box Plot Skills Apply Beyond the Classroom
The visual clarity of box plots helps students understand complex data, which becomes essential knowledge for real-world applications. Students use these skills to compare groups and identify trends, and make decisions through range analysis instead of individual numbers. The skill of reading a five-number summary enables students to understand their environment through the study of test scores and weather patterns.
•Comparing delivery times across companies
•Analyzing game scores for consistency
•Evaluating survey results by age groups
•Planning budgets by spending categories