Middle School Cumulative Frequency and Box Plots Worksheets
All worksheets are created by the team of experienced teachers at Cazoom Math.
What Are Cumulative Frequency and Box Plots in Middle School Math?
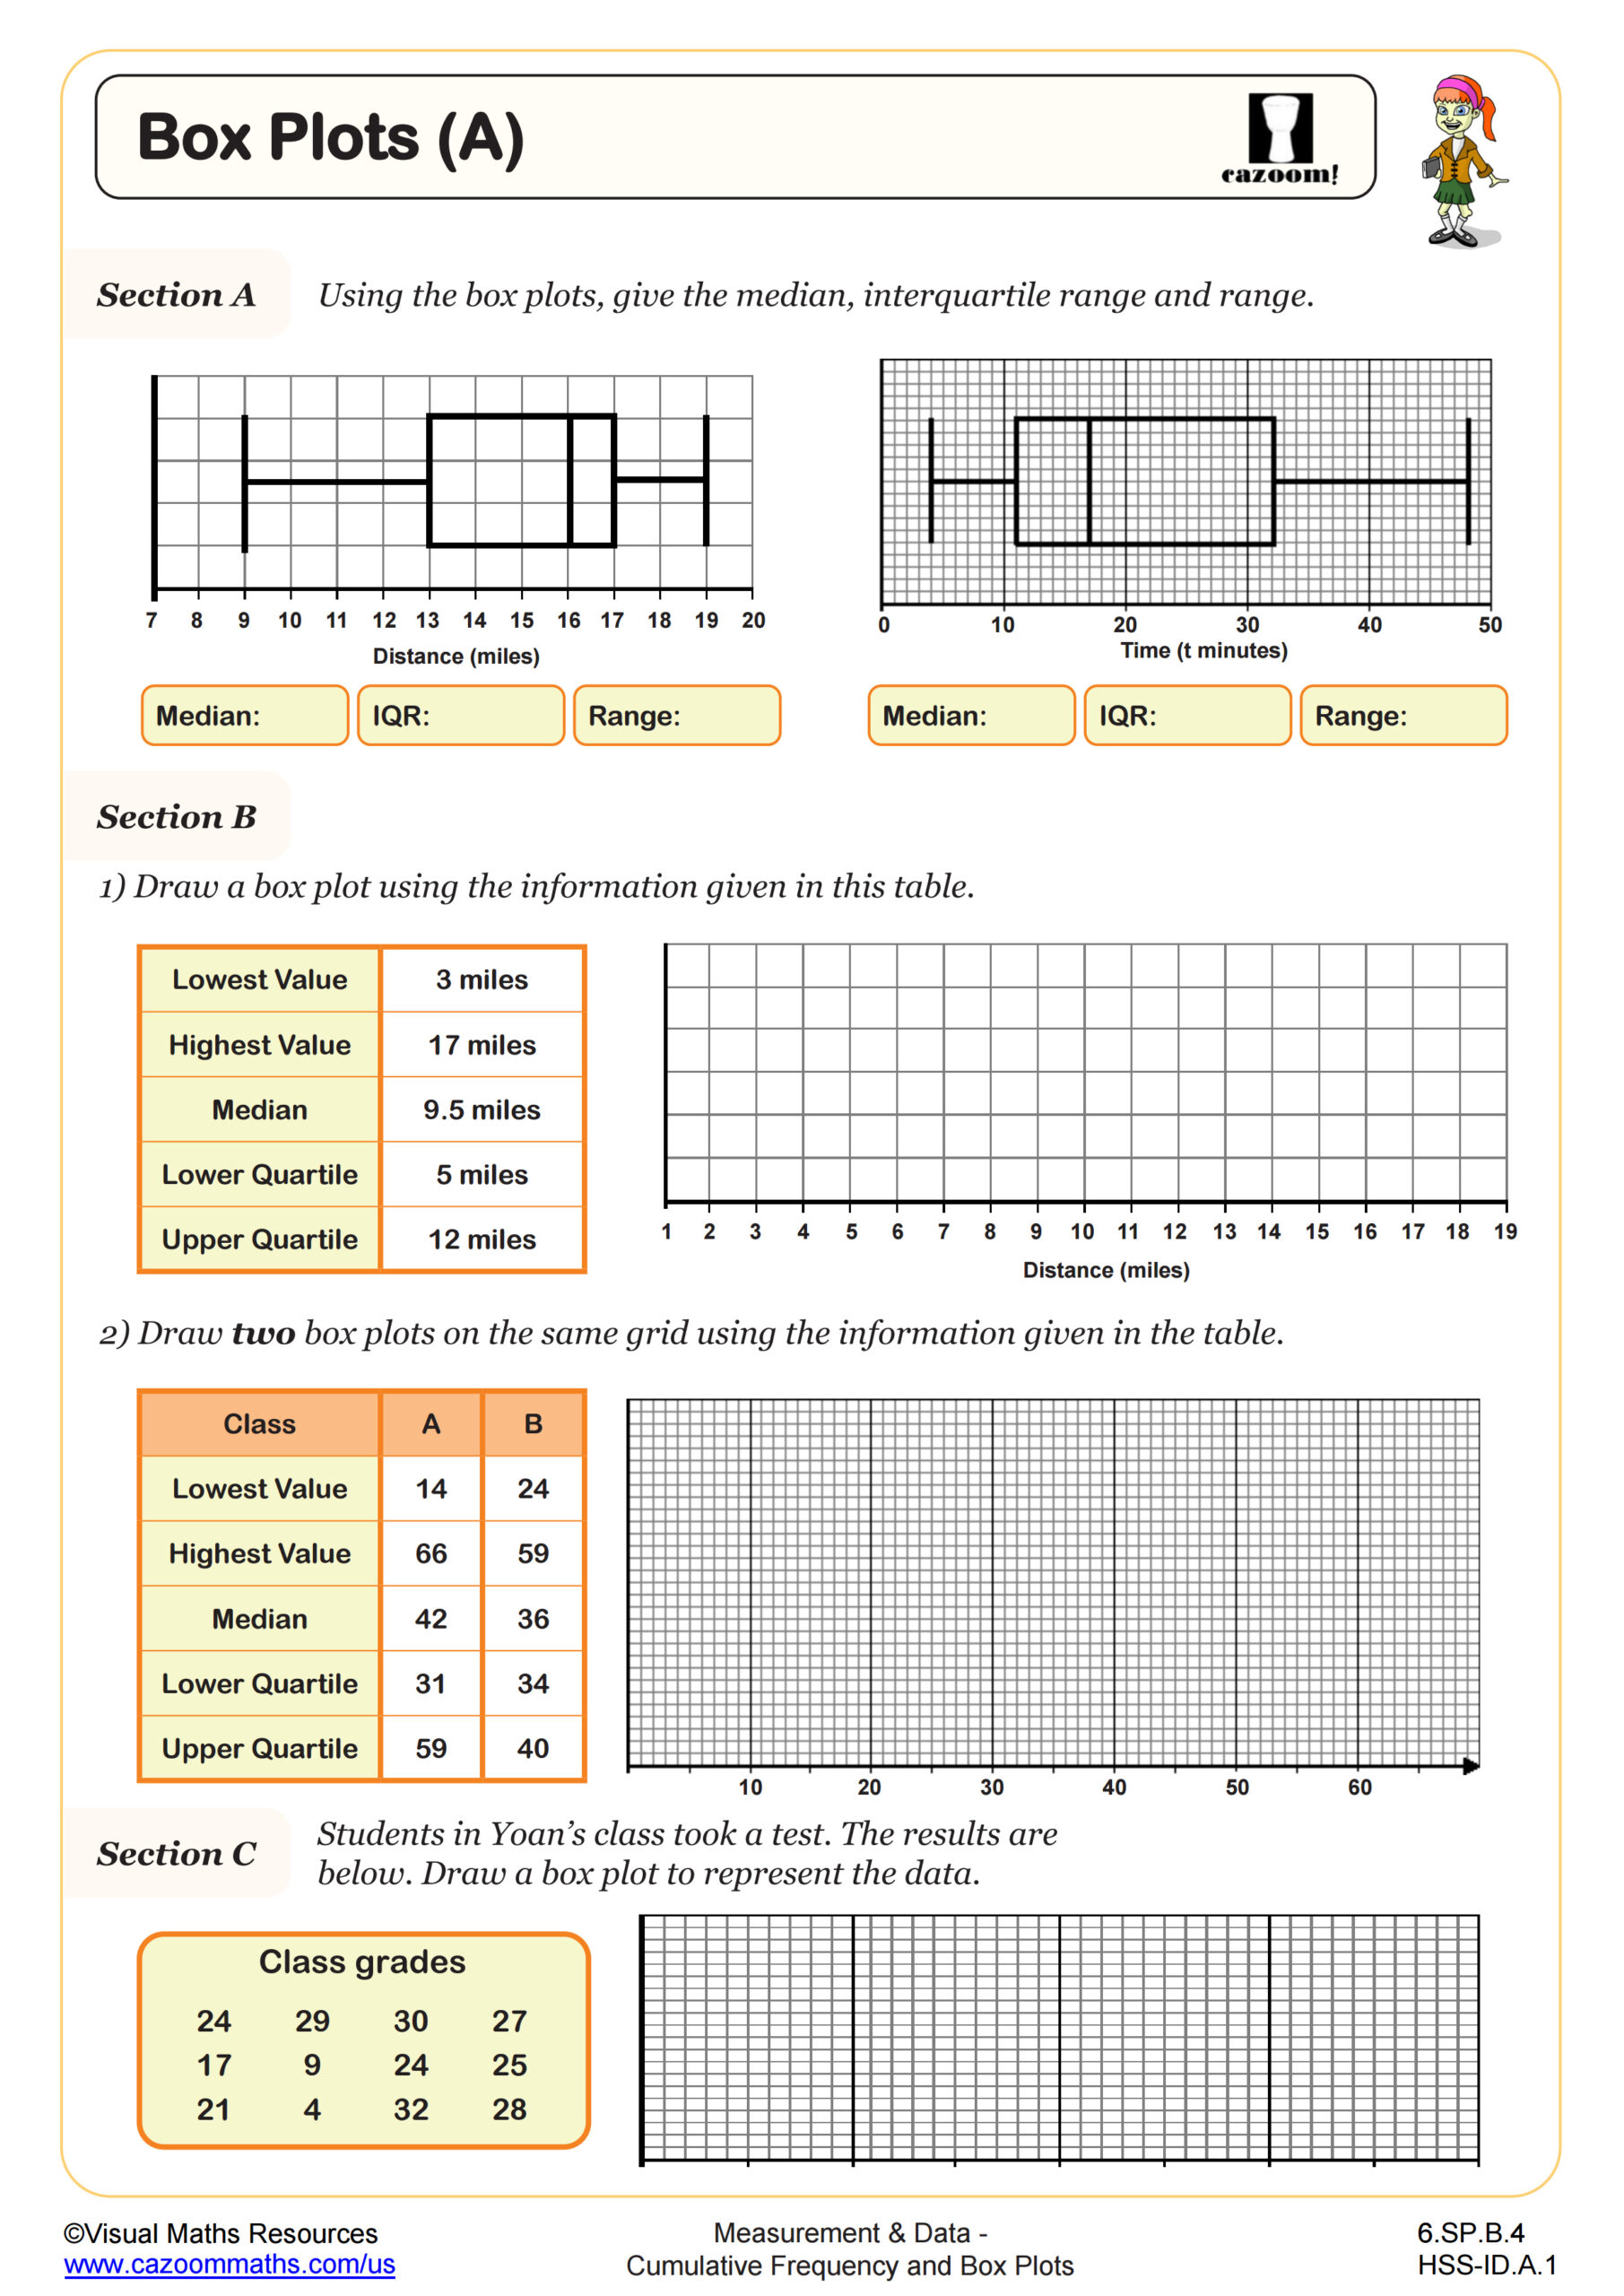
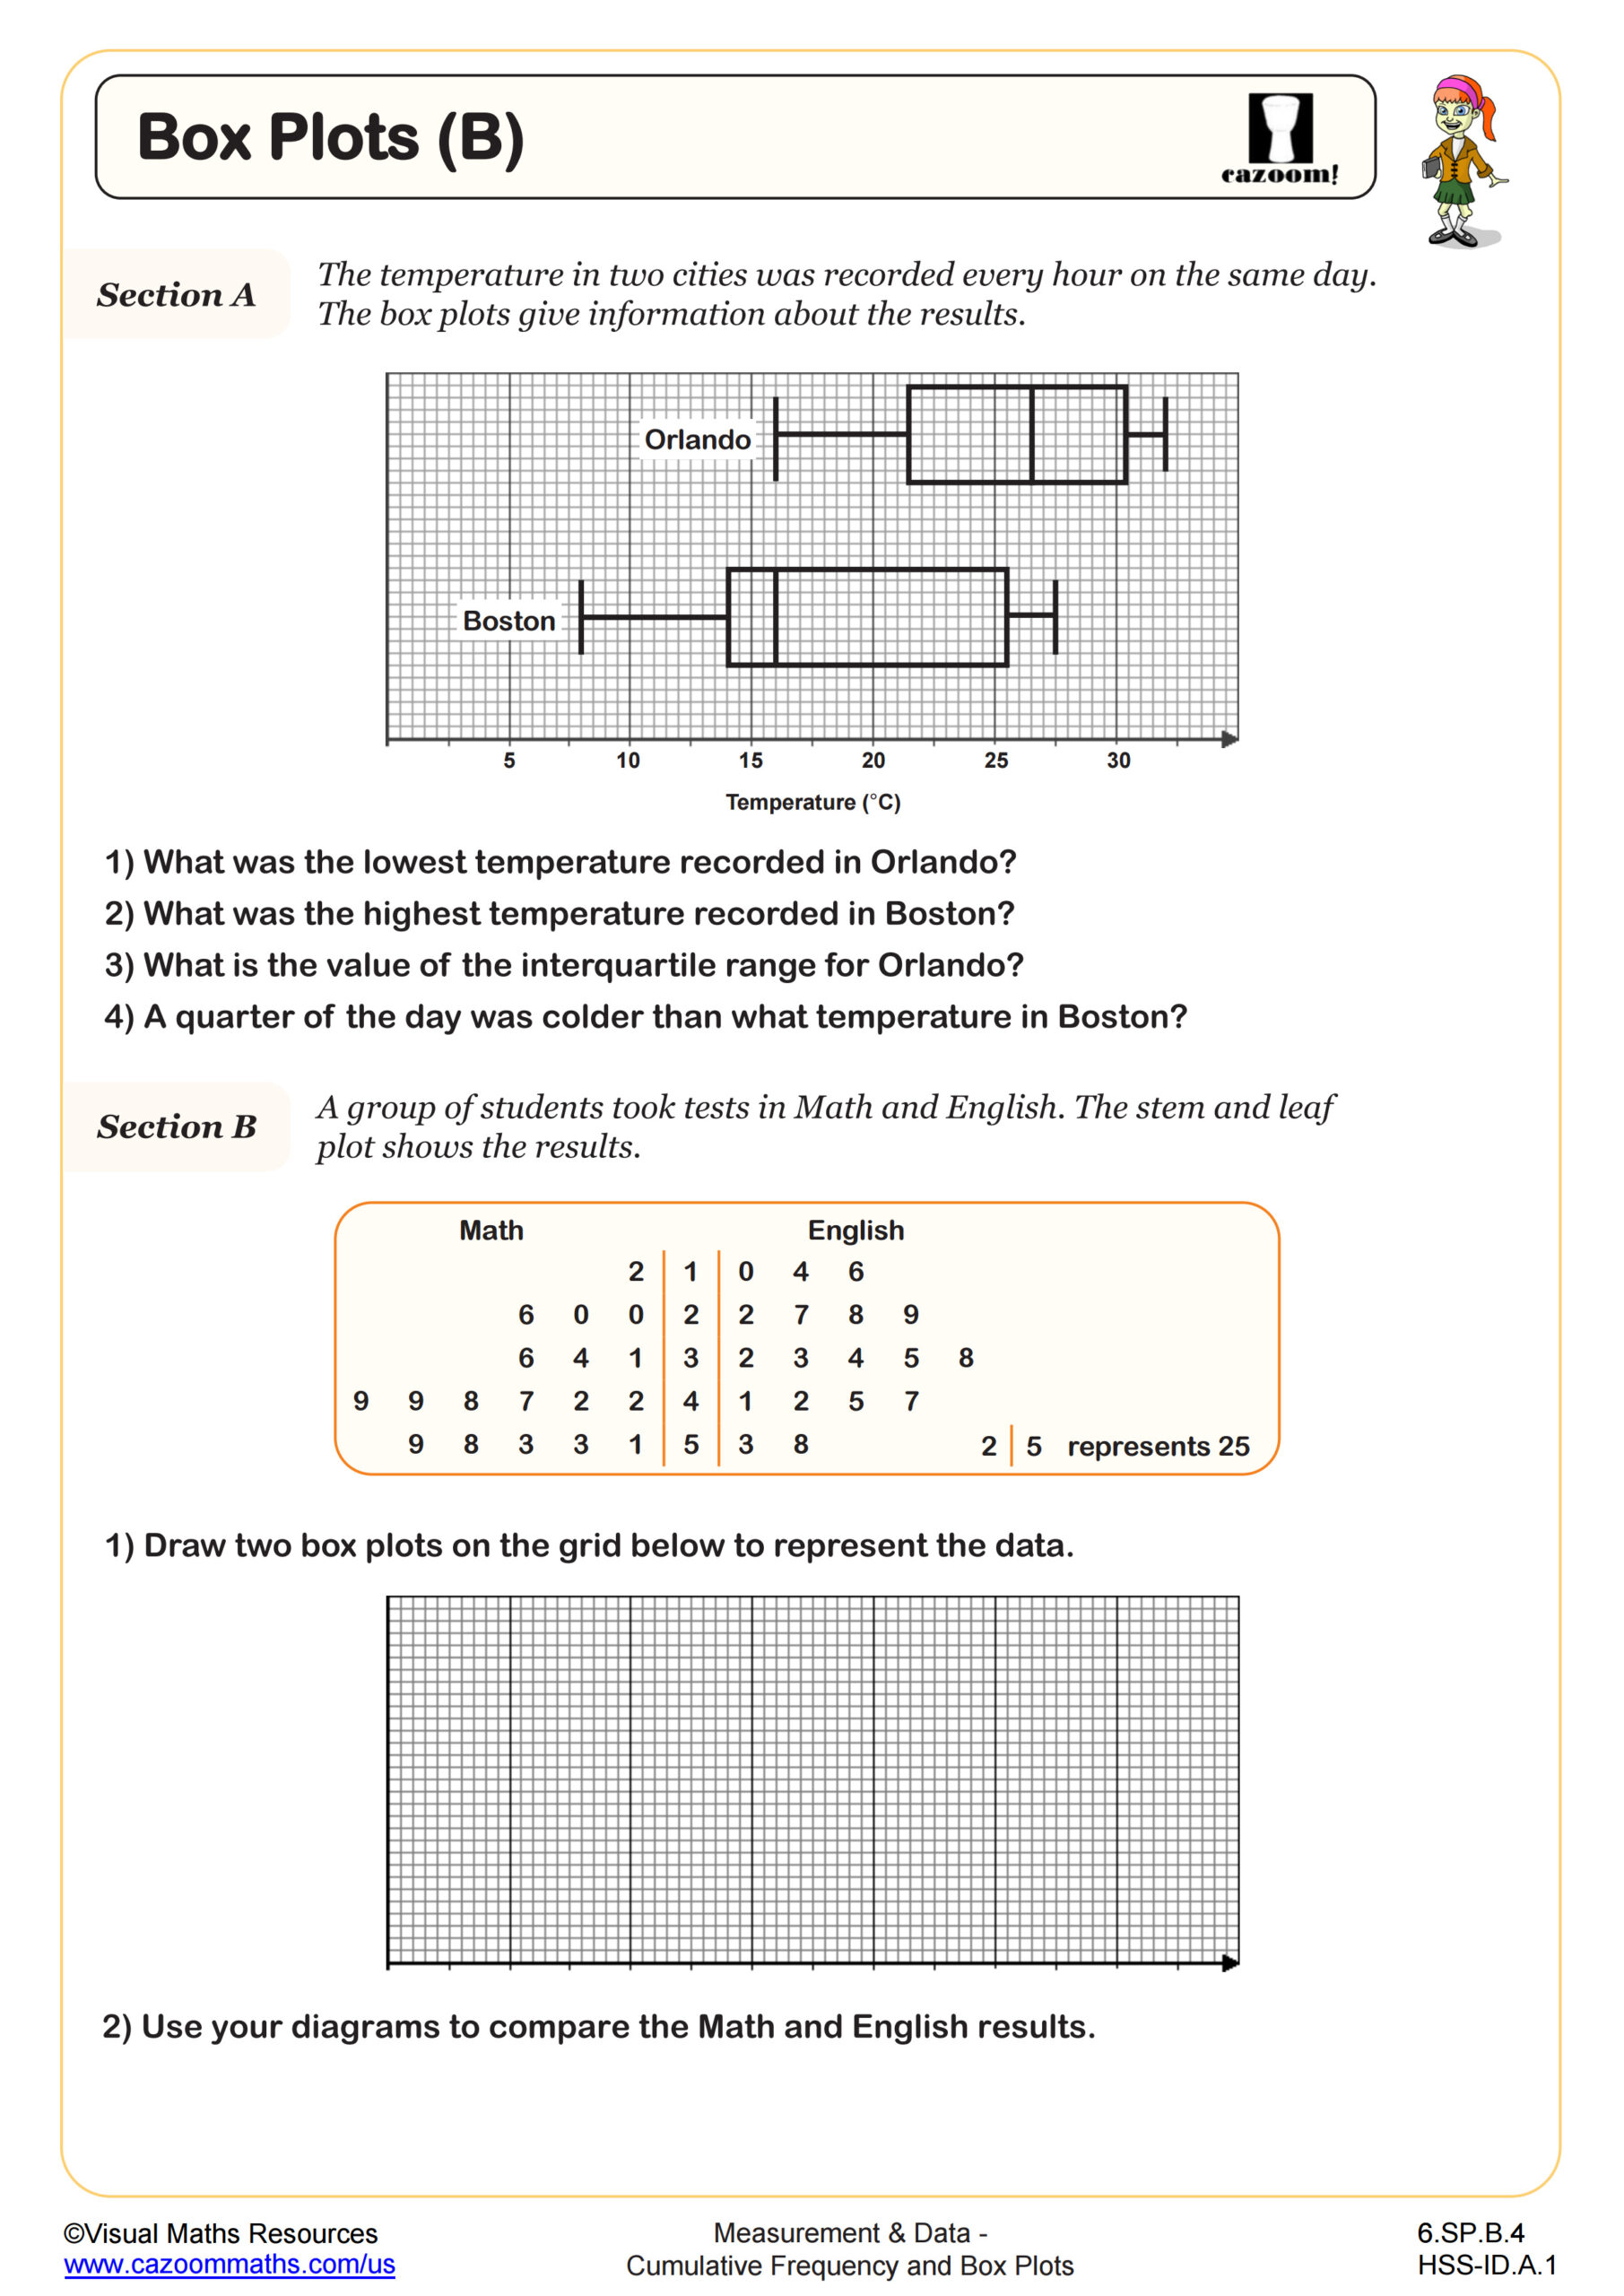
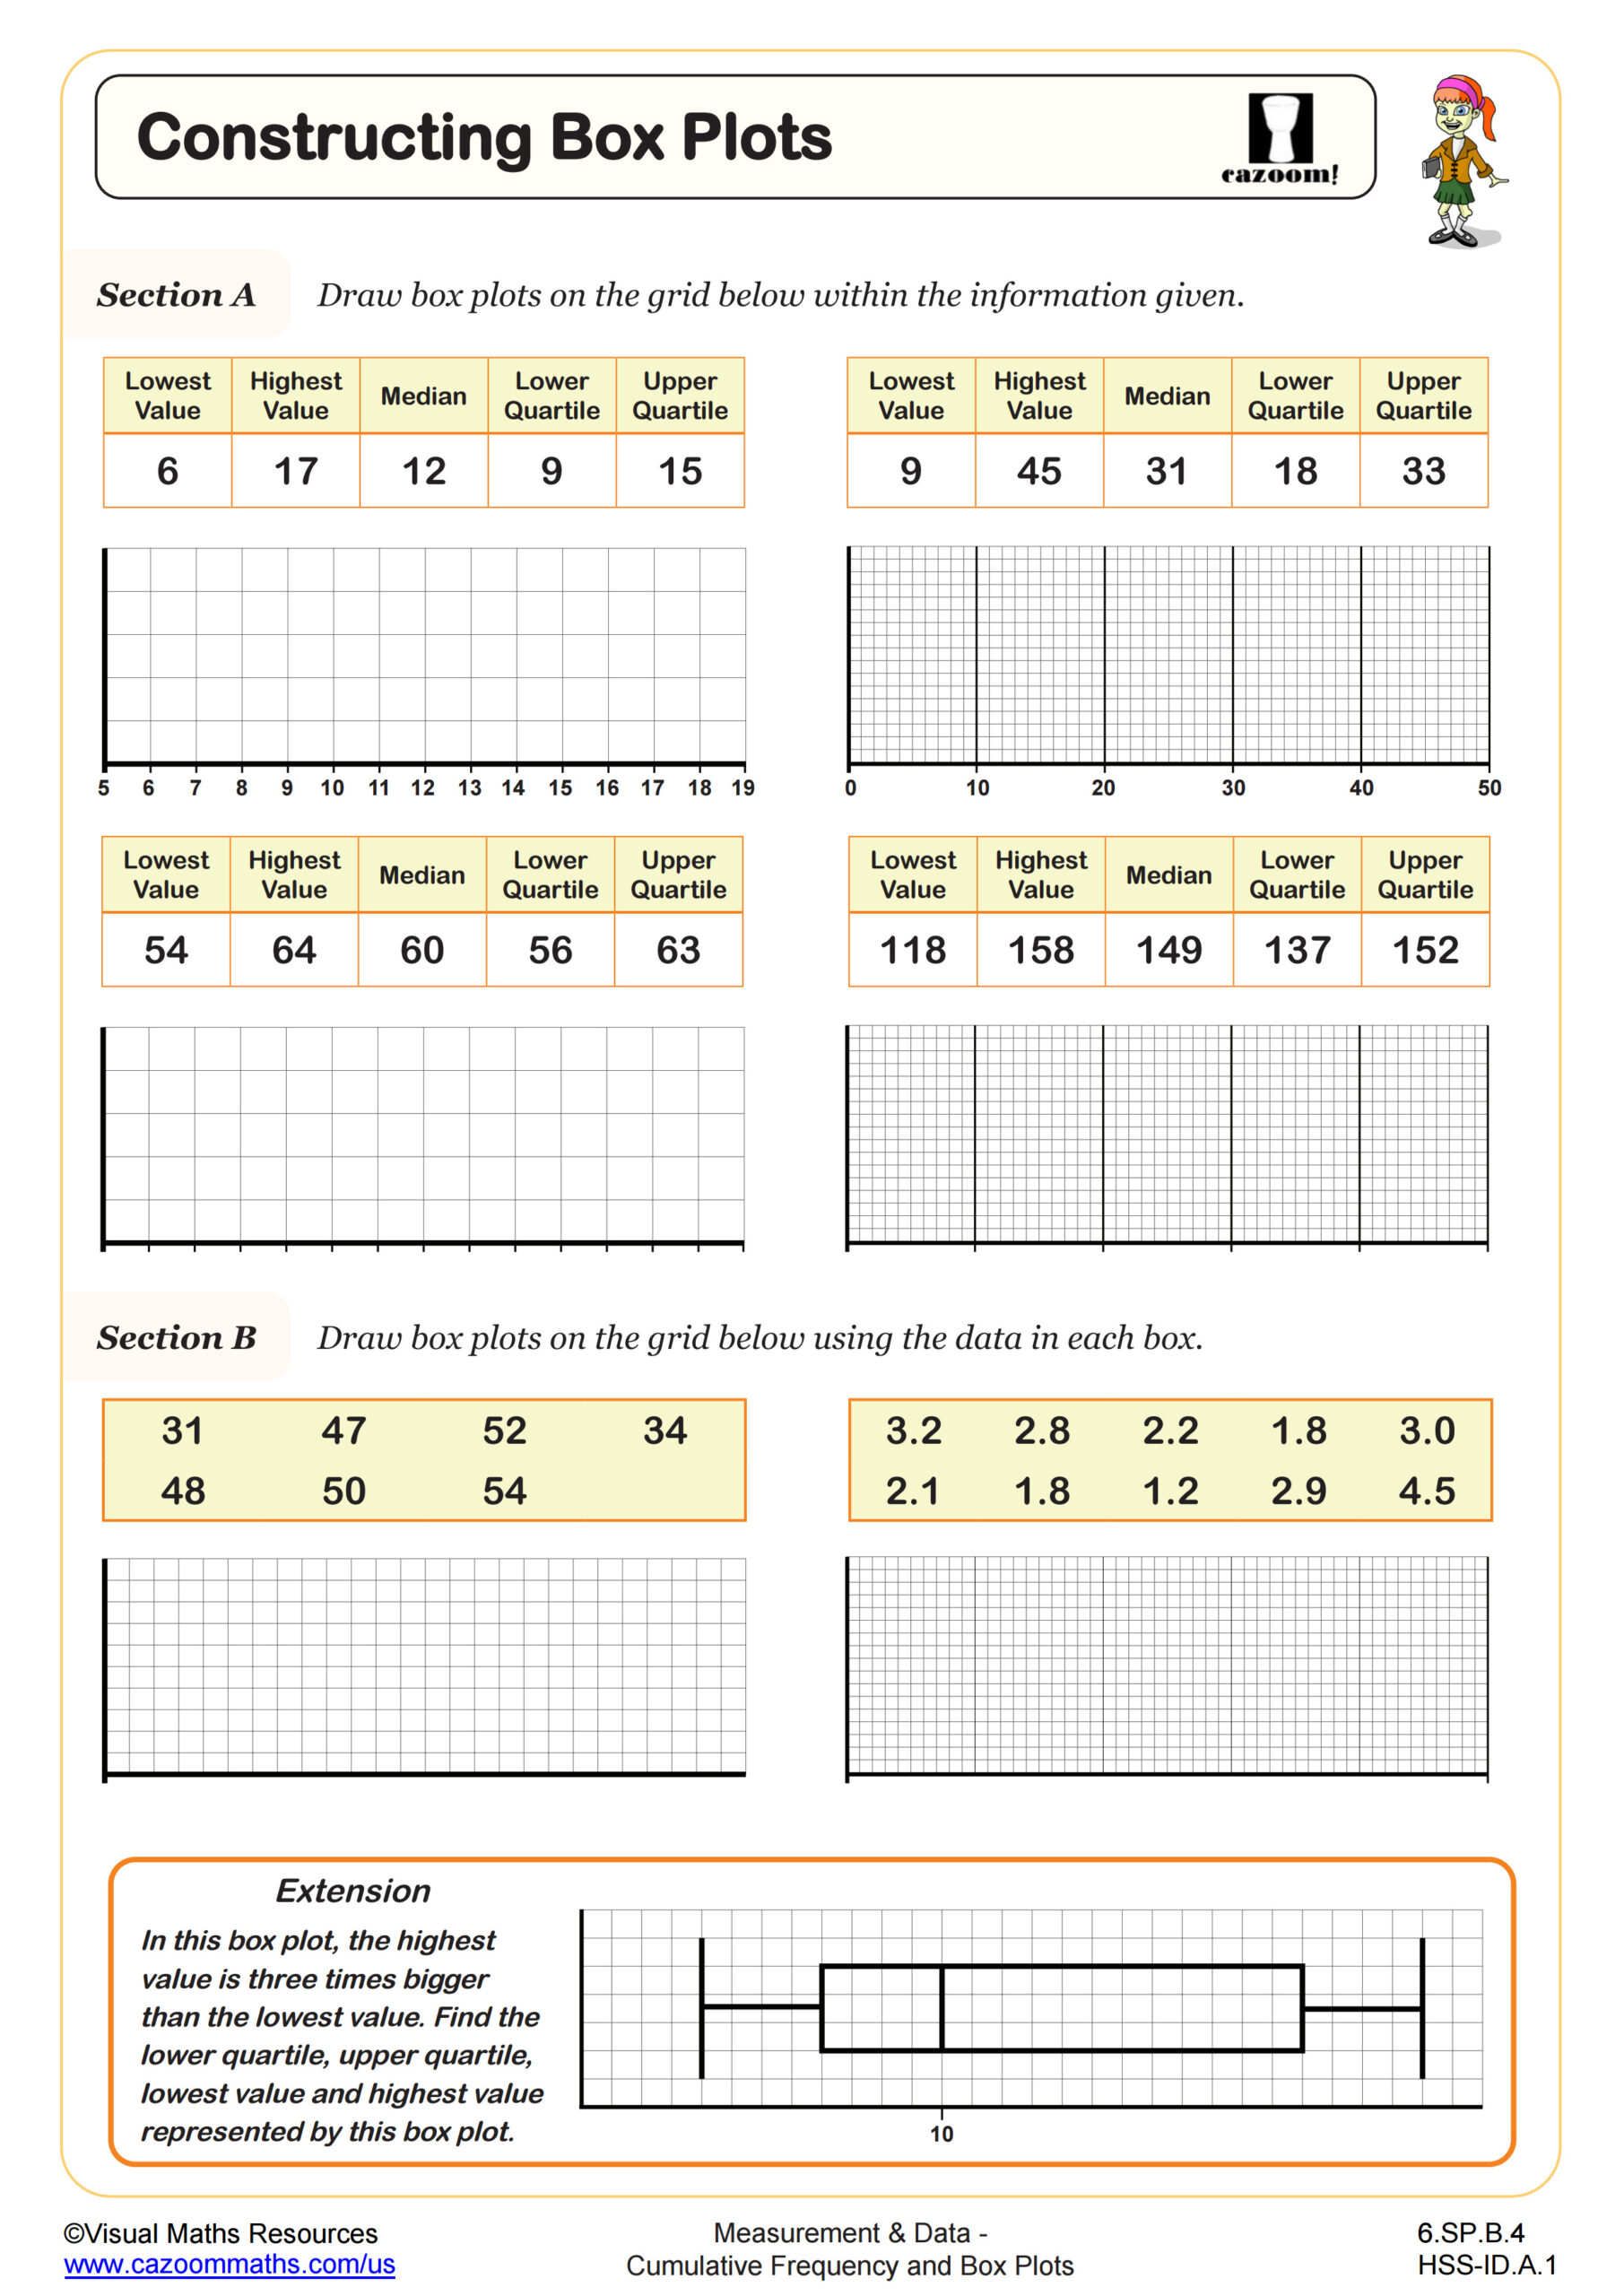
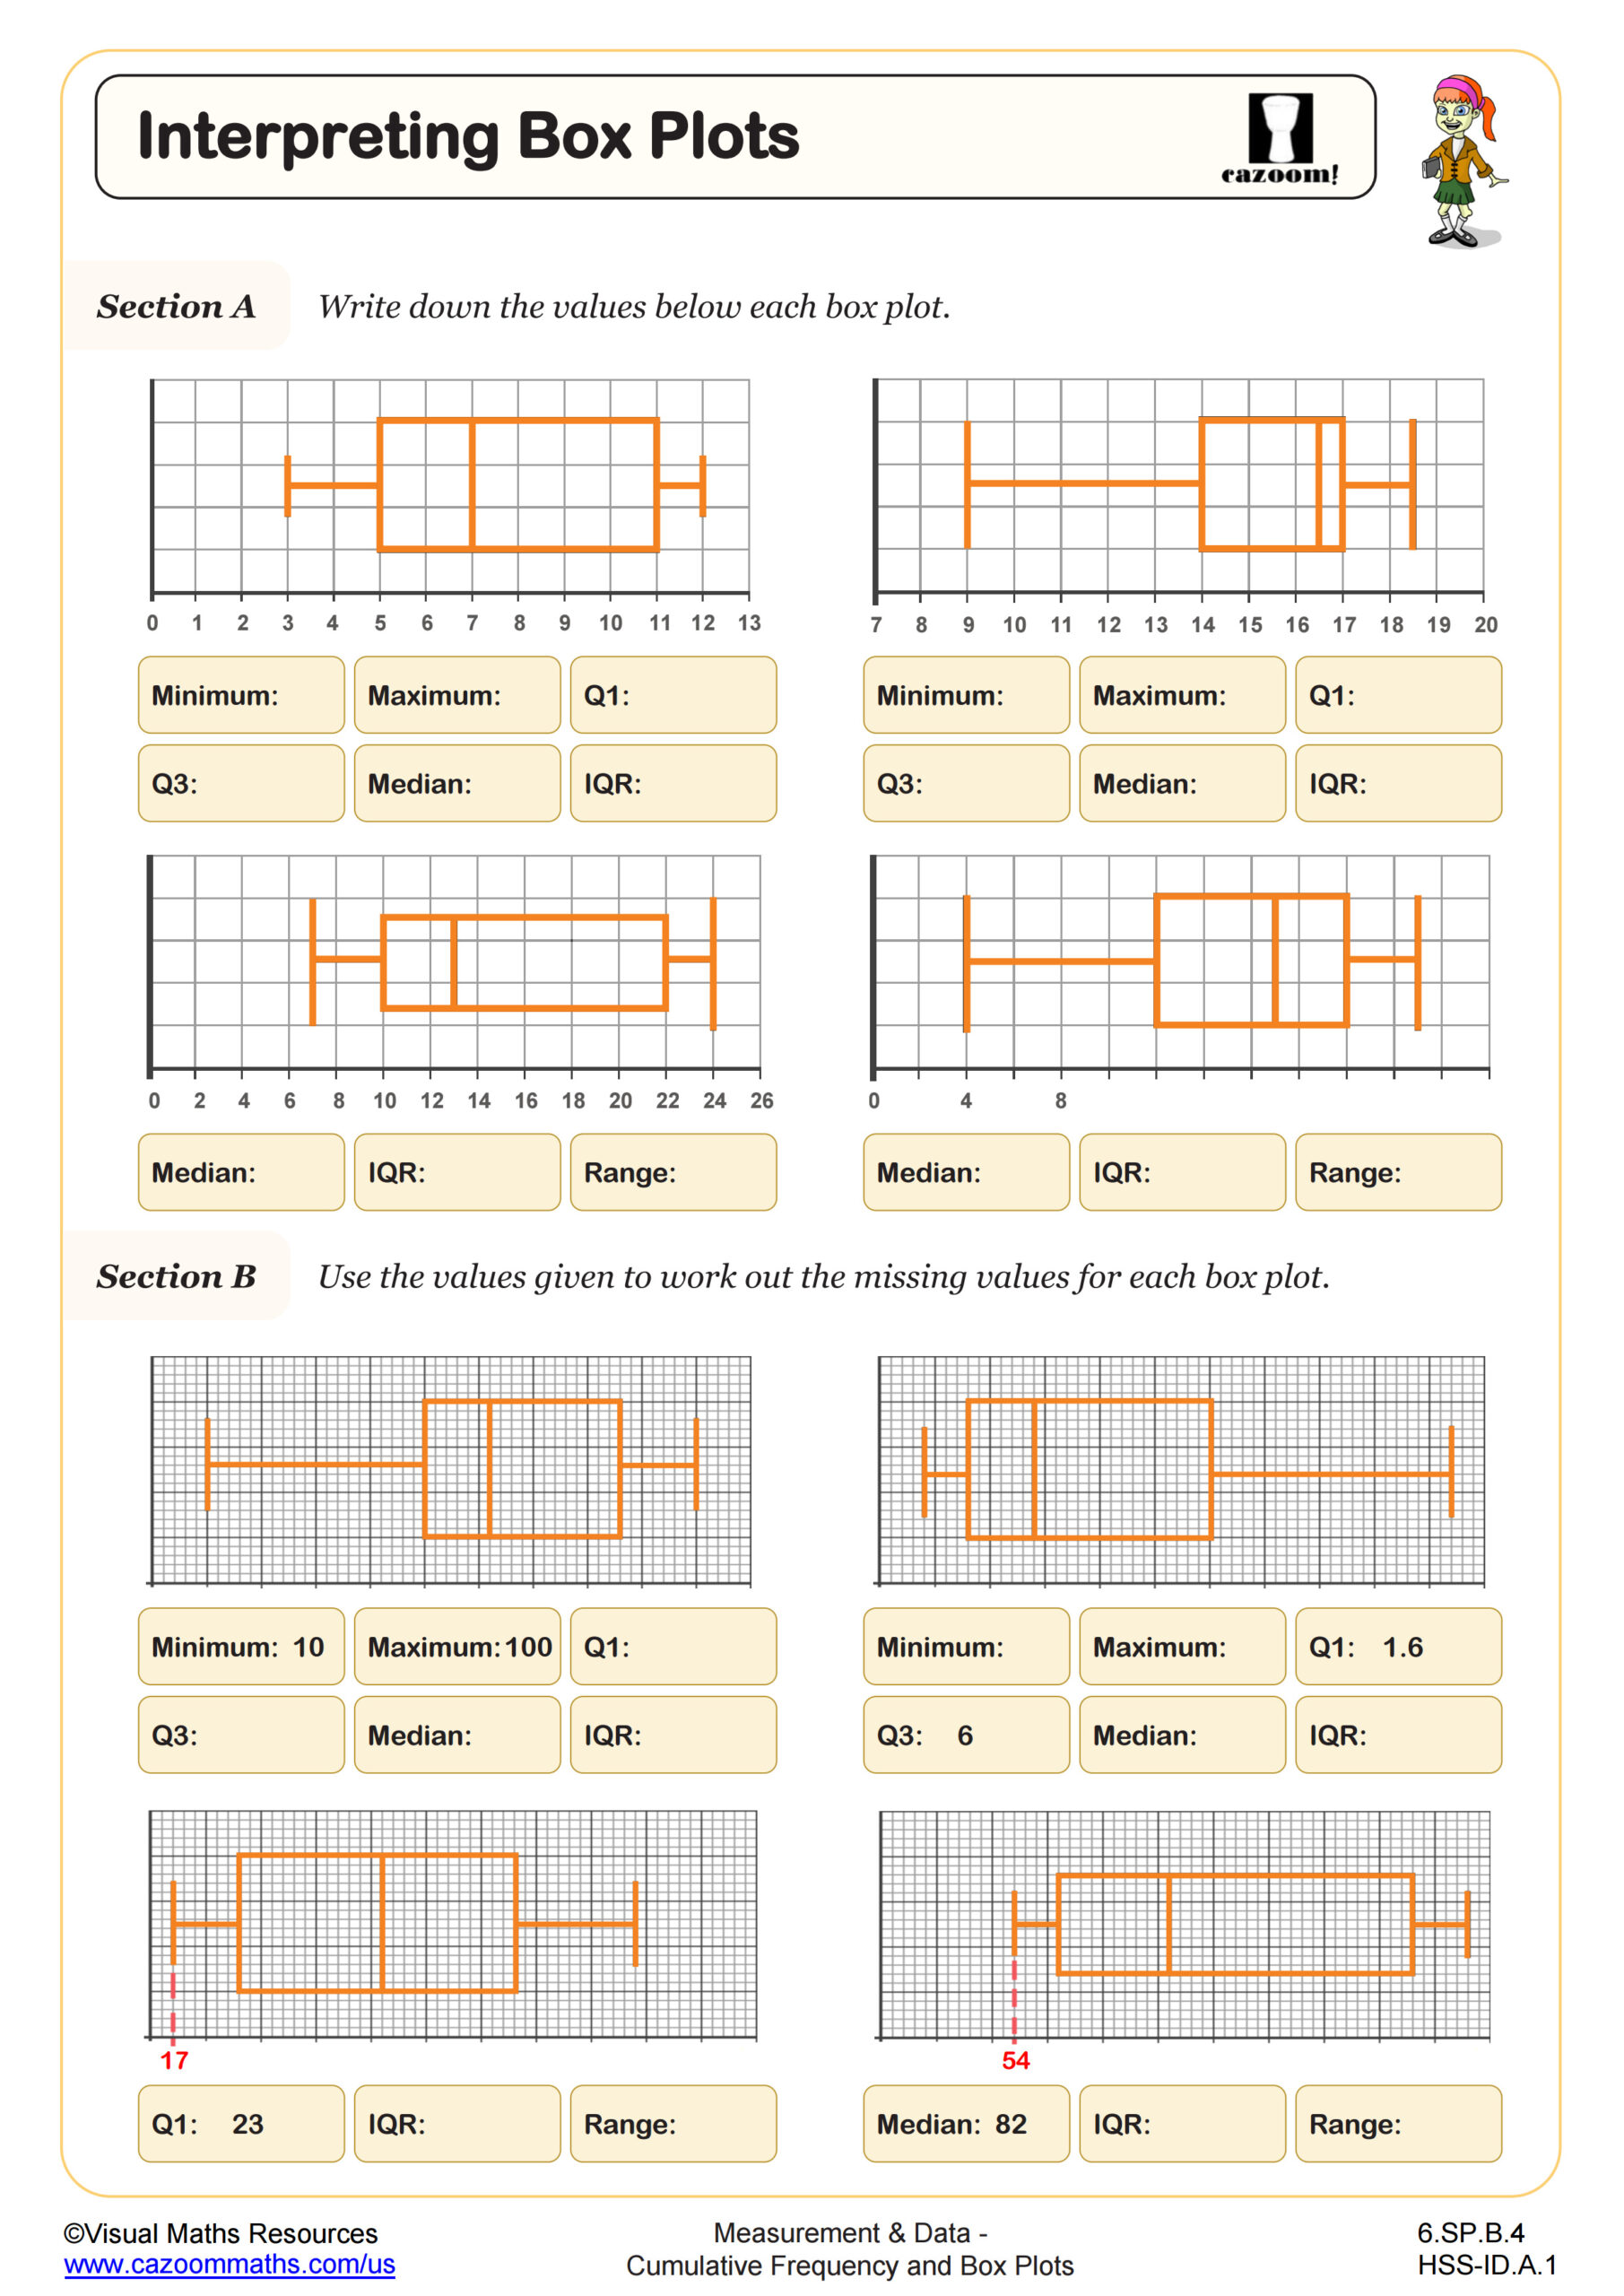
Cumulative frequency tracks the running total of data values up to a certain point, while box plots (also called box-and-whisker plots) provide a visual summary of data distribution using five key values: minimum, first quartile, median, third quartile, and maximum. Middle school students use these tools to analyze data sets, compare distributions, and identify outliers. The Common Core State Standards introduce these concepts in grades 6-8 as part of statistics and probability standards, preparing students for more advanced data analysis in high school.
Students often lose points on assessments when they confuse the interquartile range (IQR) with the range. The IQR measures the spread of the middle 50% of data by subtracting Q1 from Q3, while range measures total spread from minimum to maximum. Teachers notice that students grasp this distinction more clearly when they shade the box portion of the plot and recognize it represents exactly half the data points in the set.
Which Grade Levels Cover Cumulative Frequency and Box Plots?
These worksheets span 6th grade, 7th grade, and 8th grade middle school mathematics. Sixth graders typically begin by interpreting simple box plots and identifying the five-number summary from pre-drawn diagrams. Seventh grade students progress to calculating quartiles from data sets and understanding how the interquartile range measures variability. By 8th grade, students construct box plots independently from raw data and use multiple plots to compare data distributions.
The progression across middle school builds statistical literacy systematically. A breakthrough typically happens when students recognize that box plots compress an entire data set into a visual that immediately reveals center, spread, and symmetry. Teachers observe that students who master box plot construction in 8th grade tackle high school AP Statistics topics with greater confidence, particularly when analyzing skewness and comparing populations using side-by-side box plots.
How Do Students Calculate the Interquartile Range?
The interquartile range (IQR) represents the spread of the middle half of a data set and is calculated by subtracting the first quartile (Q1) from the third quartile (Q3). Students first arrange data in ascending order, find the median to divide the data in half, then locate the median of the lower half (Q1) and the median of the upper half (Q3). The formula IQR = Q3 - Q1 gives a measure of variability that isn't affected by extreme values, making it more reliable than range for describing typical spread.
The IQR connects directly to quality control in manufacturing and STEM fields. Engineers use the IQR to identify defective products that fall outside acceptable variation ranges—parts that measure beyond 1.5 times the IQR from Q1 or Q3 are flagged as potential outliers. Medical researchers apply the same principle when analyzing patient response times to treatments, filtering out unusual cases that might skew results before drawing conclusions about typical outcomes.
How Should Teachers Use These Box Plot Worksheets?
The worksheets scaffold learning by starting with interpretation skills before progressing to construction tasks. Students first analyze completed box plots to extract information about quartiles and range, then calculate these values from data sets, and finally construct accurate box plots on number lines. The answer keys show complete worked solutions, including ordered data sets and step-by-step quartile calculations, which helps students identify exactly where errors occur in their process.
Many teachers find these worksheets effective for differentiated instruction during stations or small-group work. Struggling students benefit from the interpretation worksheets to build conceptual understanding before tackling construction problems, while advanced students can move quickly to comparing multiple box plots or identifying outliers. The worksheets work equally well for homework review, pre-assessment to gauge readiness before introducing new statistical concepts, or targeted practice before state assessments that include data analysis questions.