Middle School Linear Functions Worksheets
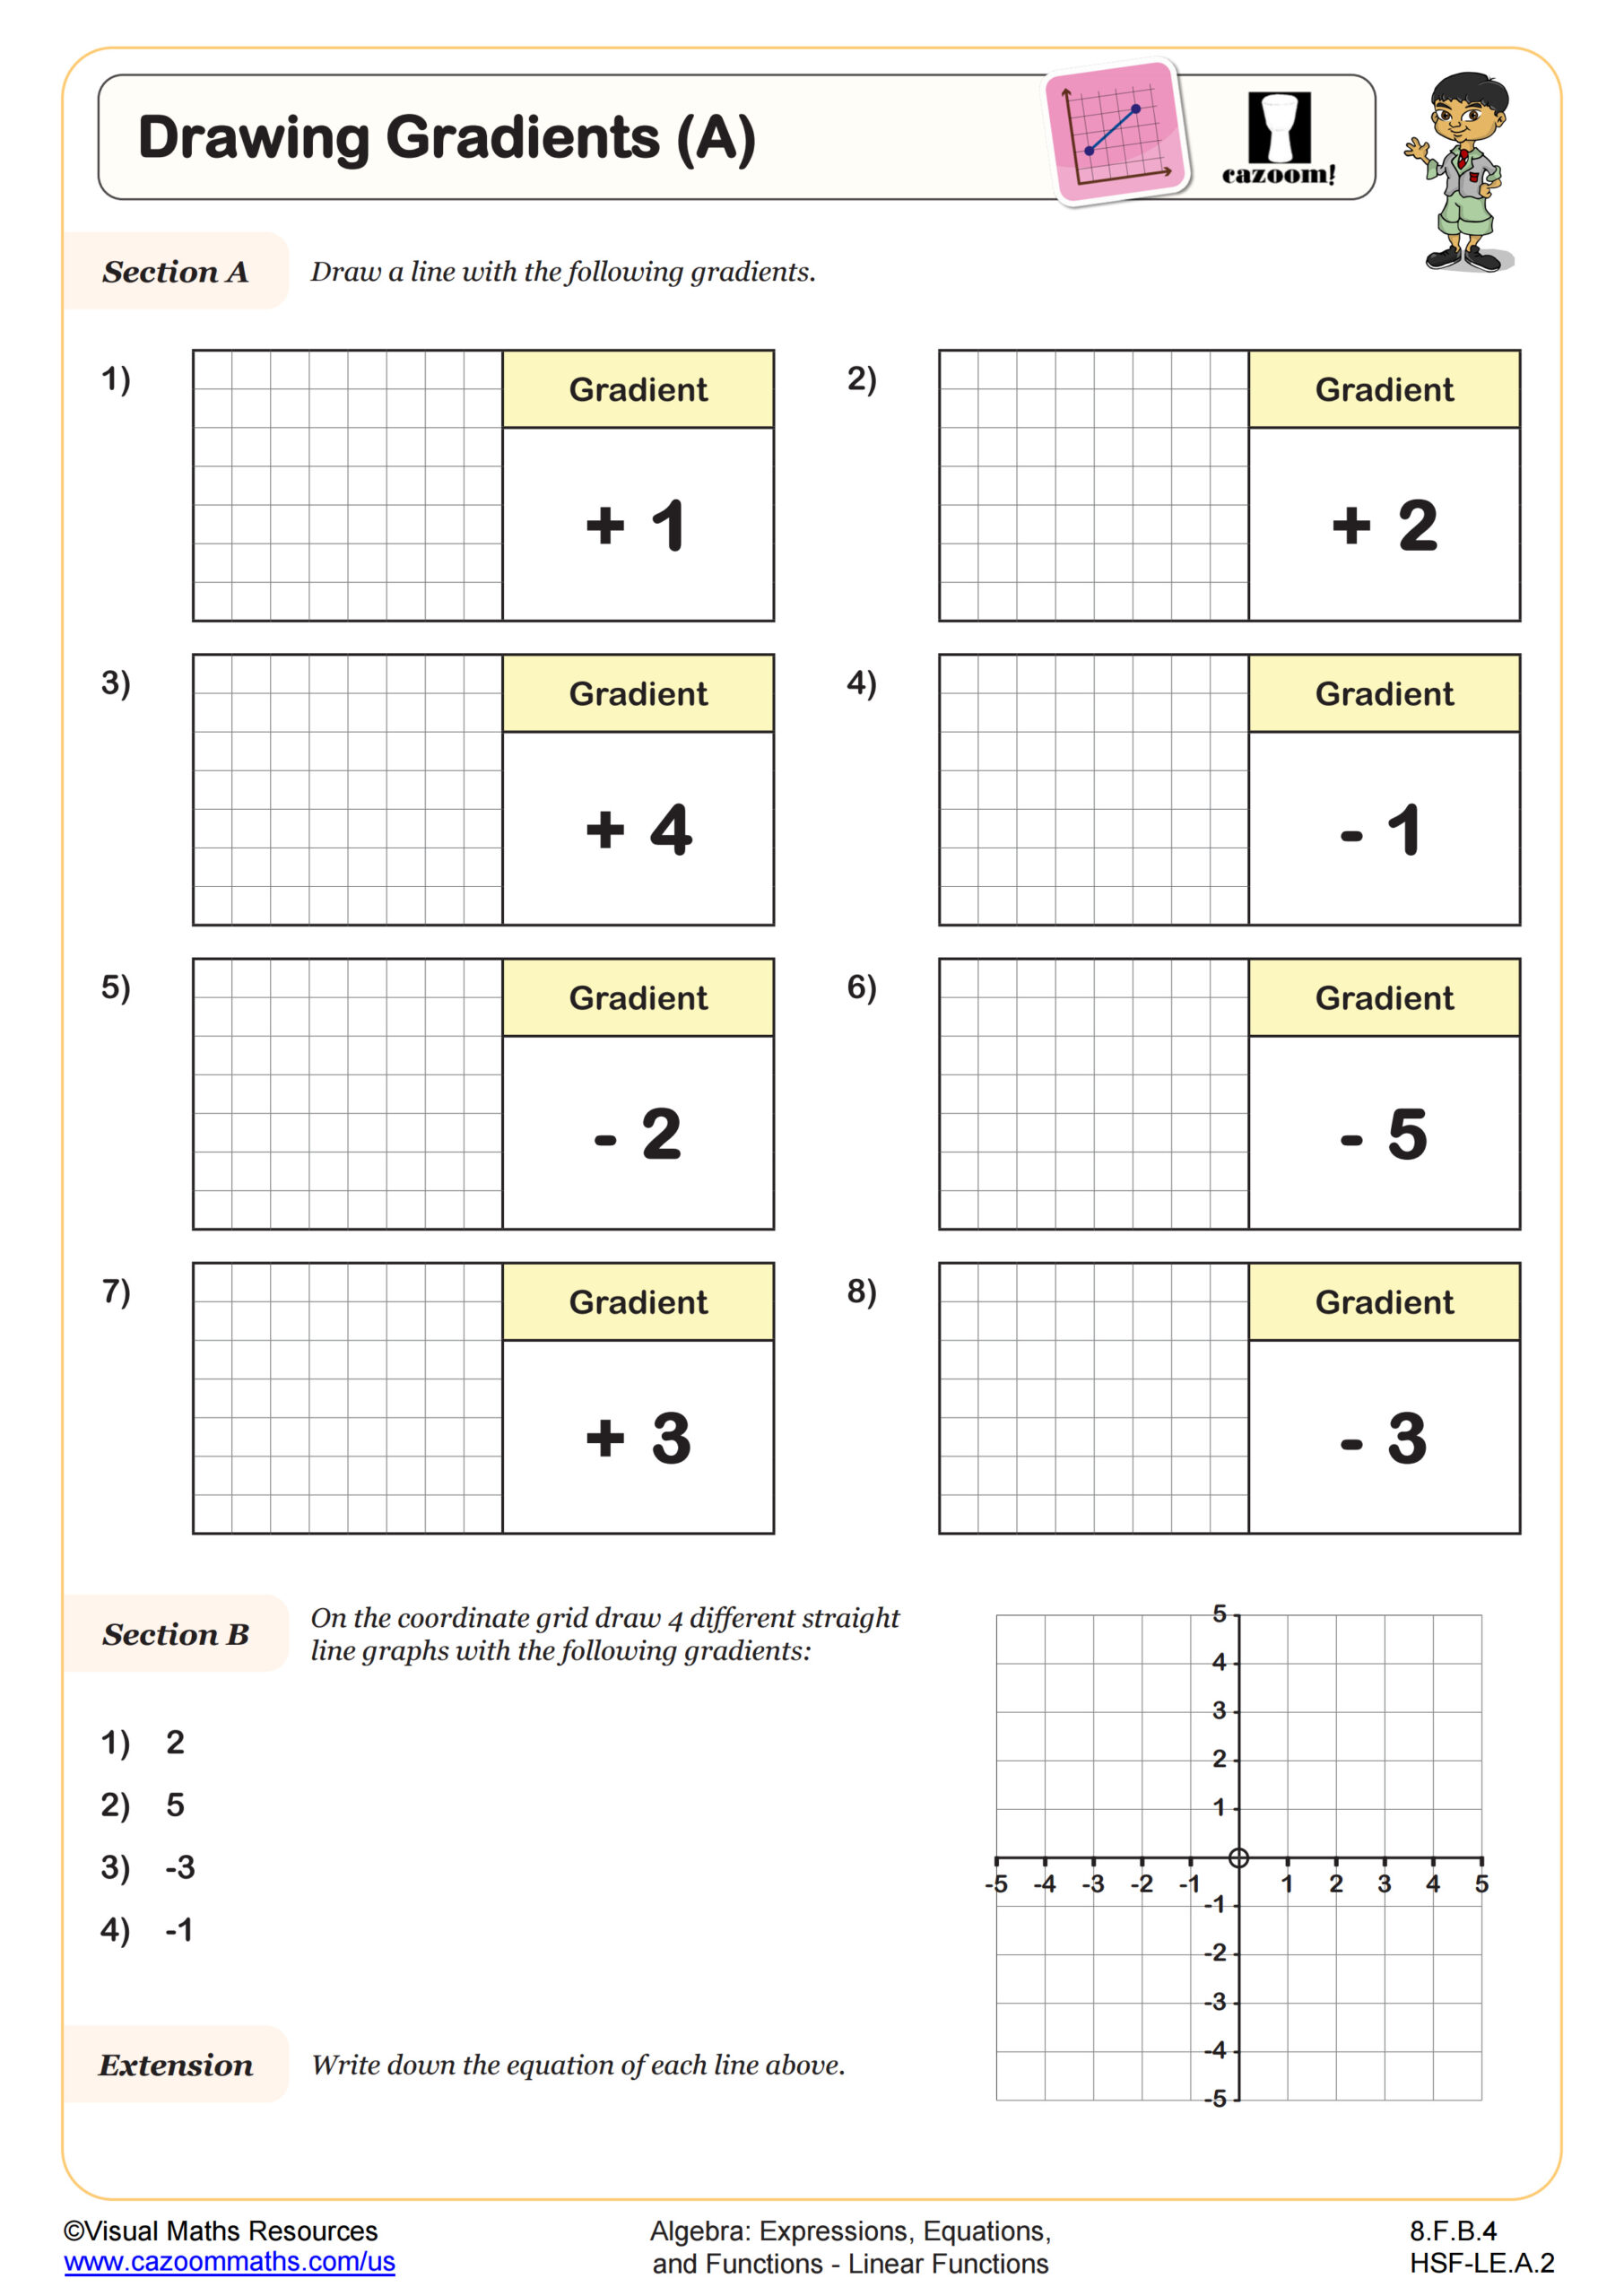
Drawing Gradients (A)
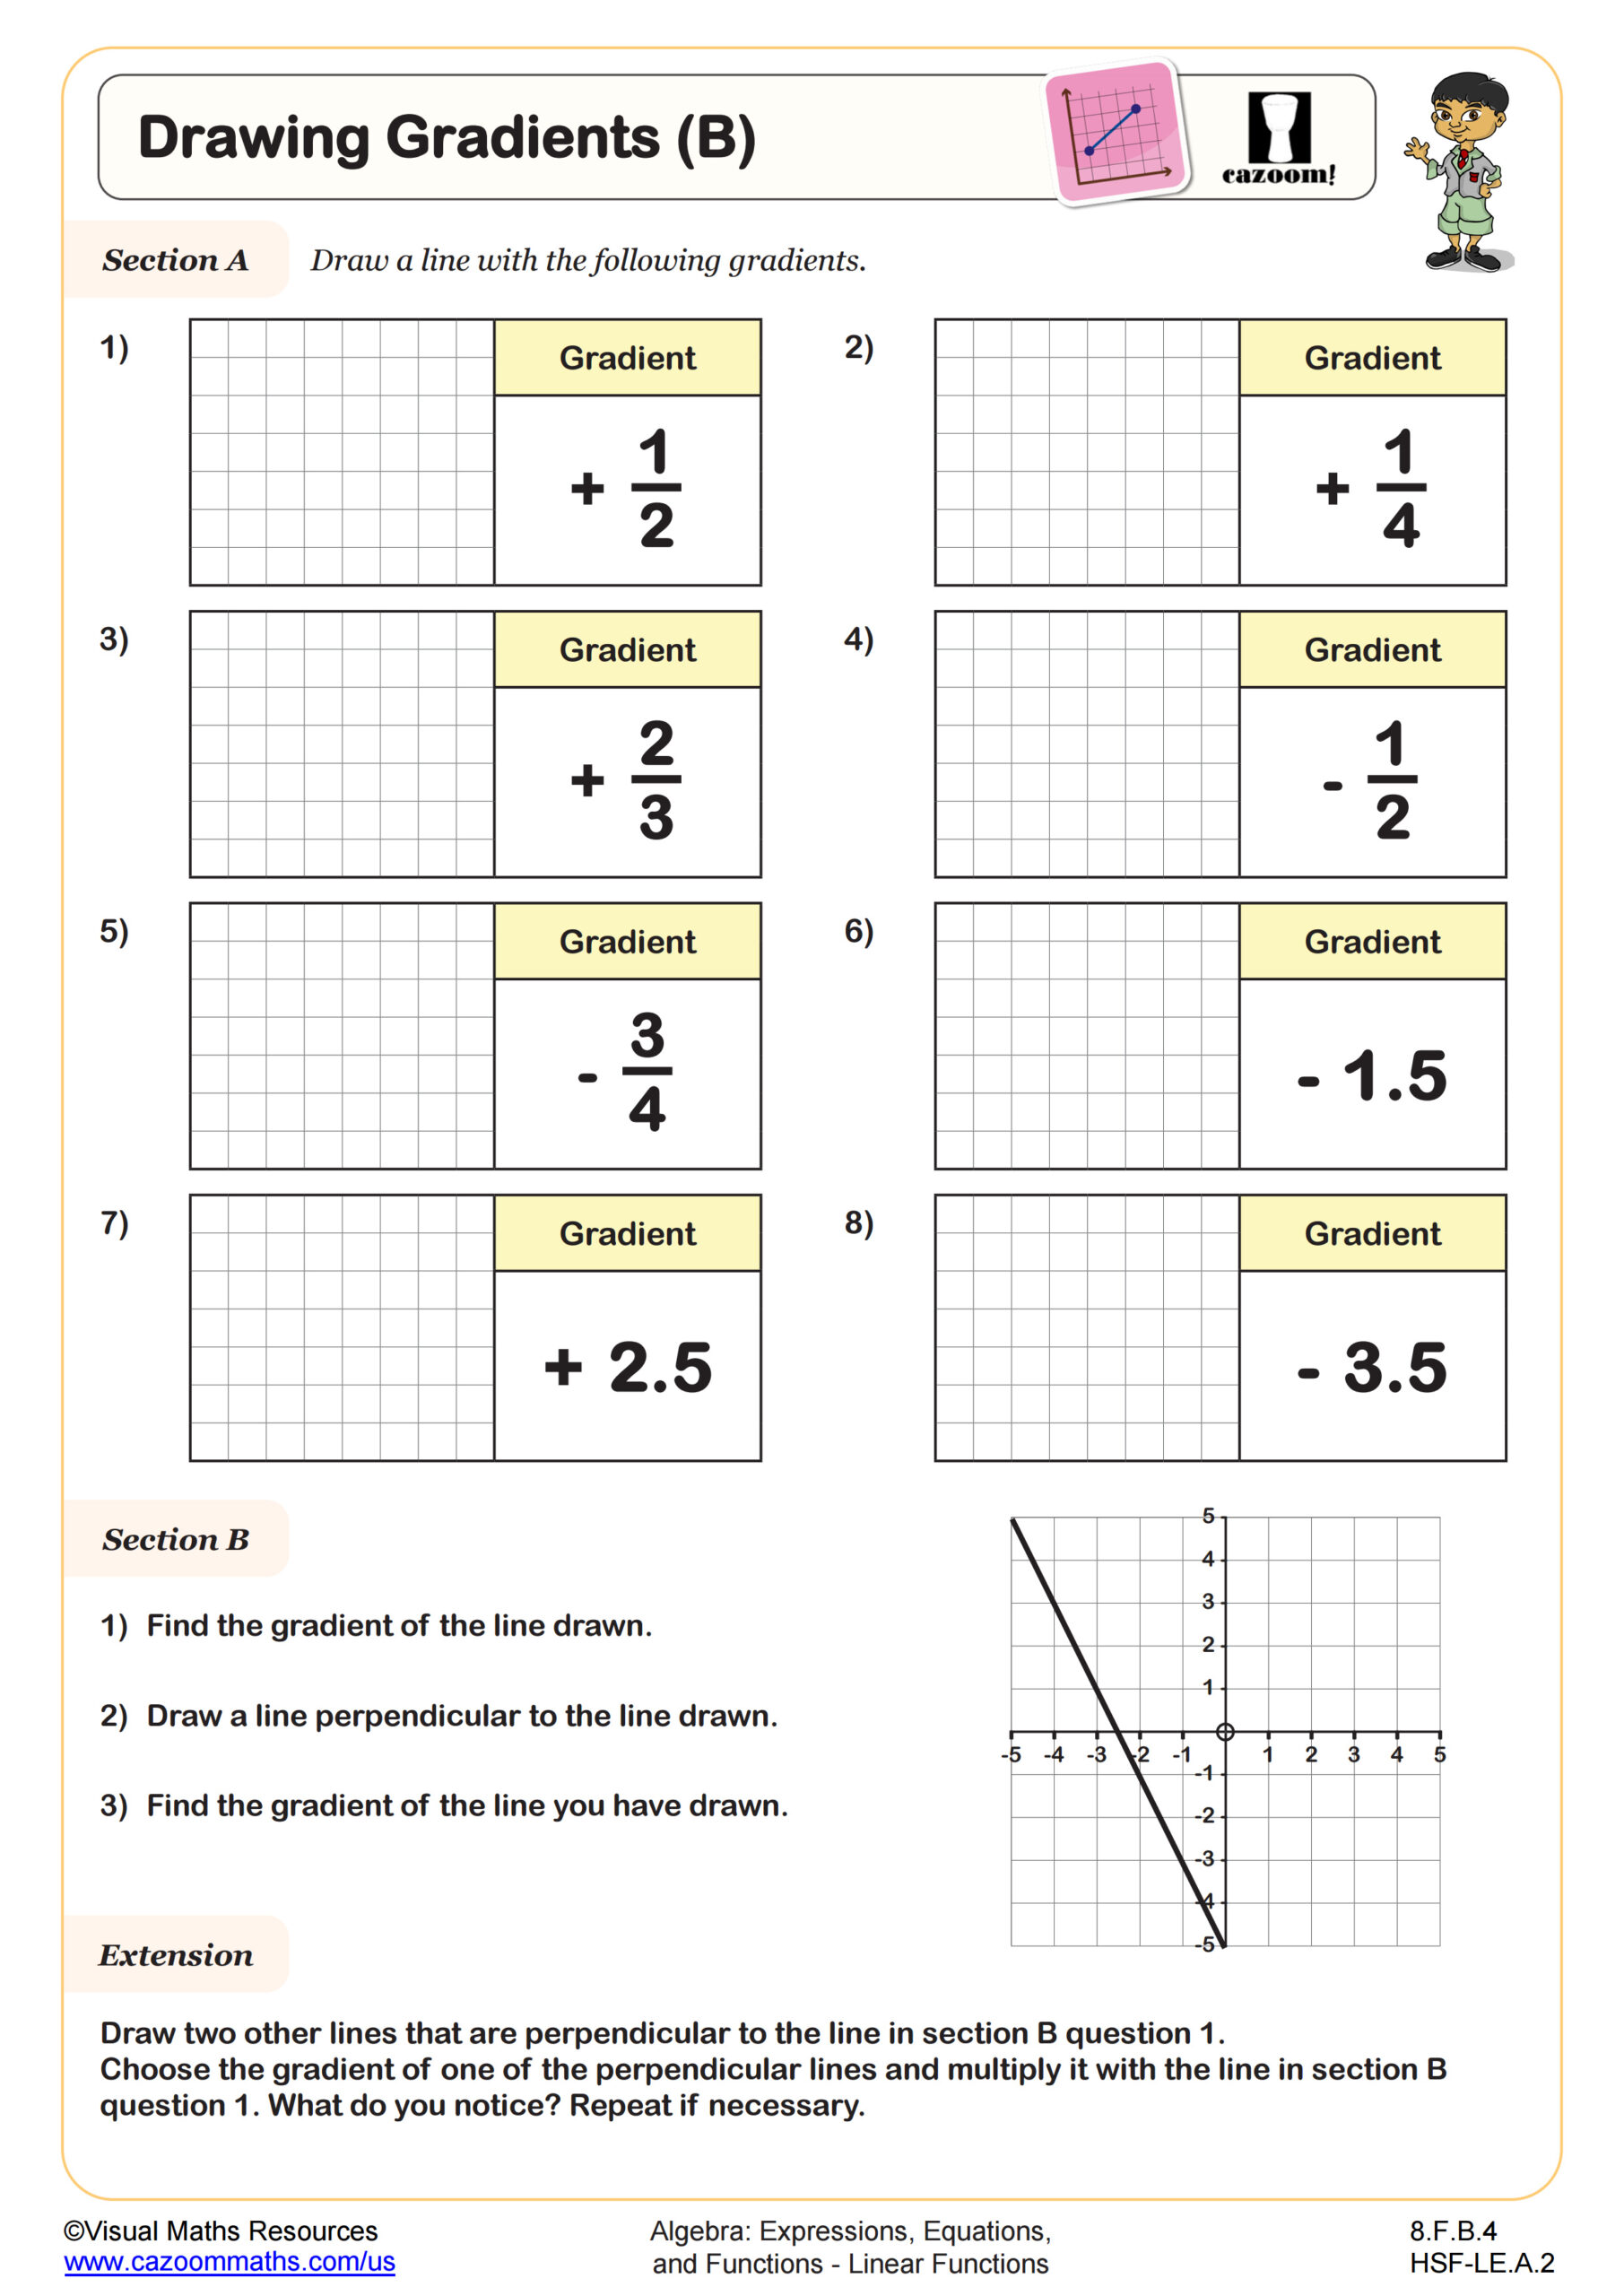
Drawing Gradients (B)
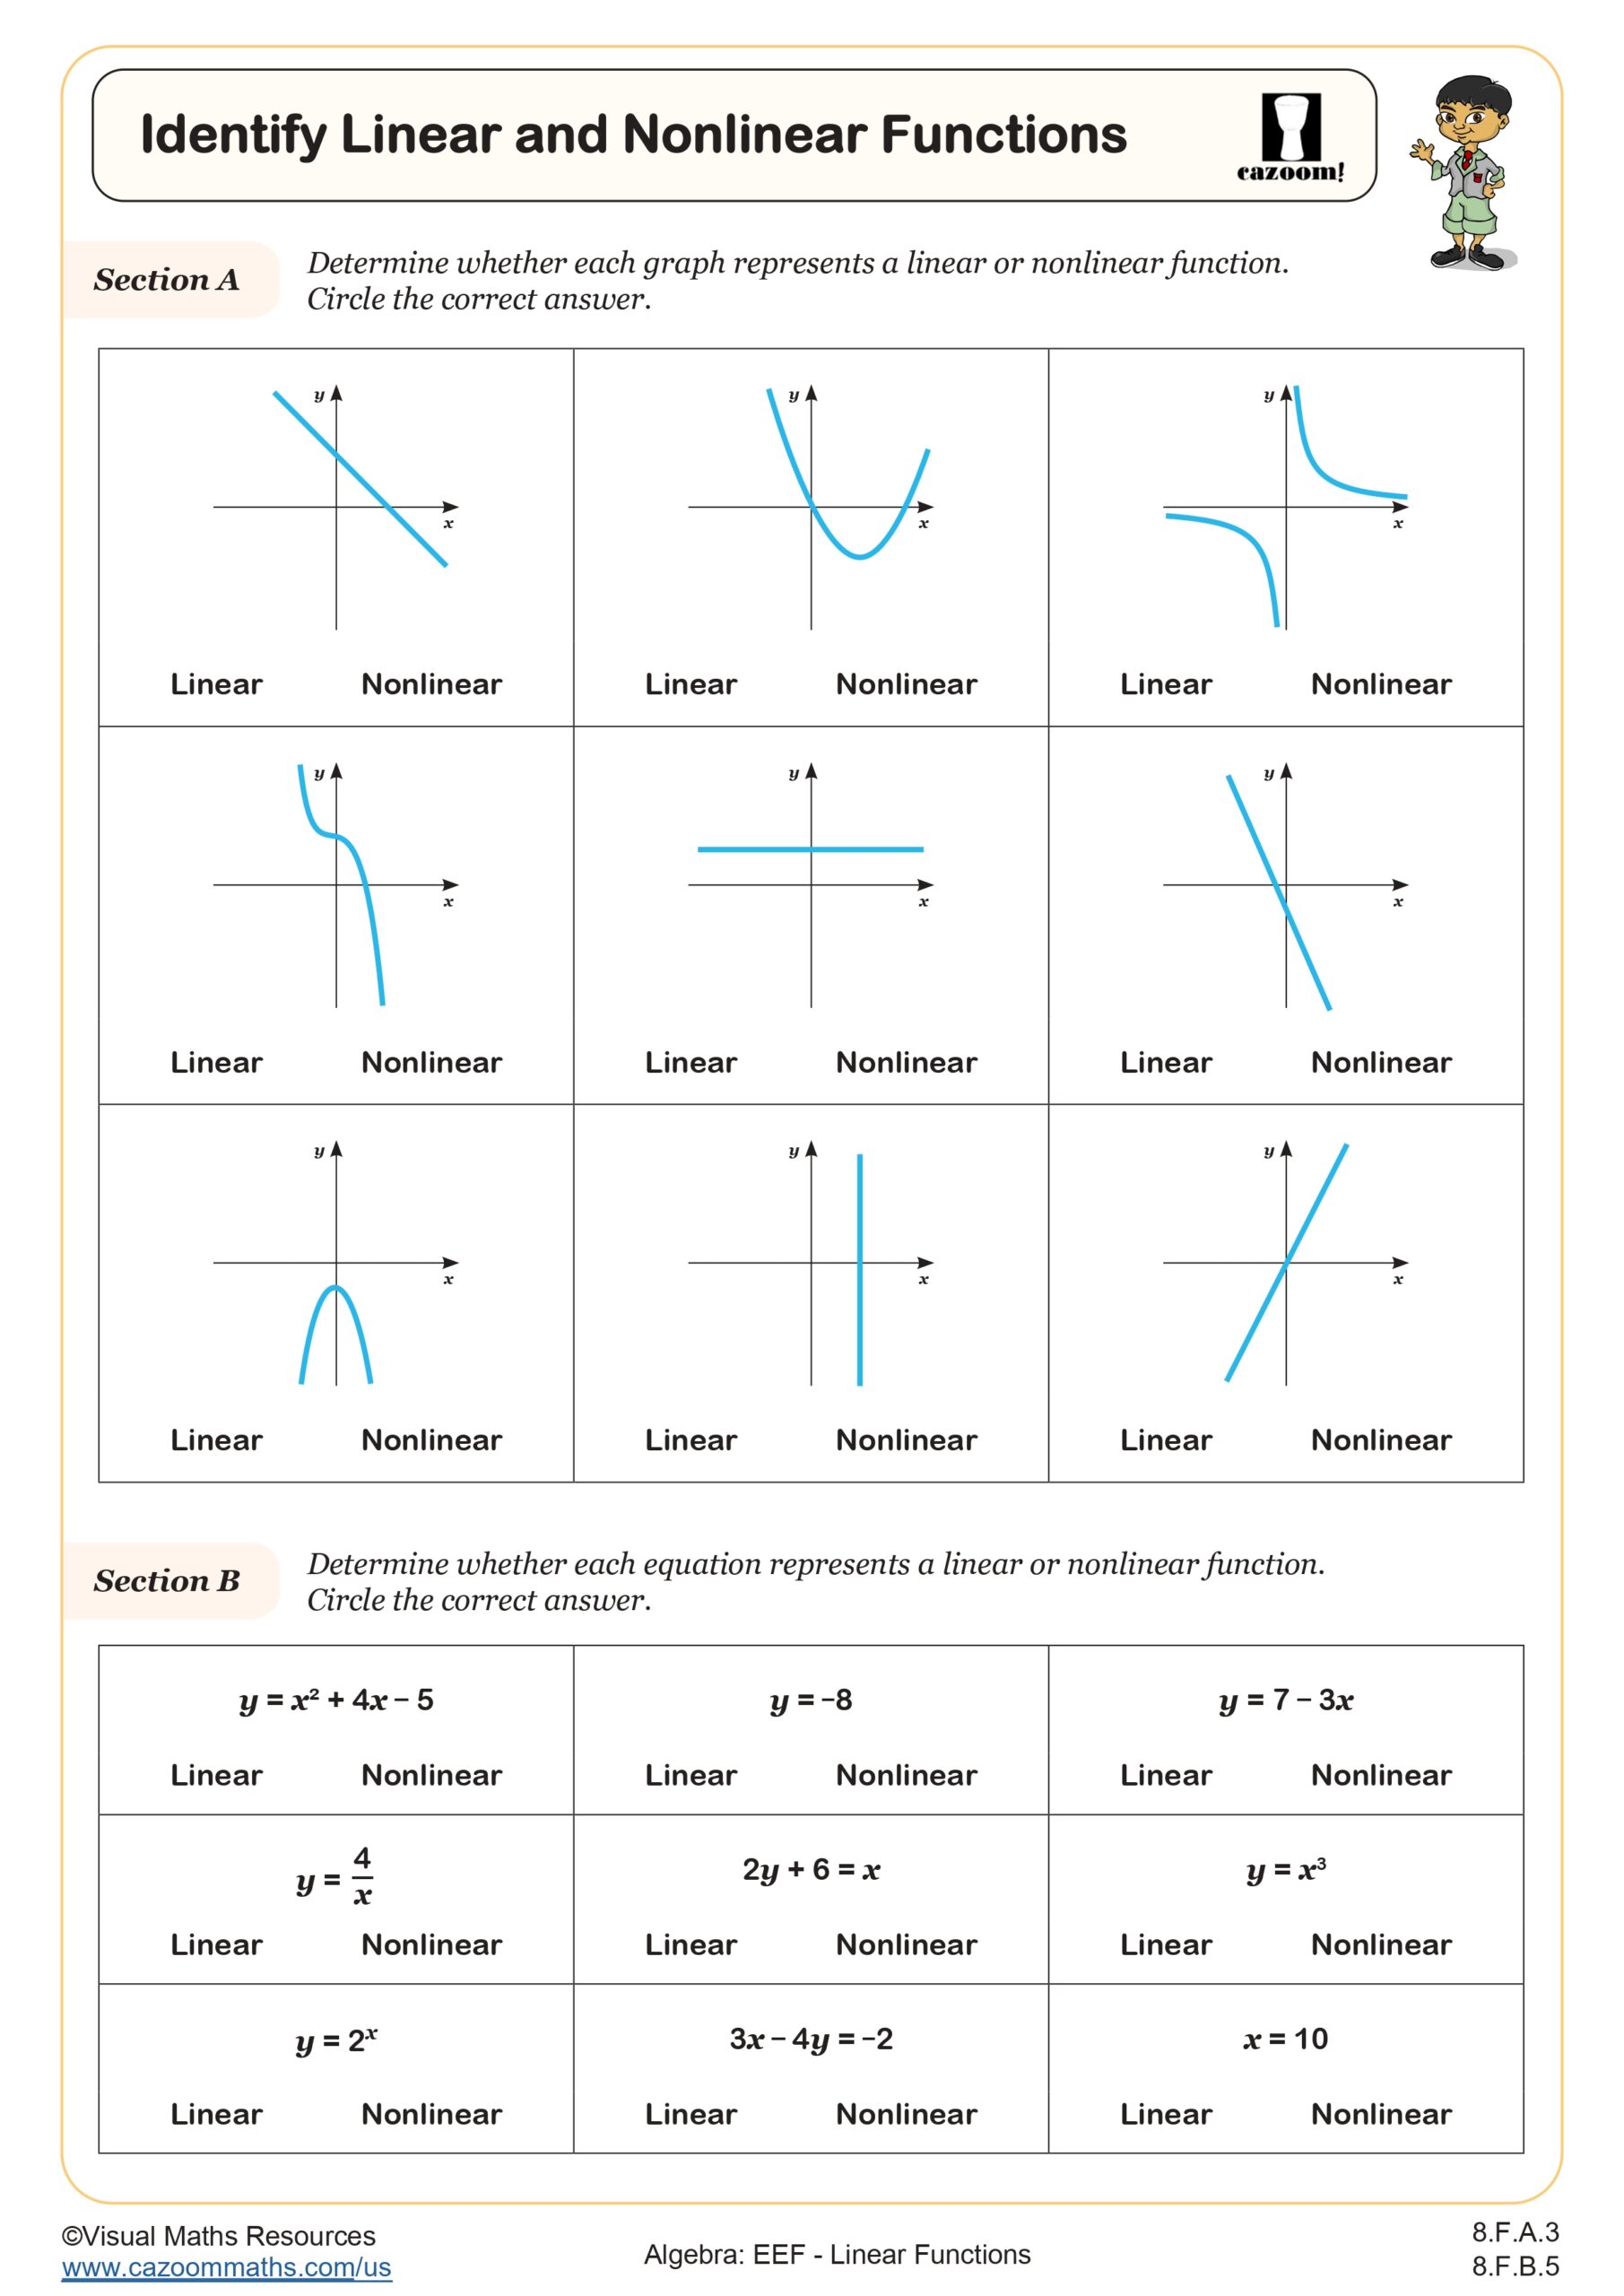
Identify Linear and Non Linear Functions
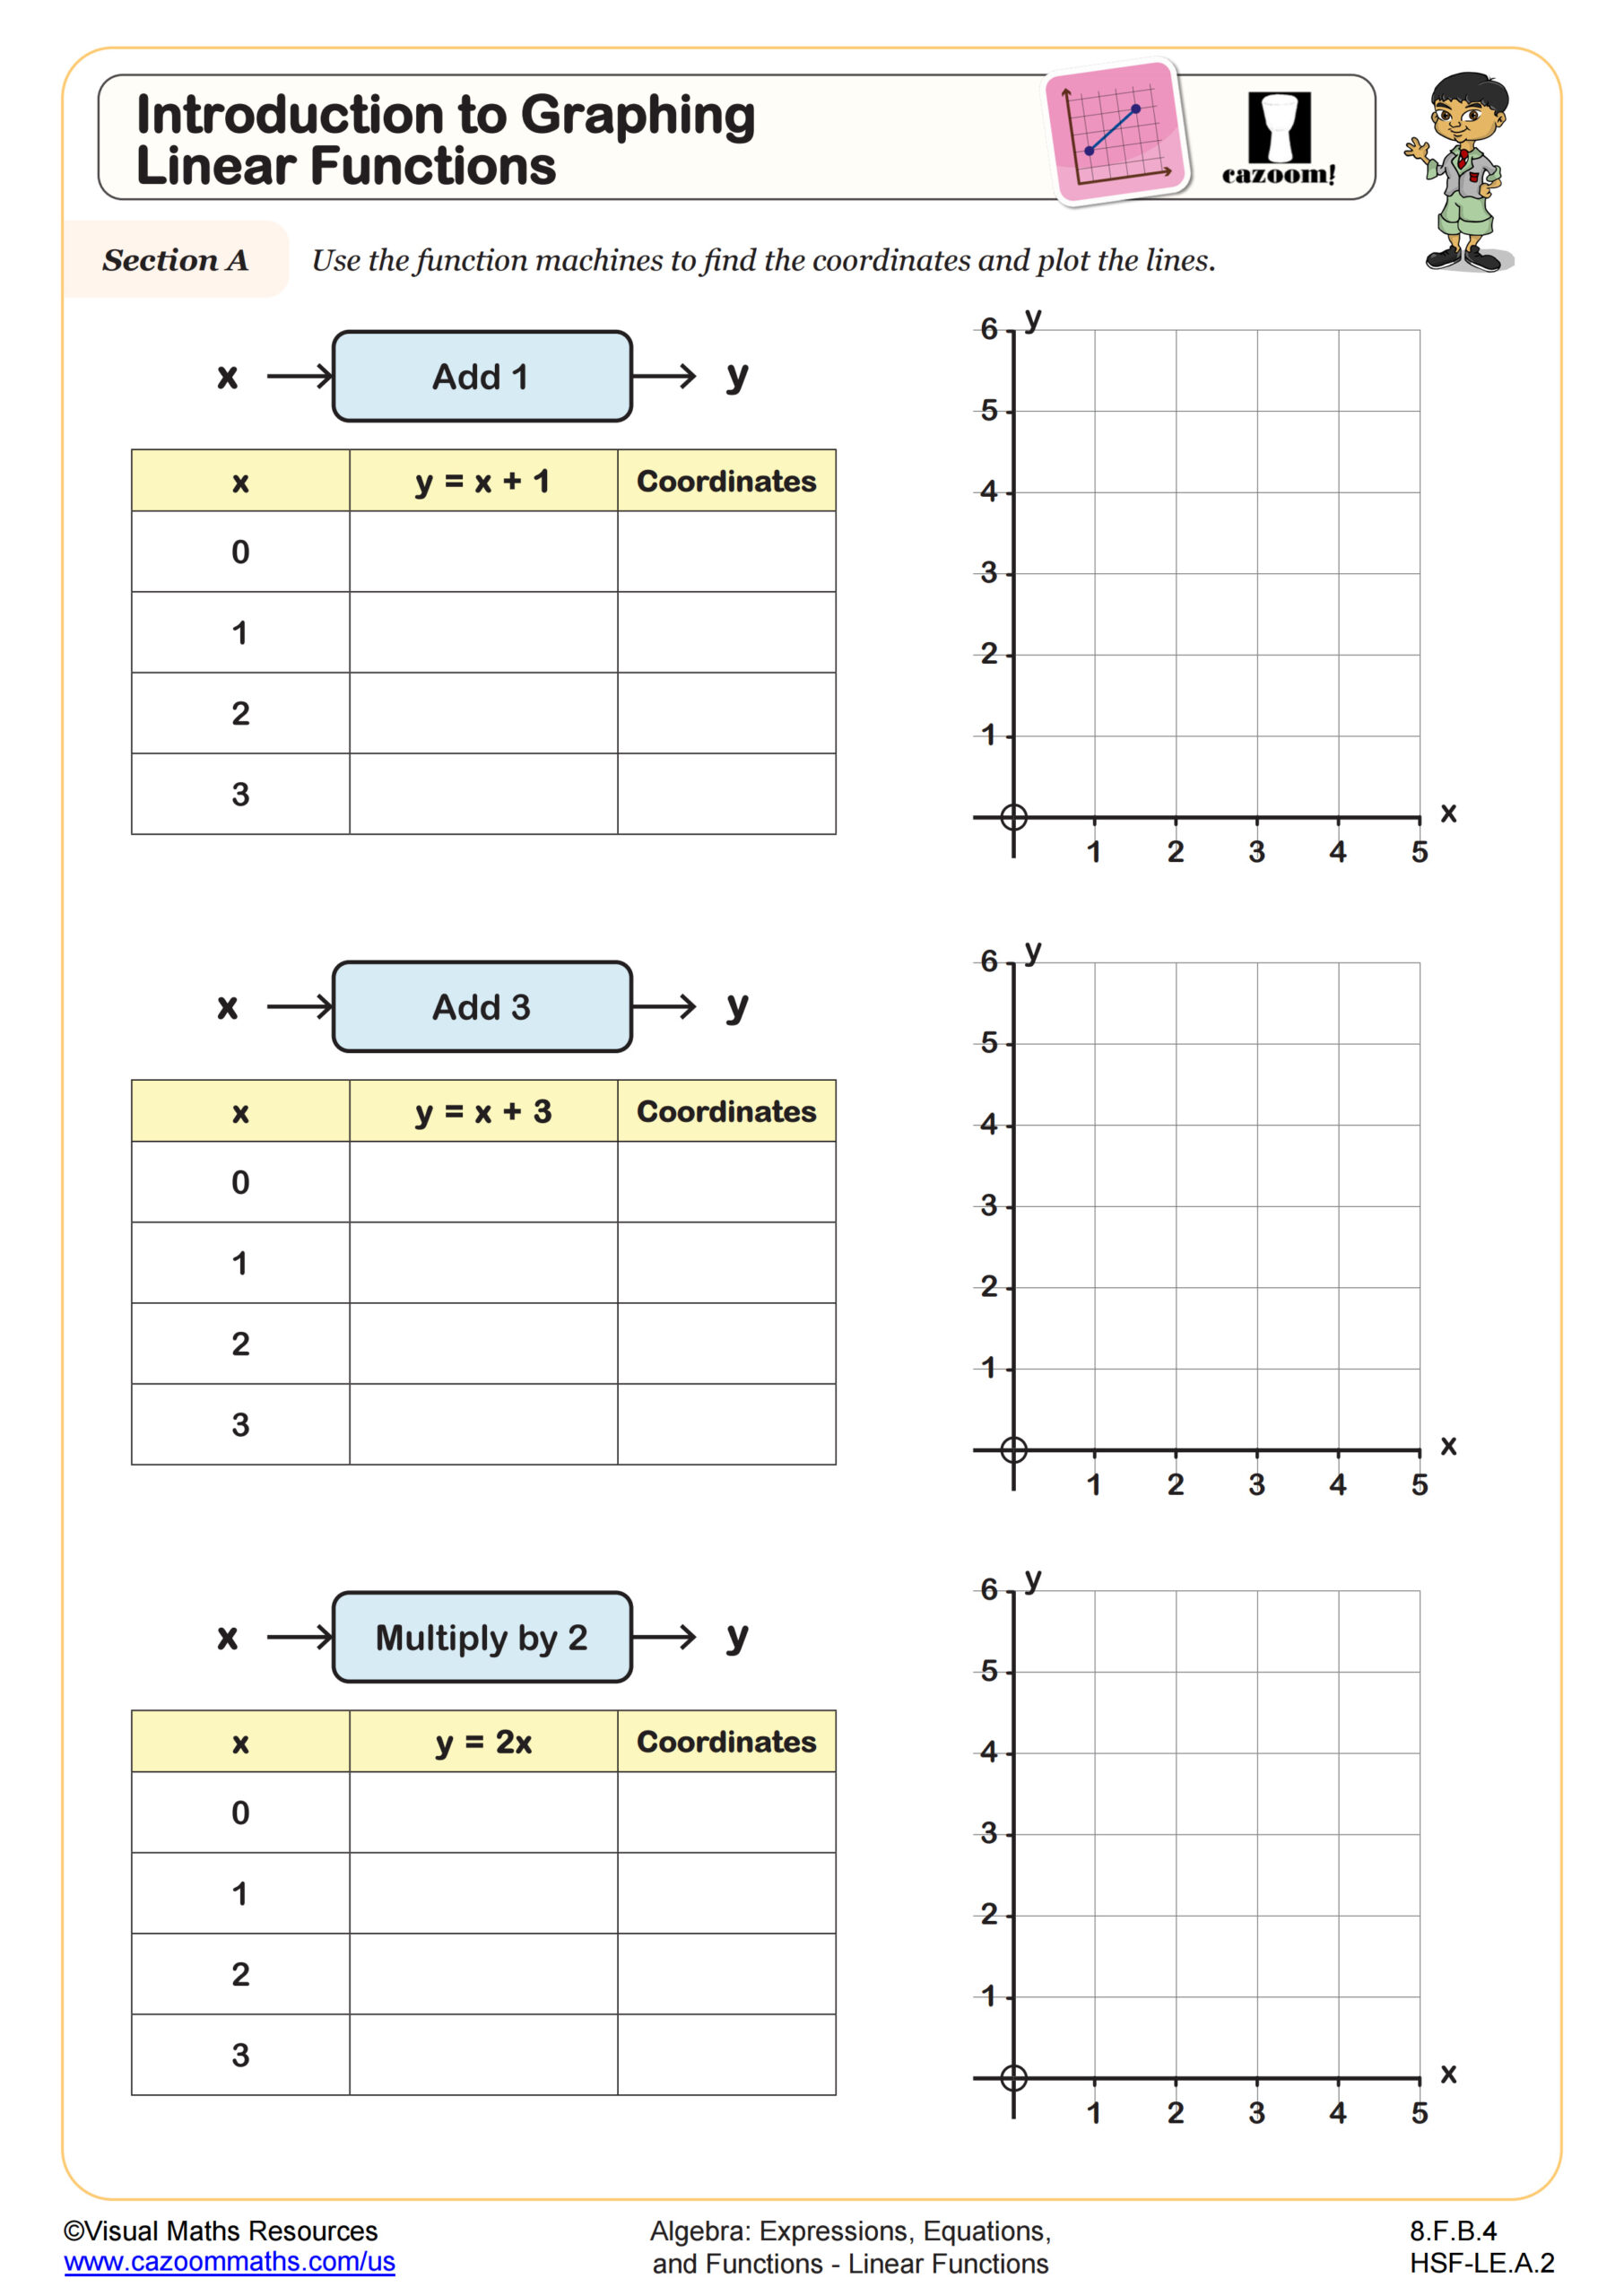
Introduction to Graphing Linear Functions
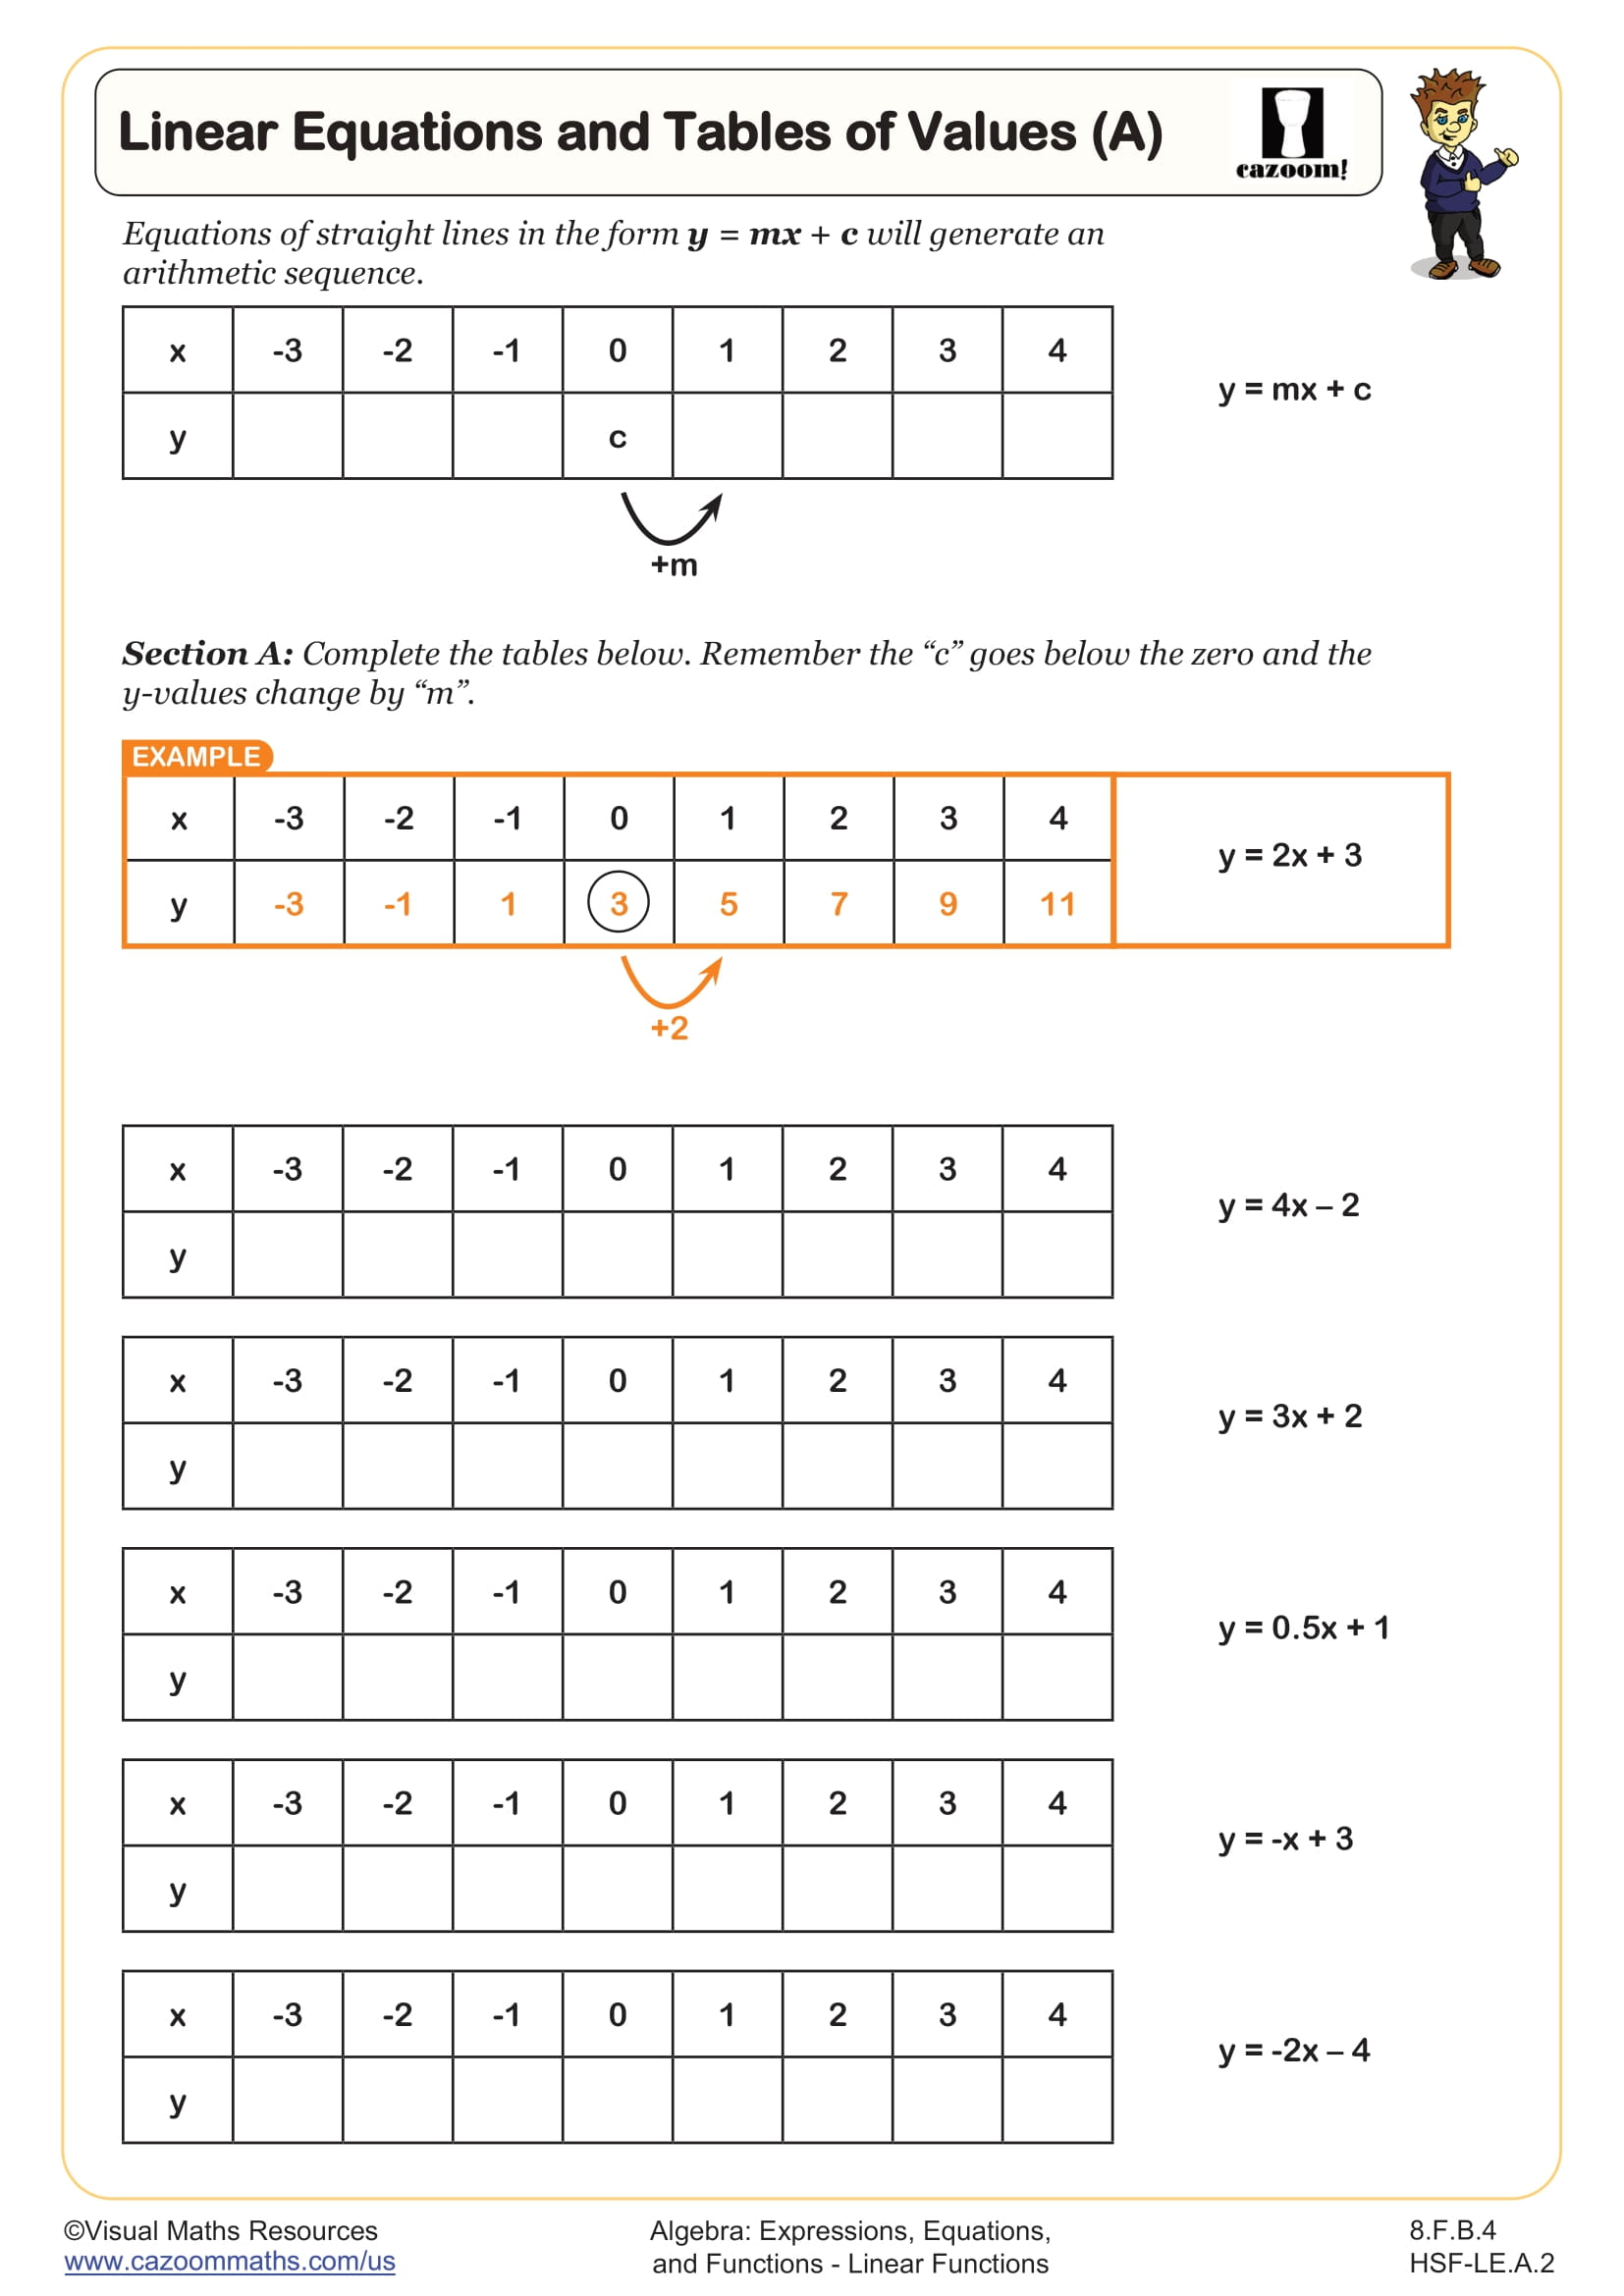
Linear Equations and Tables of Values (A)
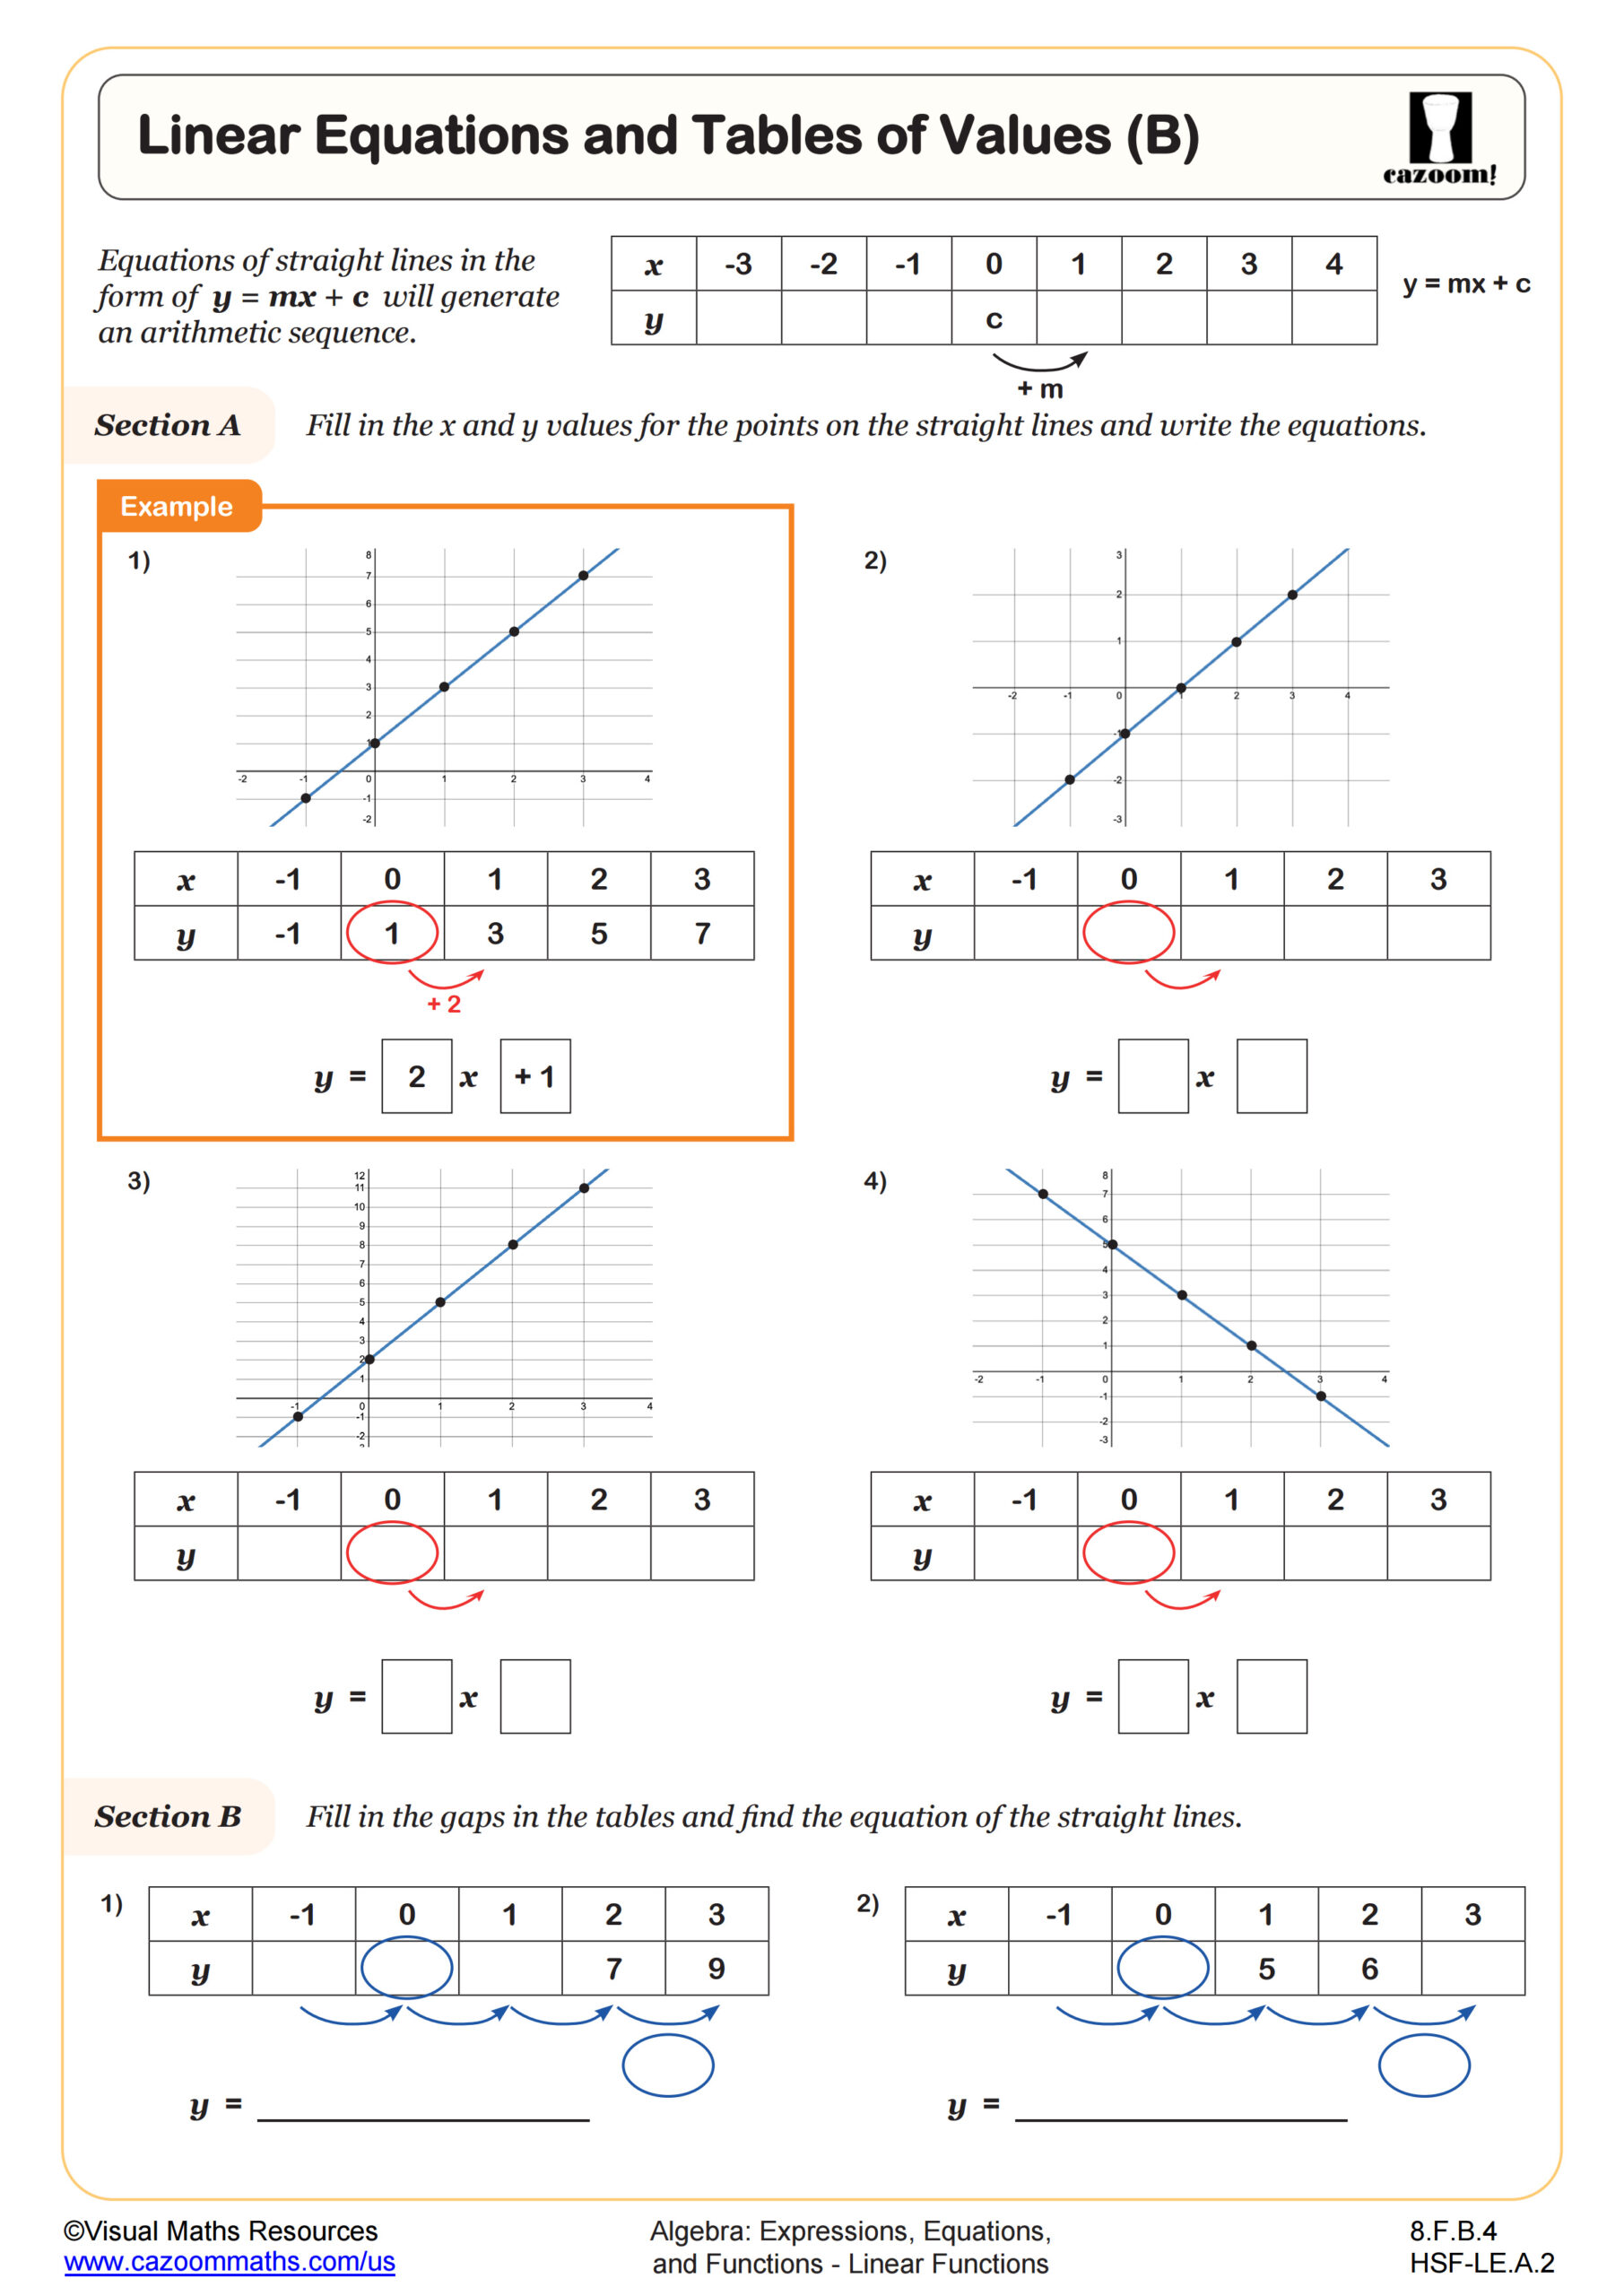
Linear Equations and Tables of Values (B)
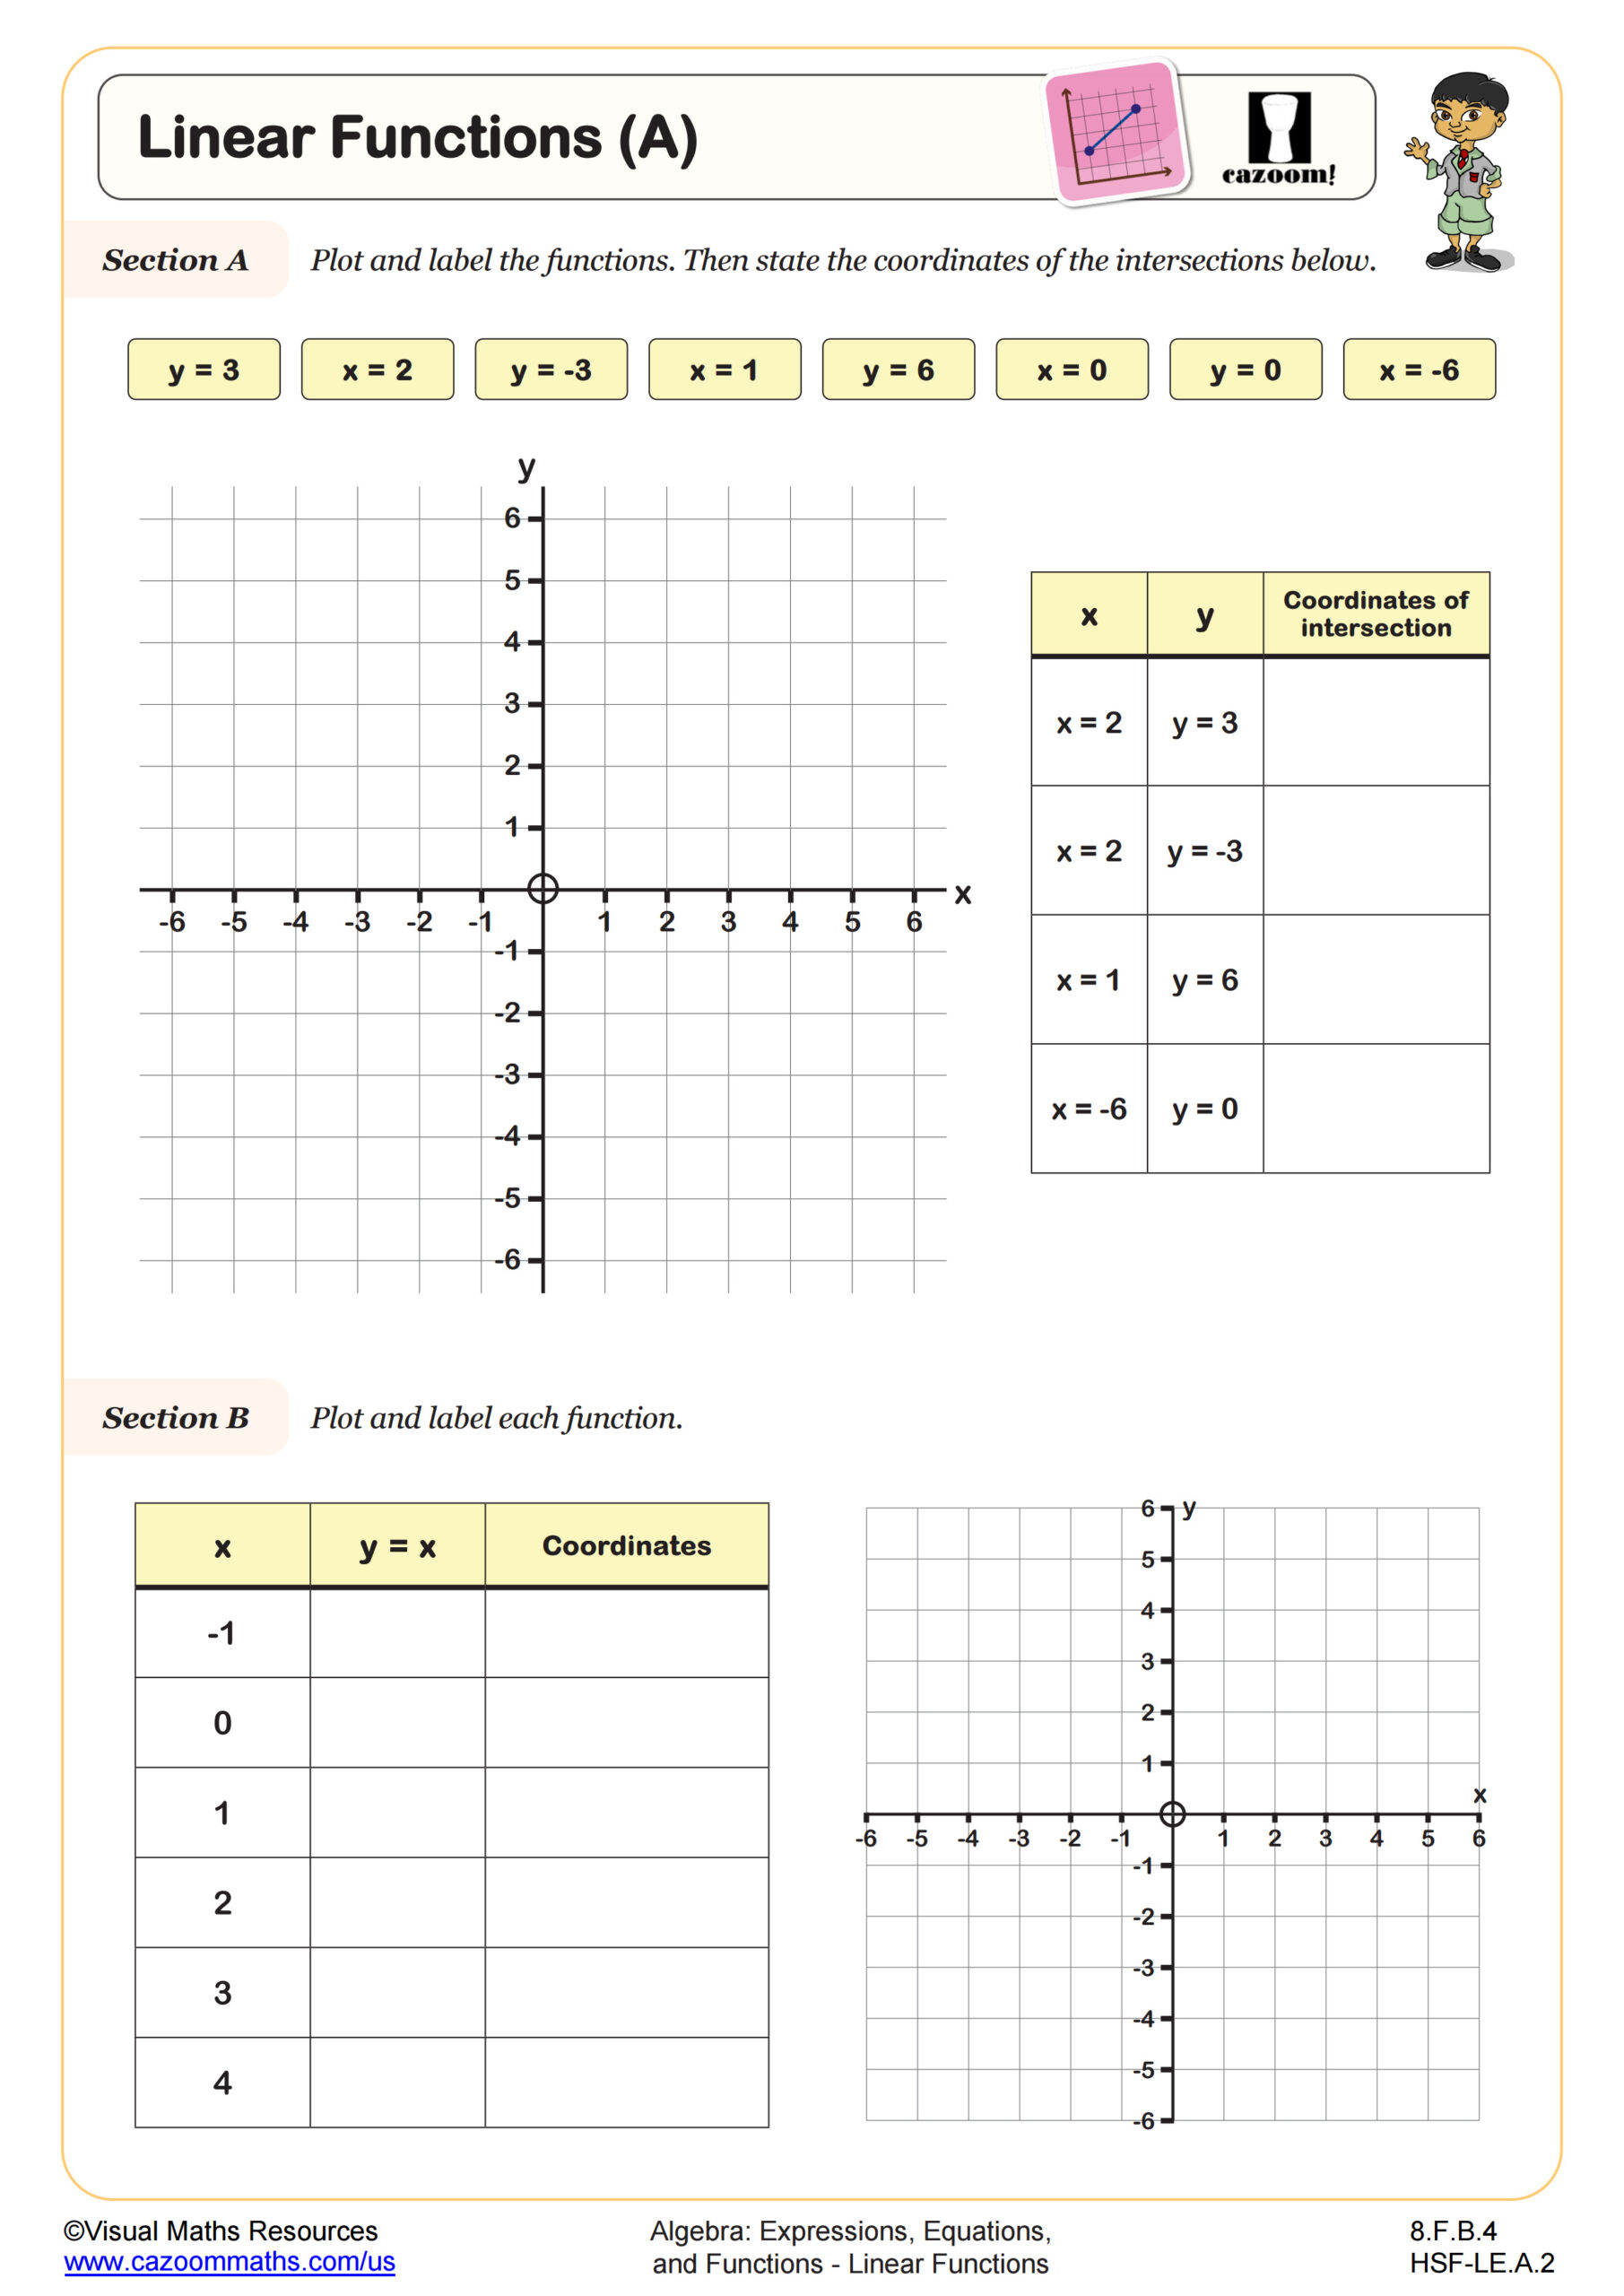
Linear Functions (A)
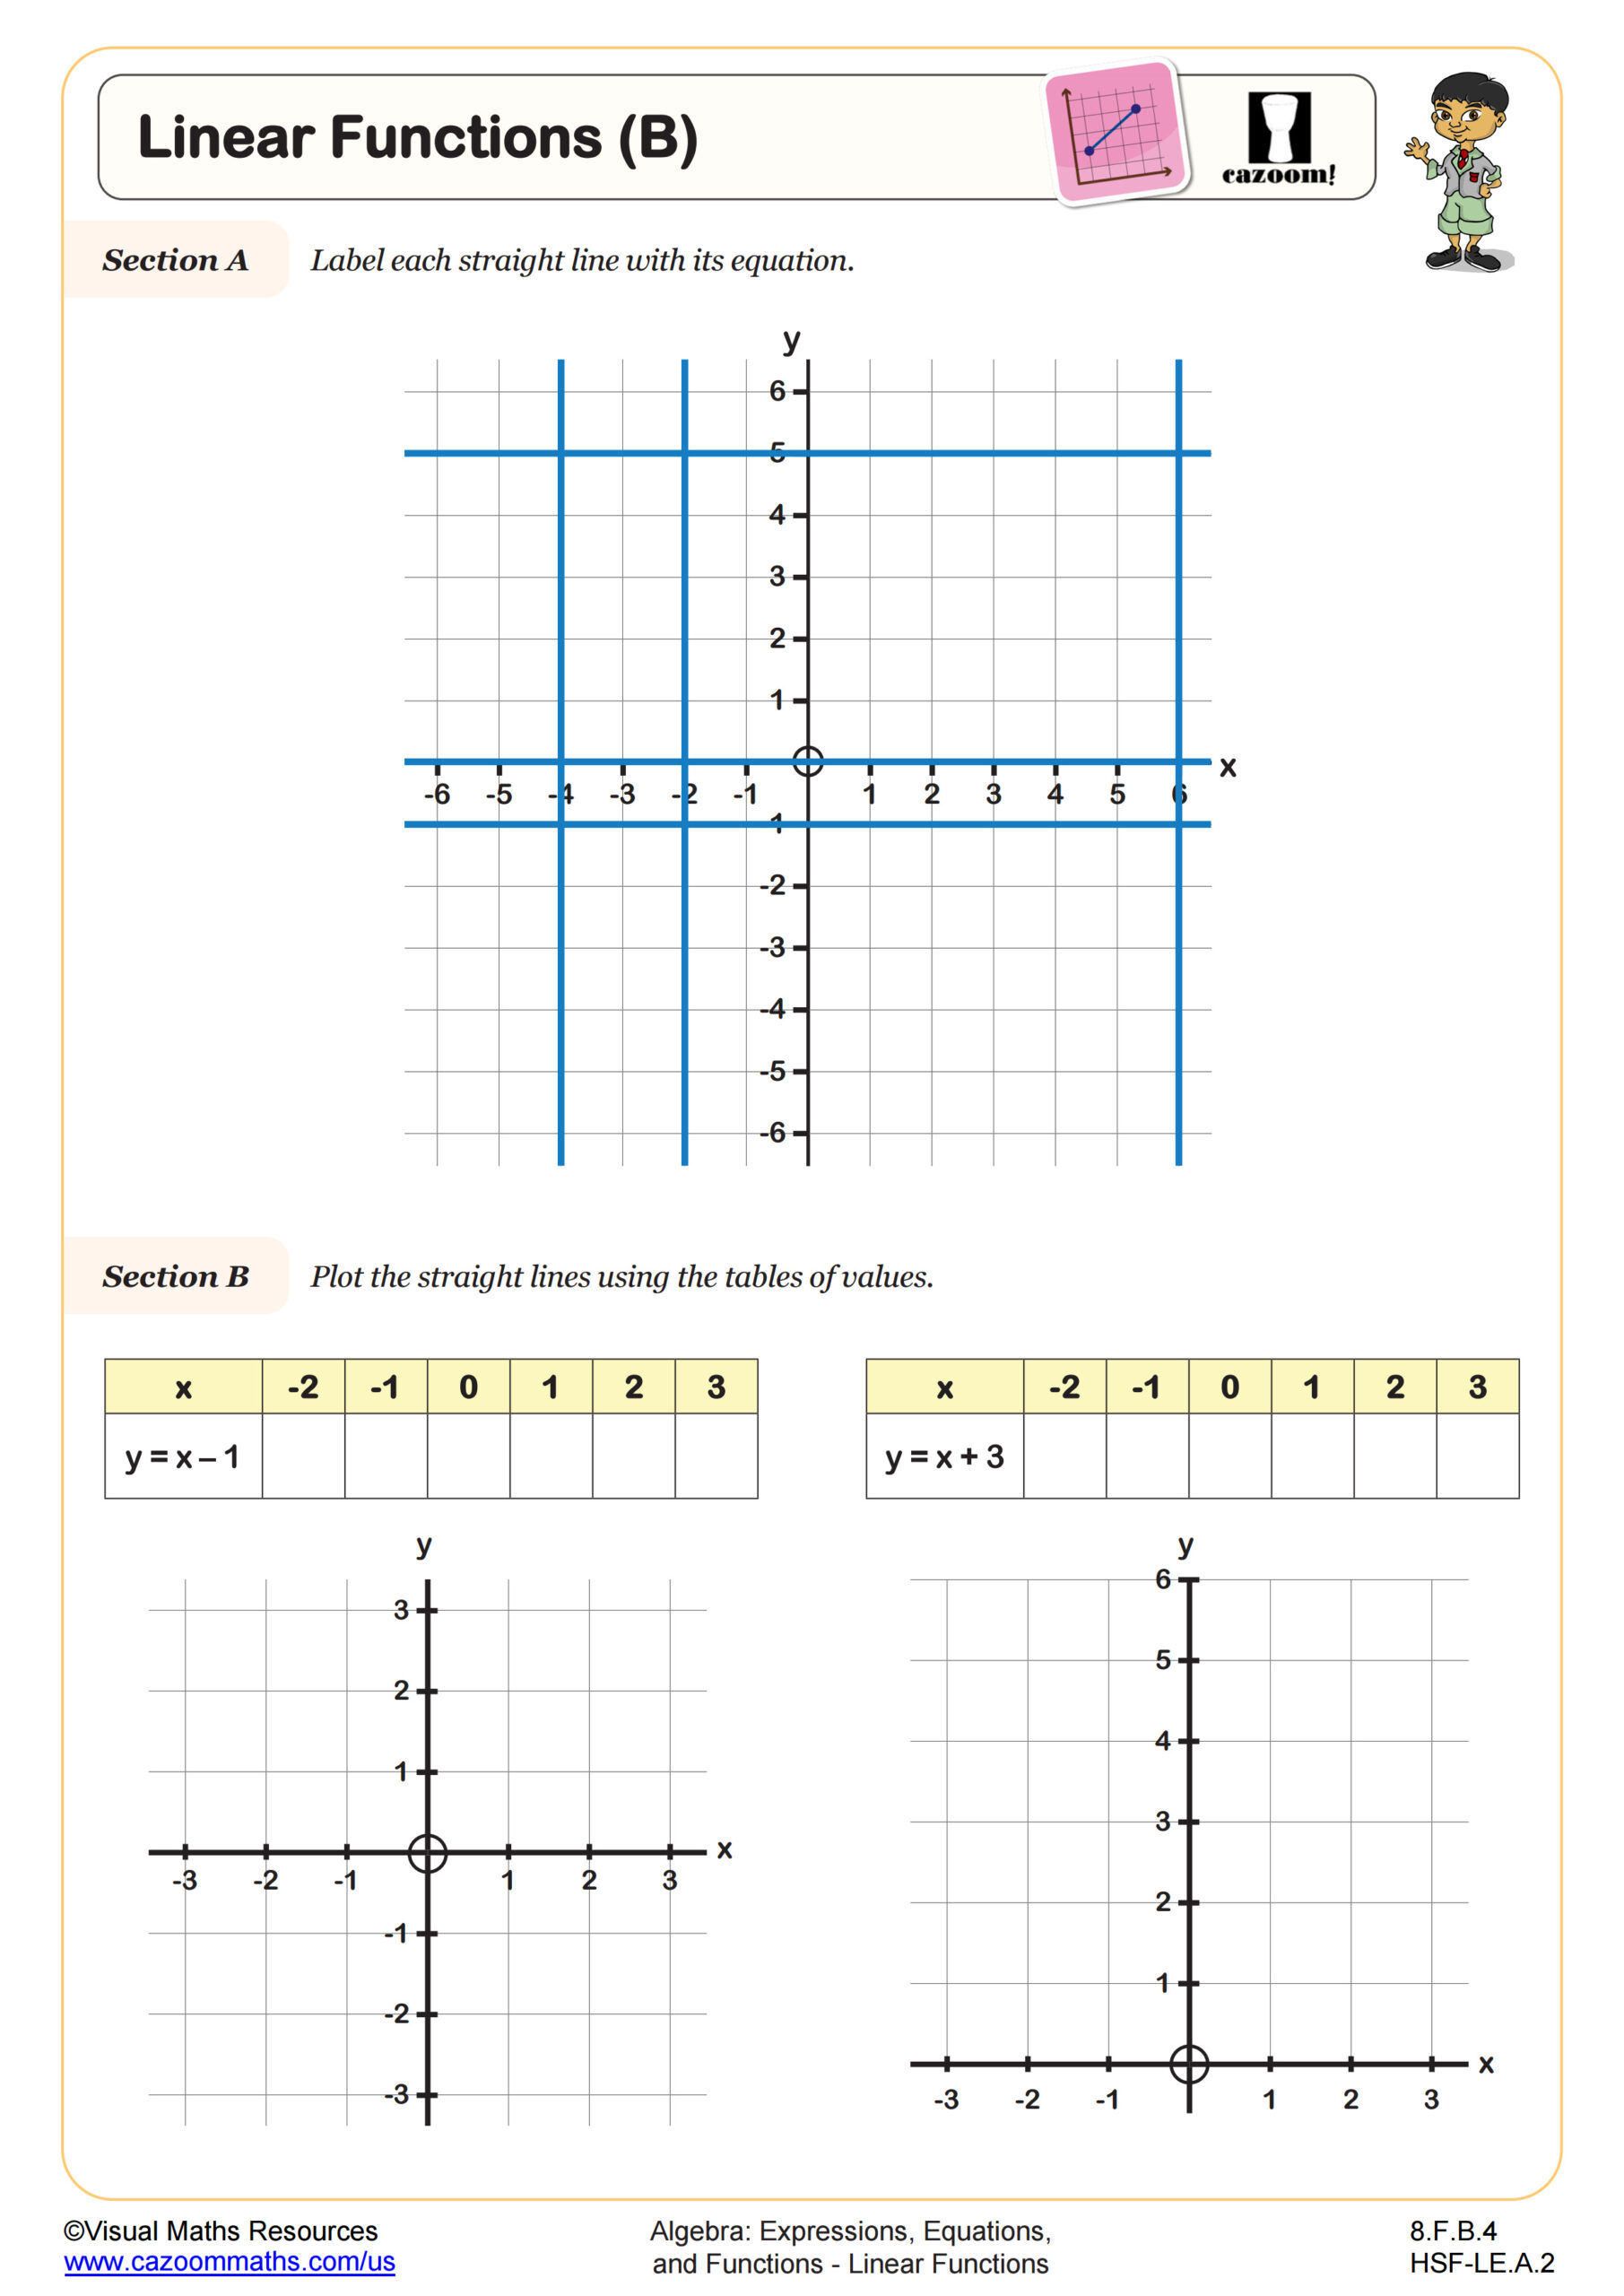
Linear Functions (B)
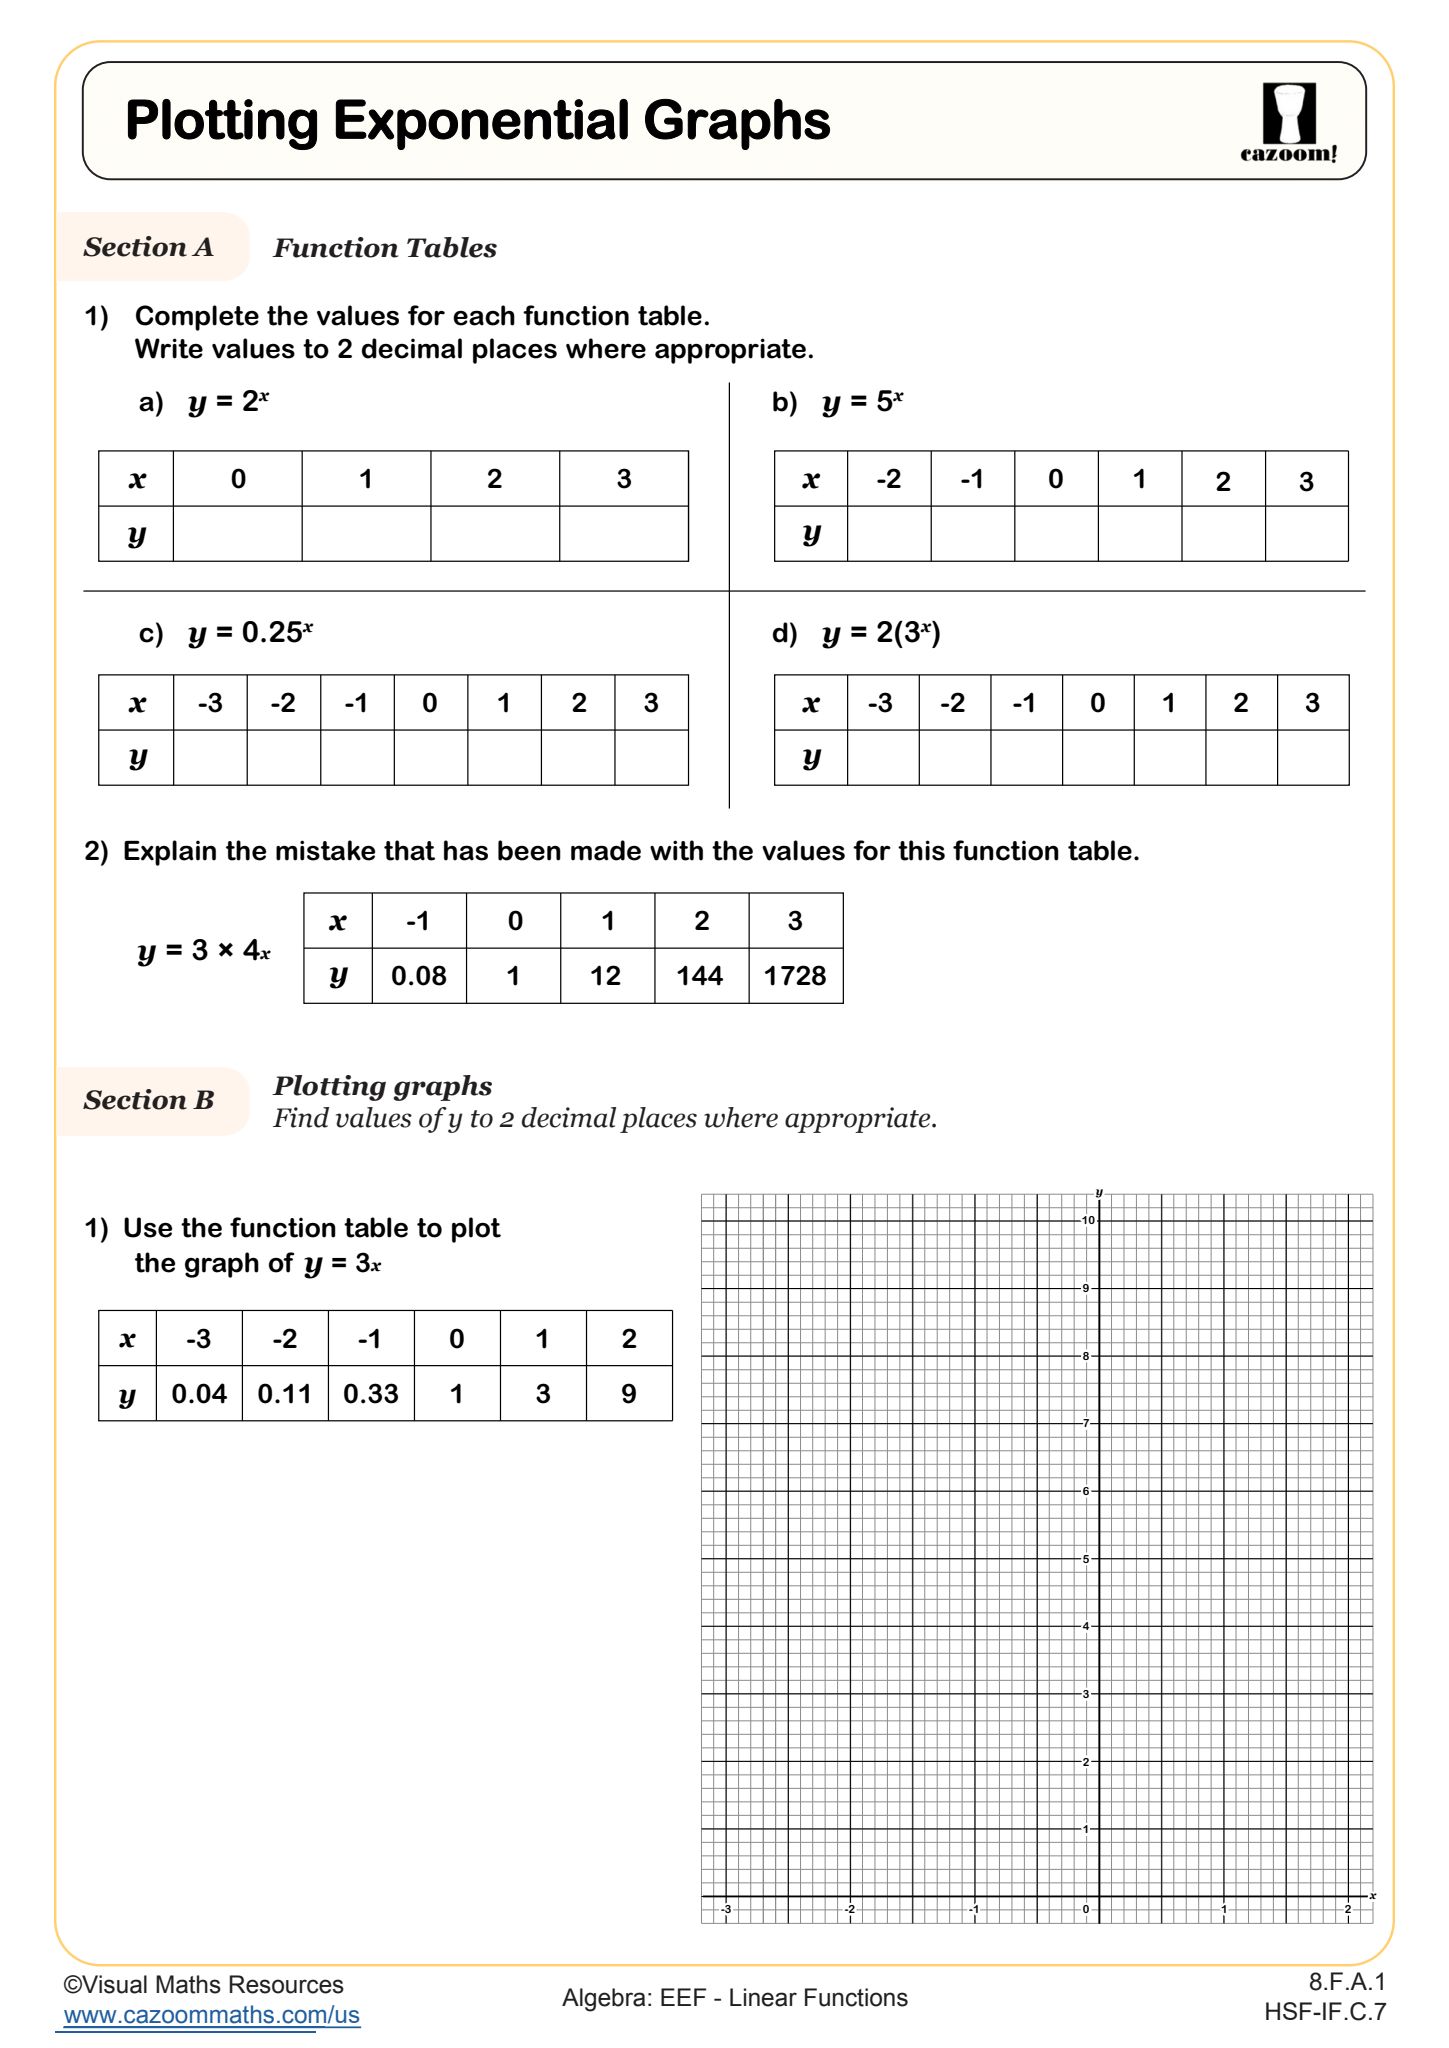
Plotting Exponential Graphs
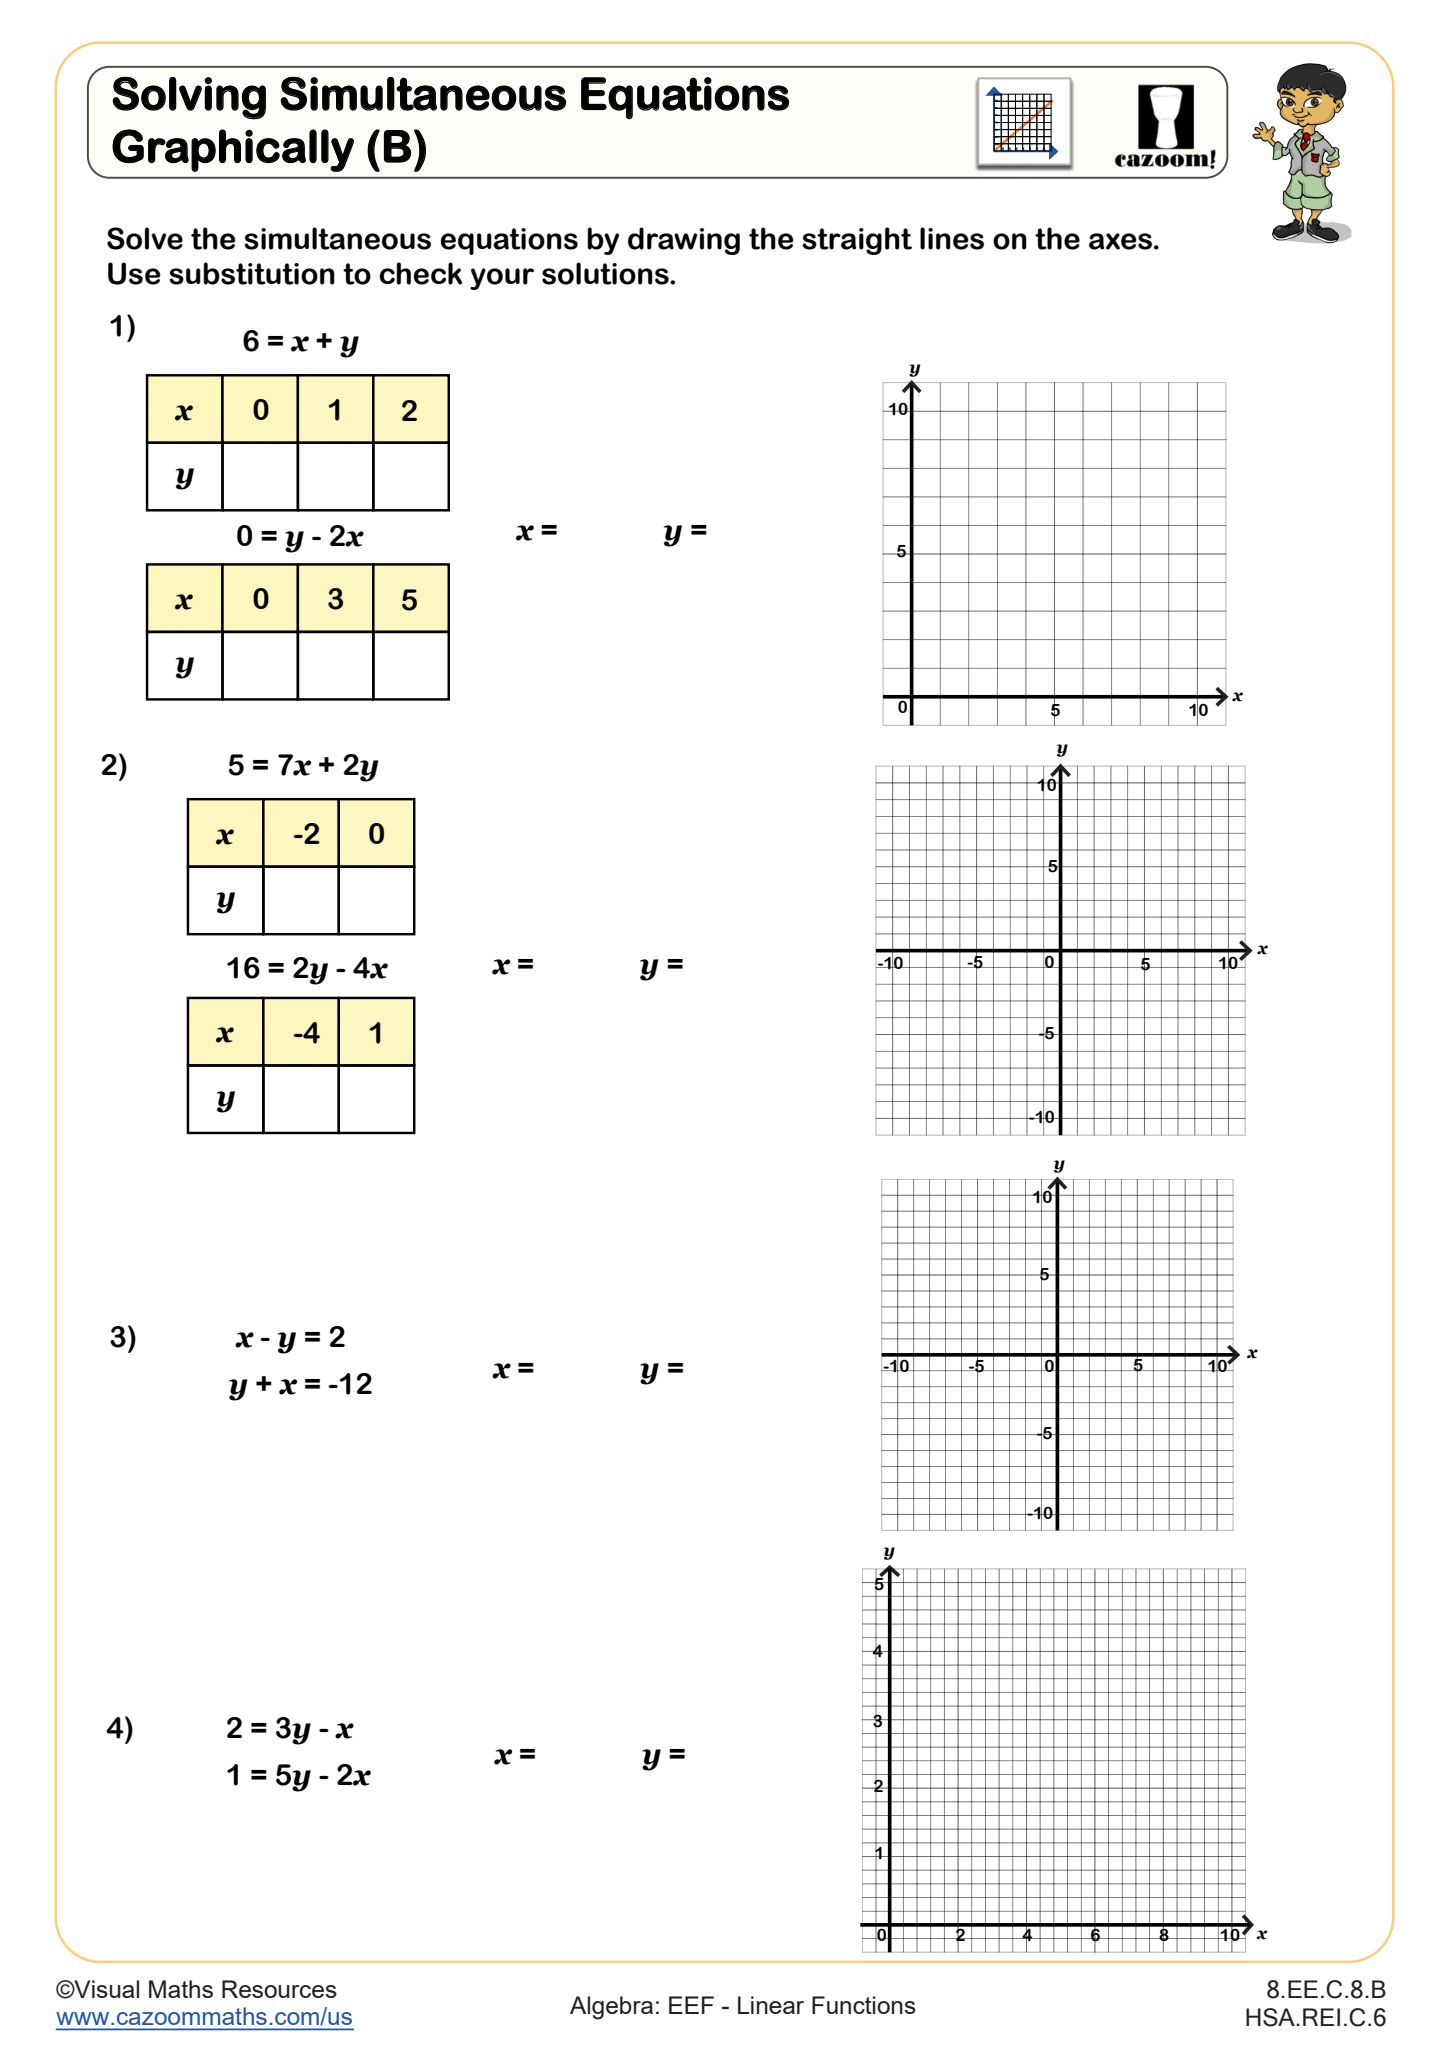
Solving Simultaneous Equations Graphically (B)
All worksheets are created by the team of experienced teachers at Cazoom Math.
What Are Linear Functions and Why Do Students Learn Them?
Linear functions represent relationships where one variable changes at a constant rate relative to another, expressed algebraically as y = mx + b. Middle school students learn linear functions because they form the foundation for understanding patterns, making predictions, and solving real-world problems involving constant change. Linear functions bridge arithmetic thinking and algebraic reasoning, preparing students for systems of equations, quadratic functions, and advanced mathematics in high school.
A common misconception occurs when students confuse the slope (rate of change) with the y-intercept (starting value). Students often write equations like y = 3x + 2 but graph a line that starts at (0, 3) instead of (0, 2), mixing up which number belongs where. This error typically decreases once students consistently connect the equation back to a table of values, seeing how the y-intercept appears when x equals zero.
Which Grade Levels Cover Linear Functions?
These linear functions worksheets align with middle school math curriculum for 6th, 7th, and 8th grade students. The Common Core State Standards introduce proportional relationships and coordinate graphing in 6th grade, expand to linear equations and slope in 7th grade, and deepen understanding of functions and comparing linear models in 8th grade. This progression ensures students build mastery gradually across the middle school years.
The difficulty increases significantly across these grades. Sixth graders typically work with positive linear relationships and simple coordinate plotting, while 7th graders tackle negative slopes and y-intercepts. By 8th grade, students analyze multiple representations simultaneously, determine whether relationships are linear by examining rate of change, and apply function notation. Teachers notice that students who rush through 6th grade coordinate plane foundations often struggle when negative coordinates appear in 7th grade contexts.
How Do Coordinate Grids Support Linear Function Understanding?
Coordinate grids with all four quadrants allow students to visualize linear relationships extending in both positive and negative directions. Working with blank axes and blank grids teaches students to set up their own coordinate systems, choosing appropriate scales based on the data they're graphing. This flexibility becomes essential when students encounter real-world data that doesn't conveniently fit pre-labeled axes, requiring them to think critically about number line divisions and interval spacing.
Engineers and data scientists use coordinate graphing daily to model relationships between variables. Weather forecasters graph temperature changes over time, architects plot building dimensions on coordinate planes, and economists track supply and demand curves using linear models. Students often make the connection that GPS coordinates, video game movement, and drone navigation all rely on the same four-quadrant coordinate system they're learning in math class, making abstract graphing skills suddenly tangible and career-relevant.
How Can Teachers Use These Linear Functions Worksheets Effectively?
The worksheets scaffold learning by starting with foundational coordinate graphing skills before progressing to more complex linear relationships. Blank tables of values encourage students to generate their own ordered pairs from equations, while pre-printed coordinate grids let them focus on accurate plotting without the added challenge of creating axes. The variety of grid formats allows teachers to differentiate instruction based on student readiness, providing structured support or open-ended exploration as needed.
Many teachers use these worksheets during math intervention blocks to address gaps in graphing skills that surface during equation-solving units. The answer keys make the materials ideal for homework assignments where students can self-check their work, or for paired activities where one student graphs while the other verifies accuracy. Teachers also find them valuable as warm-up exercises before introducing slope-intercept form, ensuring students have the graphing mechanics mastered before adding algebraic complexity.