Middle School Mean, Median, and Mode Worksheets
All worksheets are created by the team of experienced teachers at Cazoom Math.
Boost Measurement Accuracy and Problem-Solving Skills With Our Printable Middle School Math Resources
Students in earlier grades learned to organize data and read simple charts. Middle school extends that work by teaching students to summarize information with a single representative value. When students can calculate mean, median, and mode, they gain tools to describe what's typical in any data set and spot patterns across groups.
These skills prepare students for high school statistics, where they'll work with distributions and probability. Regular practice now helps students recognize when data is skewed or when outliers affect their calculations. That understanding makes future topics like standard deviation and correlation easier to grasp.
Key Math Skills Covered in Cazoom Math Measurement and Data Activities
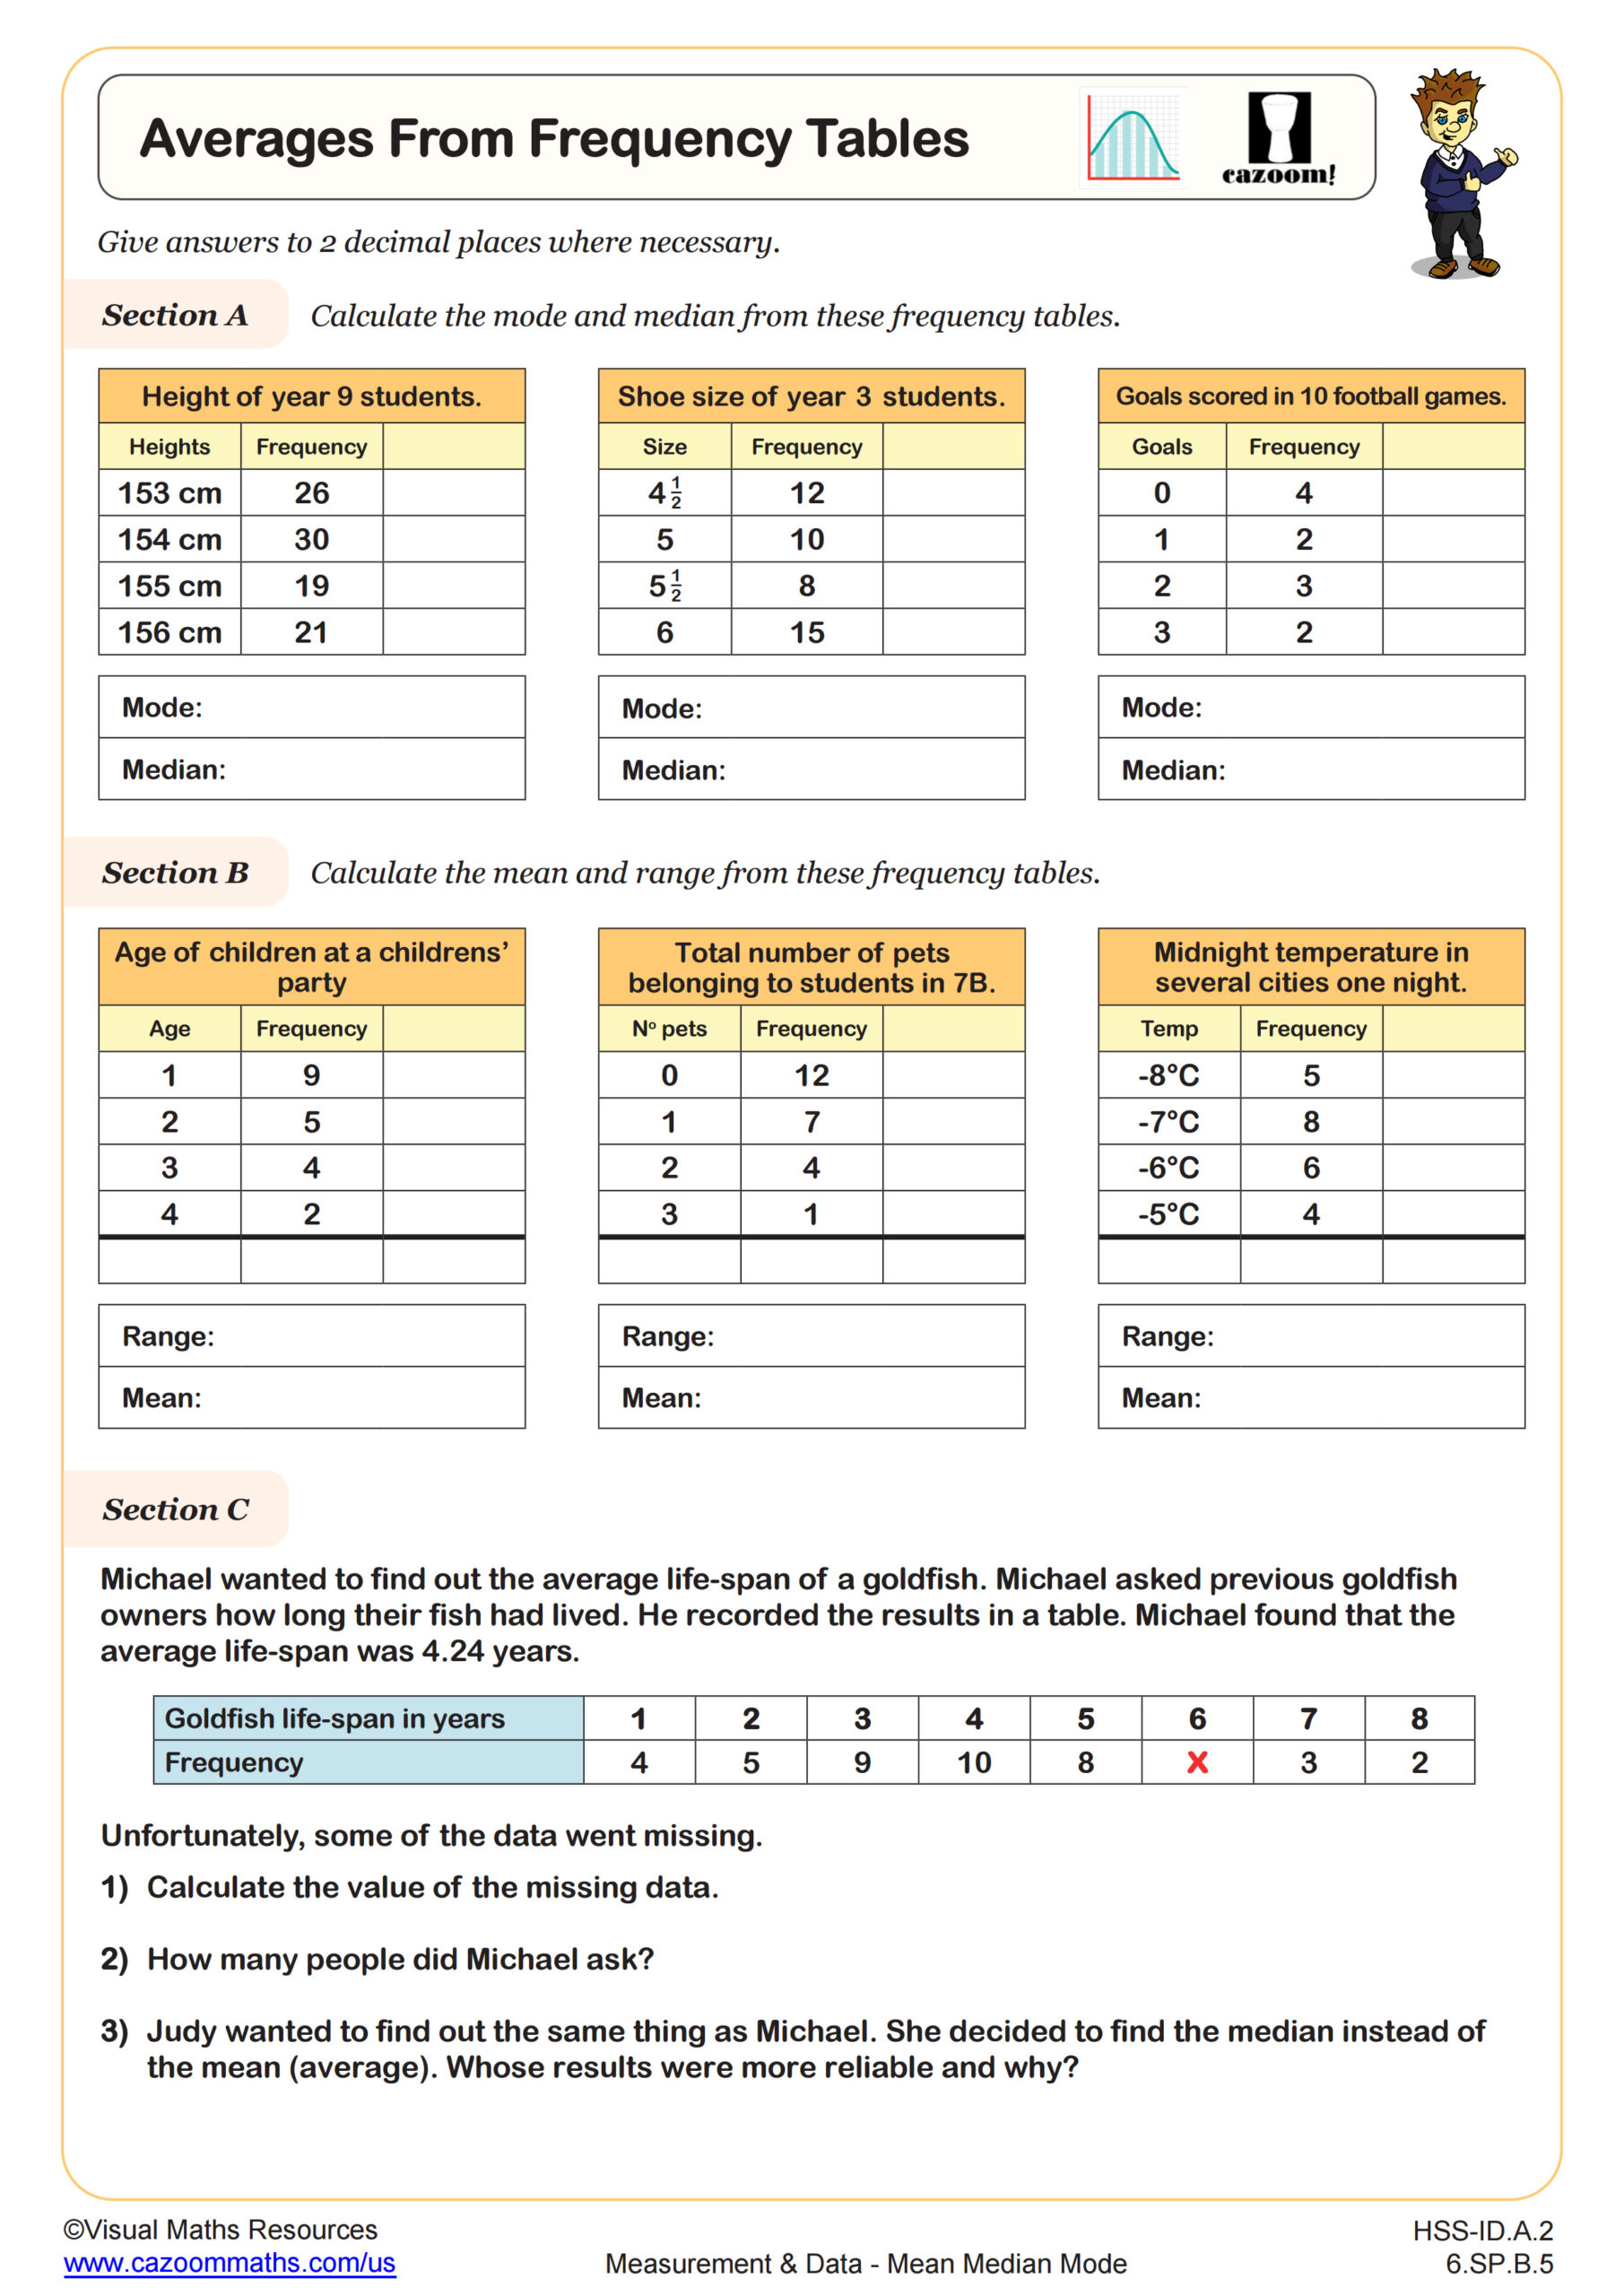
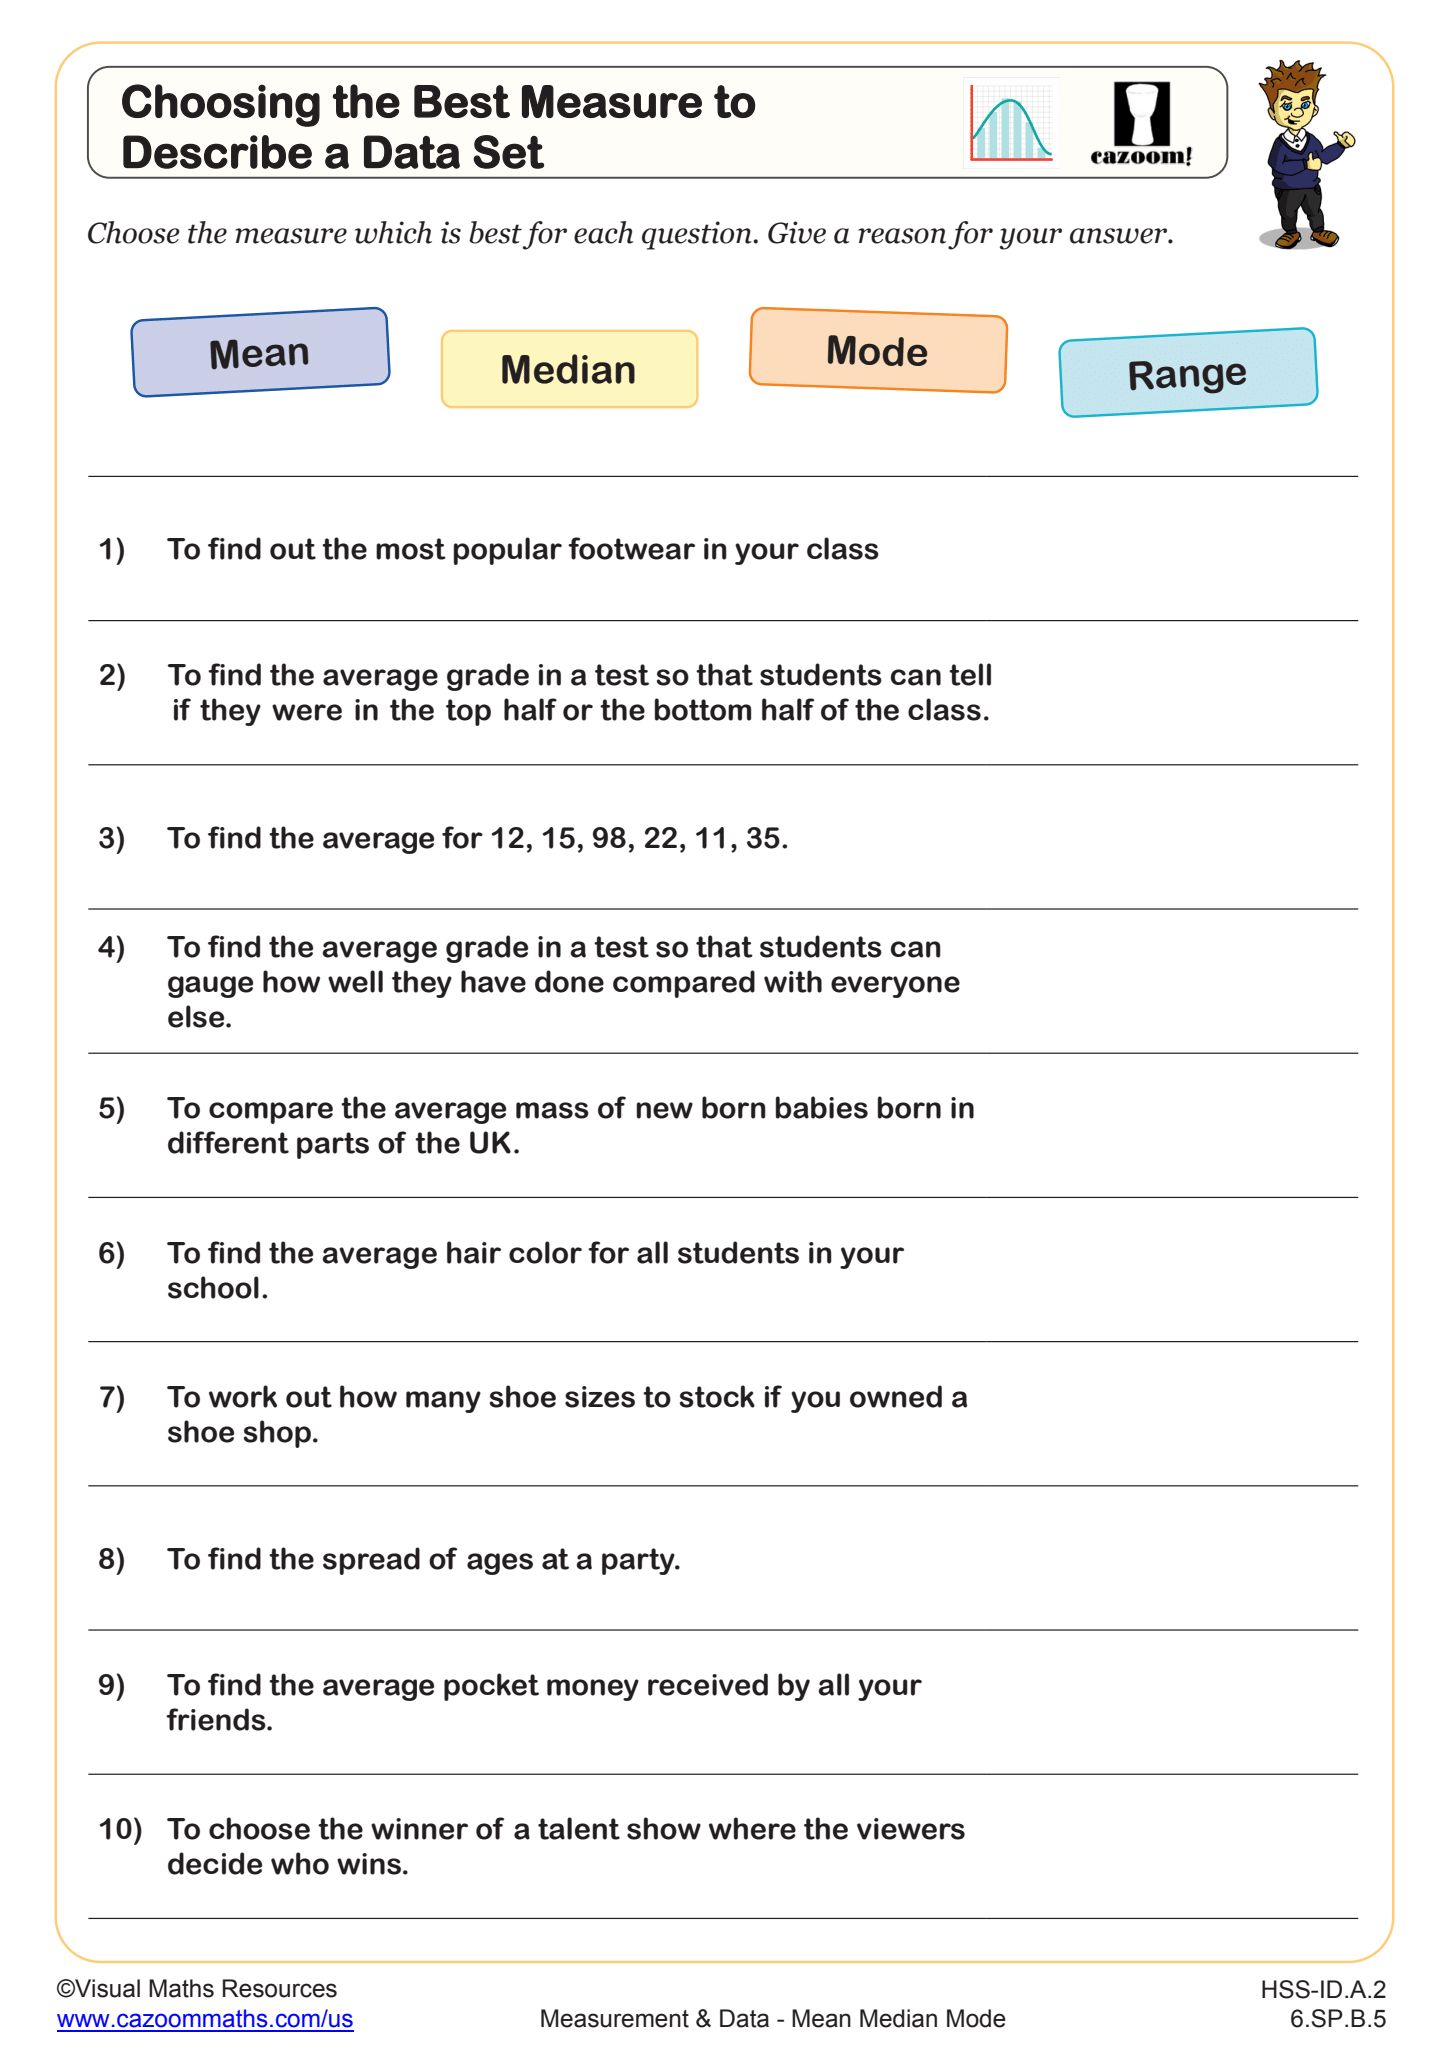
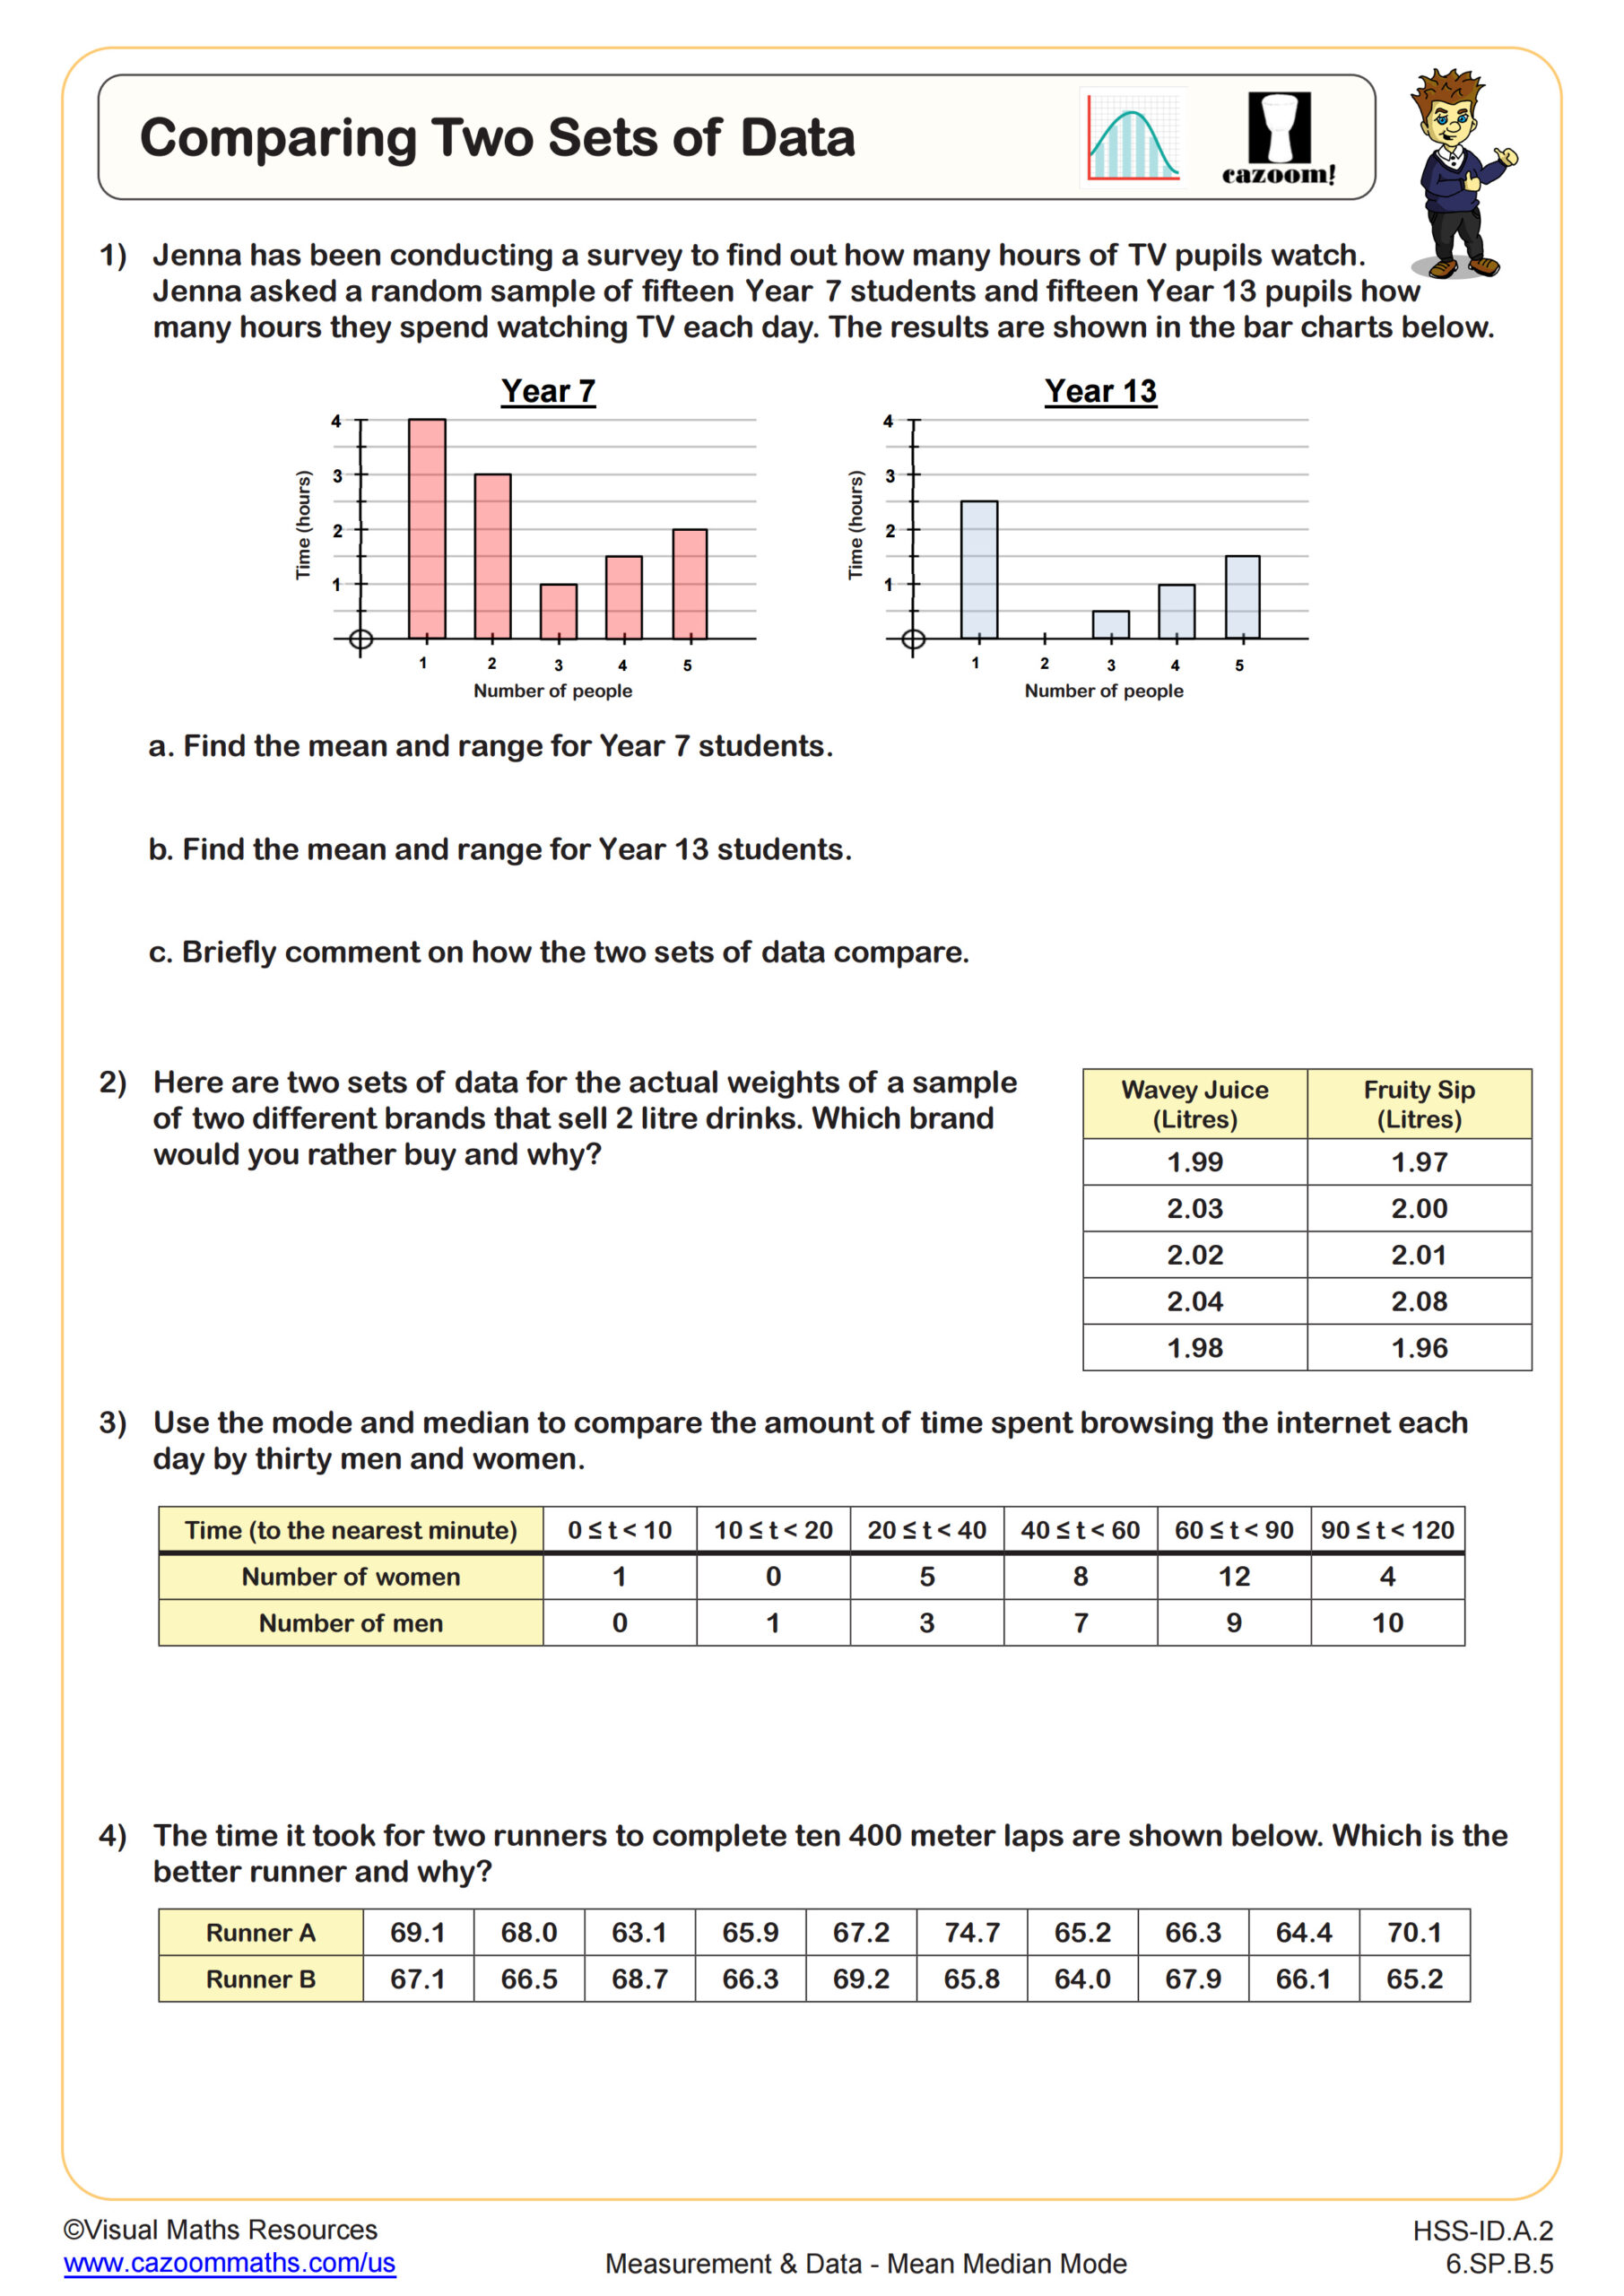
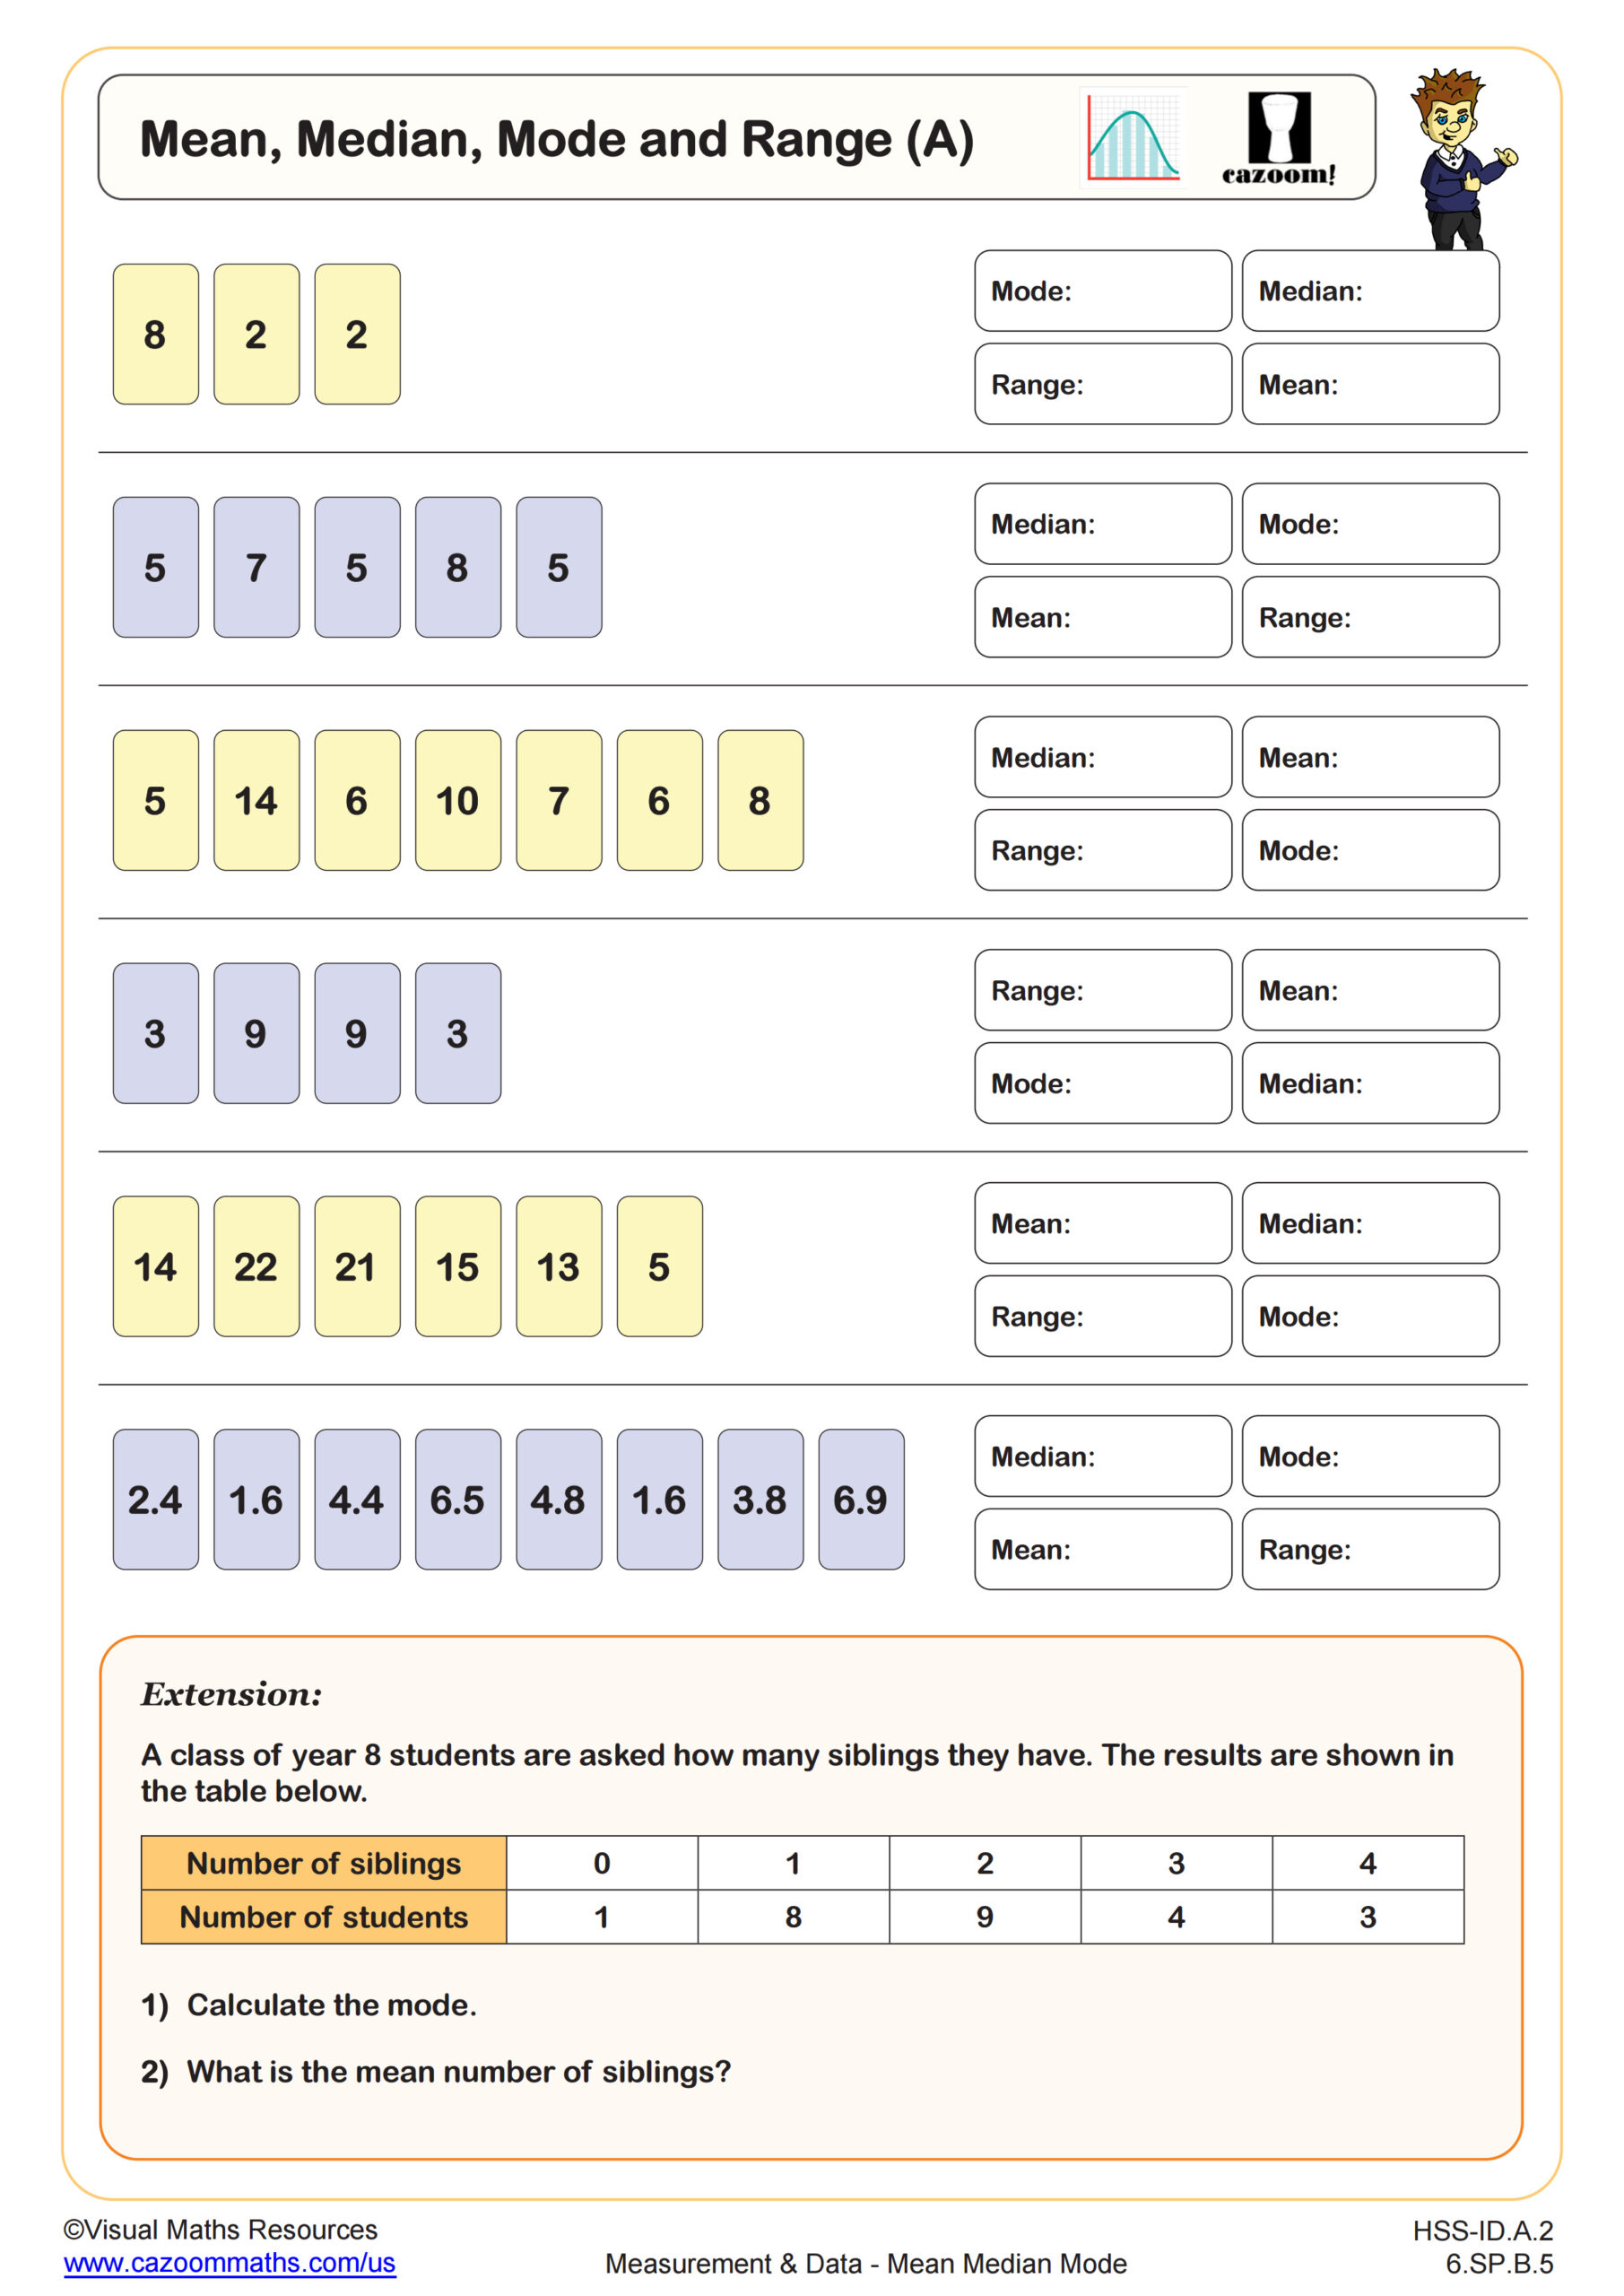
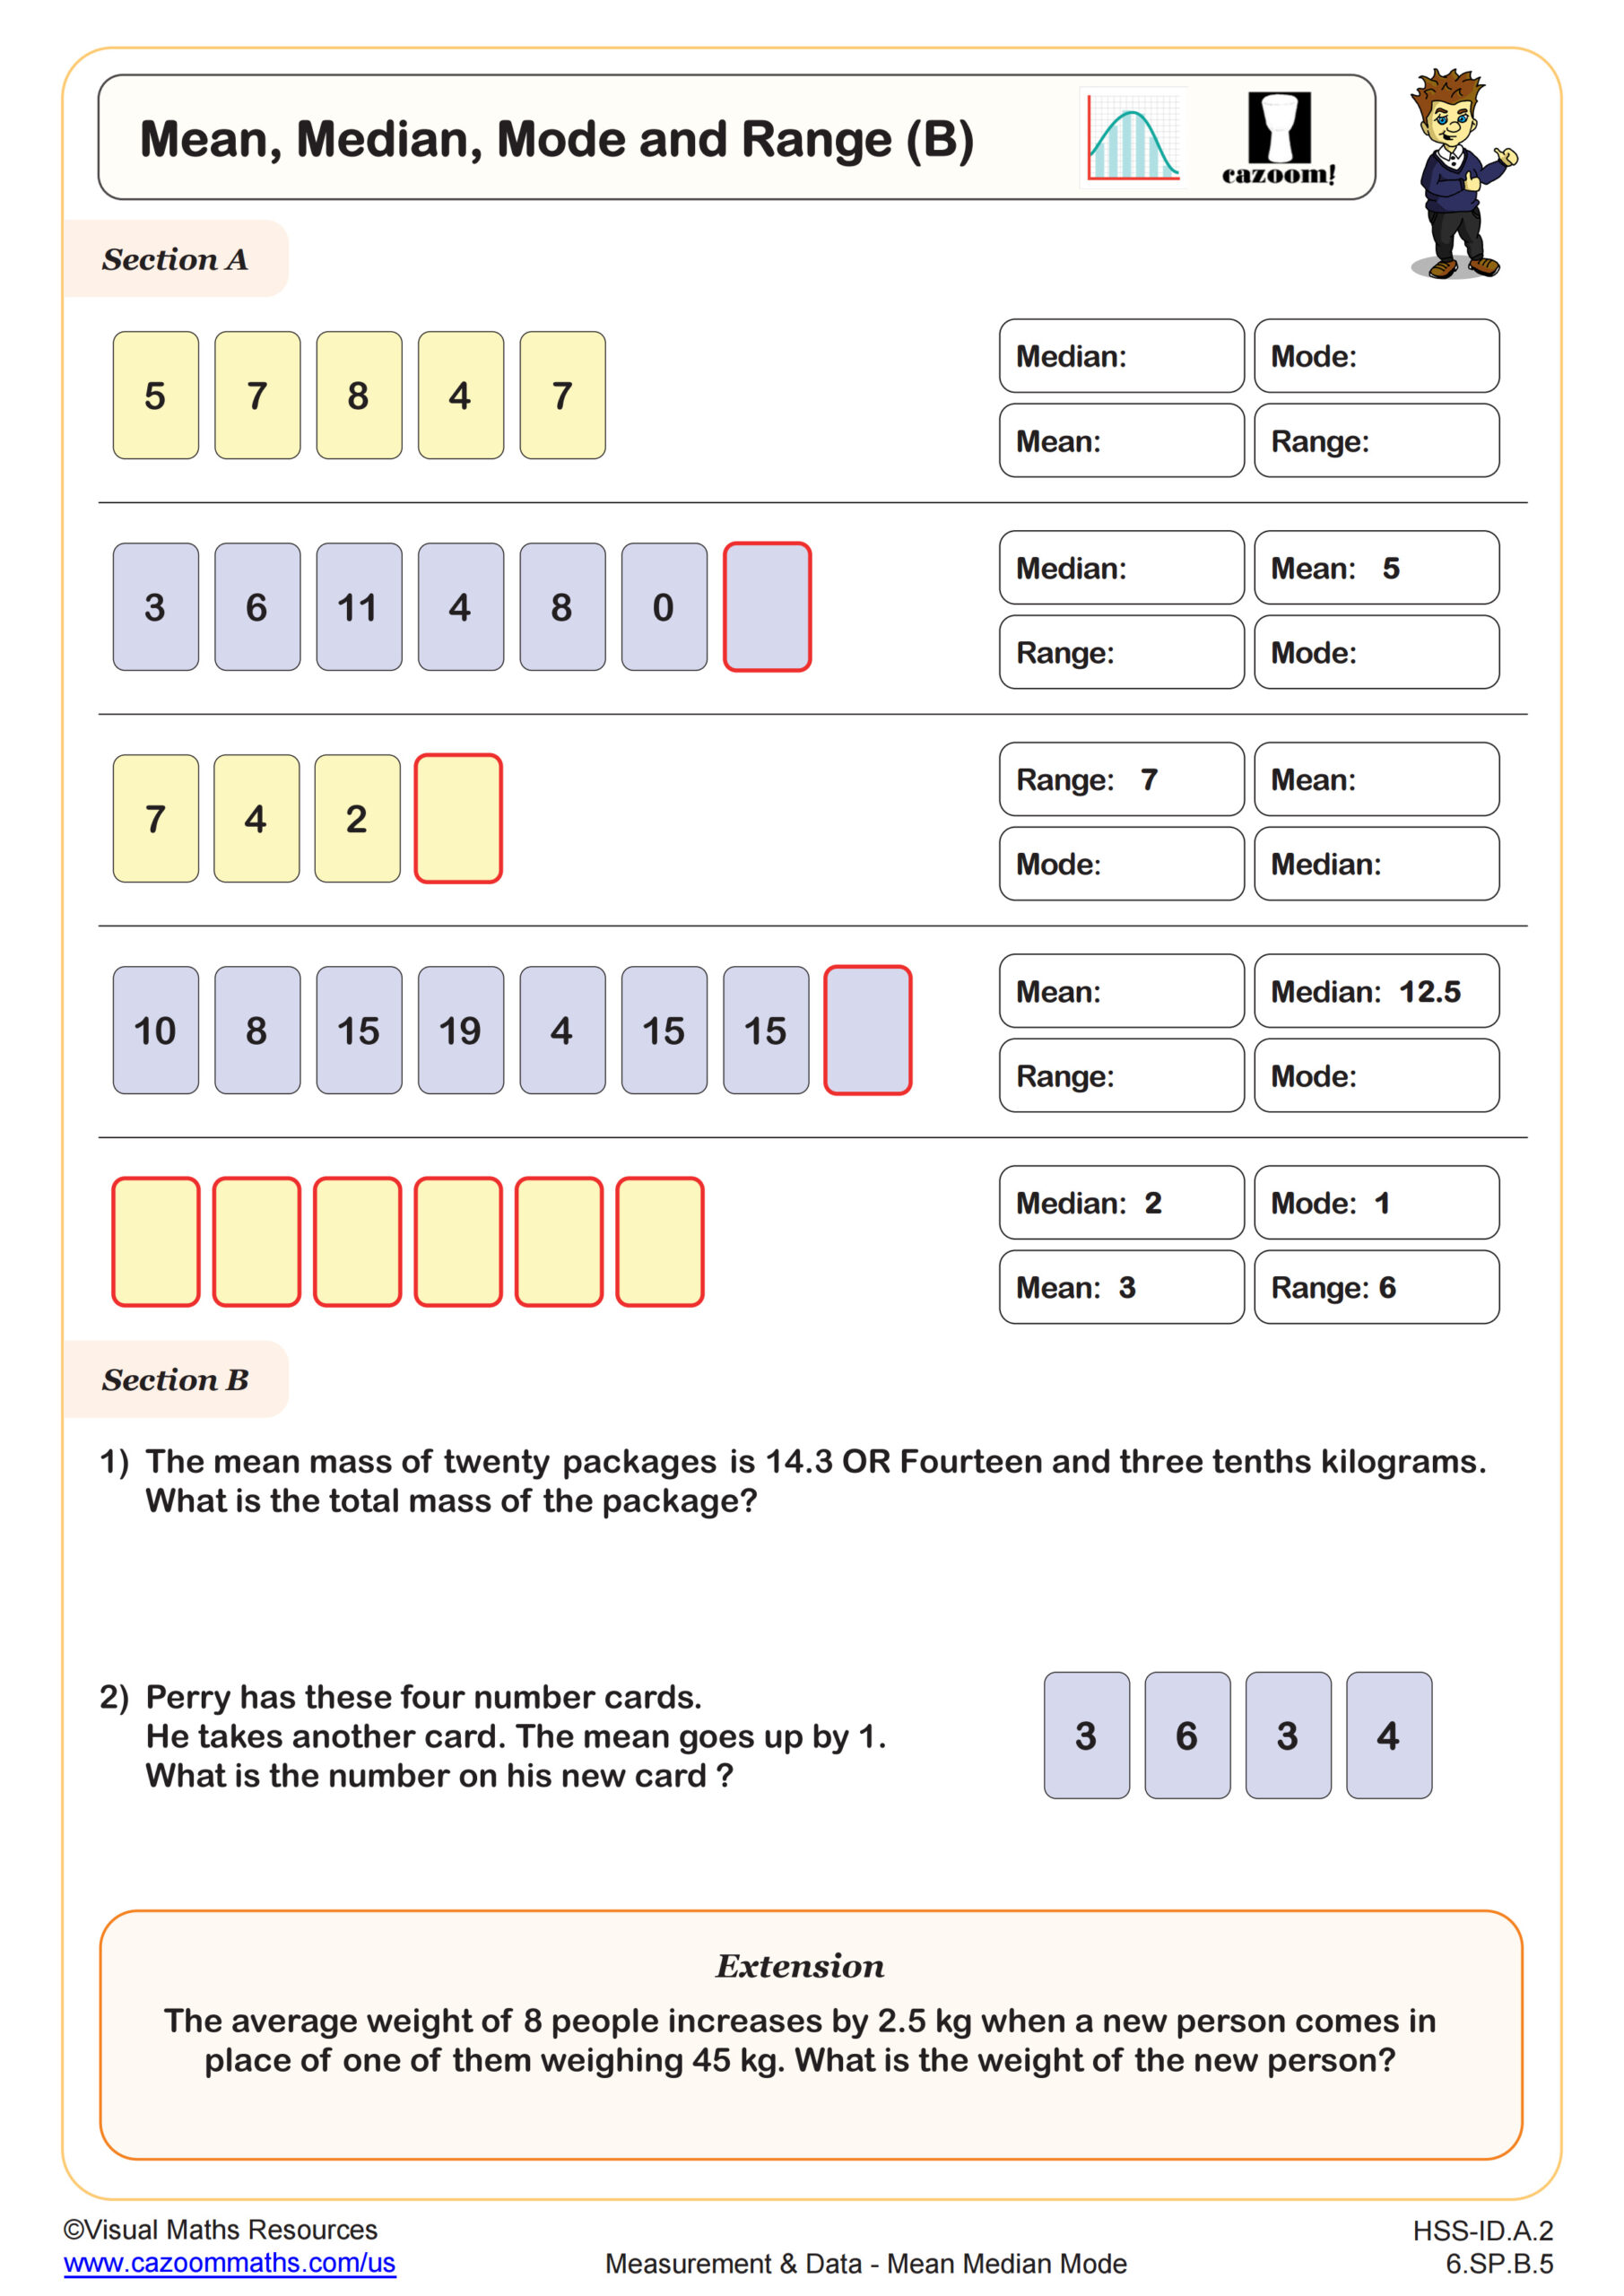
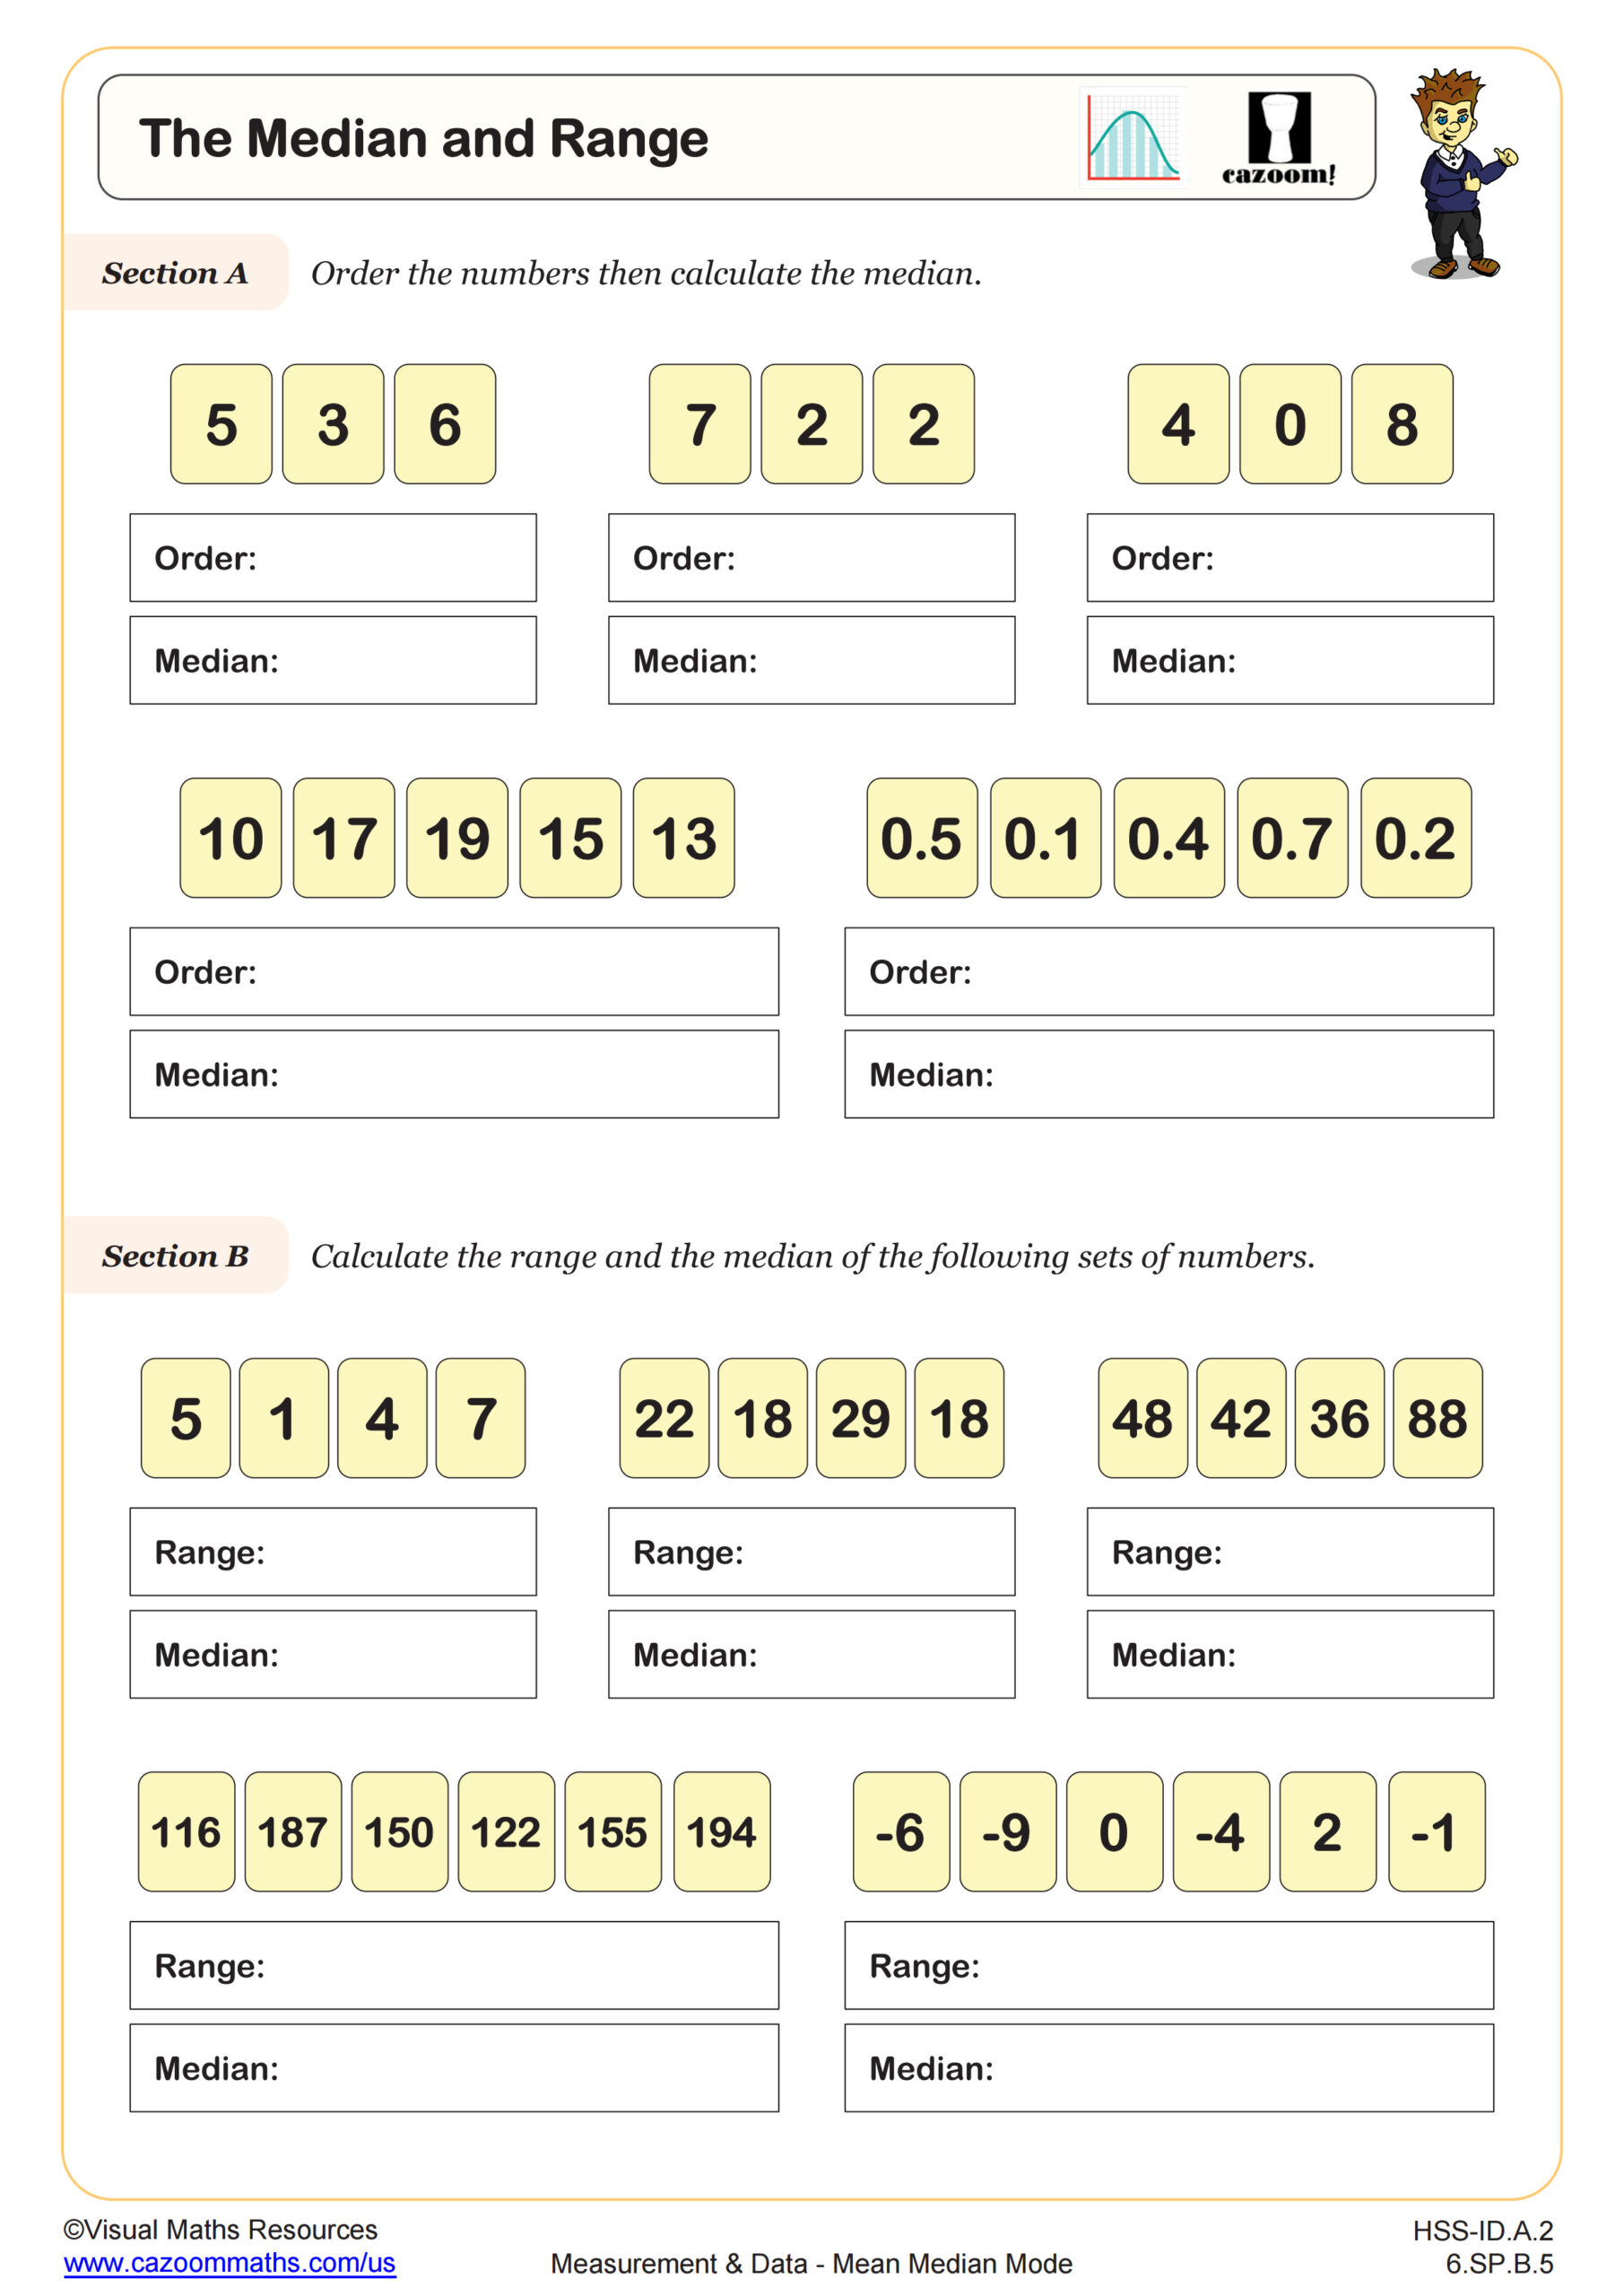
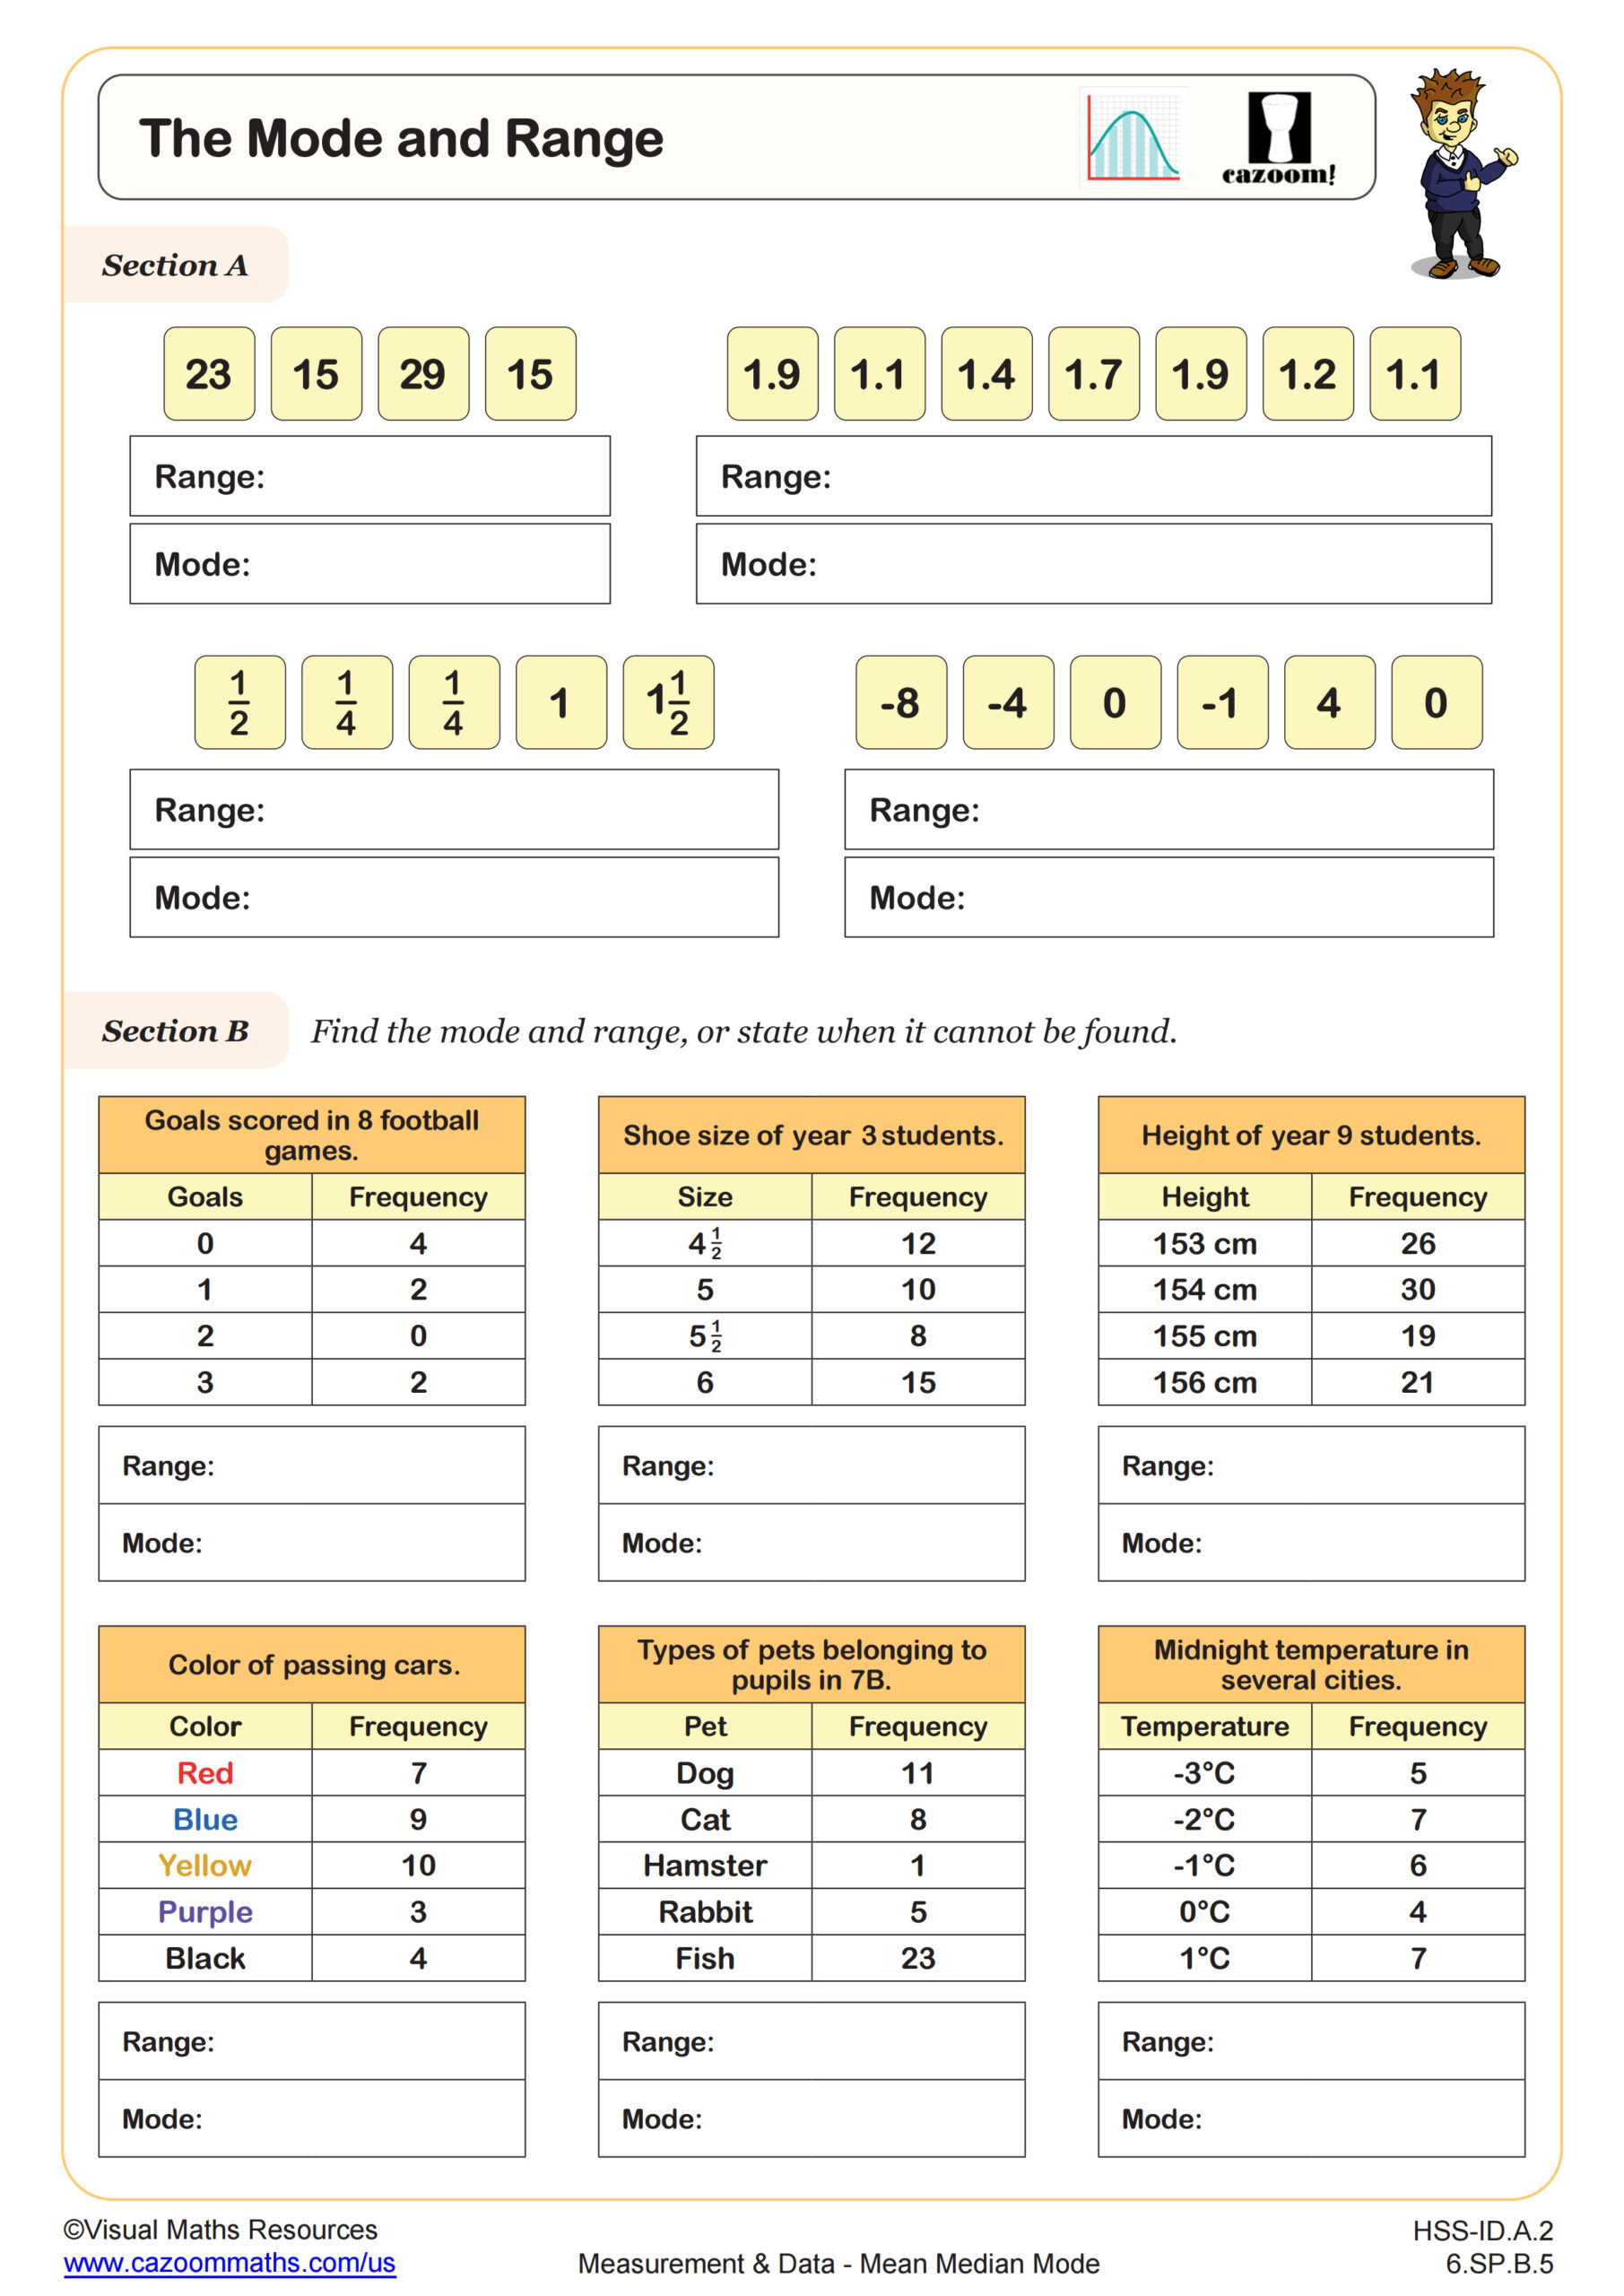
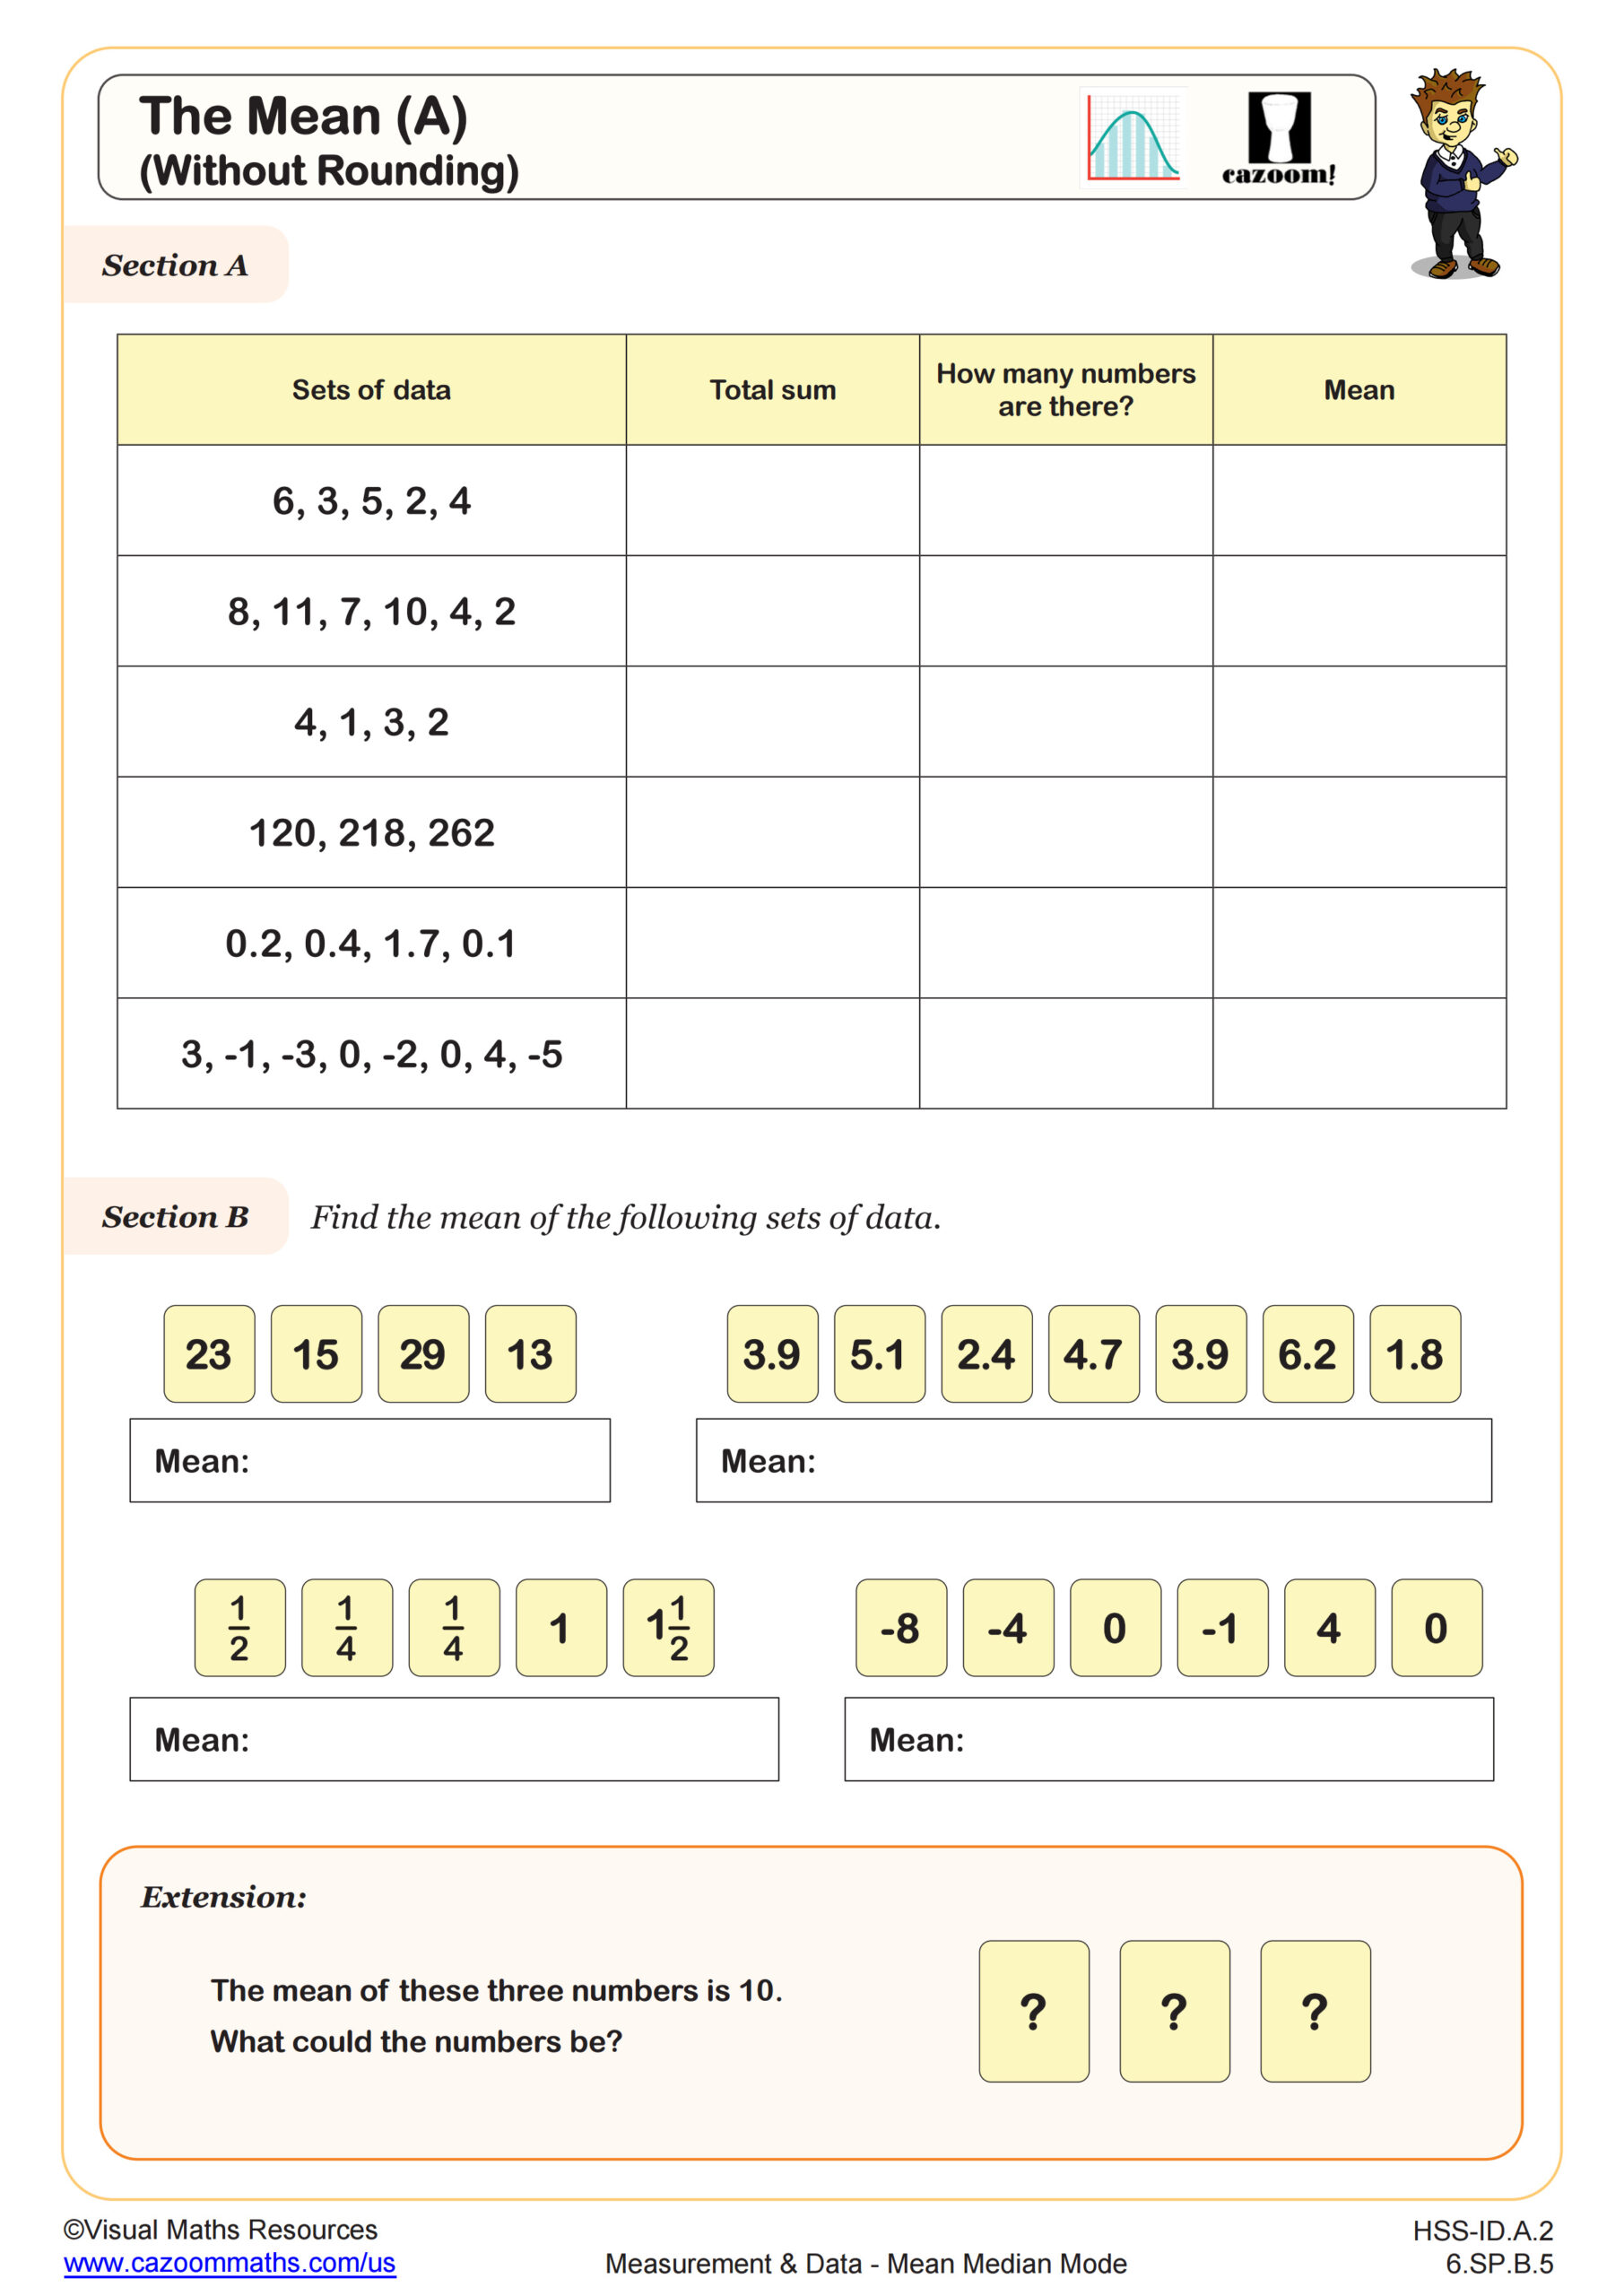
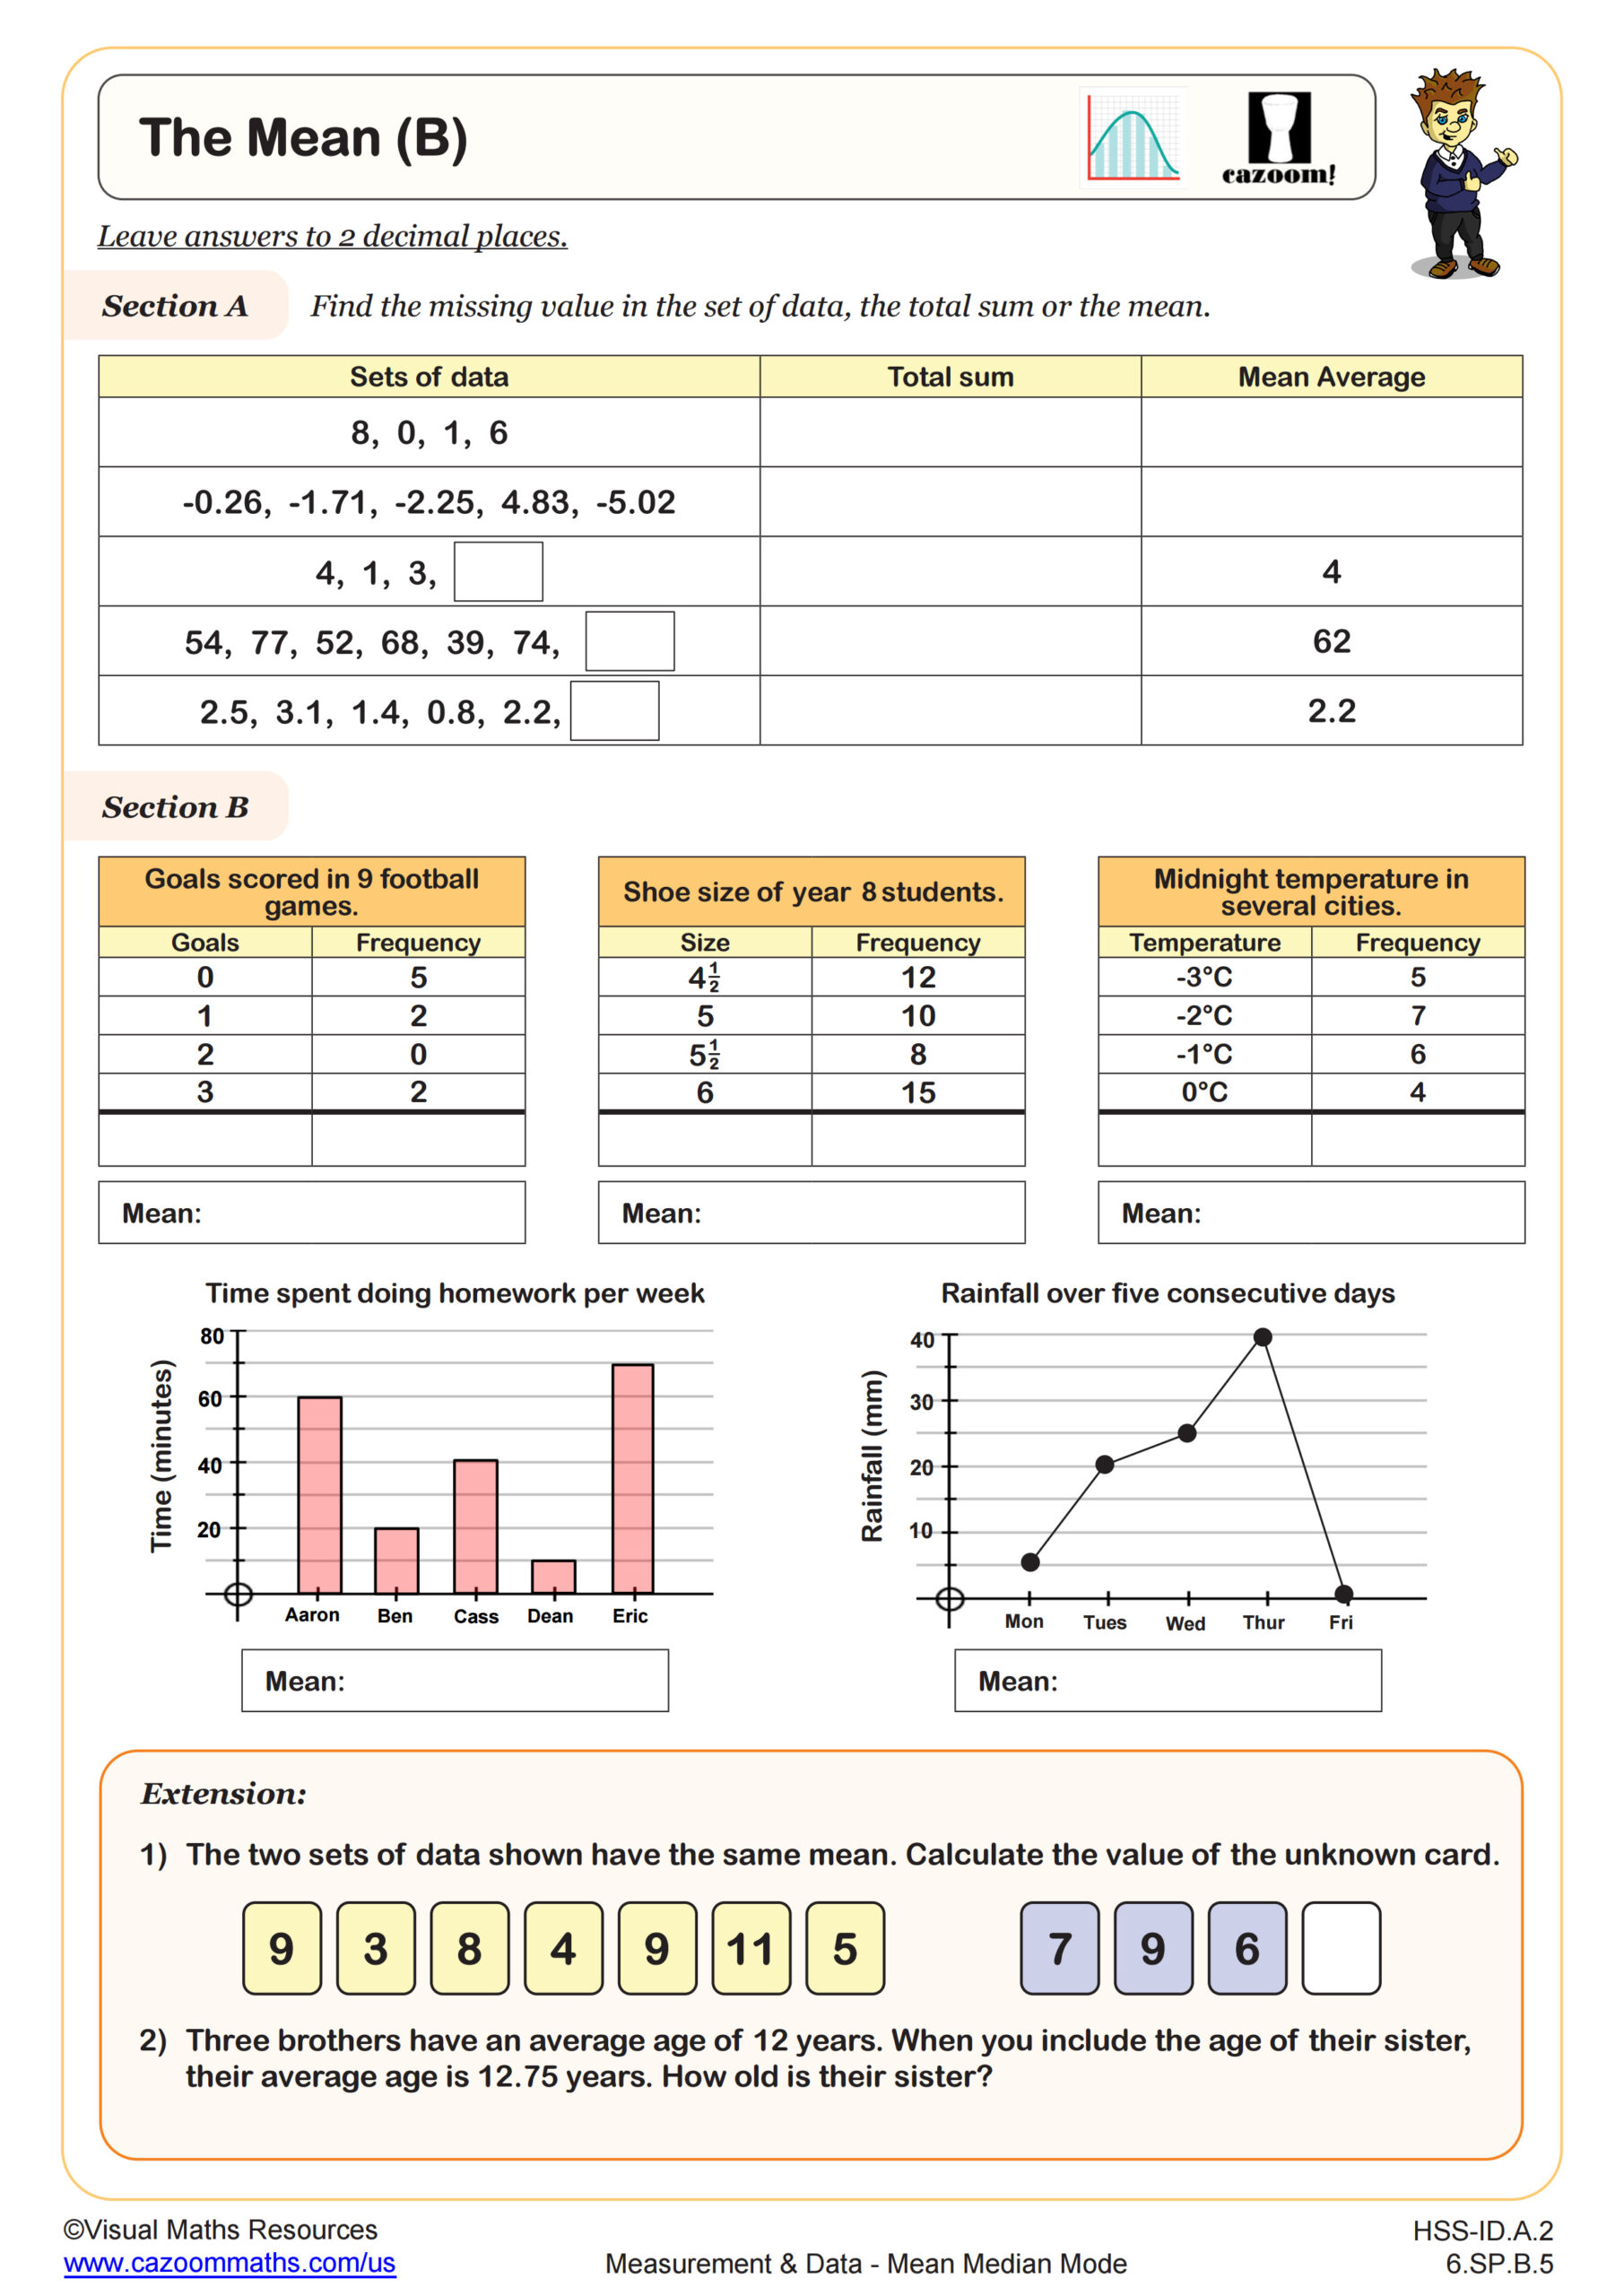
This comprehensive set develops students’ statistical and data-handling skills through progressive challenges. Learners calculate averages from frequency tables, compare data sets, and determine which measure best represents a distribution. Every worksheet includes complete, worked solutions. Covering mean, median, mode, range, and comparative analysis, this collection helps students interpret and summarize data effectively across a range of real-world contexts.
Why Teachers Choose Our Grade School Mean, Median, and Mode Activities
These worksheets save planning time because they encompass the full progression of averages in a single collection. Teachers can assign different sheets to different groups, making it simple to differentiate without creating new materials. Students who need support start with single-measure worksheets, while advanced learners move to comparison and decision-making tasks. The variety in problem types keeps practice sessions fresh and helps students see the same concept from multiple angles.
Solutions reveal the complete working process, which helps students identify exactly where they made mistakes. This approach reduces the need for lengthy re-teaching sessions. The sheets also work well for retrieval practice, where students revisit earlier skills to maintain fluency. Everything prints clearly, and the format stays consistent across the collection.
Shopping to Video Games: Where These Skills Show up in Real Life
Students apply averages whenever they need to summarize information or make comparisons in daily life. Calculating the mean enables students to determine average values for data such as test scores and travel times. The median represents the middle value and helps avoid distortion from extreme values in the data set. The Mode function displays the most popular choice, enabling tracking of user preferences and the selection frequency of specific options.
• Comparing average prices when shopping
• Calculating batting averages in sports
• Analyzing survey results for common responses
• Evaluating game scores over time