Middle School Mean Median Mode Worksheets
All worksheets are created by the team of experienced teachers at Cazoom Math.
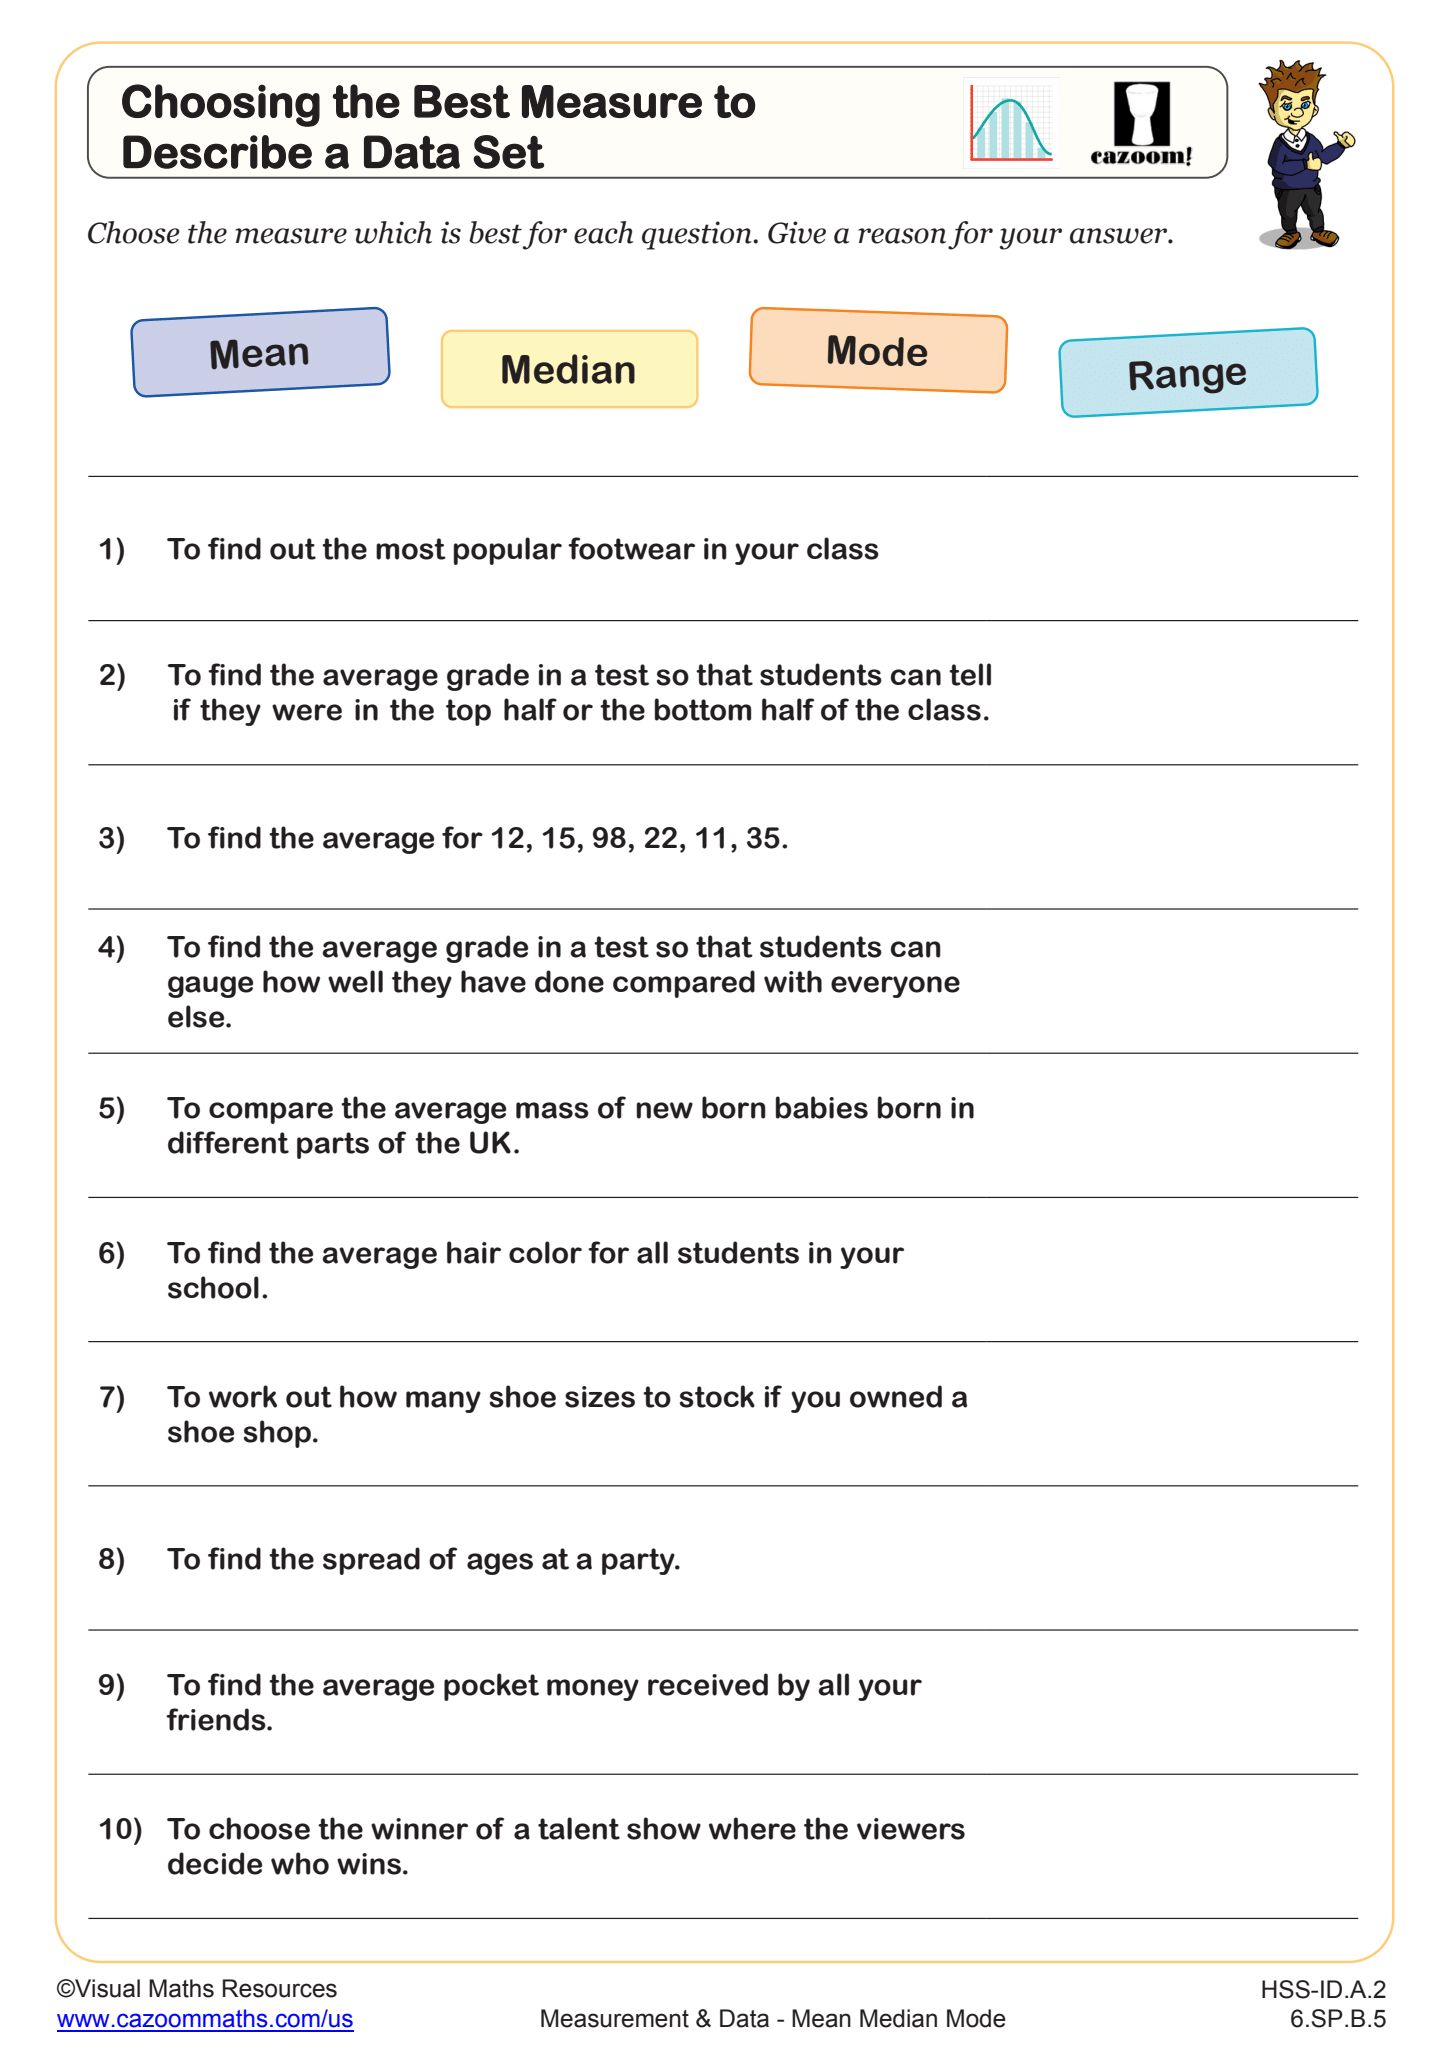
What's the Difference Between Mean, Median, and Mode?
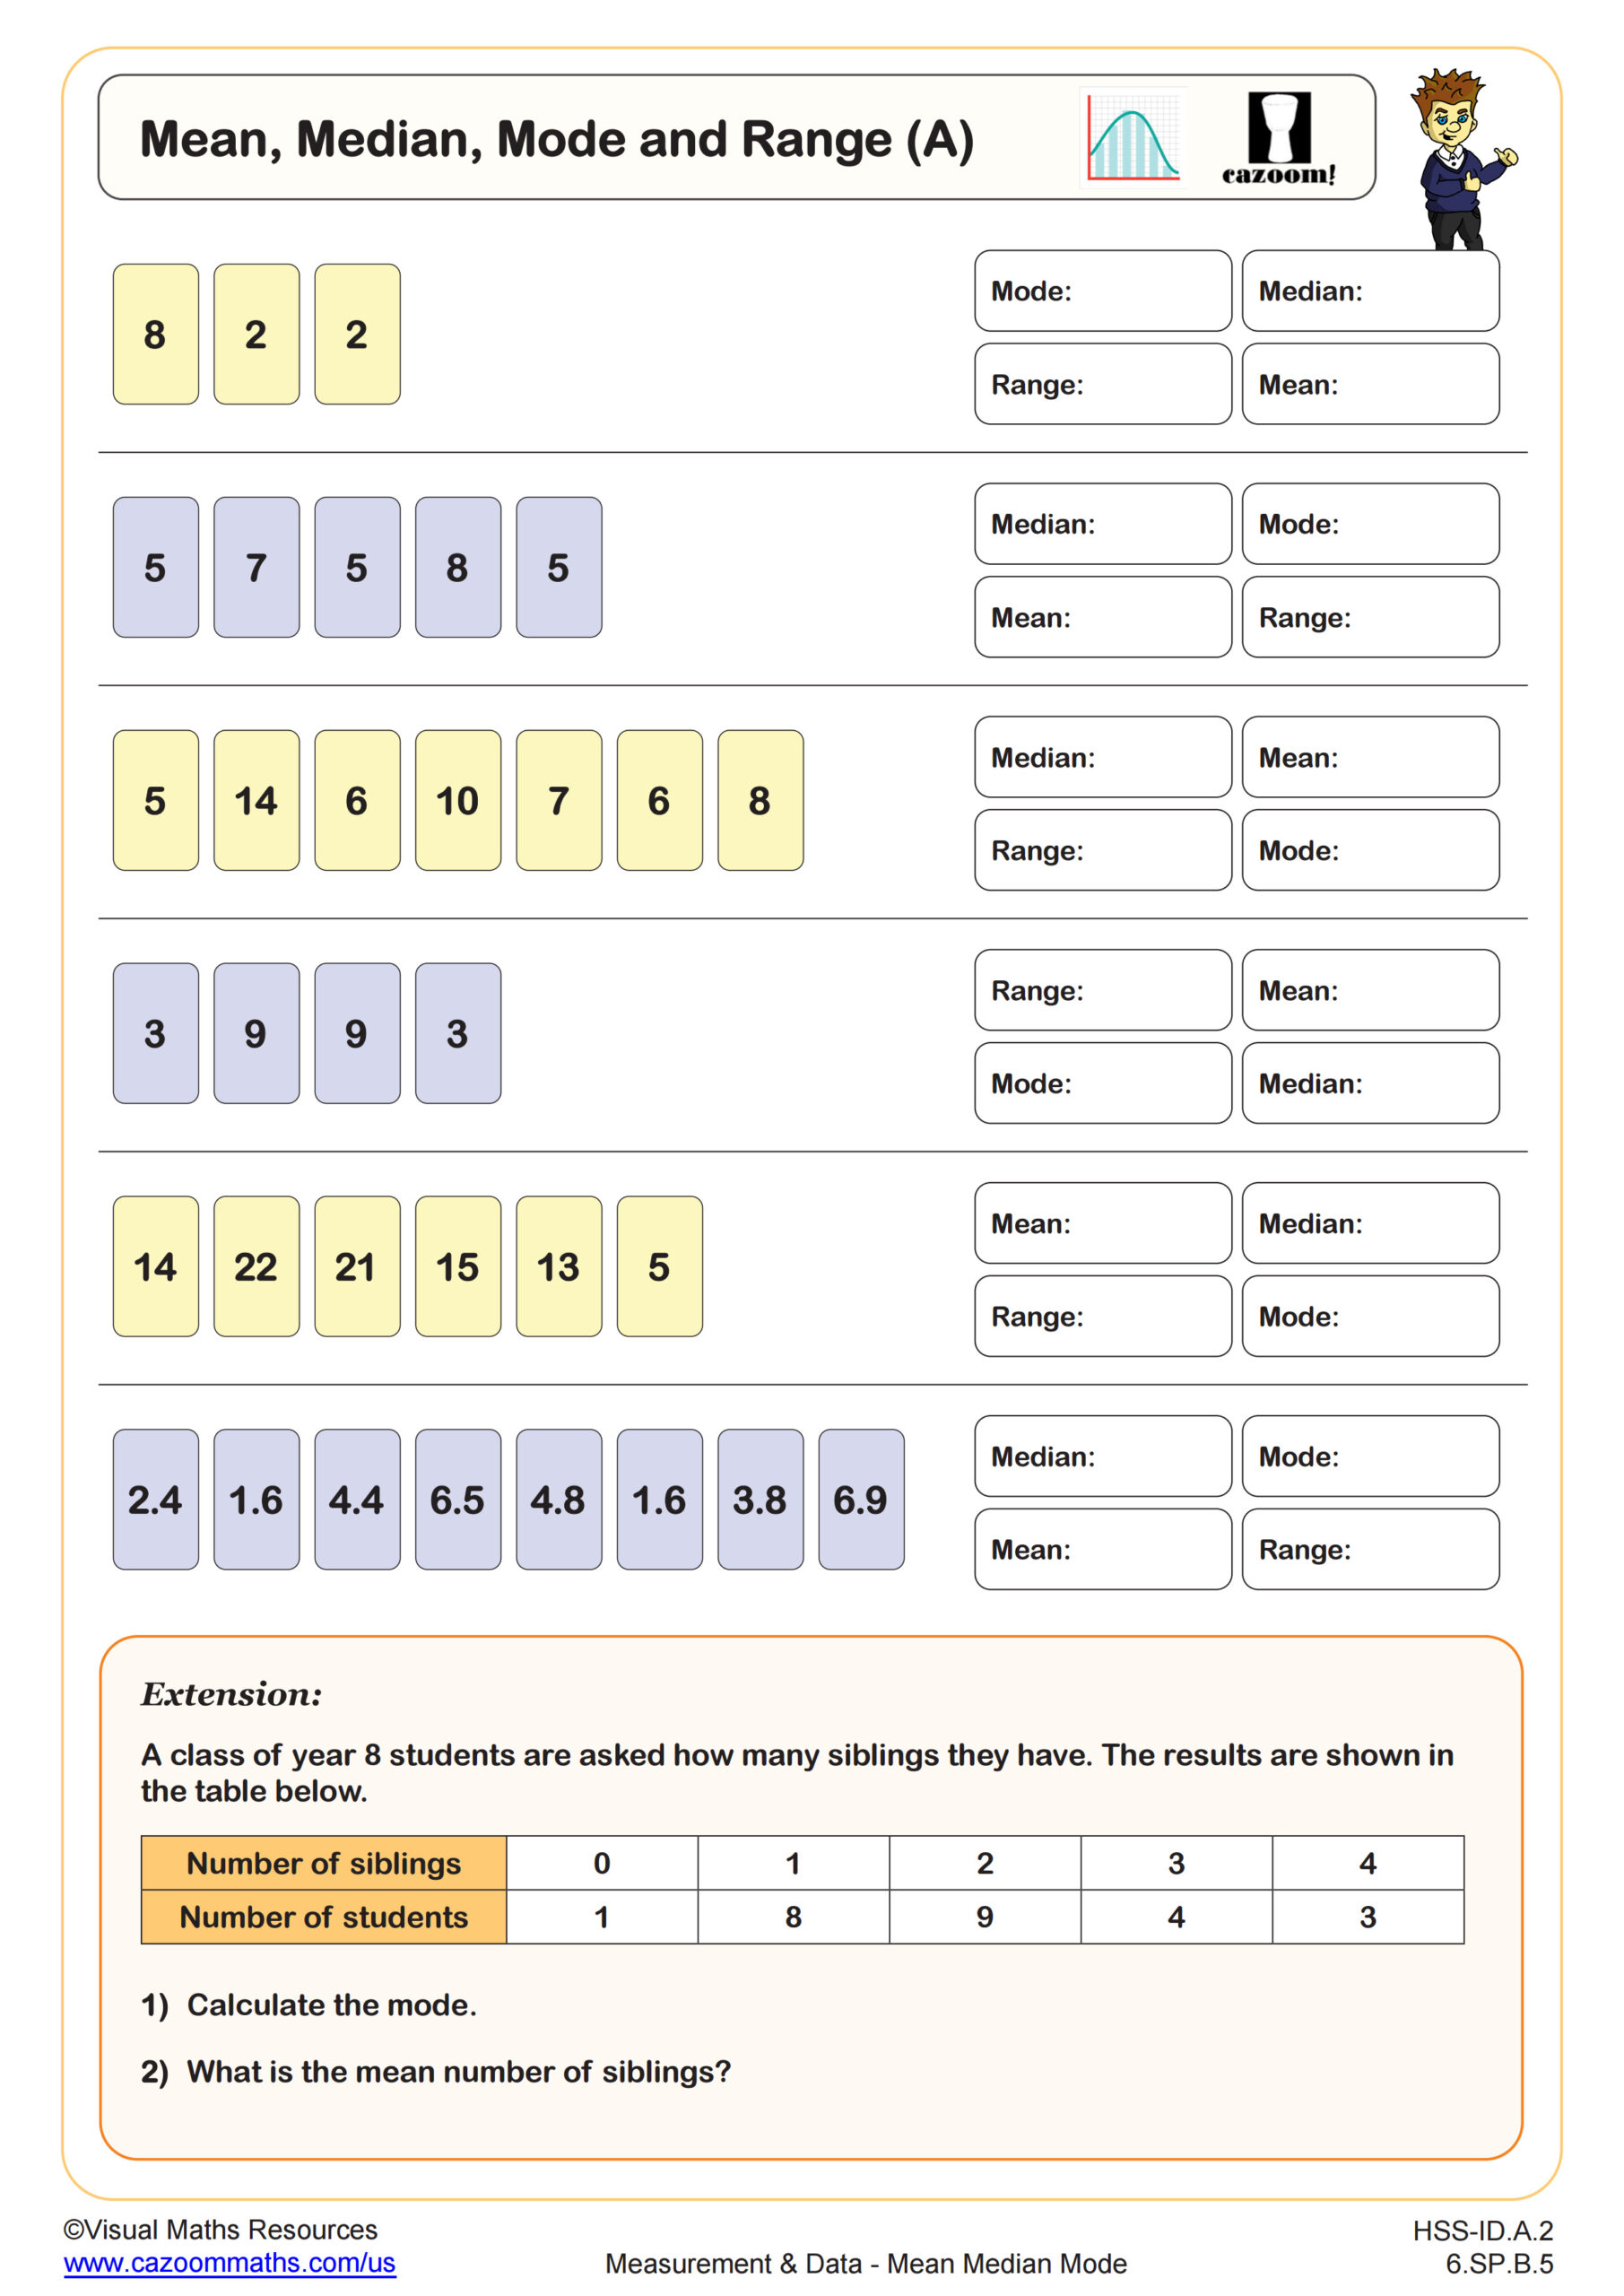
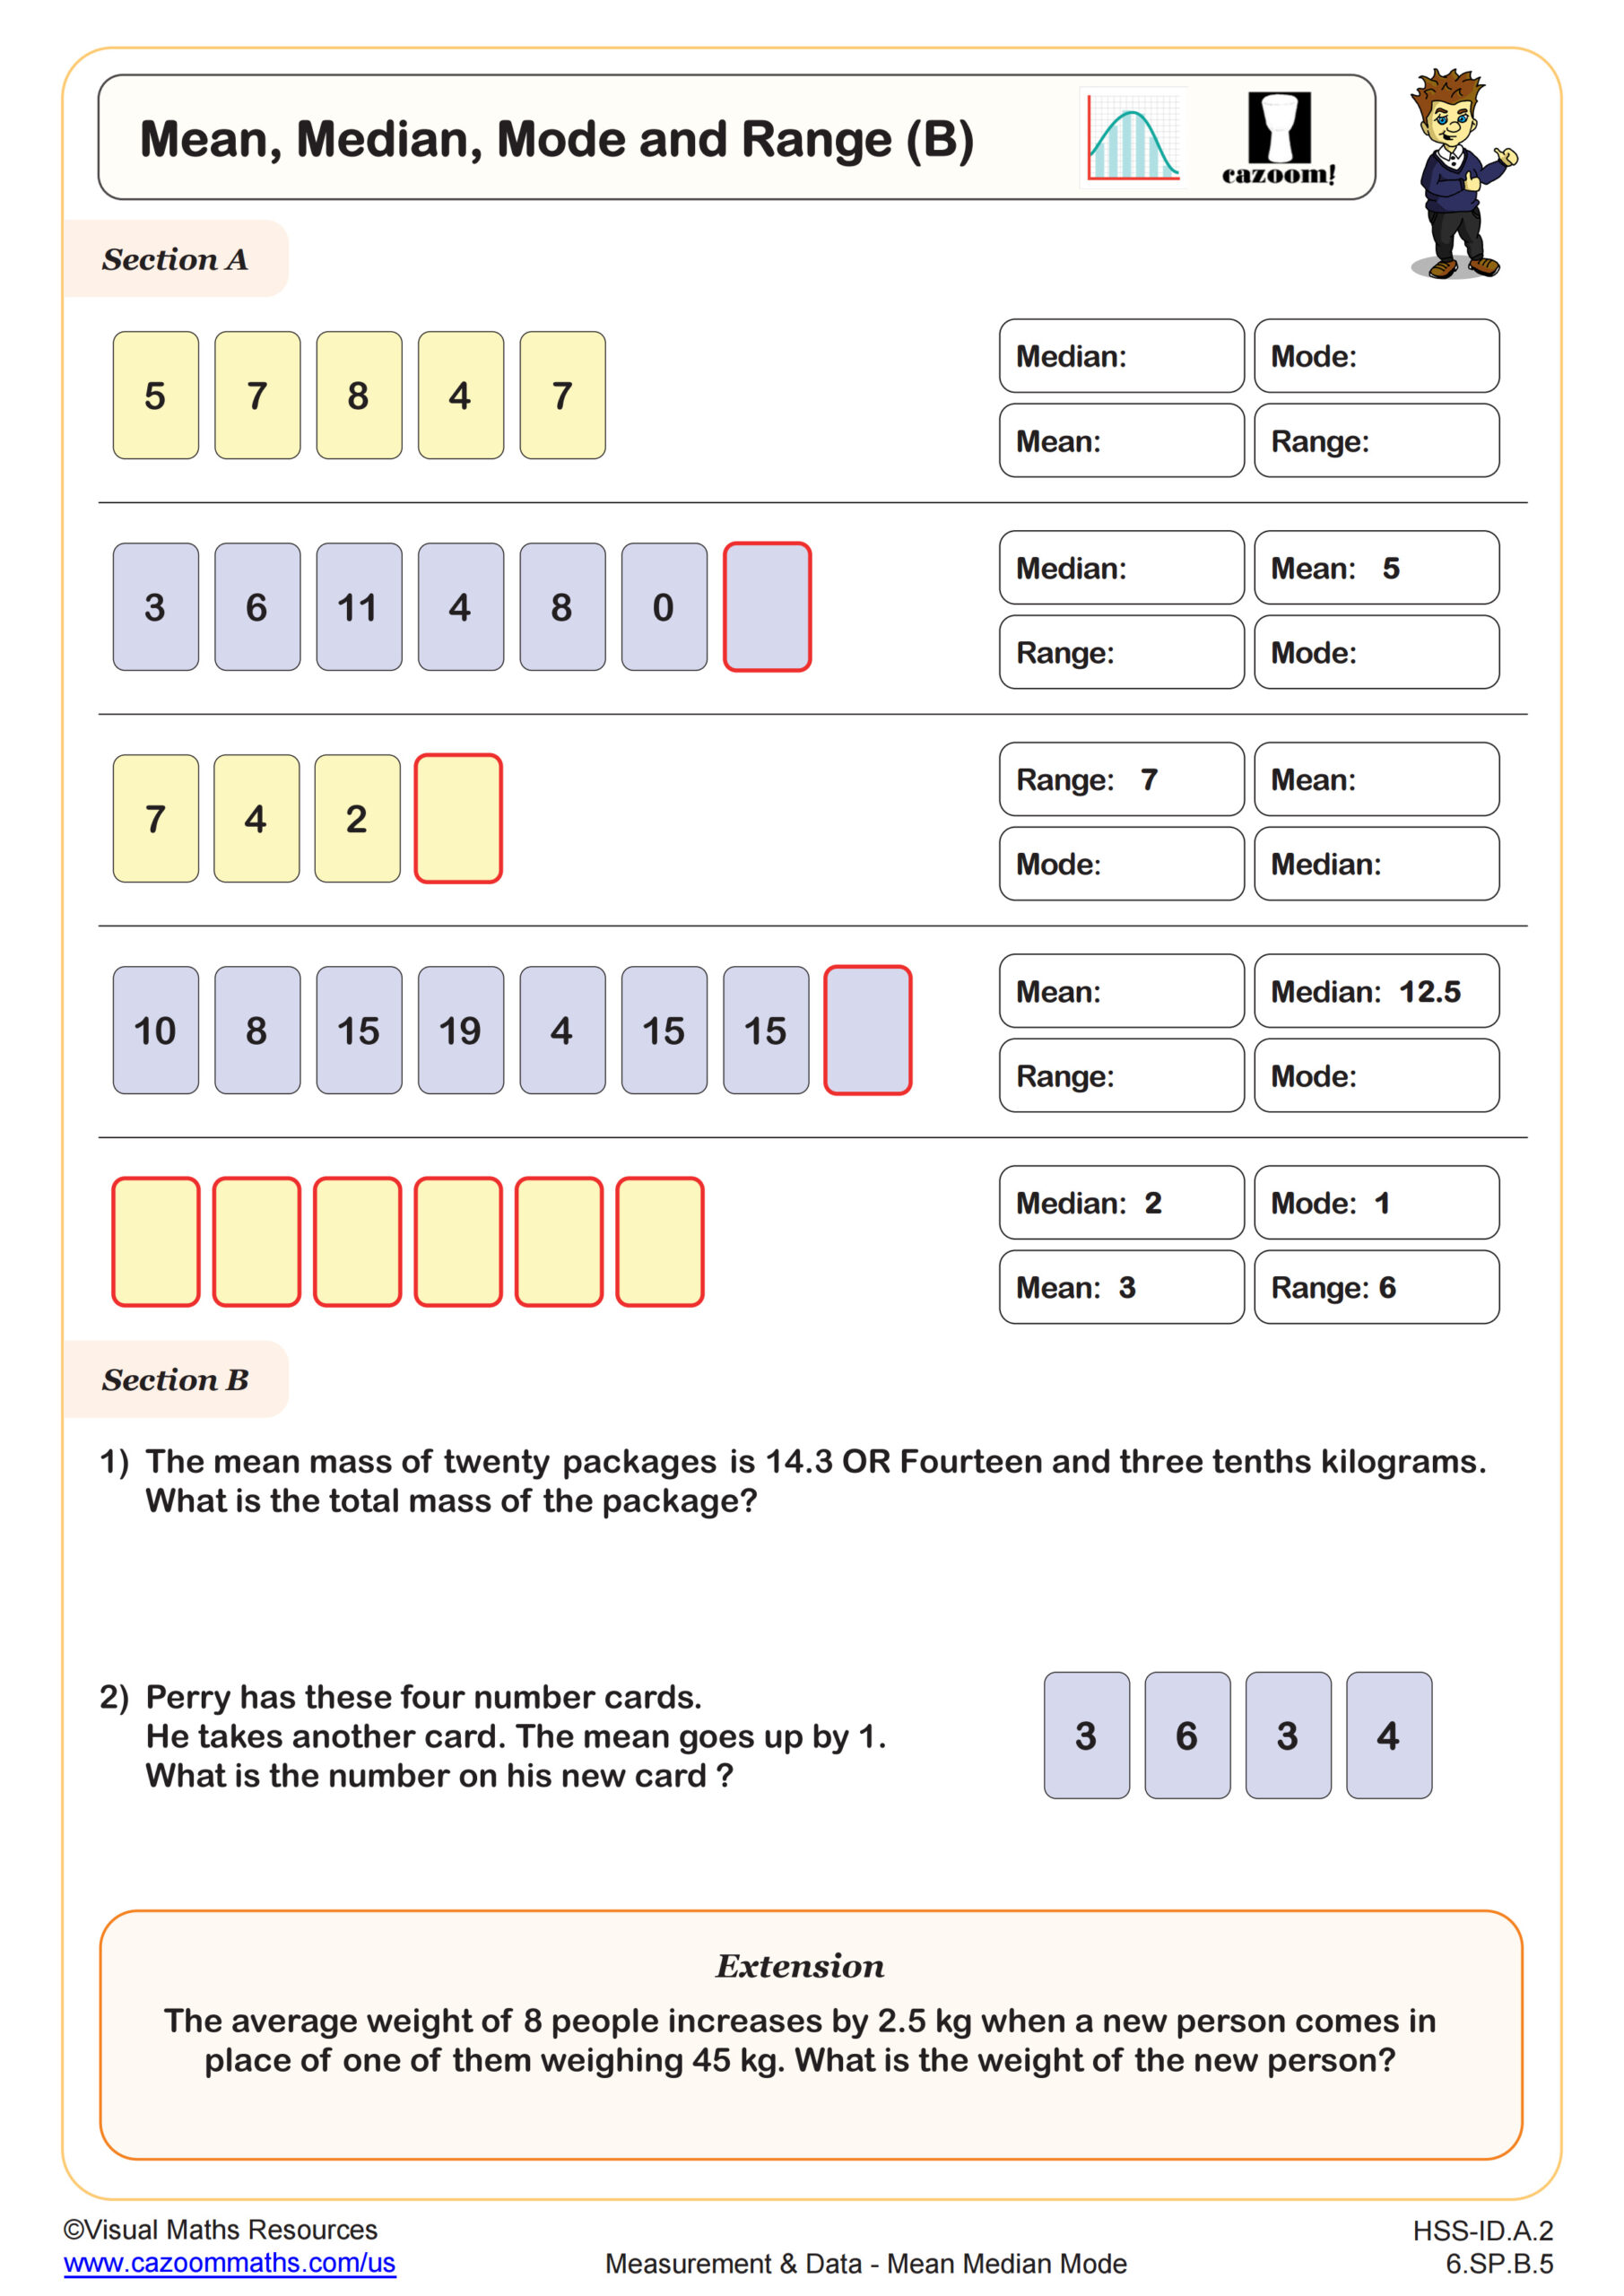
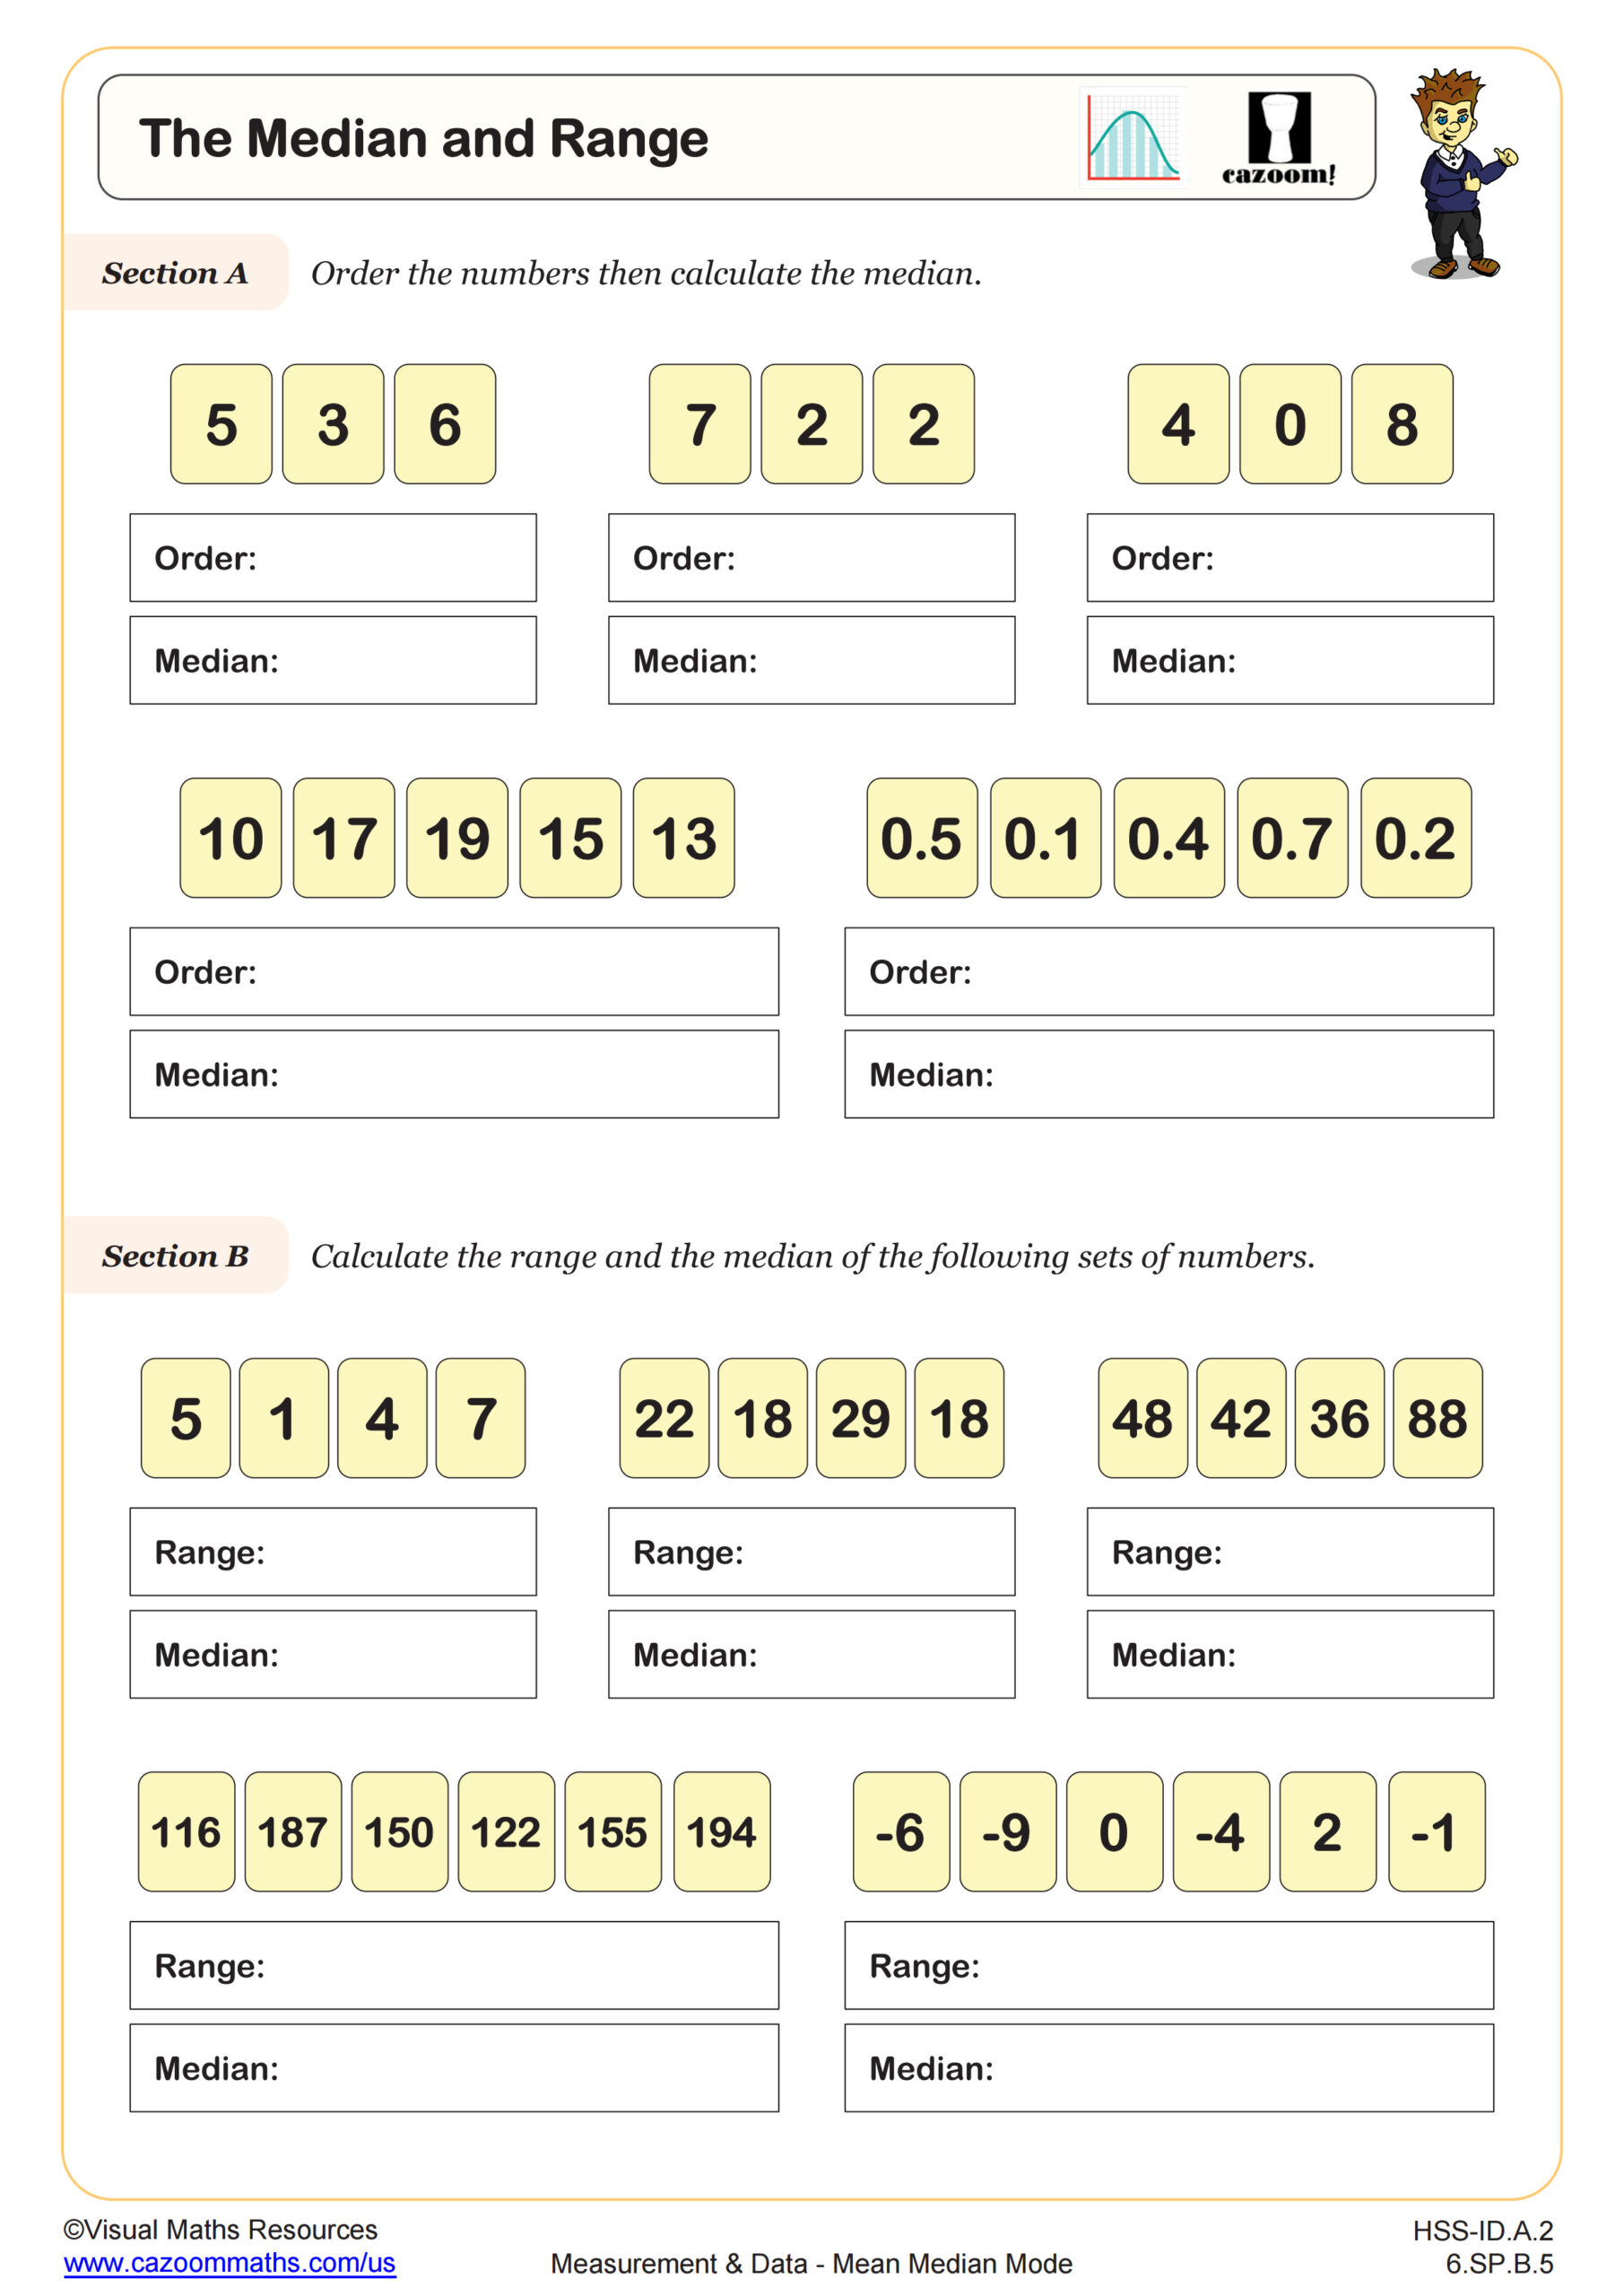
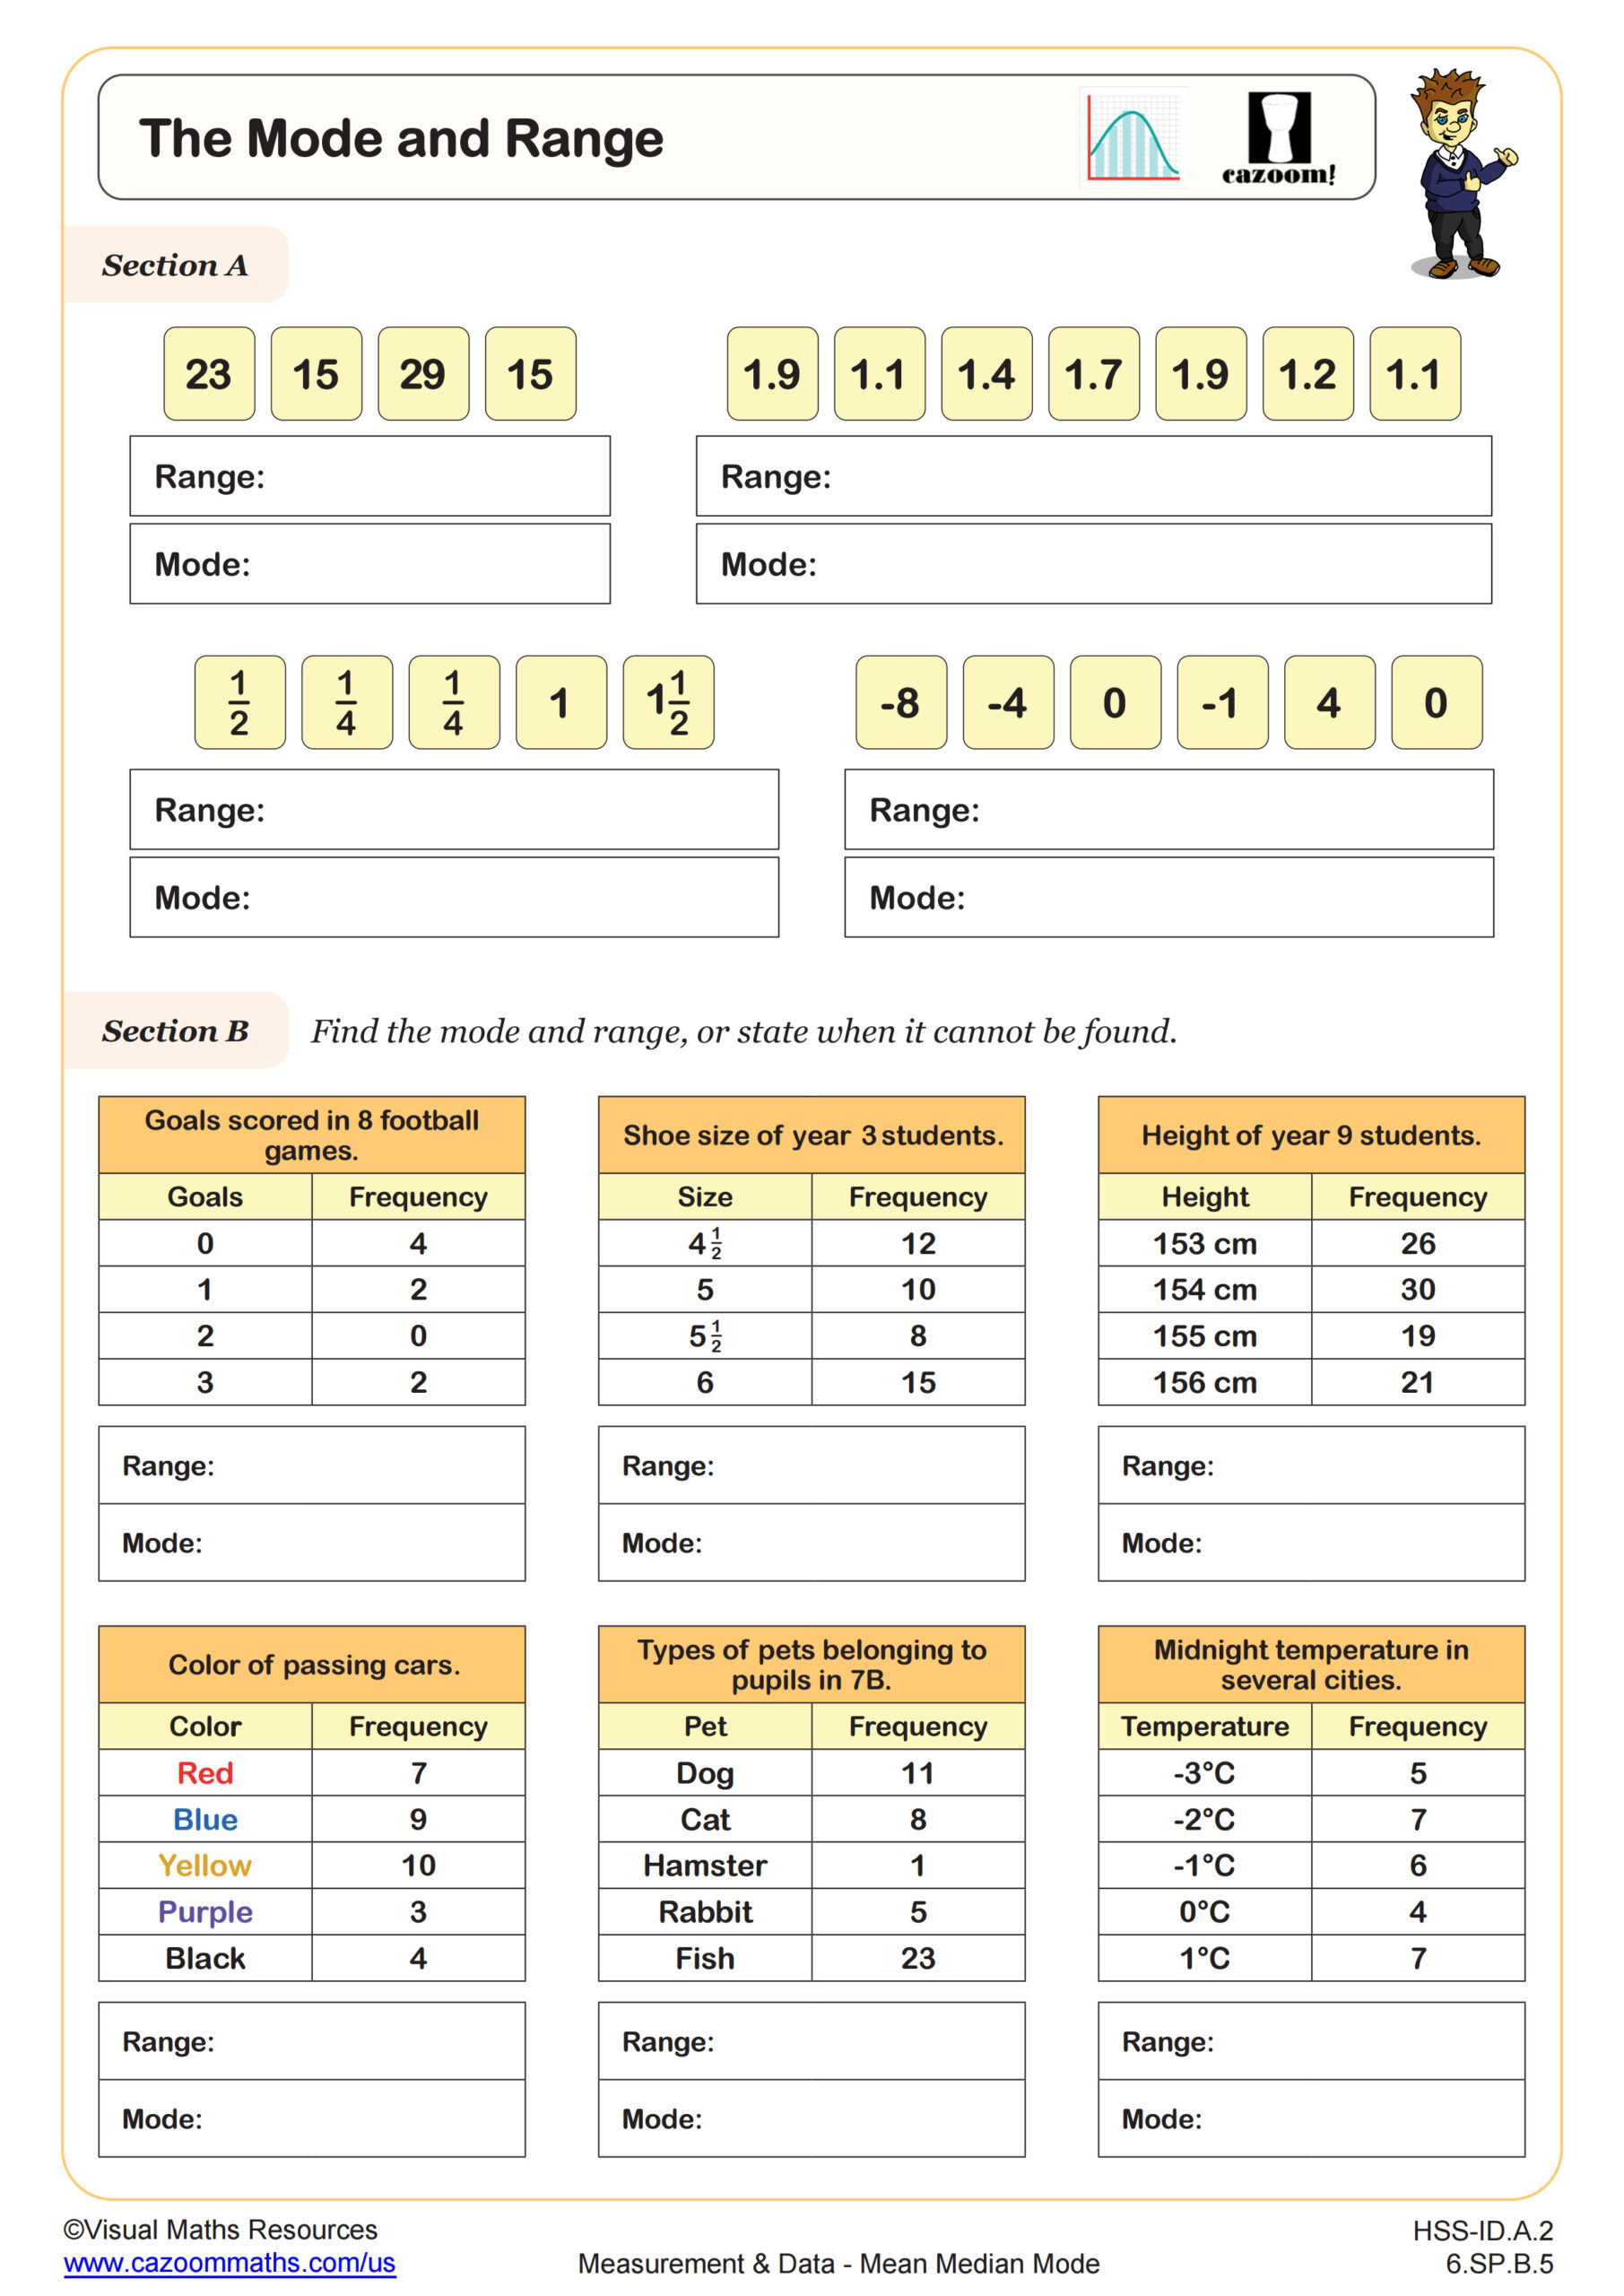
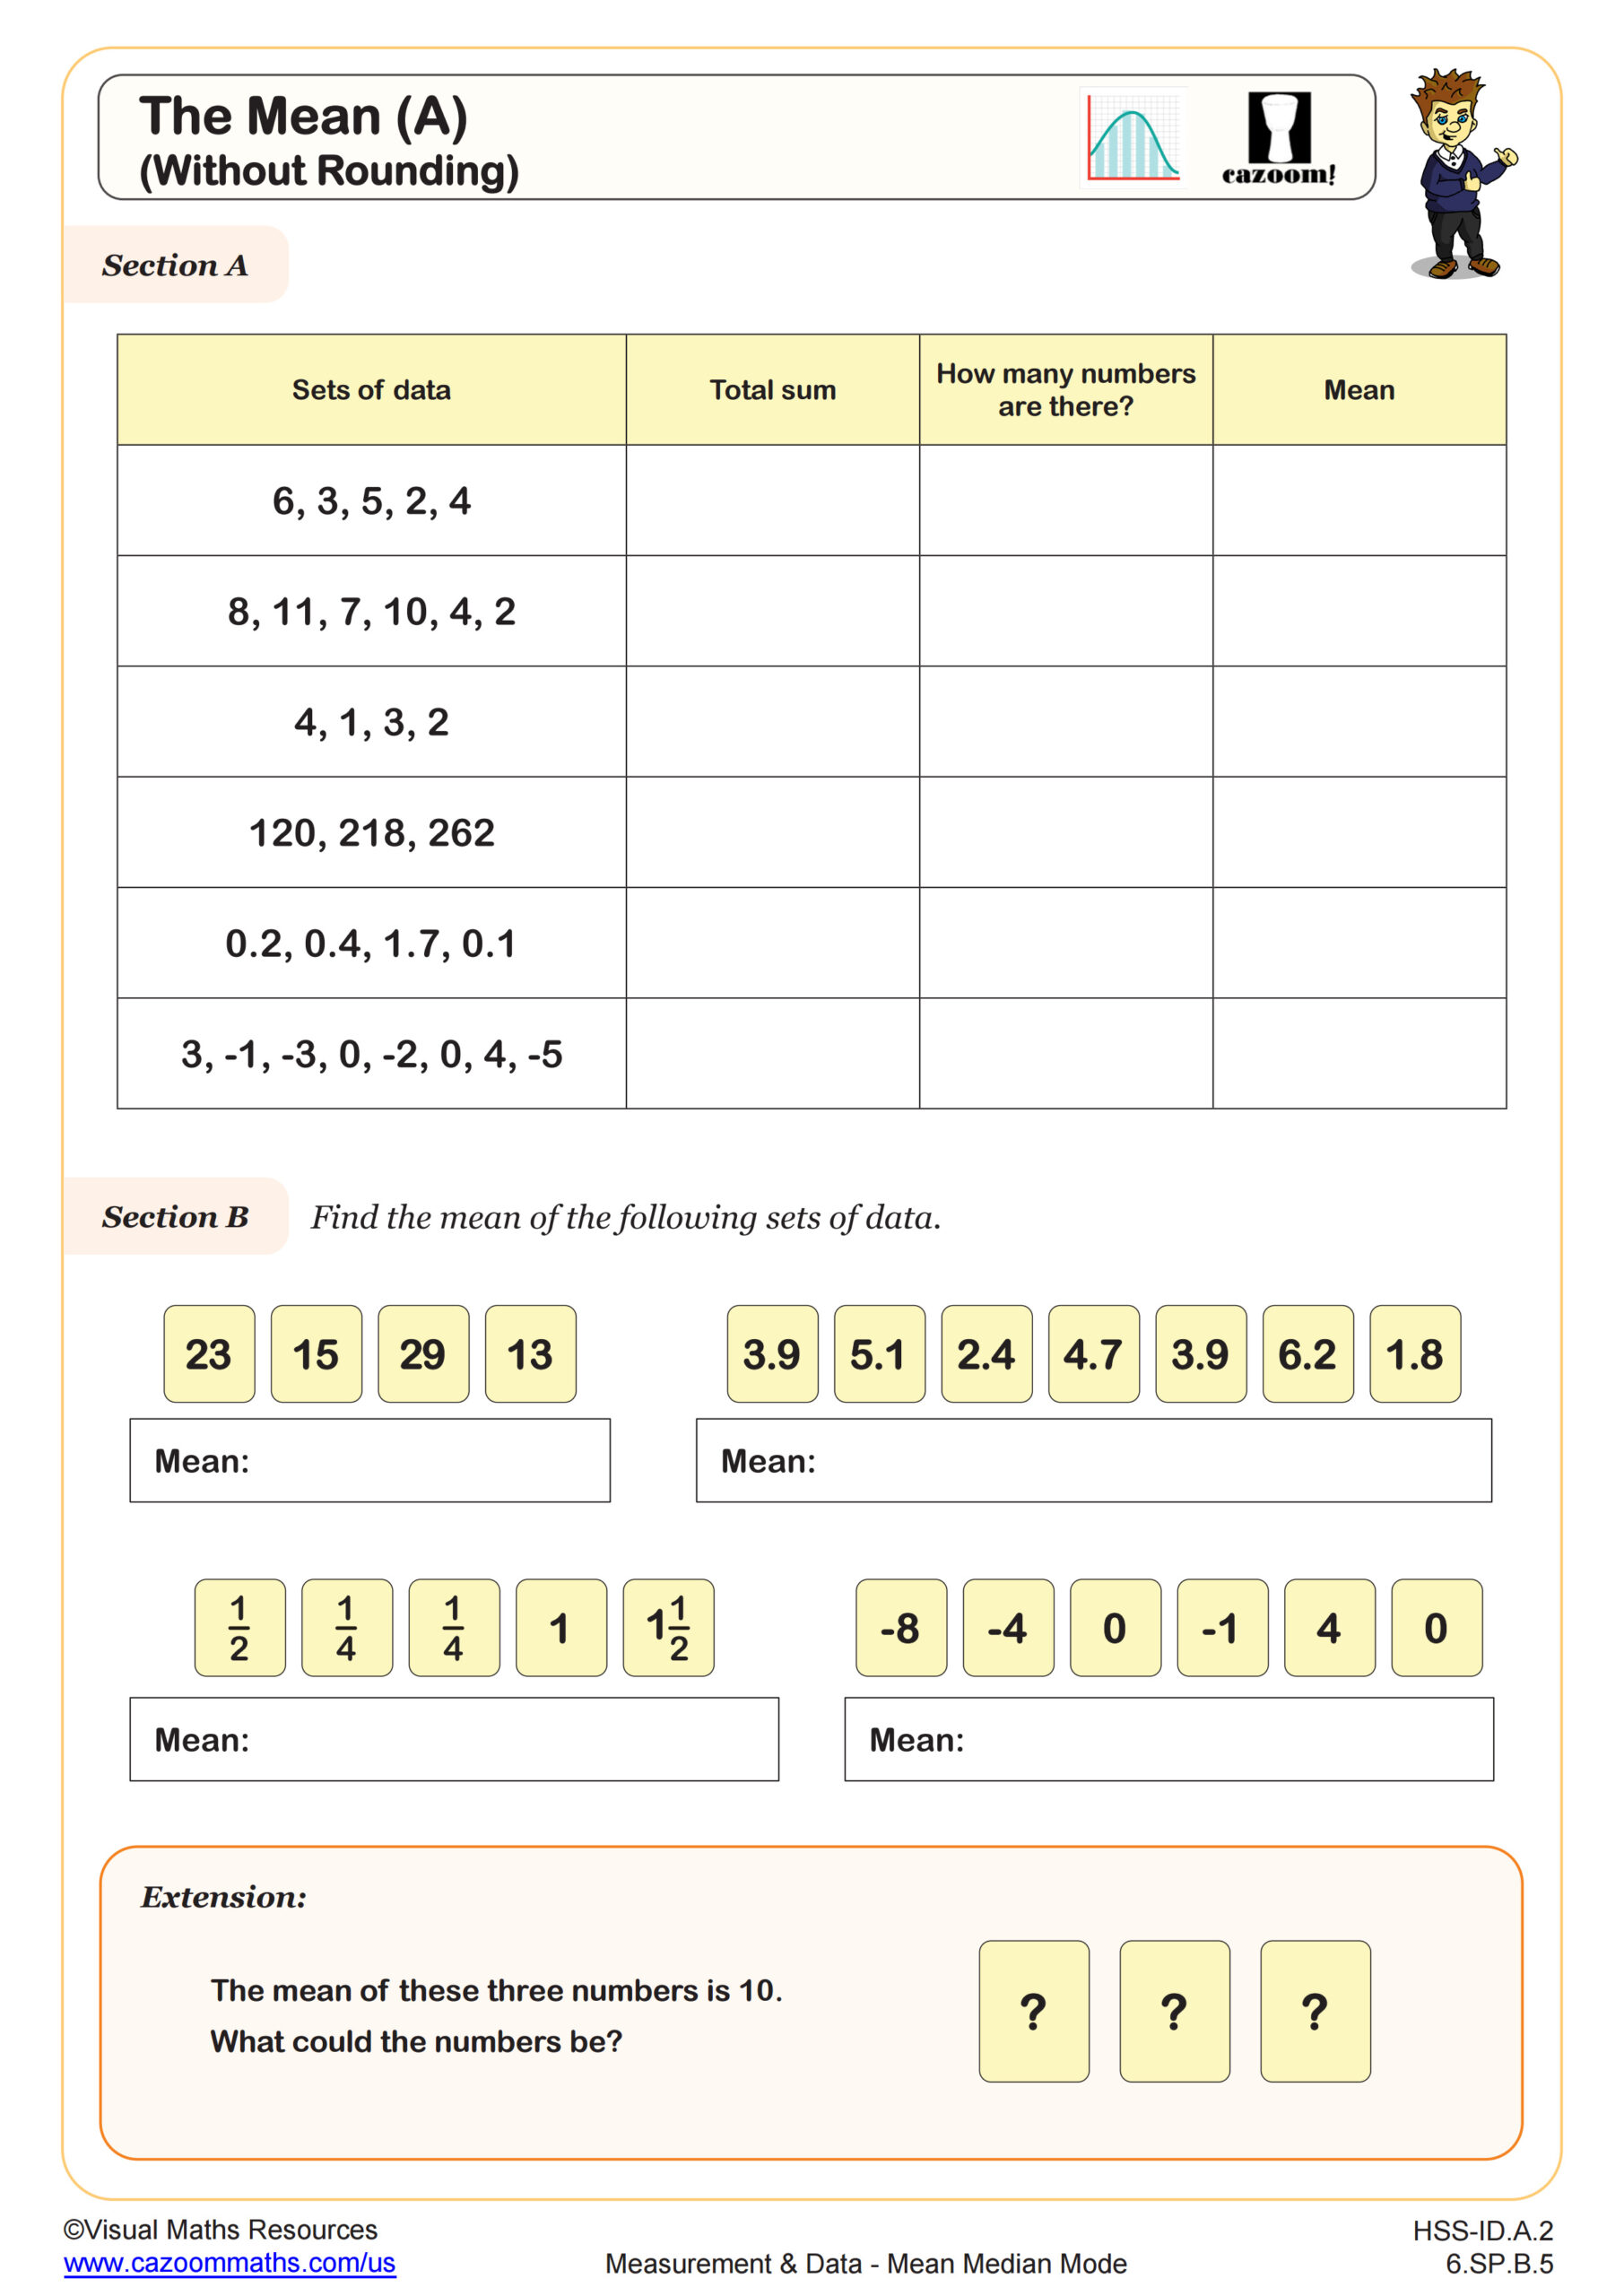
Mean represents the arithmetic average found by dividing the sum of all values by the count of values. Median identifies the middle value when data is arranged in order (or the average of the two middle values for even data sets). Mode shows the most frequently occurring value in a data set. Range, while not a measure of central tendency, indicates the spread by subtracting the smallest value from the largest. These concepts align with Common Core standards 6.SP.A.2 and 6.SP.B.5, where students analyze statistical variability.
Students lose points on assessments when they calculate mean correctly but forget to order data before finding the median, or when they list all values that appear multiple times instead of identifying just the mode value itself. A common misconception surfaces with bimodal data sets, where students sometimes average the two modes rather than reporting both values. Teachers frequently notice that students grasp these concepts faster when working with contexts they understand, like test scores or sports statistics, before moving to abstract number sets.
What Grade Levels Use Mean, Median, and Mode Worksheets?
These worksheets target middle school students in 6th grade, 7th grade, and 8th grade. Students typically encounter basic mean, median, and mode calculations in 6th grade as they build statistical literacy. The topic continues through 7th and 8th grade with increasing complexity as students prepare for high school statistics courses and standardized assessments that test data interpretation skills.
The progression across grades shows clear scaffolding. Sixth graders start with small, manageable data sets and simple frequency tables. By 7th grade, students tackle larger data sets and frequency tables with multiple entries, learning to interpret what the statistics reveal about real situations. Eighth graders work with grouped frequency tables where data appears in intervals rather than individual values, requiring estimation of midpoints and more sophisticated calculations. This gradual increase in complexity ensures students build confidence before encountering the statistical analysis required in Algebra 1 and beyond.
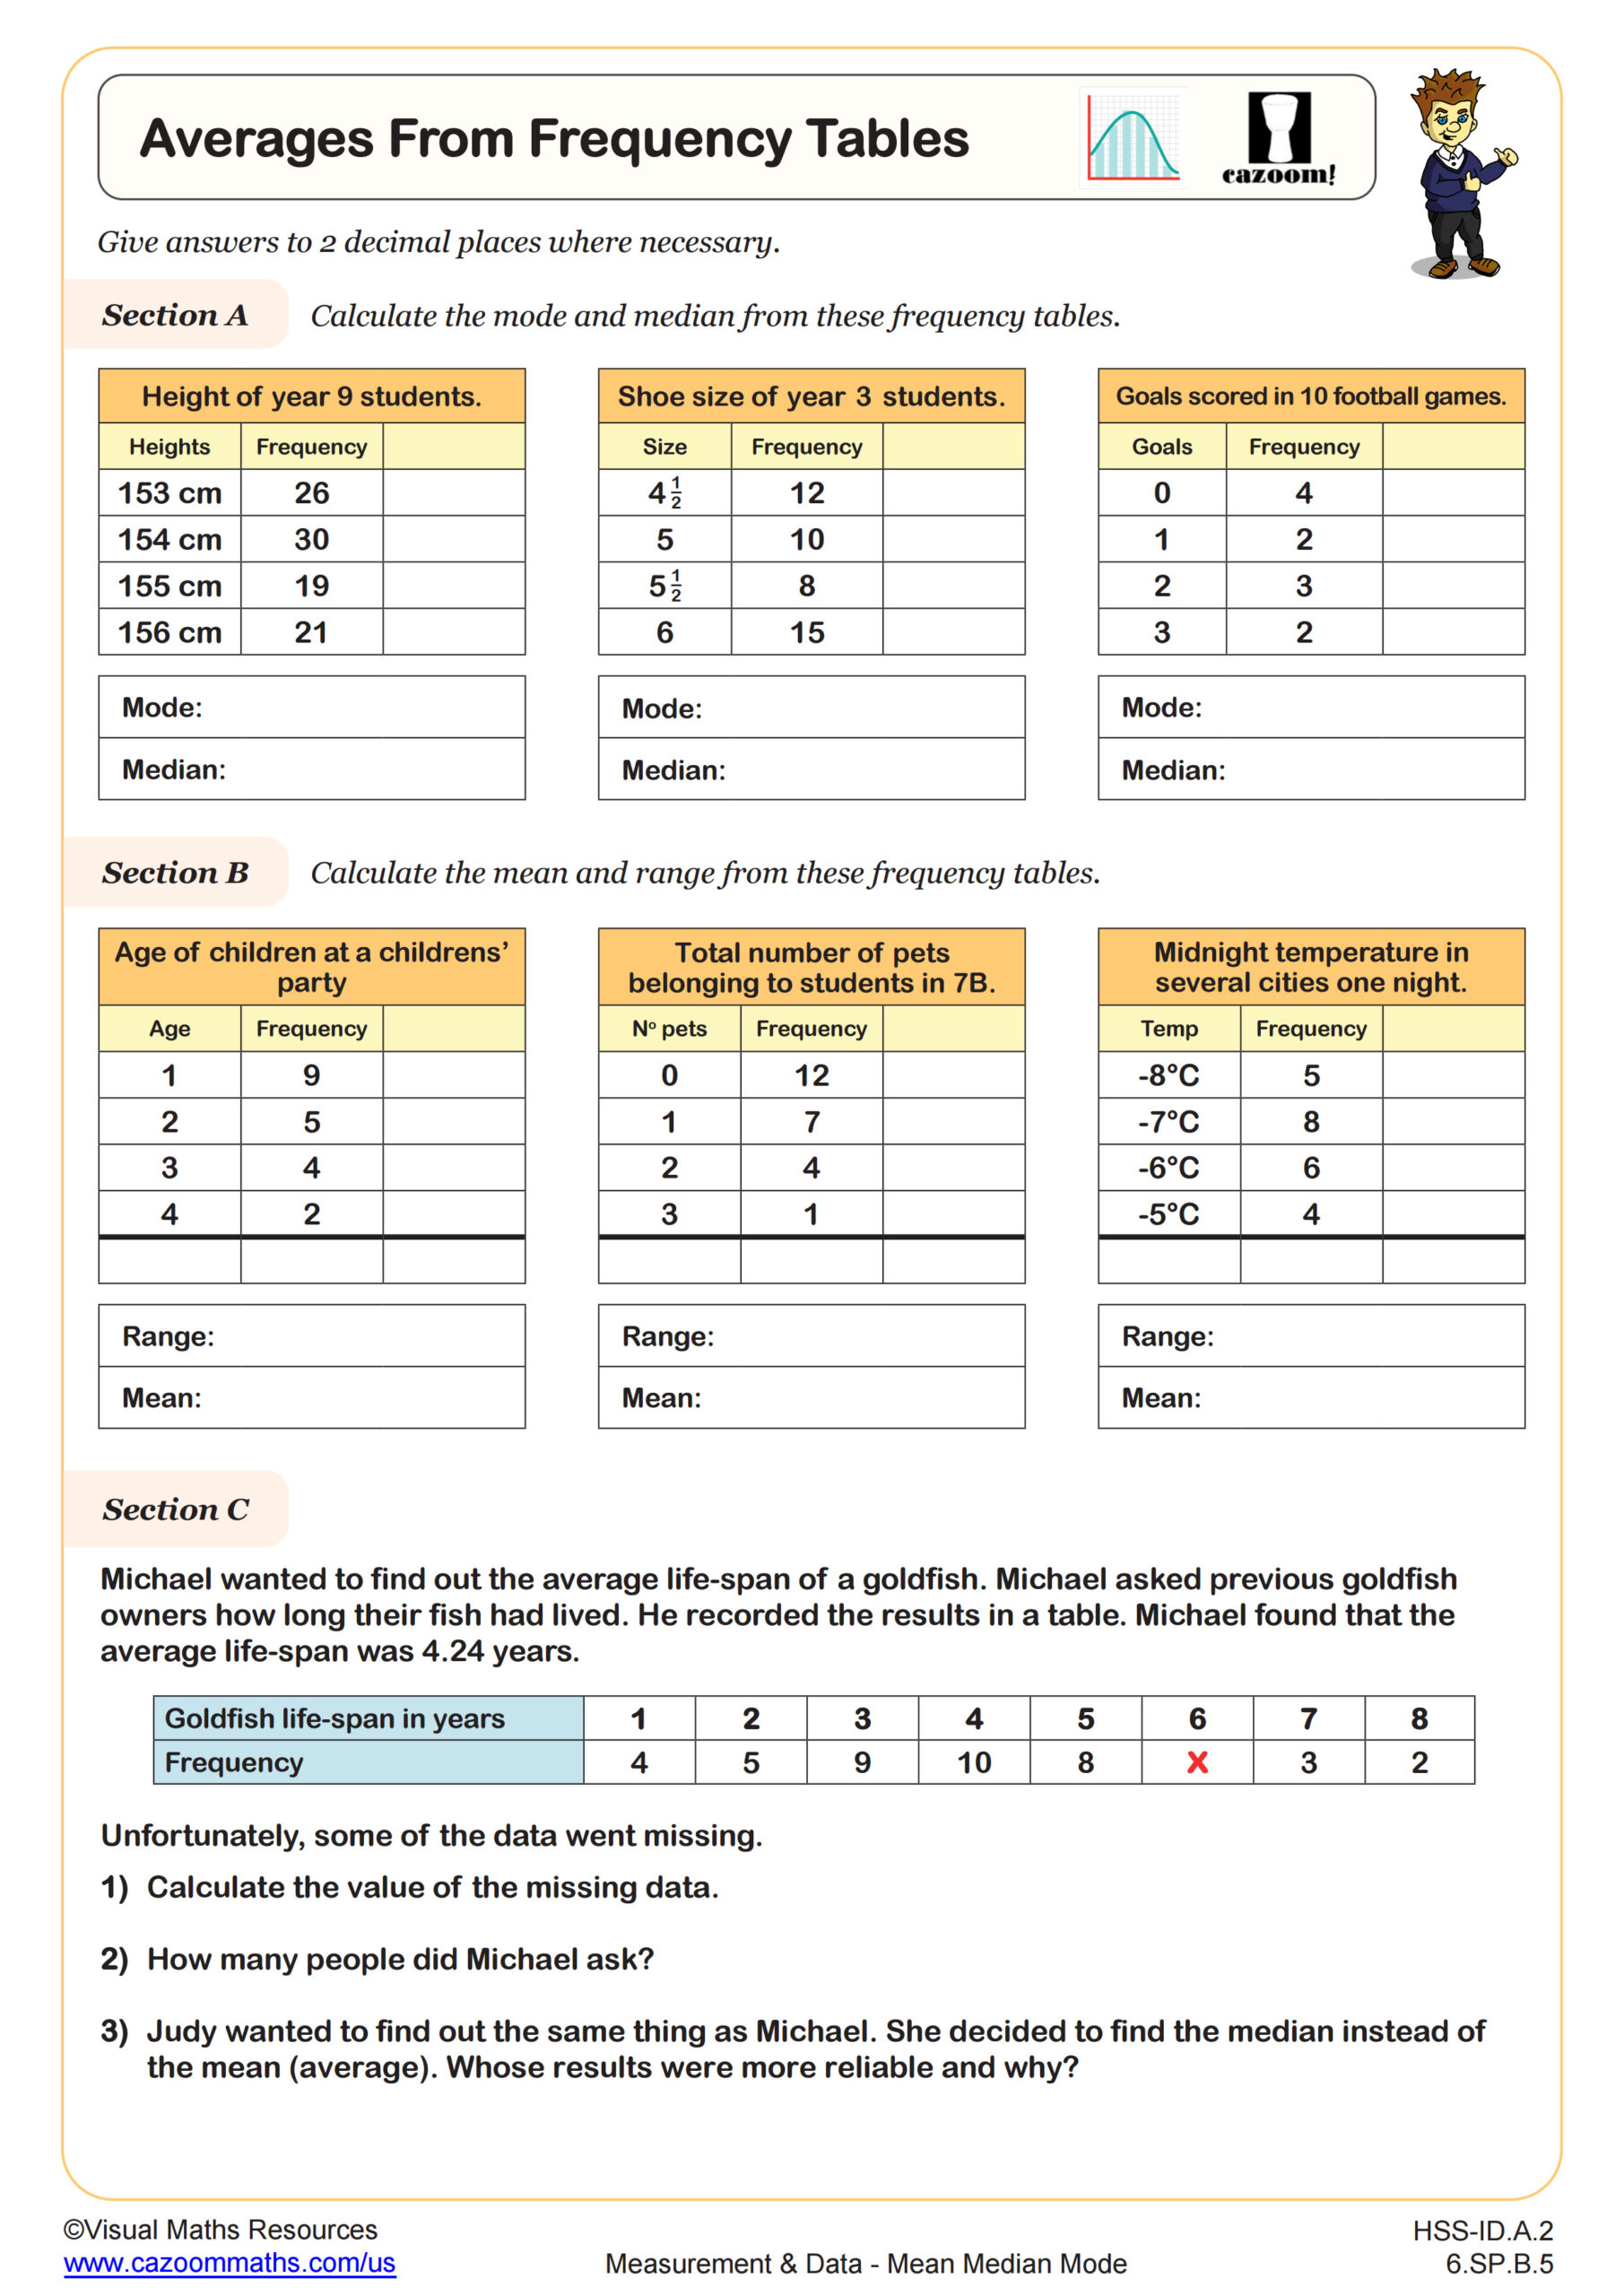
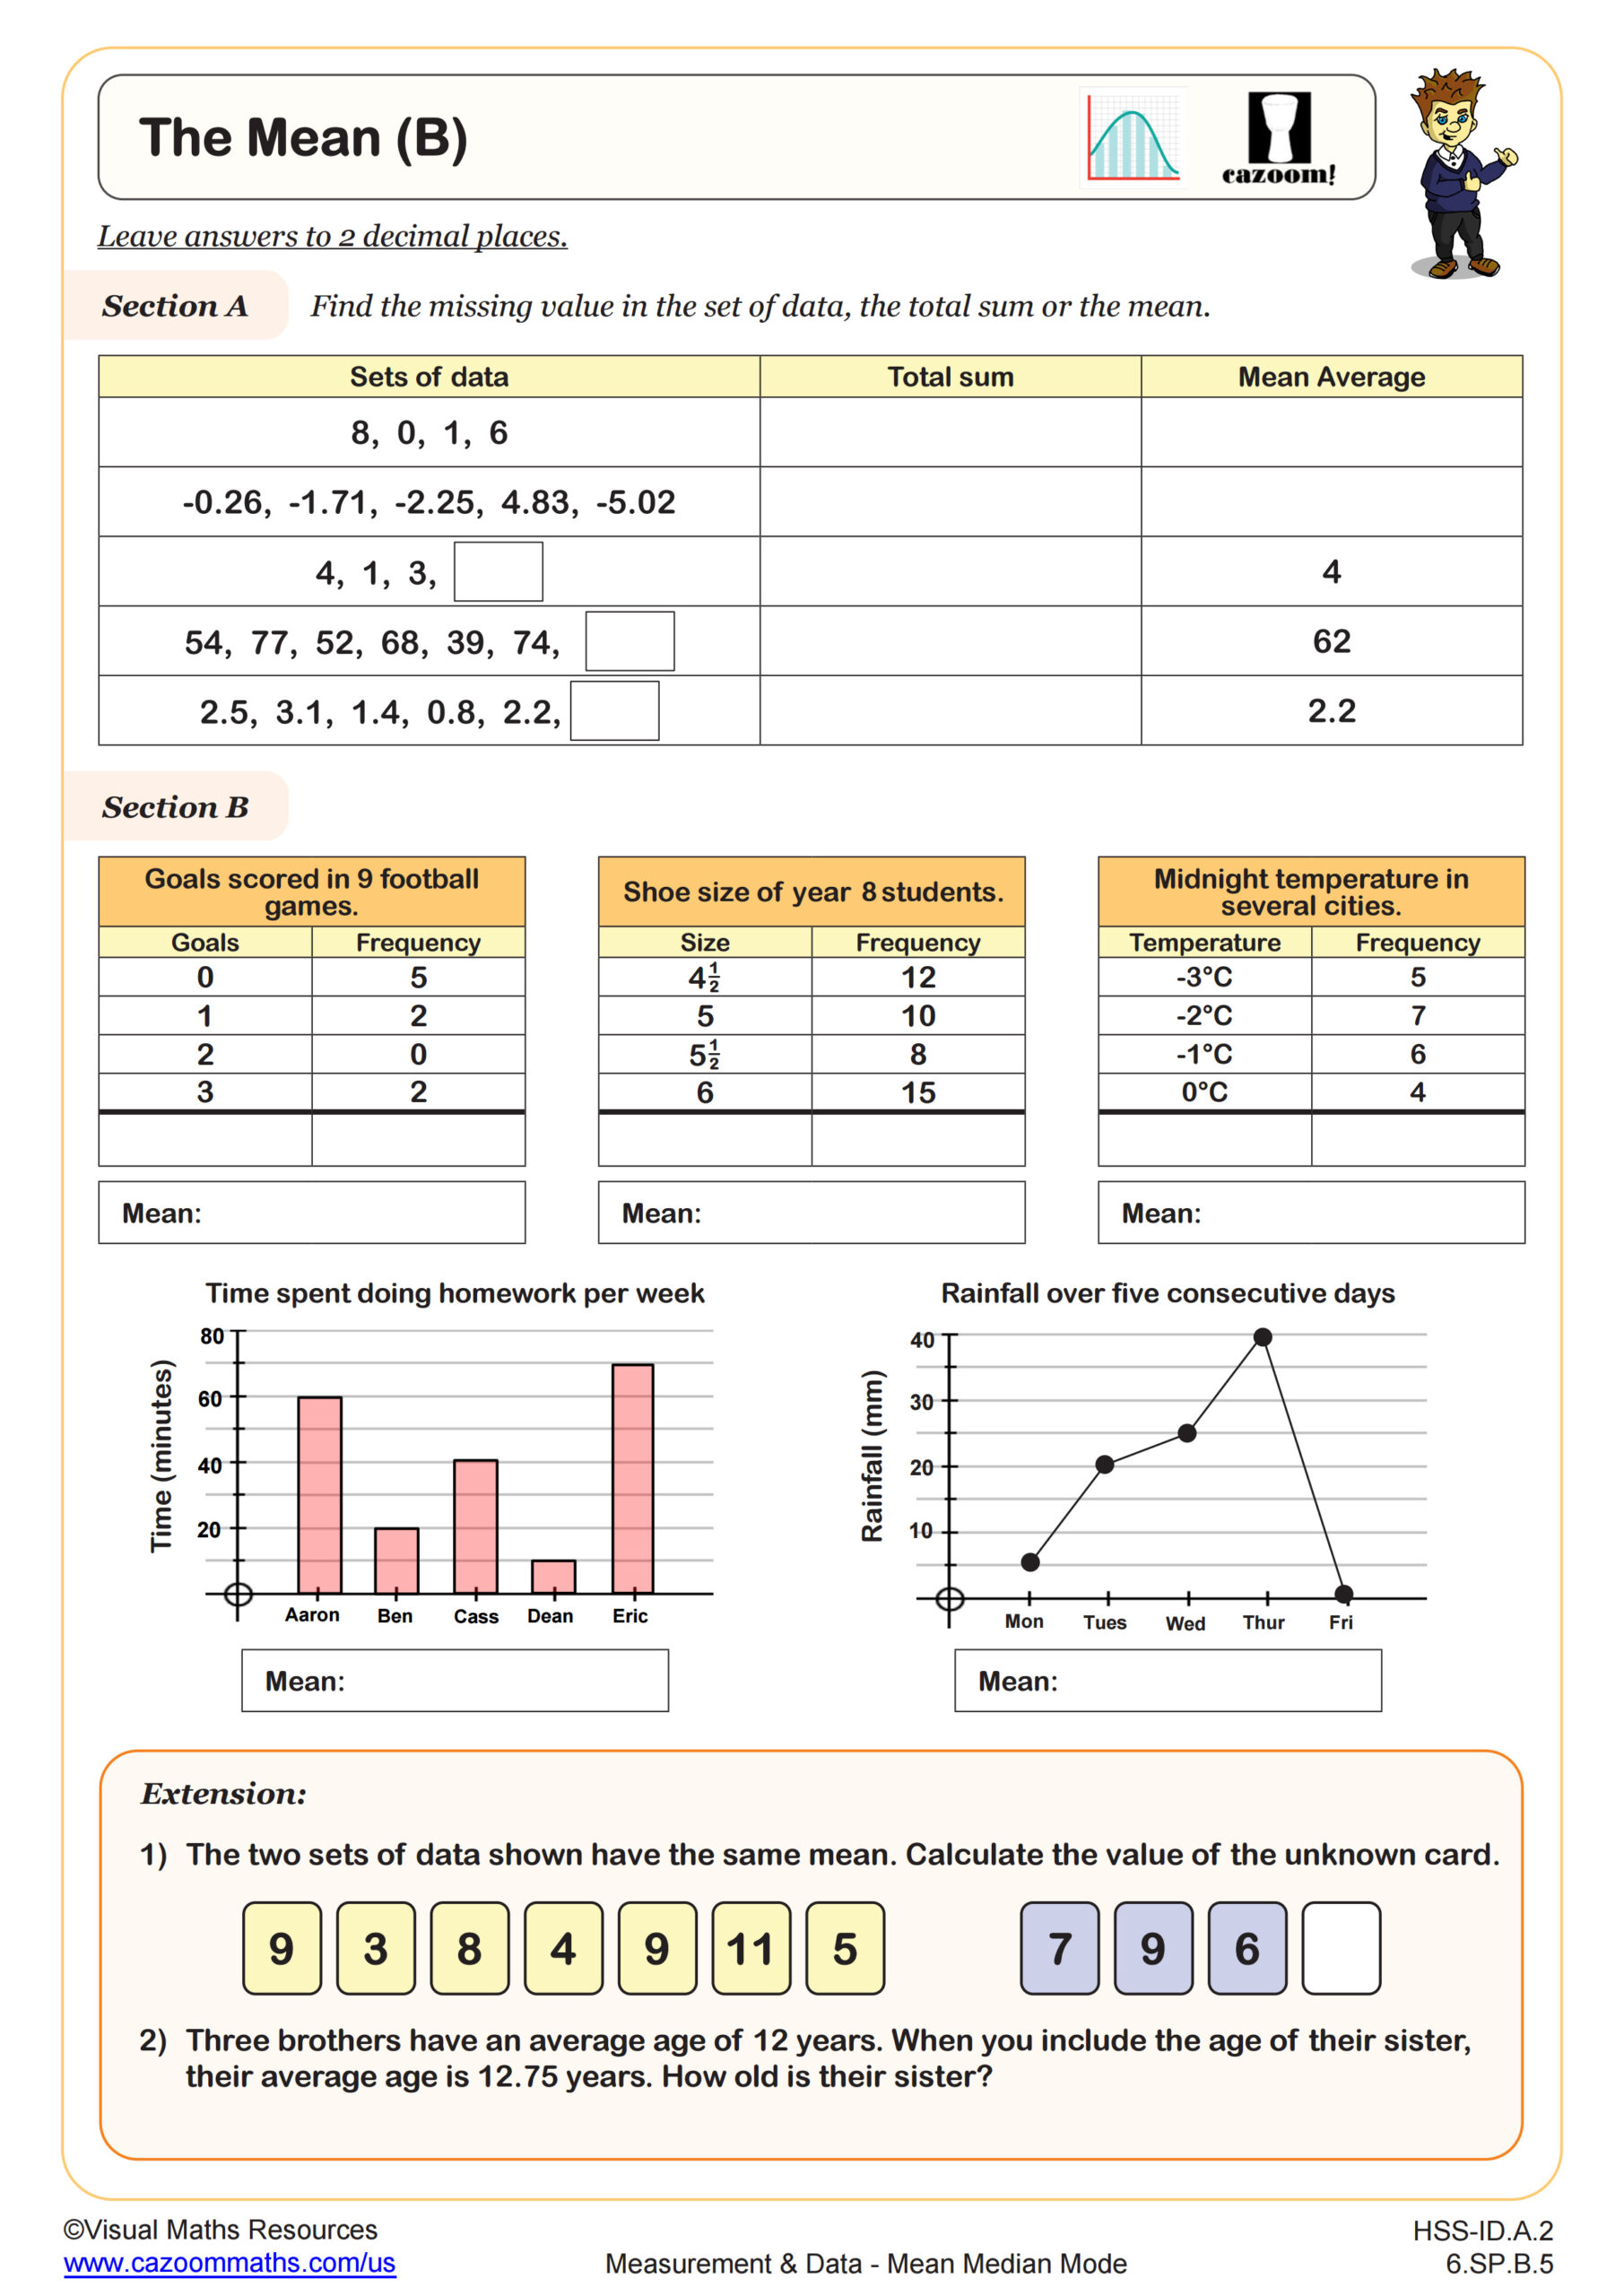
How Do You Calculate the Mean from a Frequency Table?
Calculating mean from frequency tables requires multiplying each data value by its frequency, summing all products, then dividing by the total frequency (the sum of all frequencies). For example, if the value 5 appears 3 times and the value 8 appears 4 times in a table, students calculate (5×3 + 8×4) ÷ (3+4) = (15+32) ÷ 7 = 47 ÷ 7 ≈ 6.7. This process differs from simply averaging the distinct values shown, which represents the most common error on this skill.
This technique connects directly to quality control in manufacturing, where engineers track defects per batch using frequency tables rather than listing every individual measurement. Sports statisticians use this method to analyze player performance data efficiently when tracking statistics across multiple games. Understanding frequency table calculations prepares students for more advanced work with histograms and probability distributions in high school, where organizing large data sets into frequency tables becomes necessary for analysis. Students who master this skill find that interpreting survey results and experimental data becomes significantly more manageable.
How Can Teachers Use These Mean, Median, and Mode Worksheets?
The worksheets provide structured practice that moves from foundational concepts to more complex applications like grouped frequency tables. Each worksheet includes varied problem types so students encounter different data presentations, from simple lists to organized frequency tables, mirroring how statistical information appears in standardized tests. The included answer keys allow students to check their work immediately and identify calculation errors before misconceptions solidify.
Many teachers use these worksheets for differentiated instruction, assigning simpler mean and median problems to students still building confidence while challenging advanced learners with grouped frequency table calculations. The worksheets work effectively as warm-up problems to refresh statistical thinking, homework assignments that reinforce classroom instruction, or review material before unit assessments. Teachers find that pairing students to work through frequency table problems encourages mathematical discussion about why multiplying by frequency matters. The collection also serves intervention purposes when students need targeted practice on specific subtopics like calculating mean from frequency tables before moving forward with data analysis projects.