Middle School Measurement and Data Worksheets
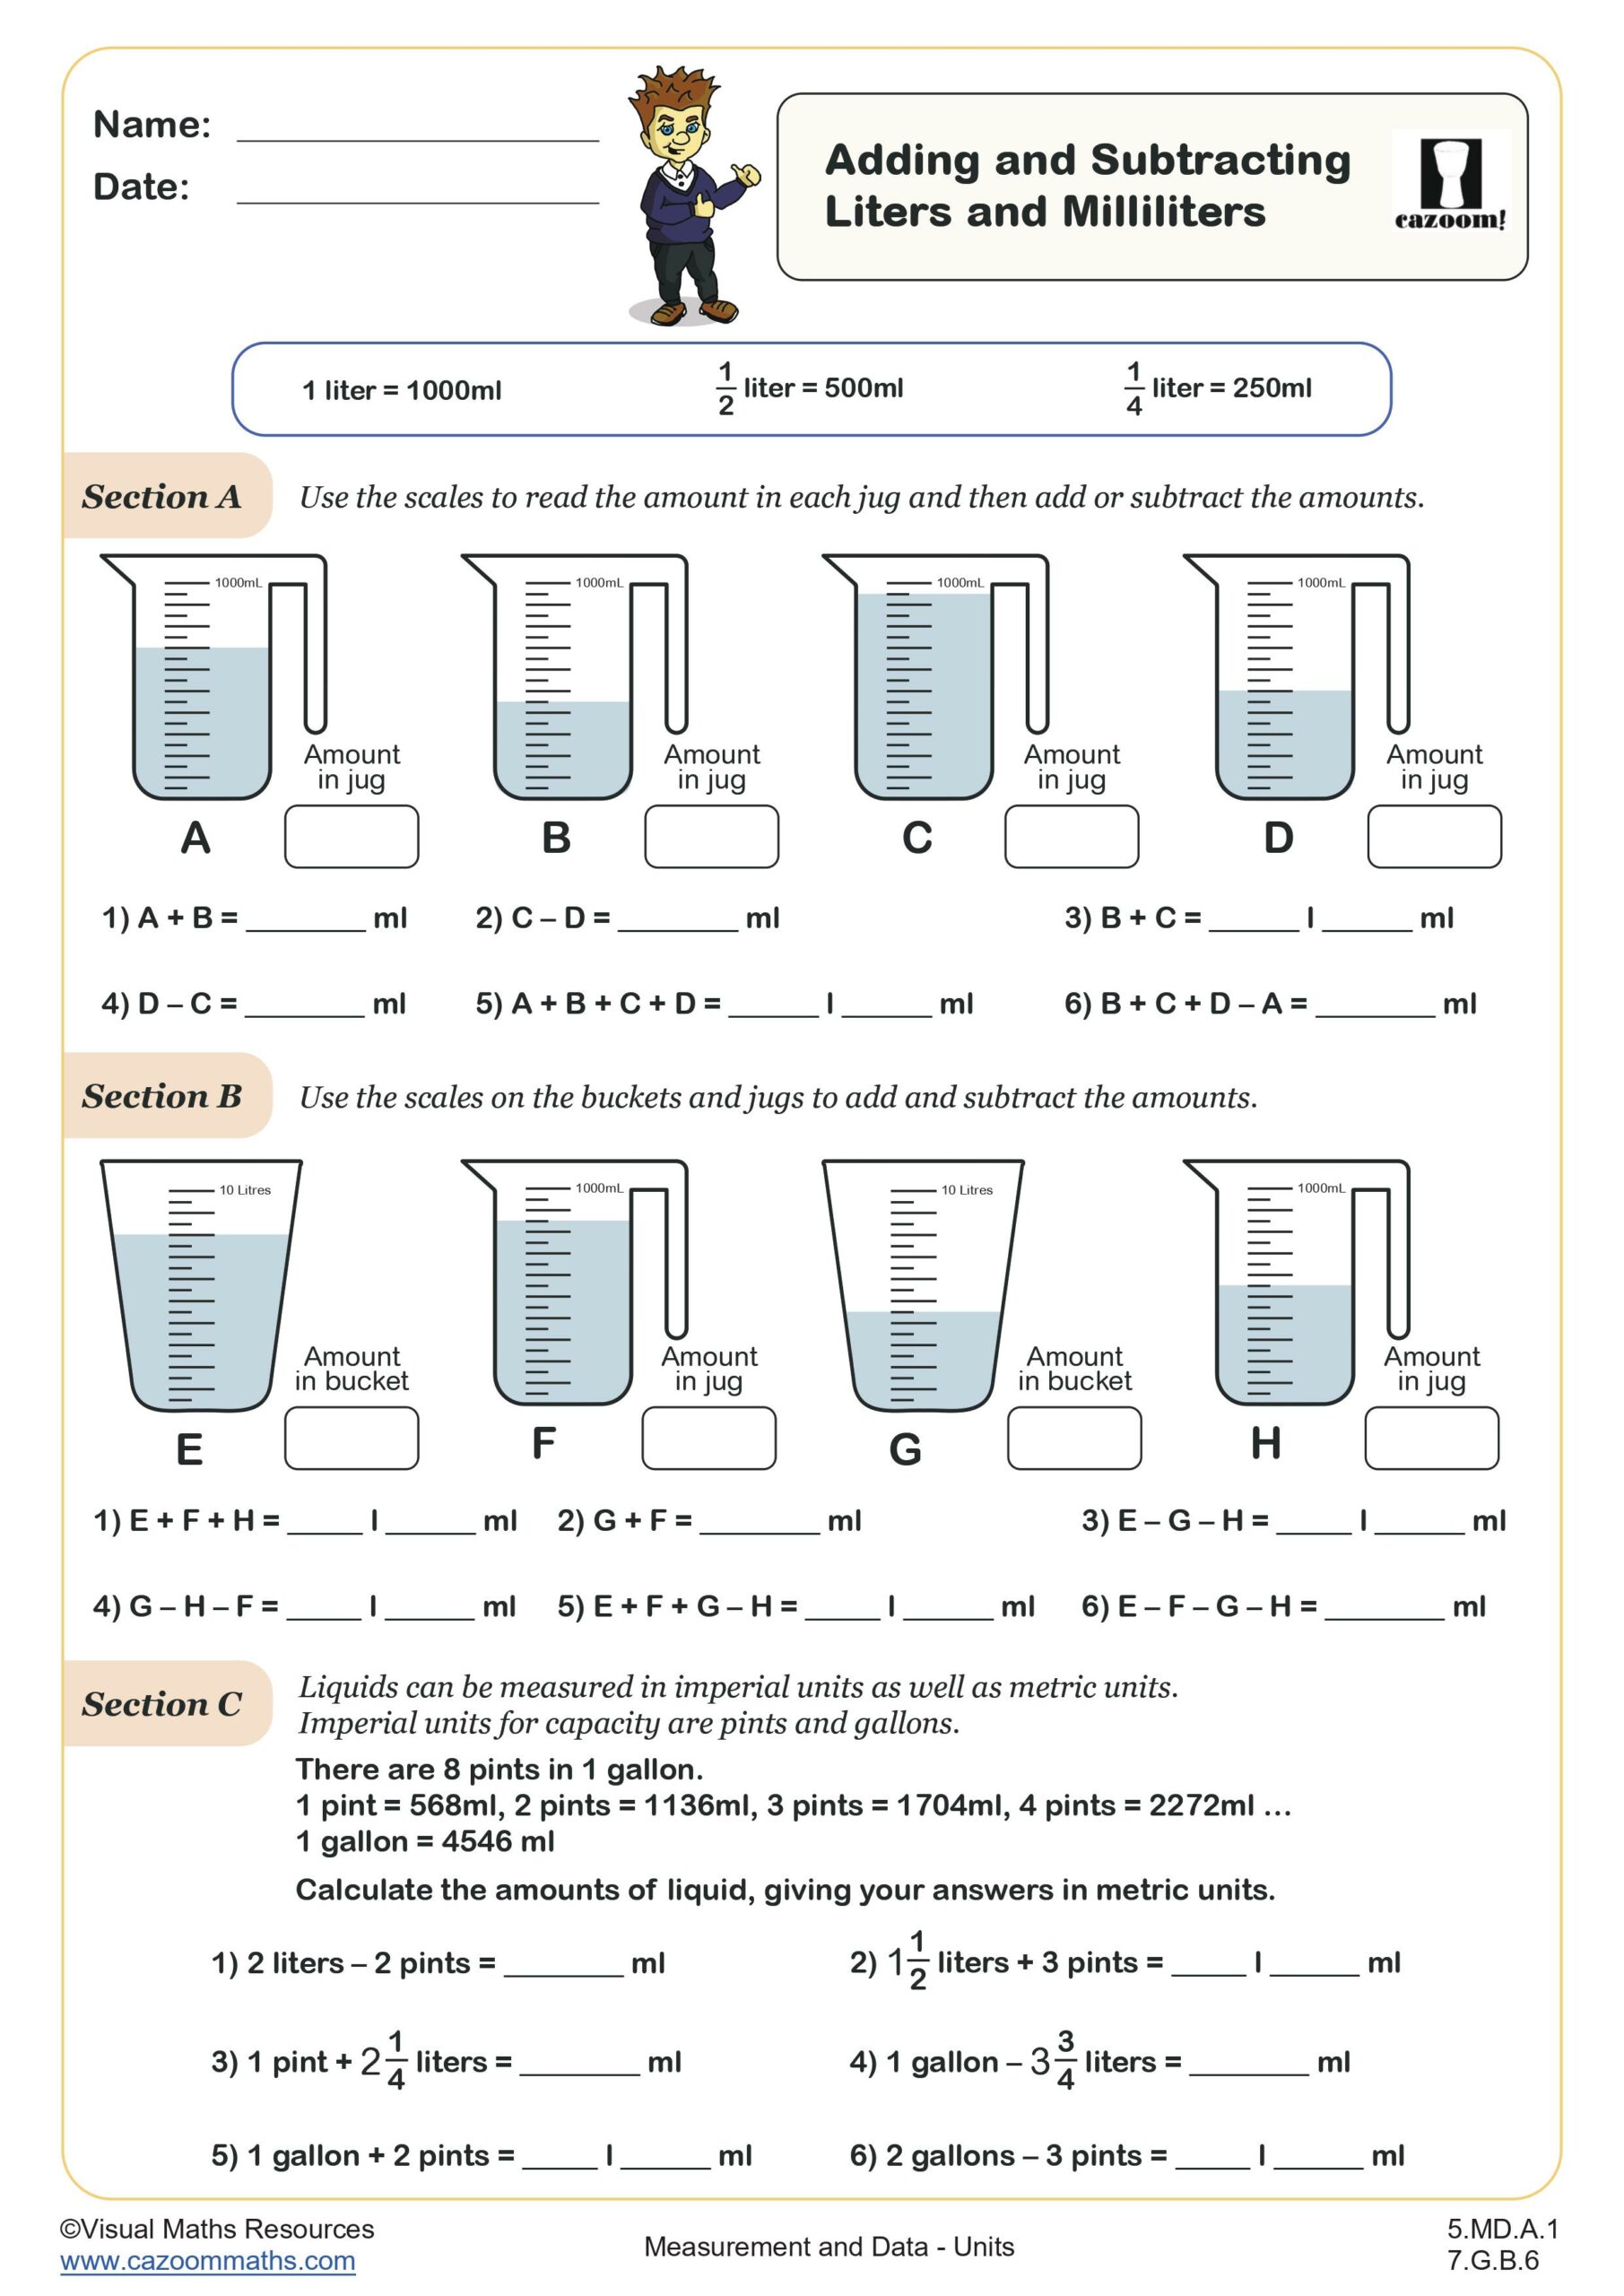
Adding and Subtracting Liters and Milliliters
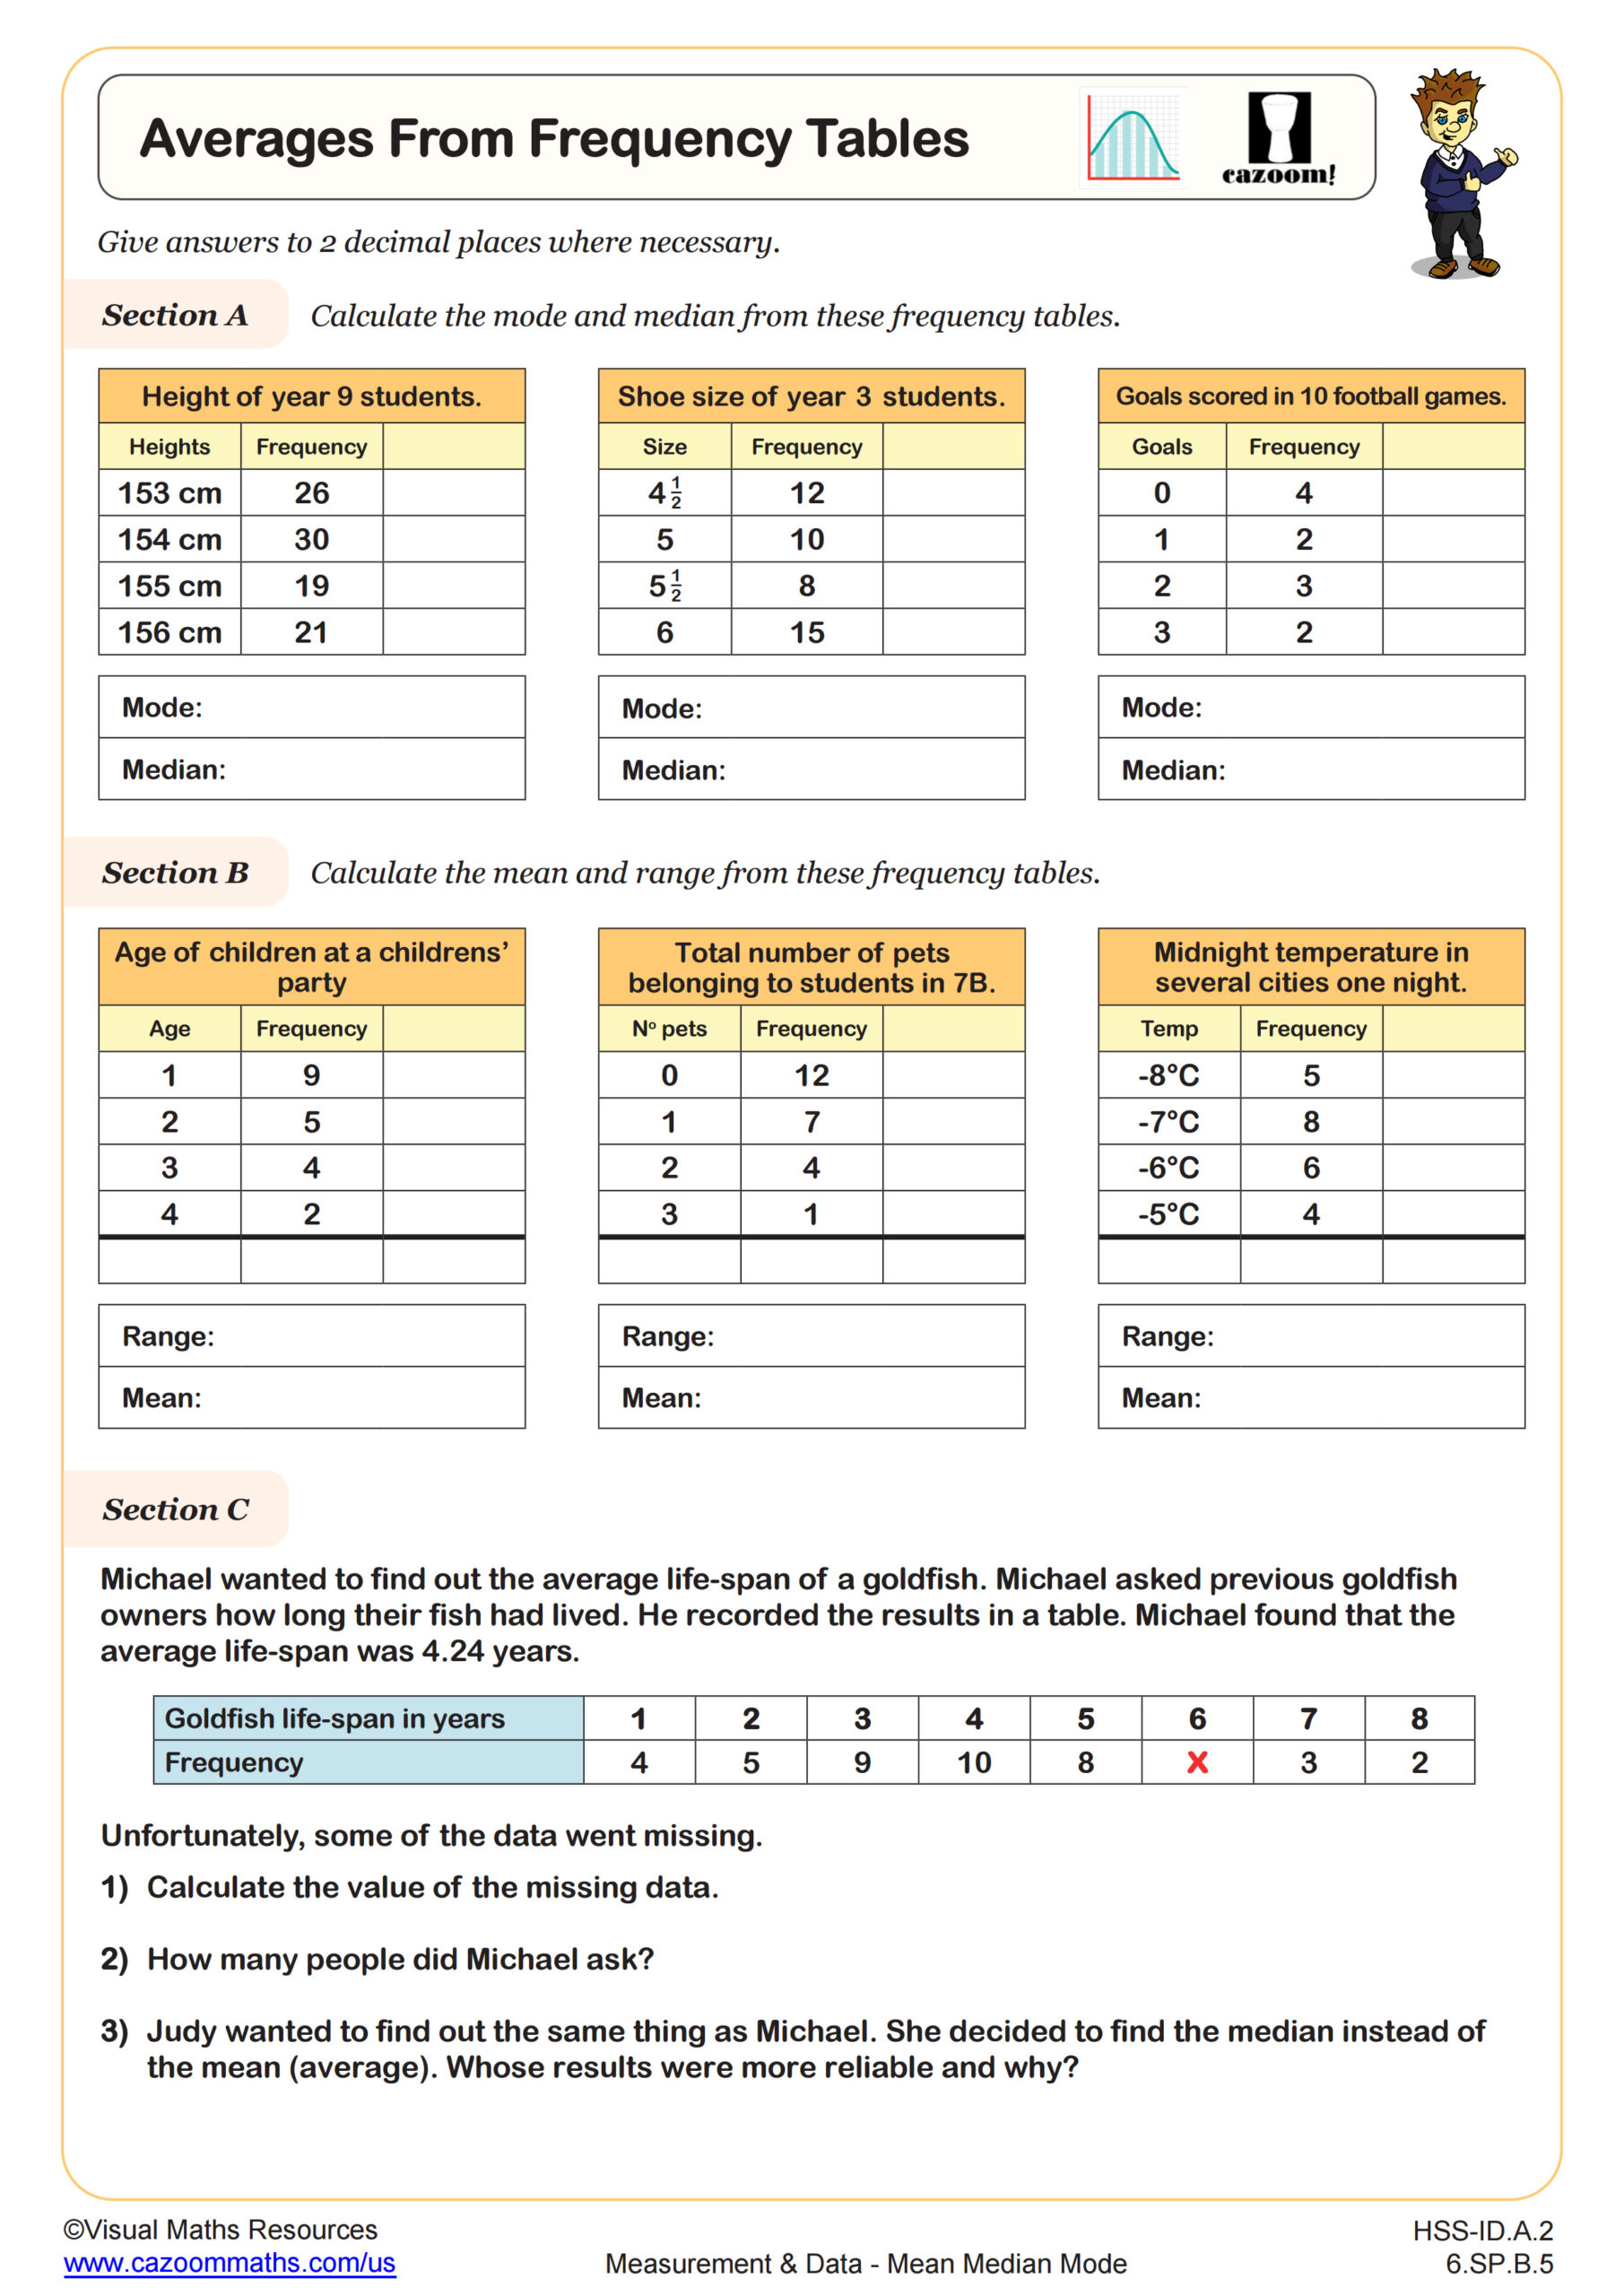
Averages from Frequency Tables
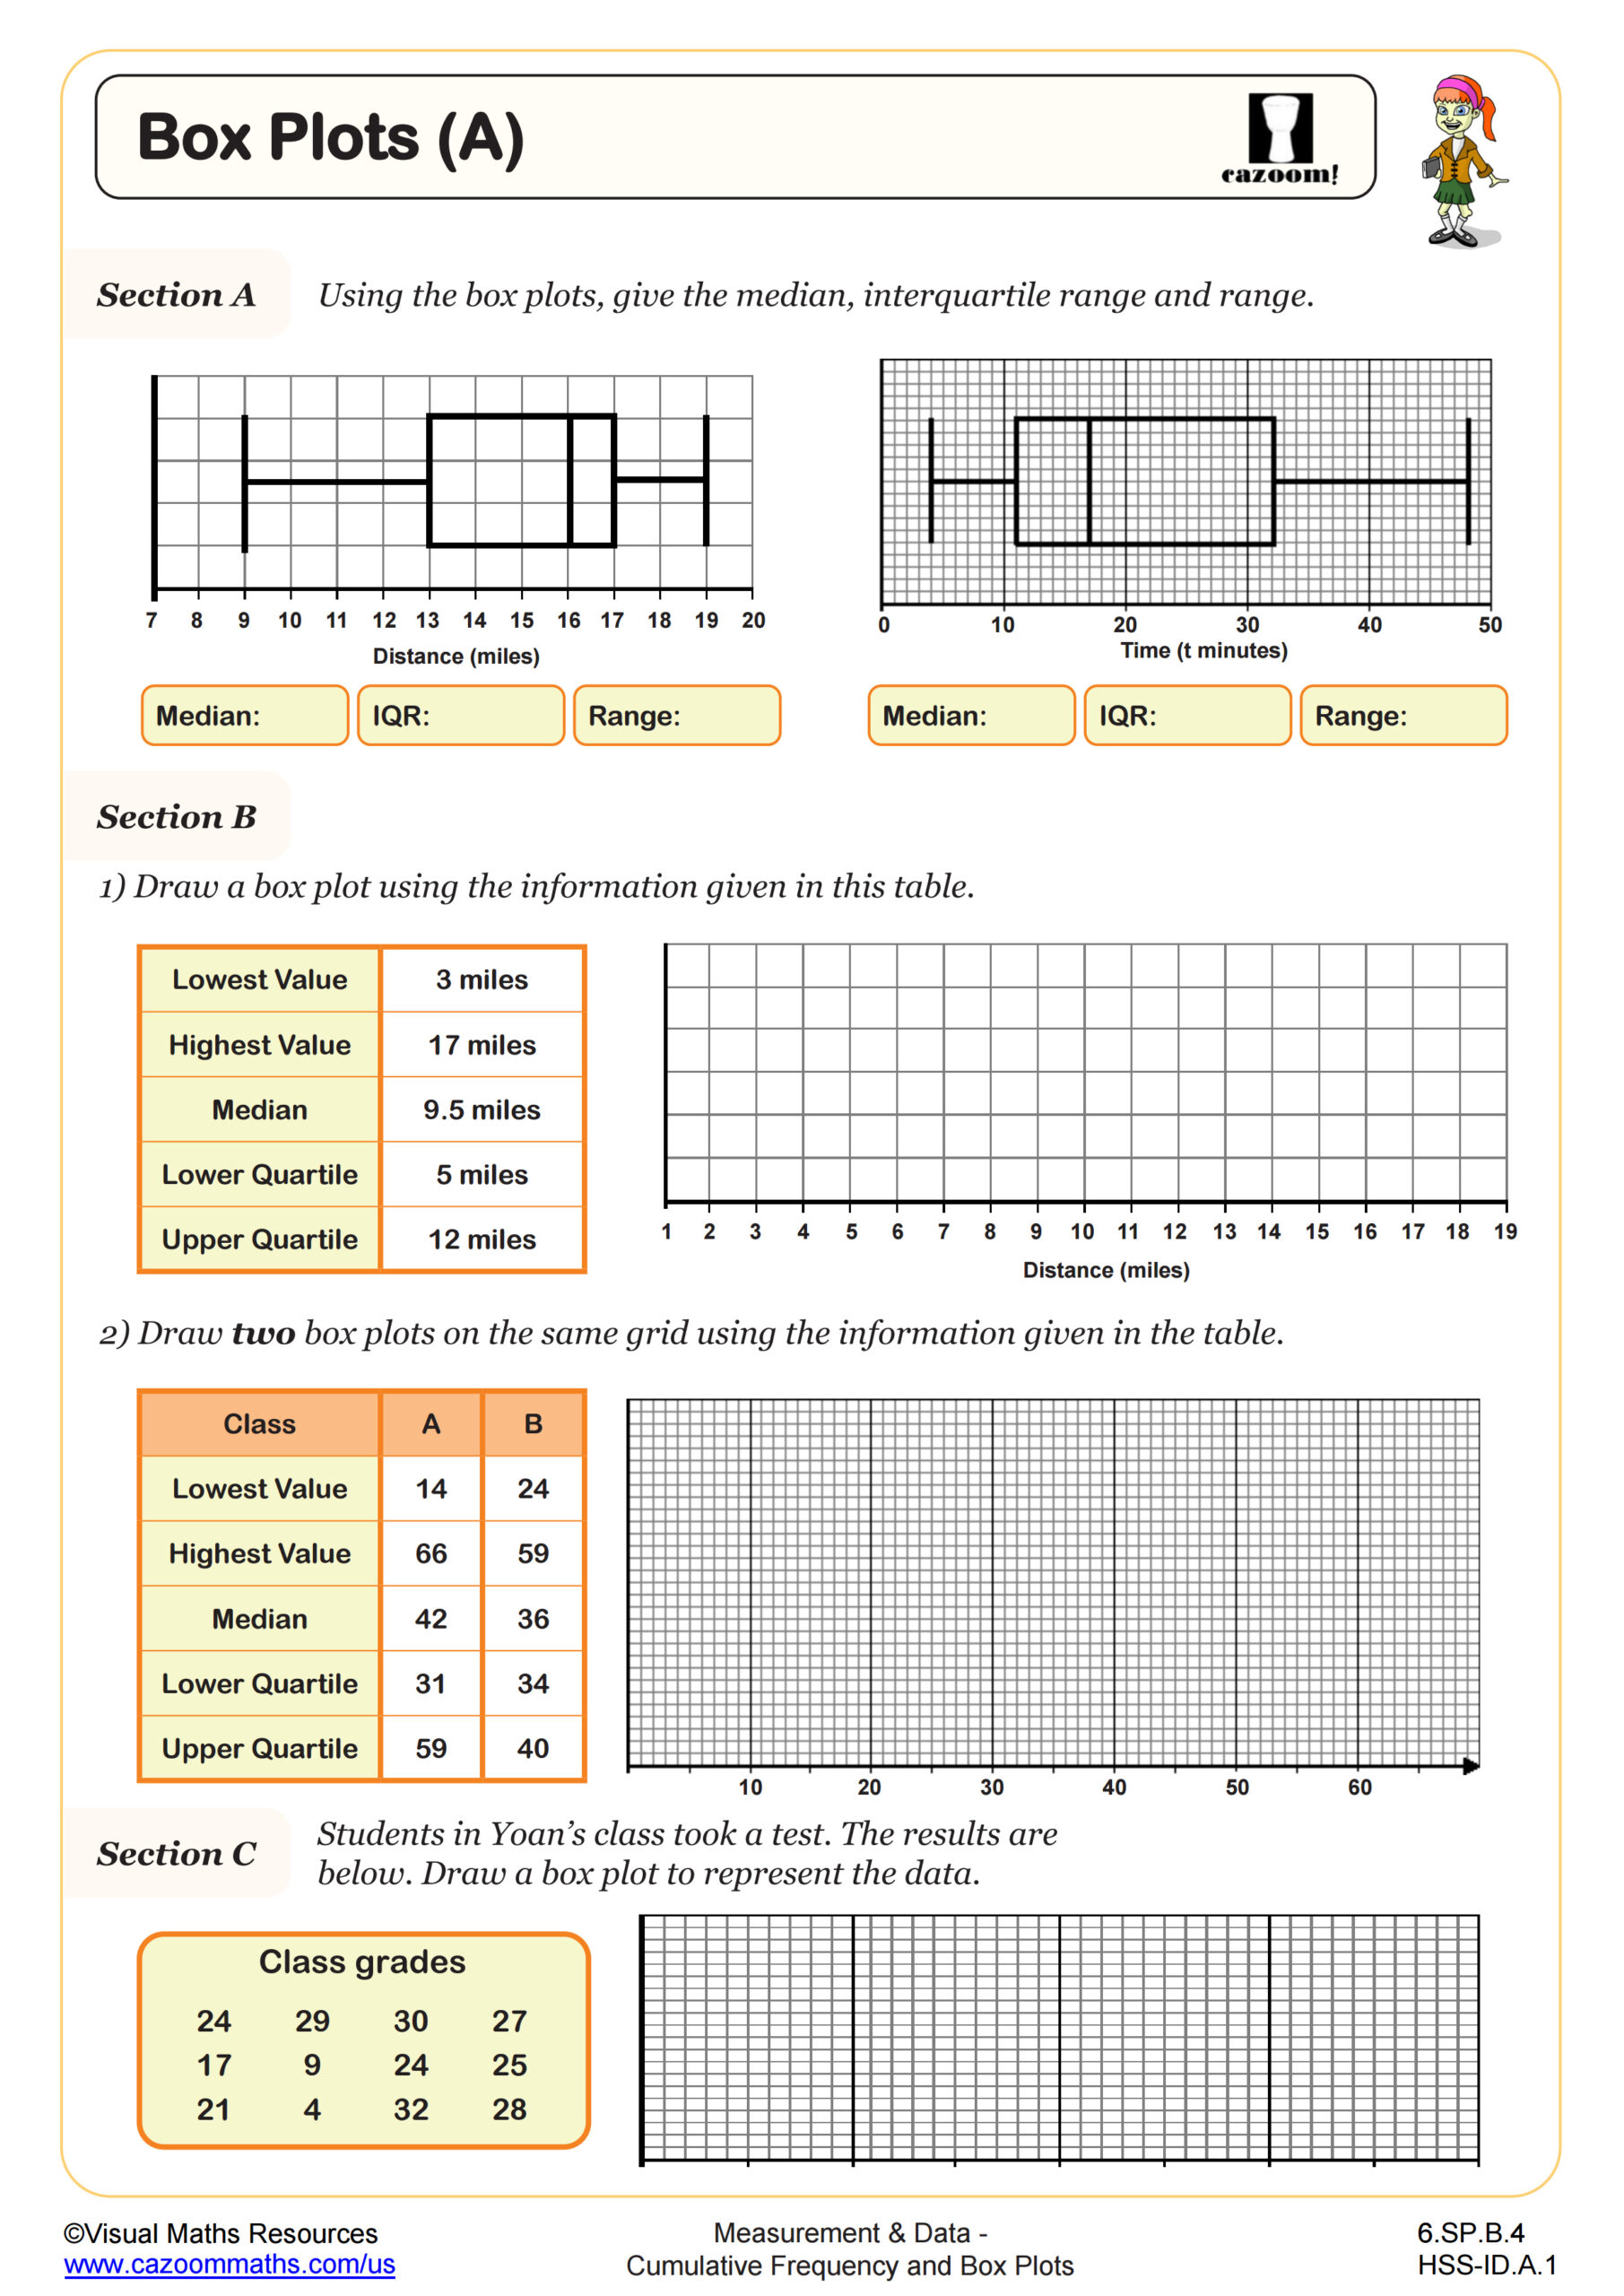
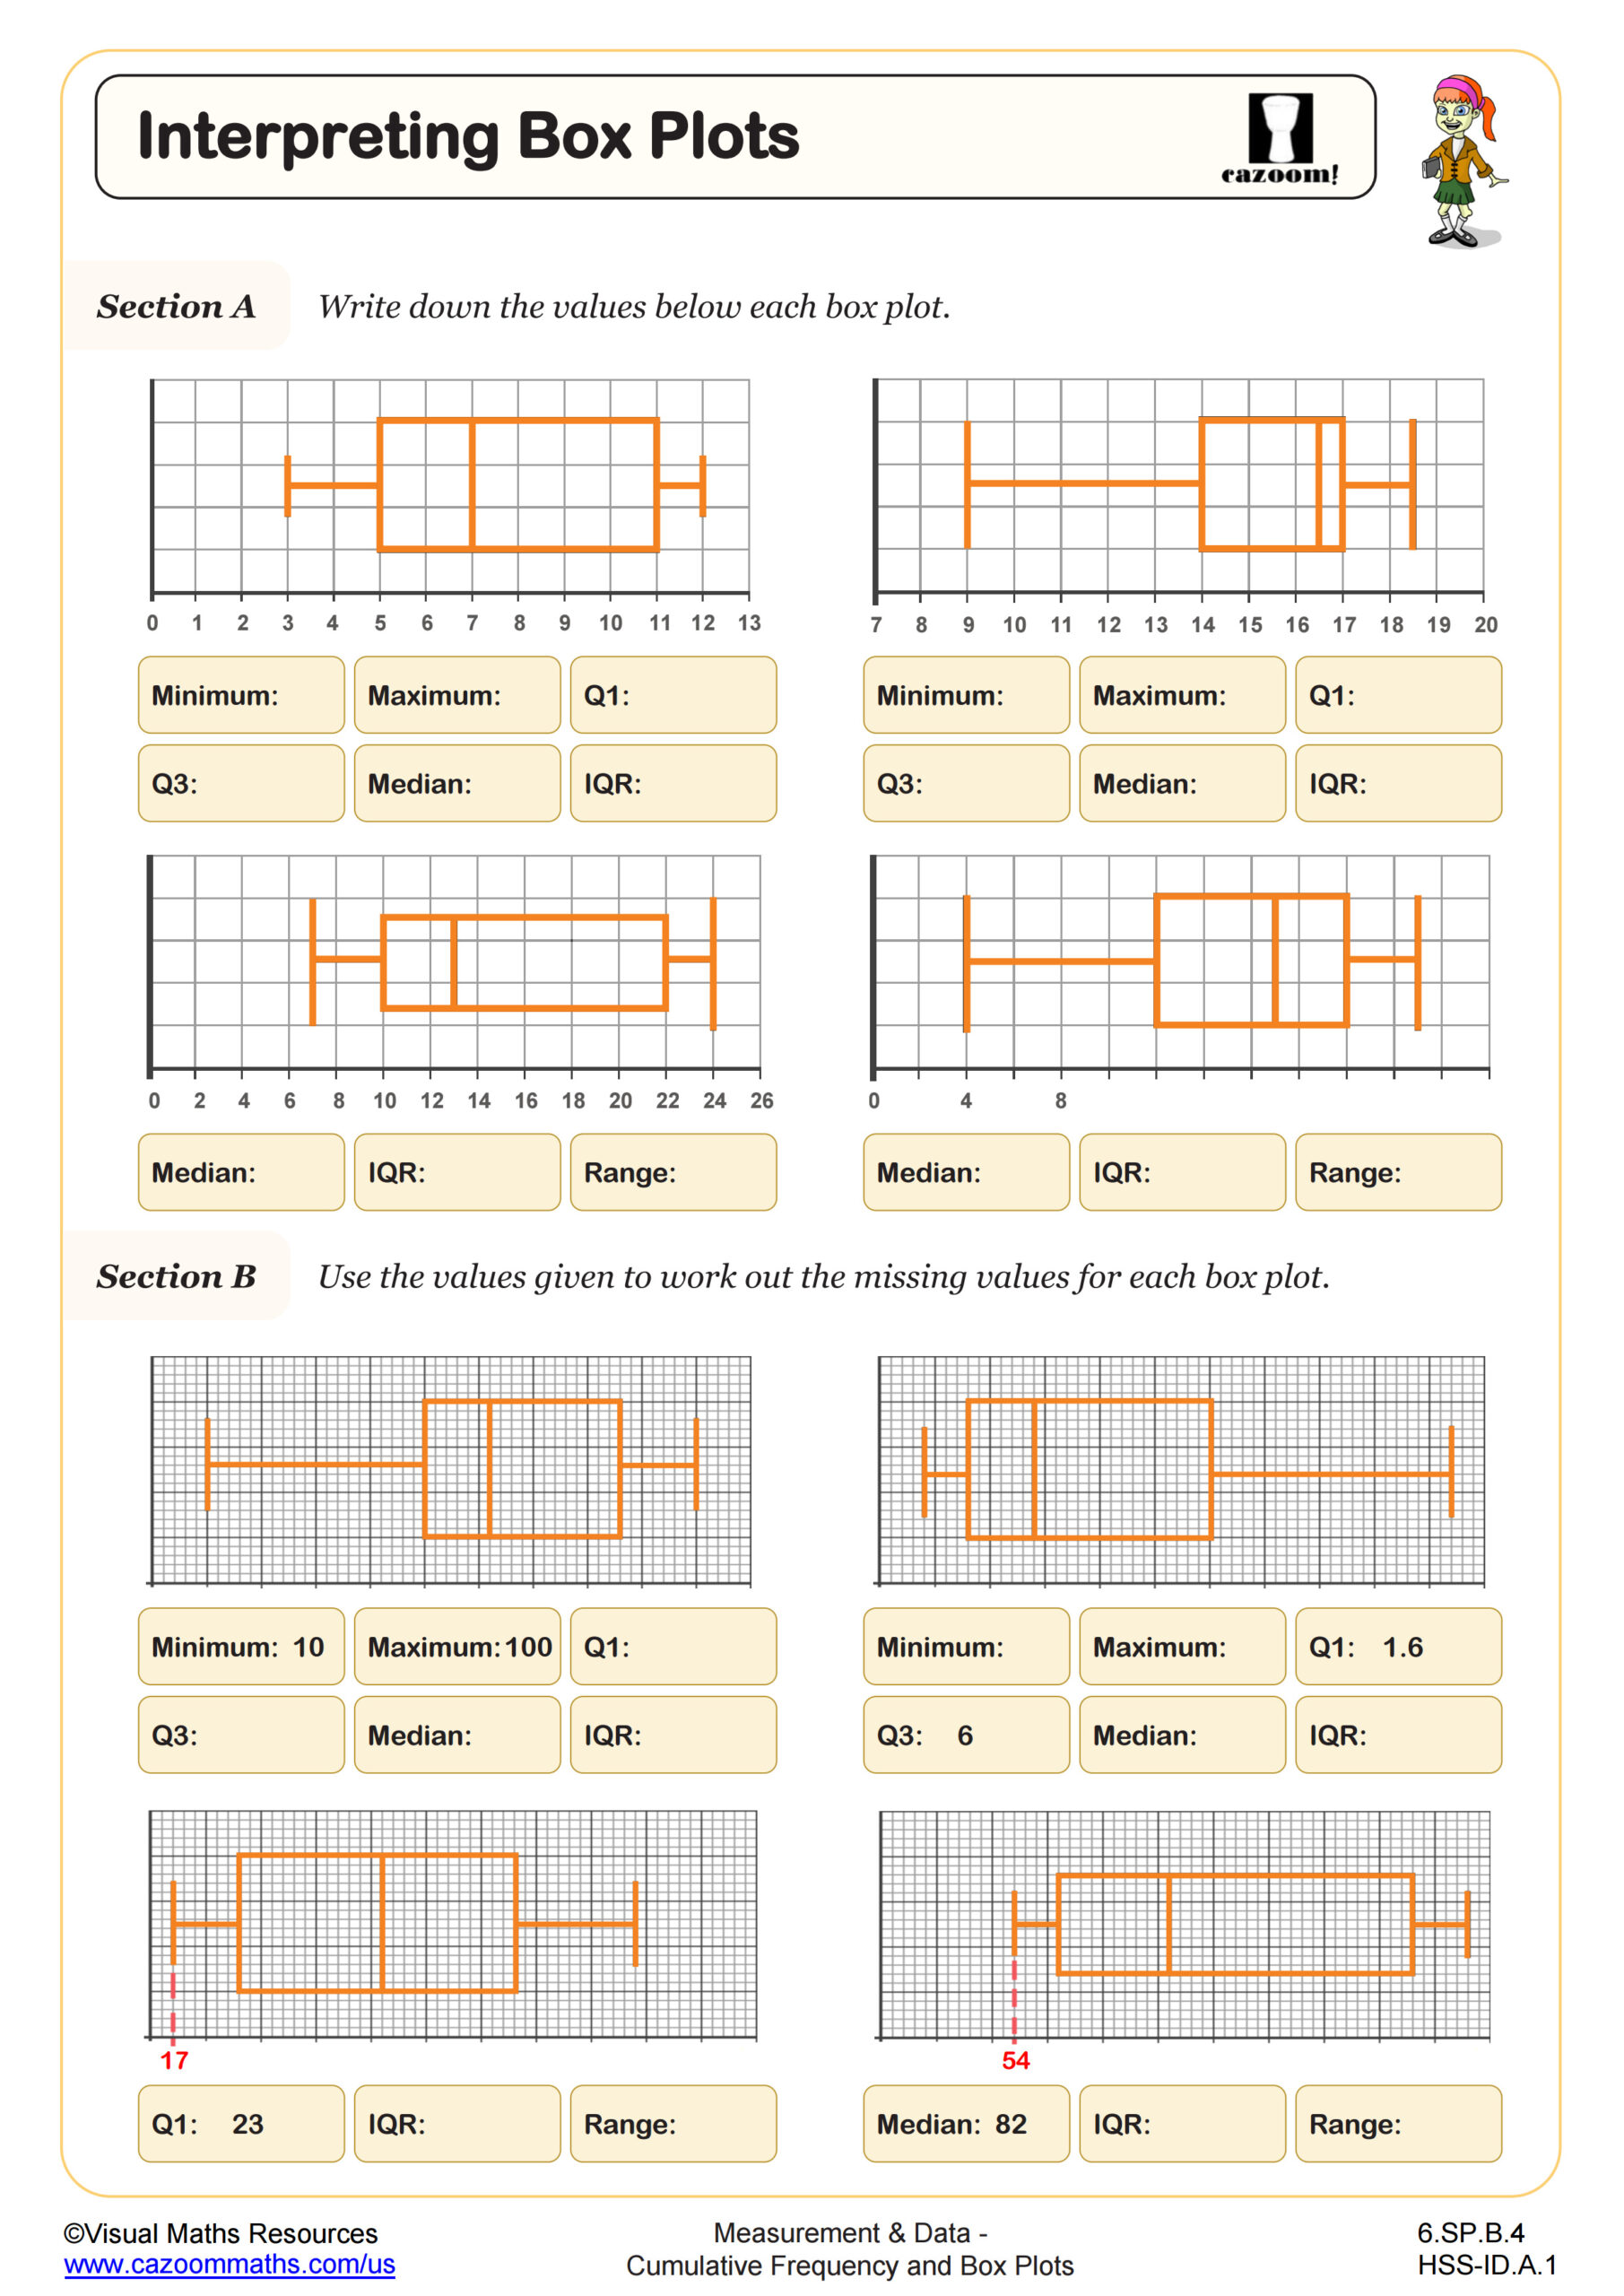
Box Plots (A)
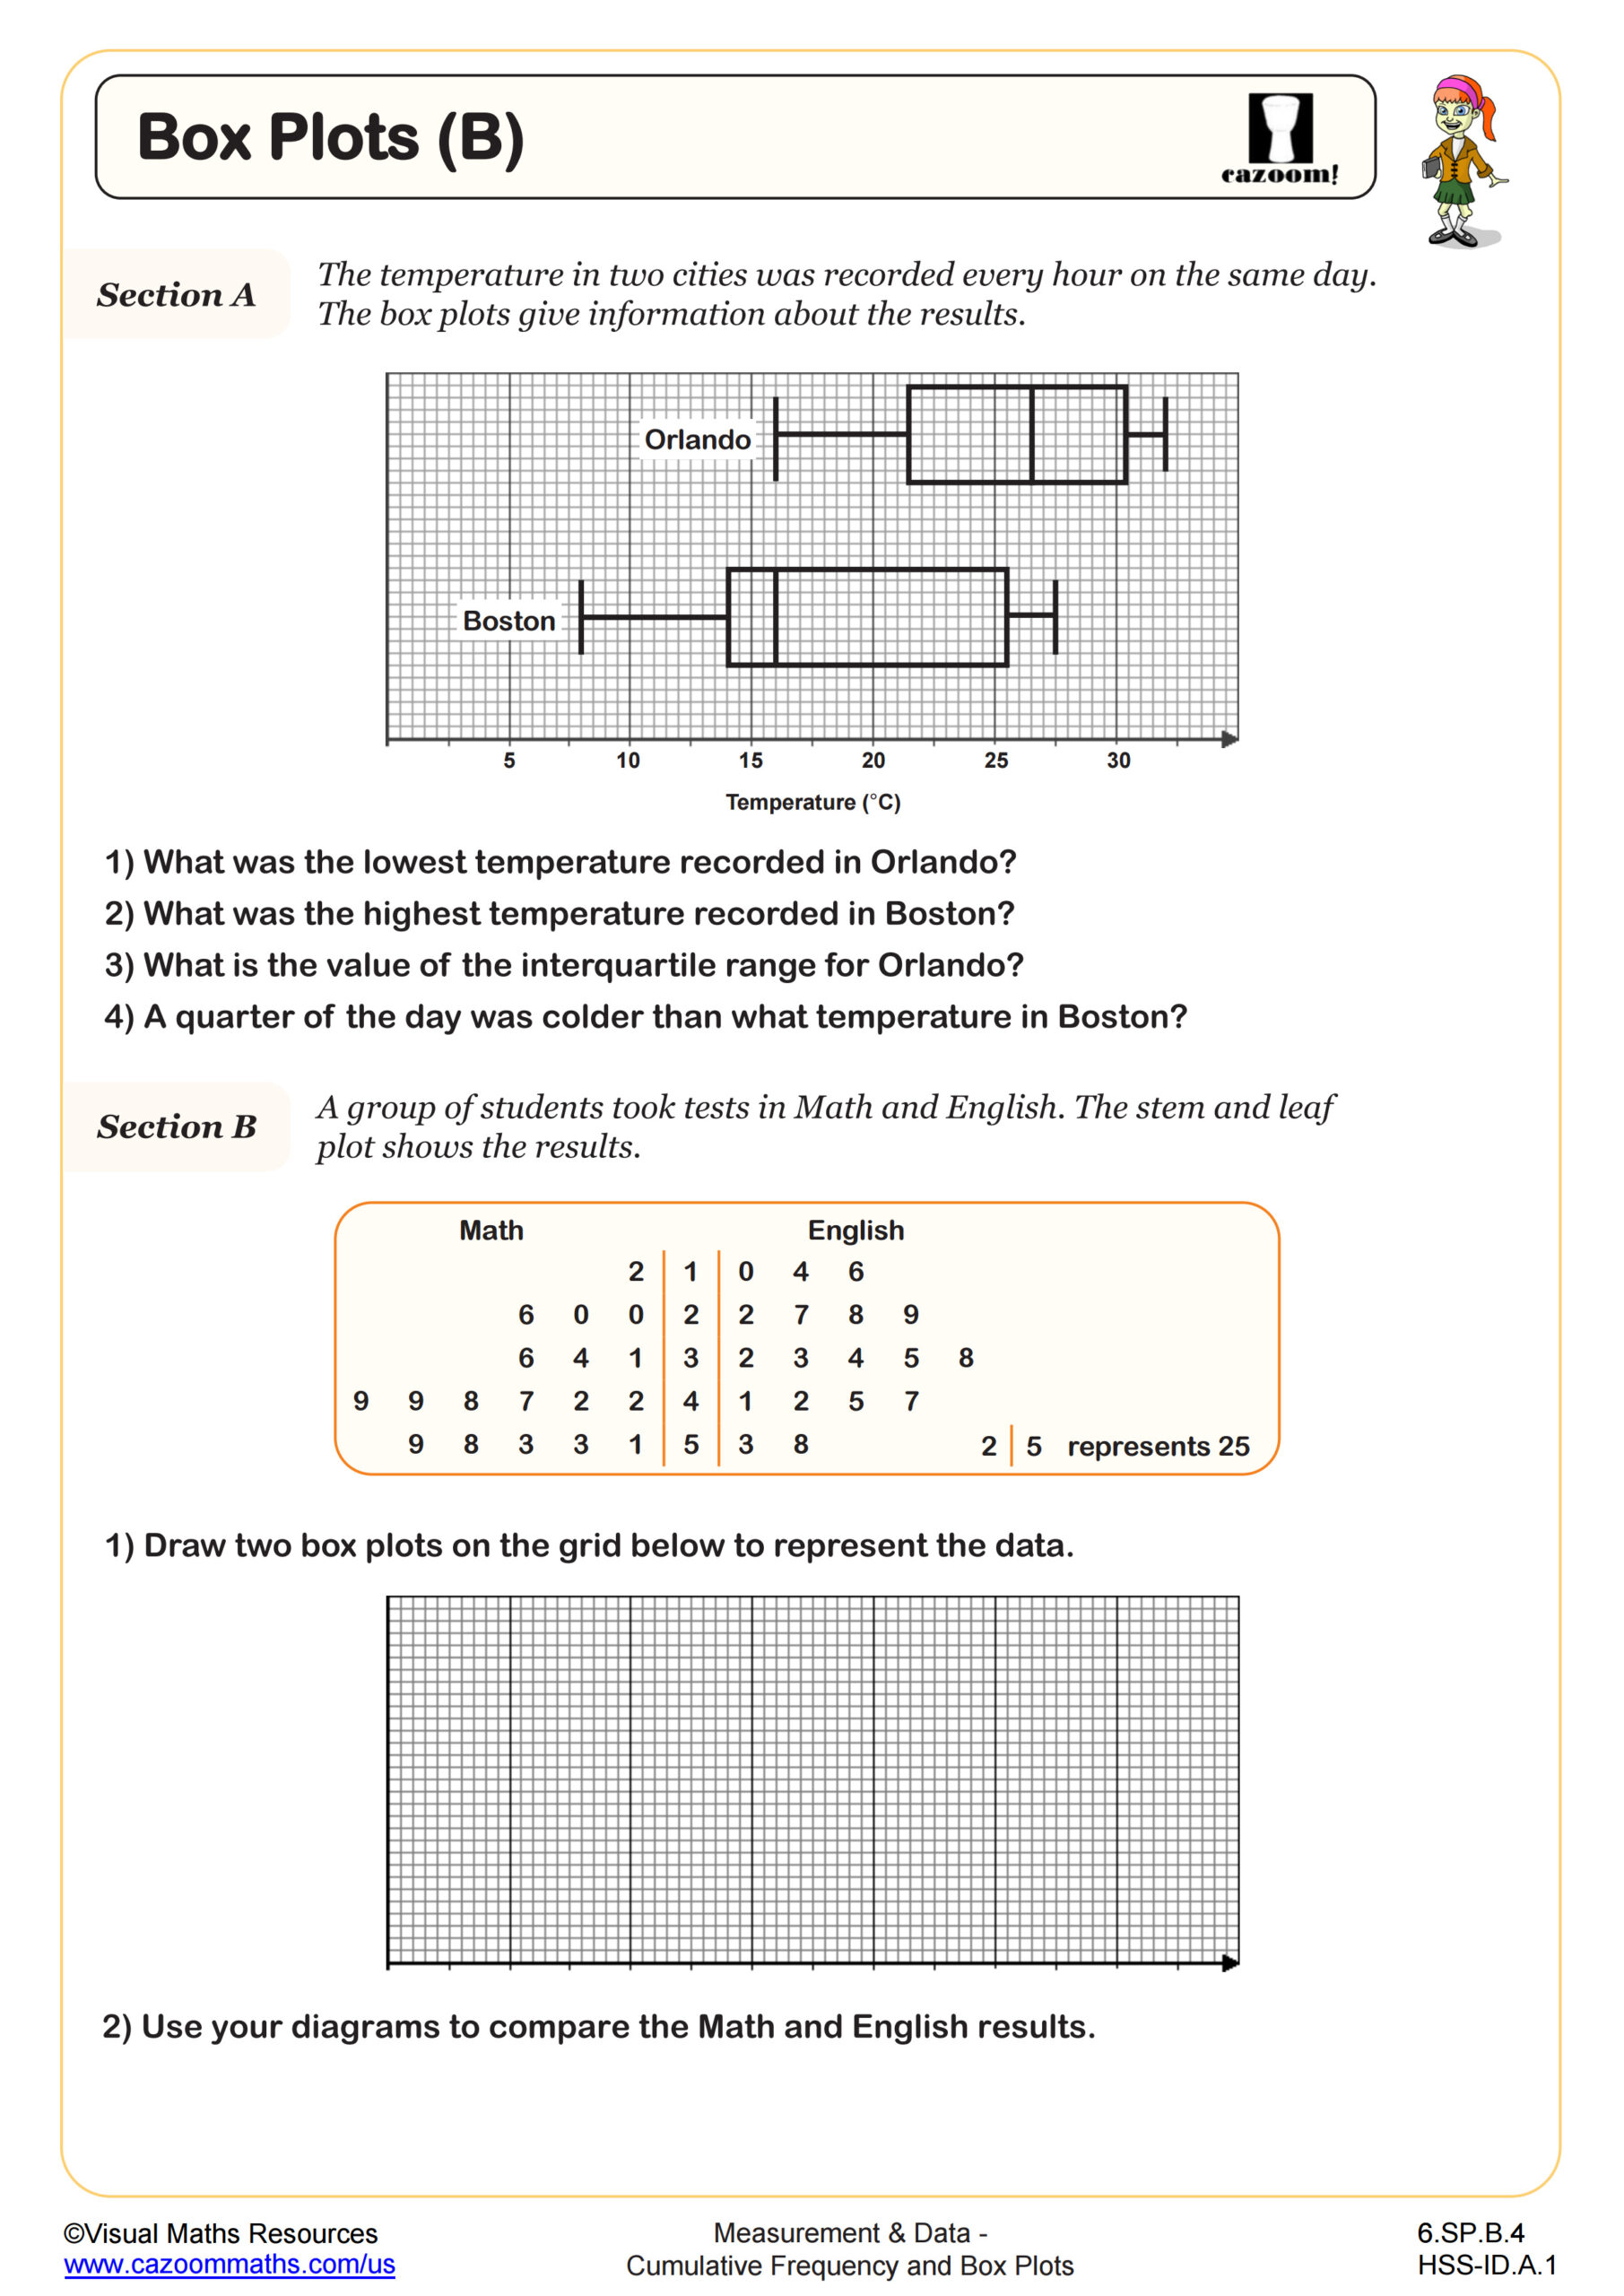
Box Plots (B)
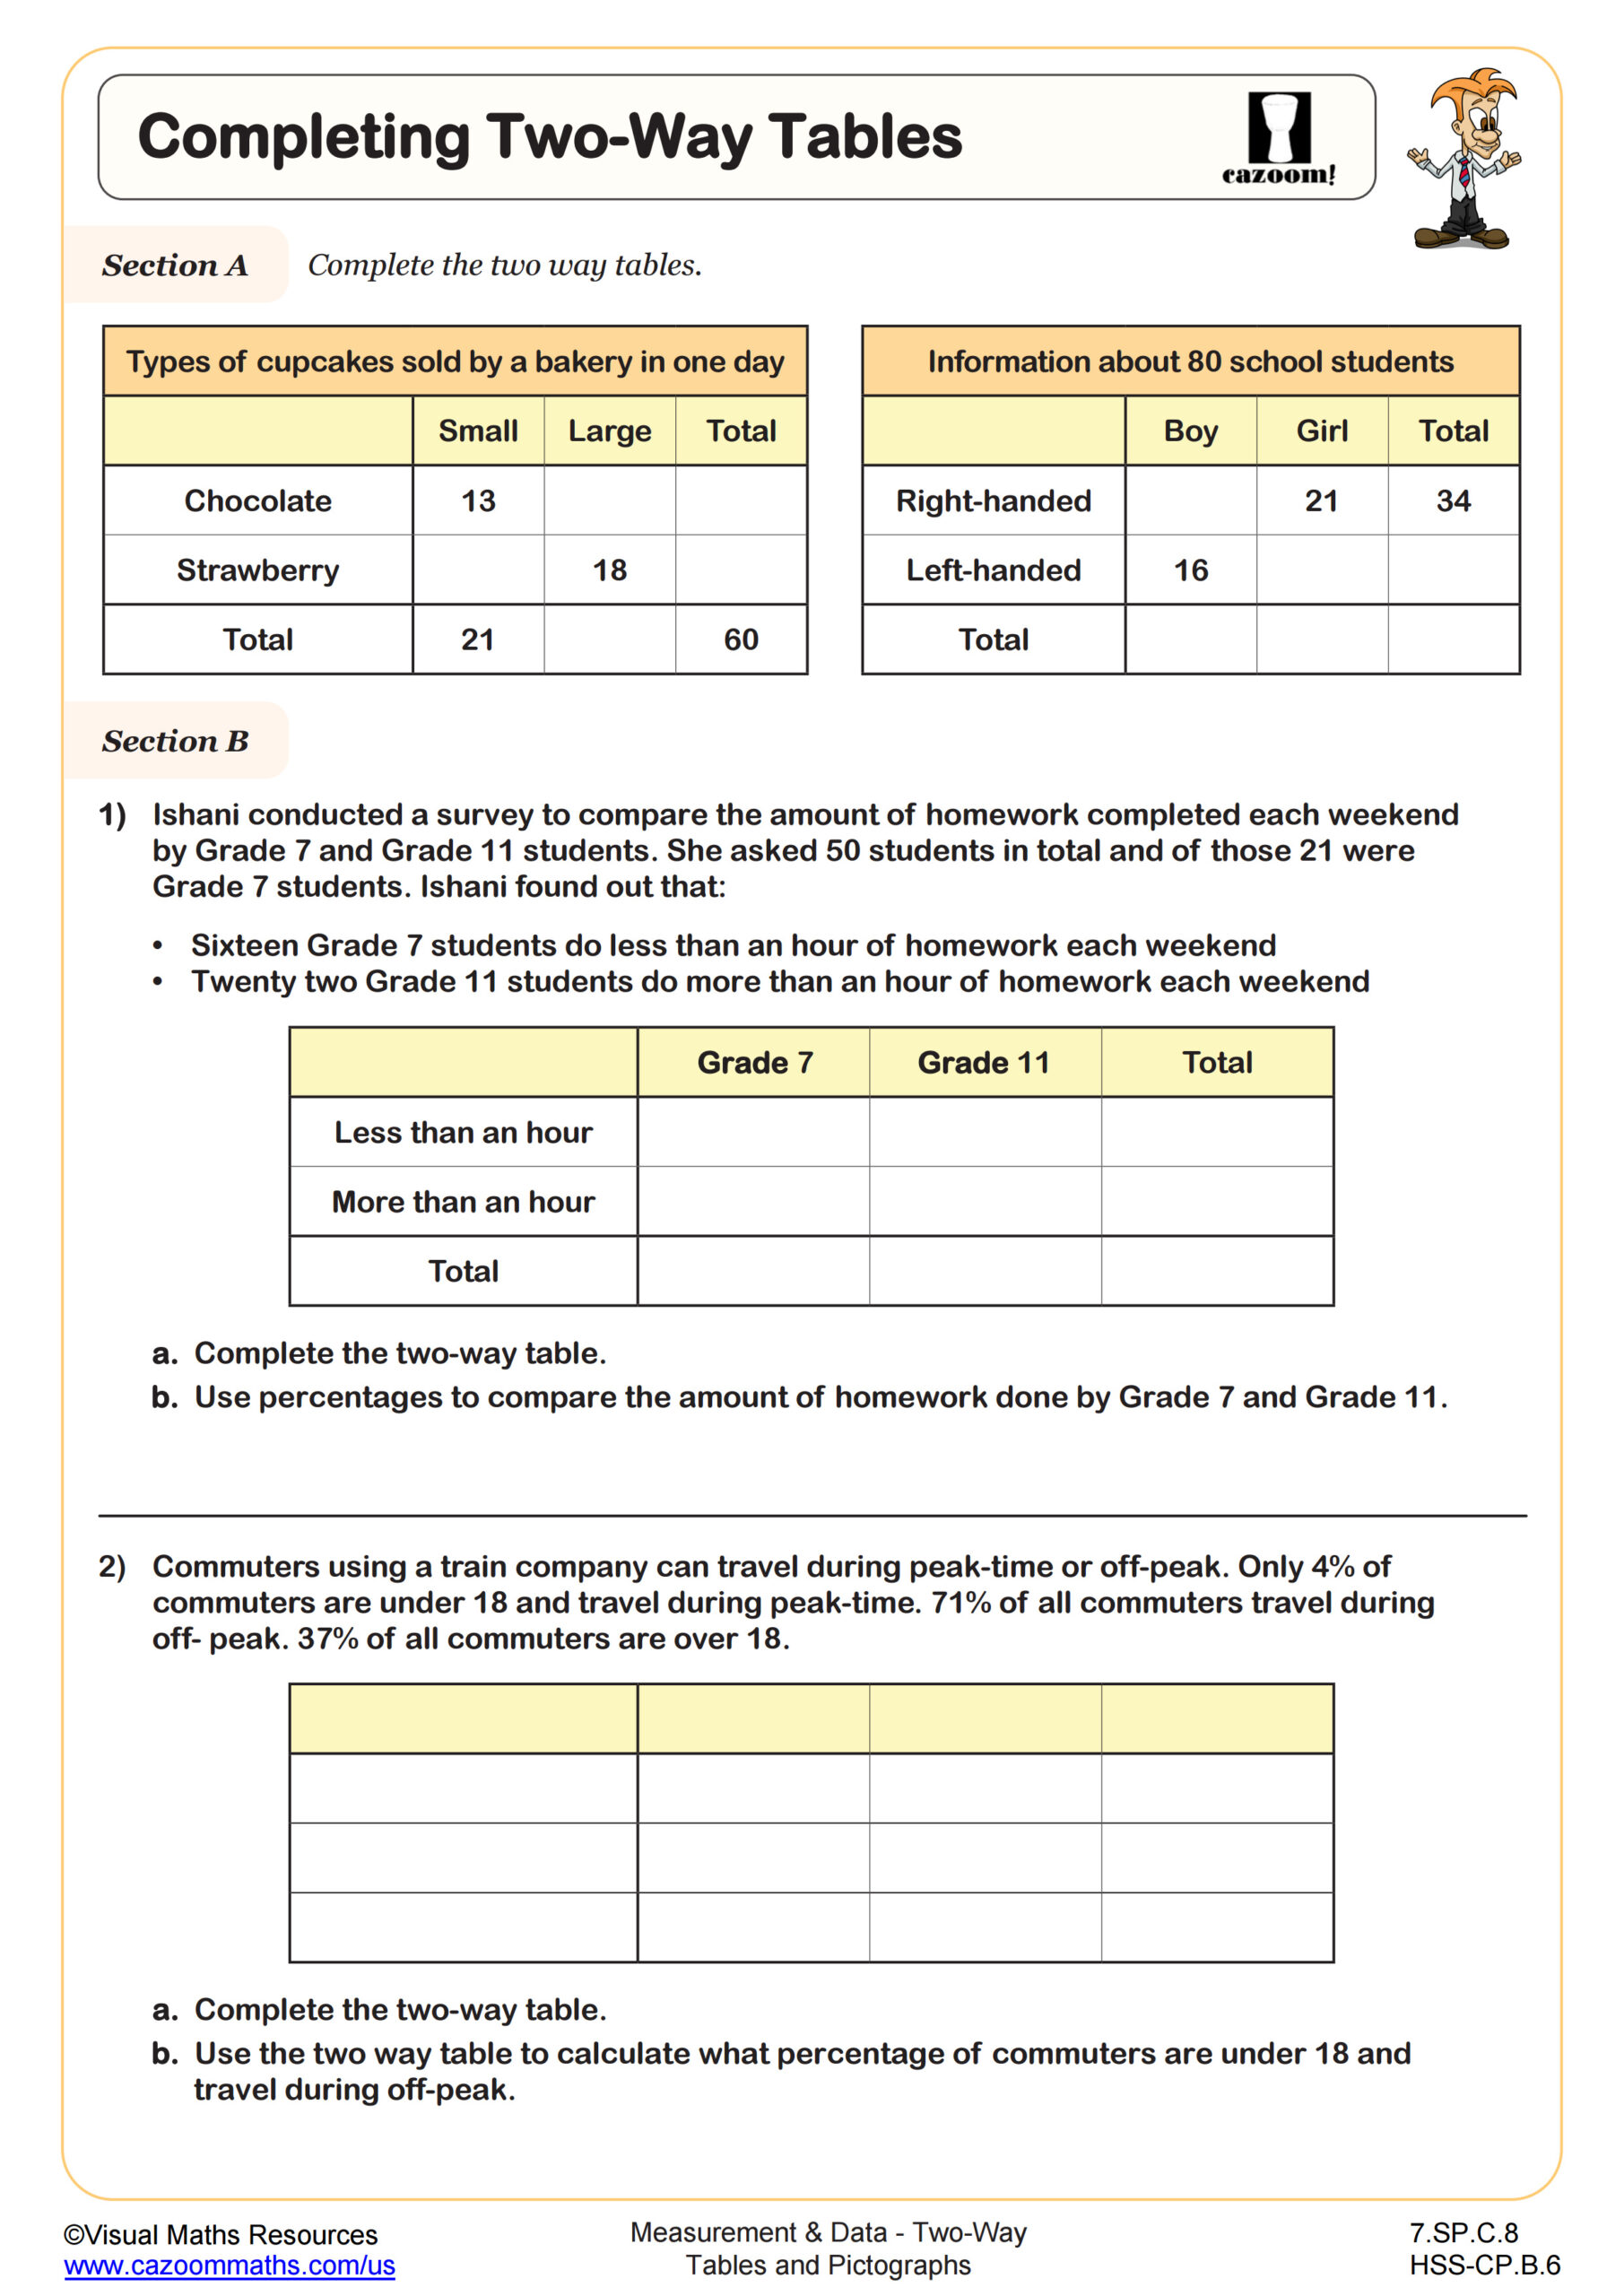
Completing Two-Way Tables
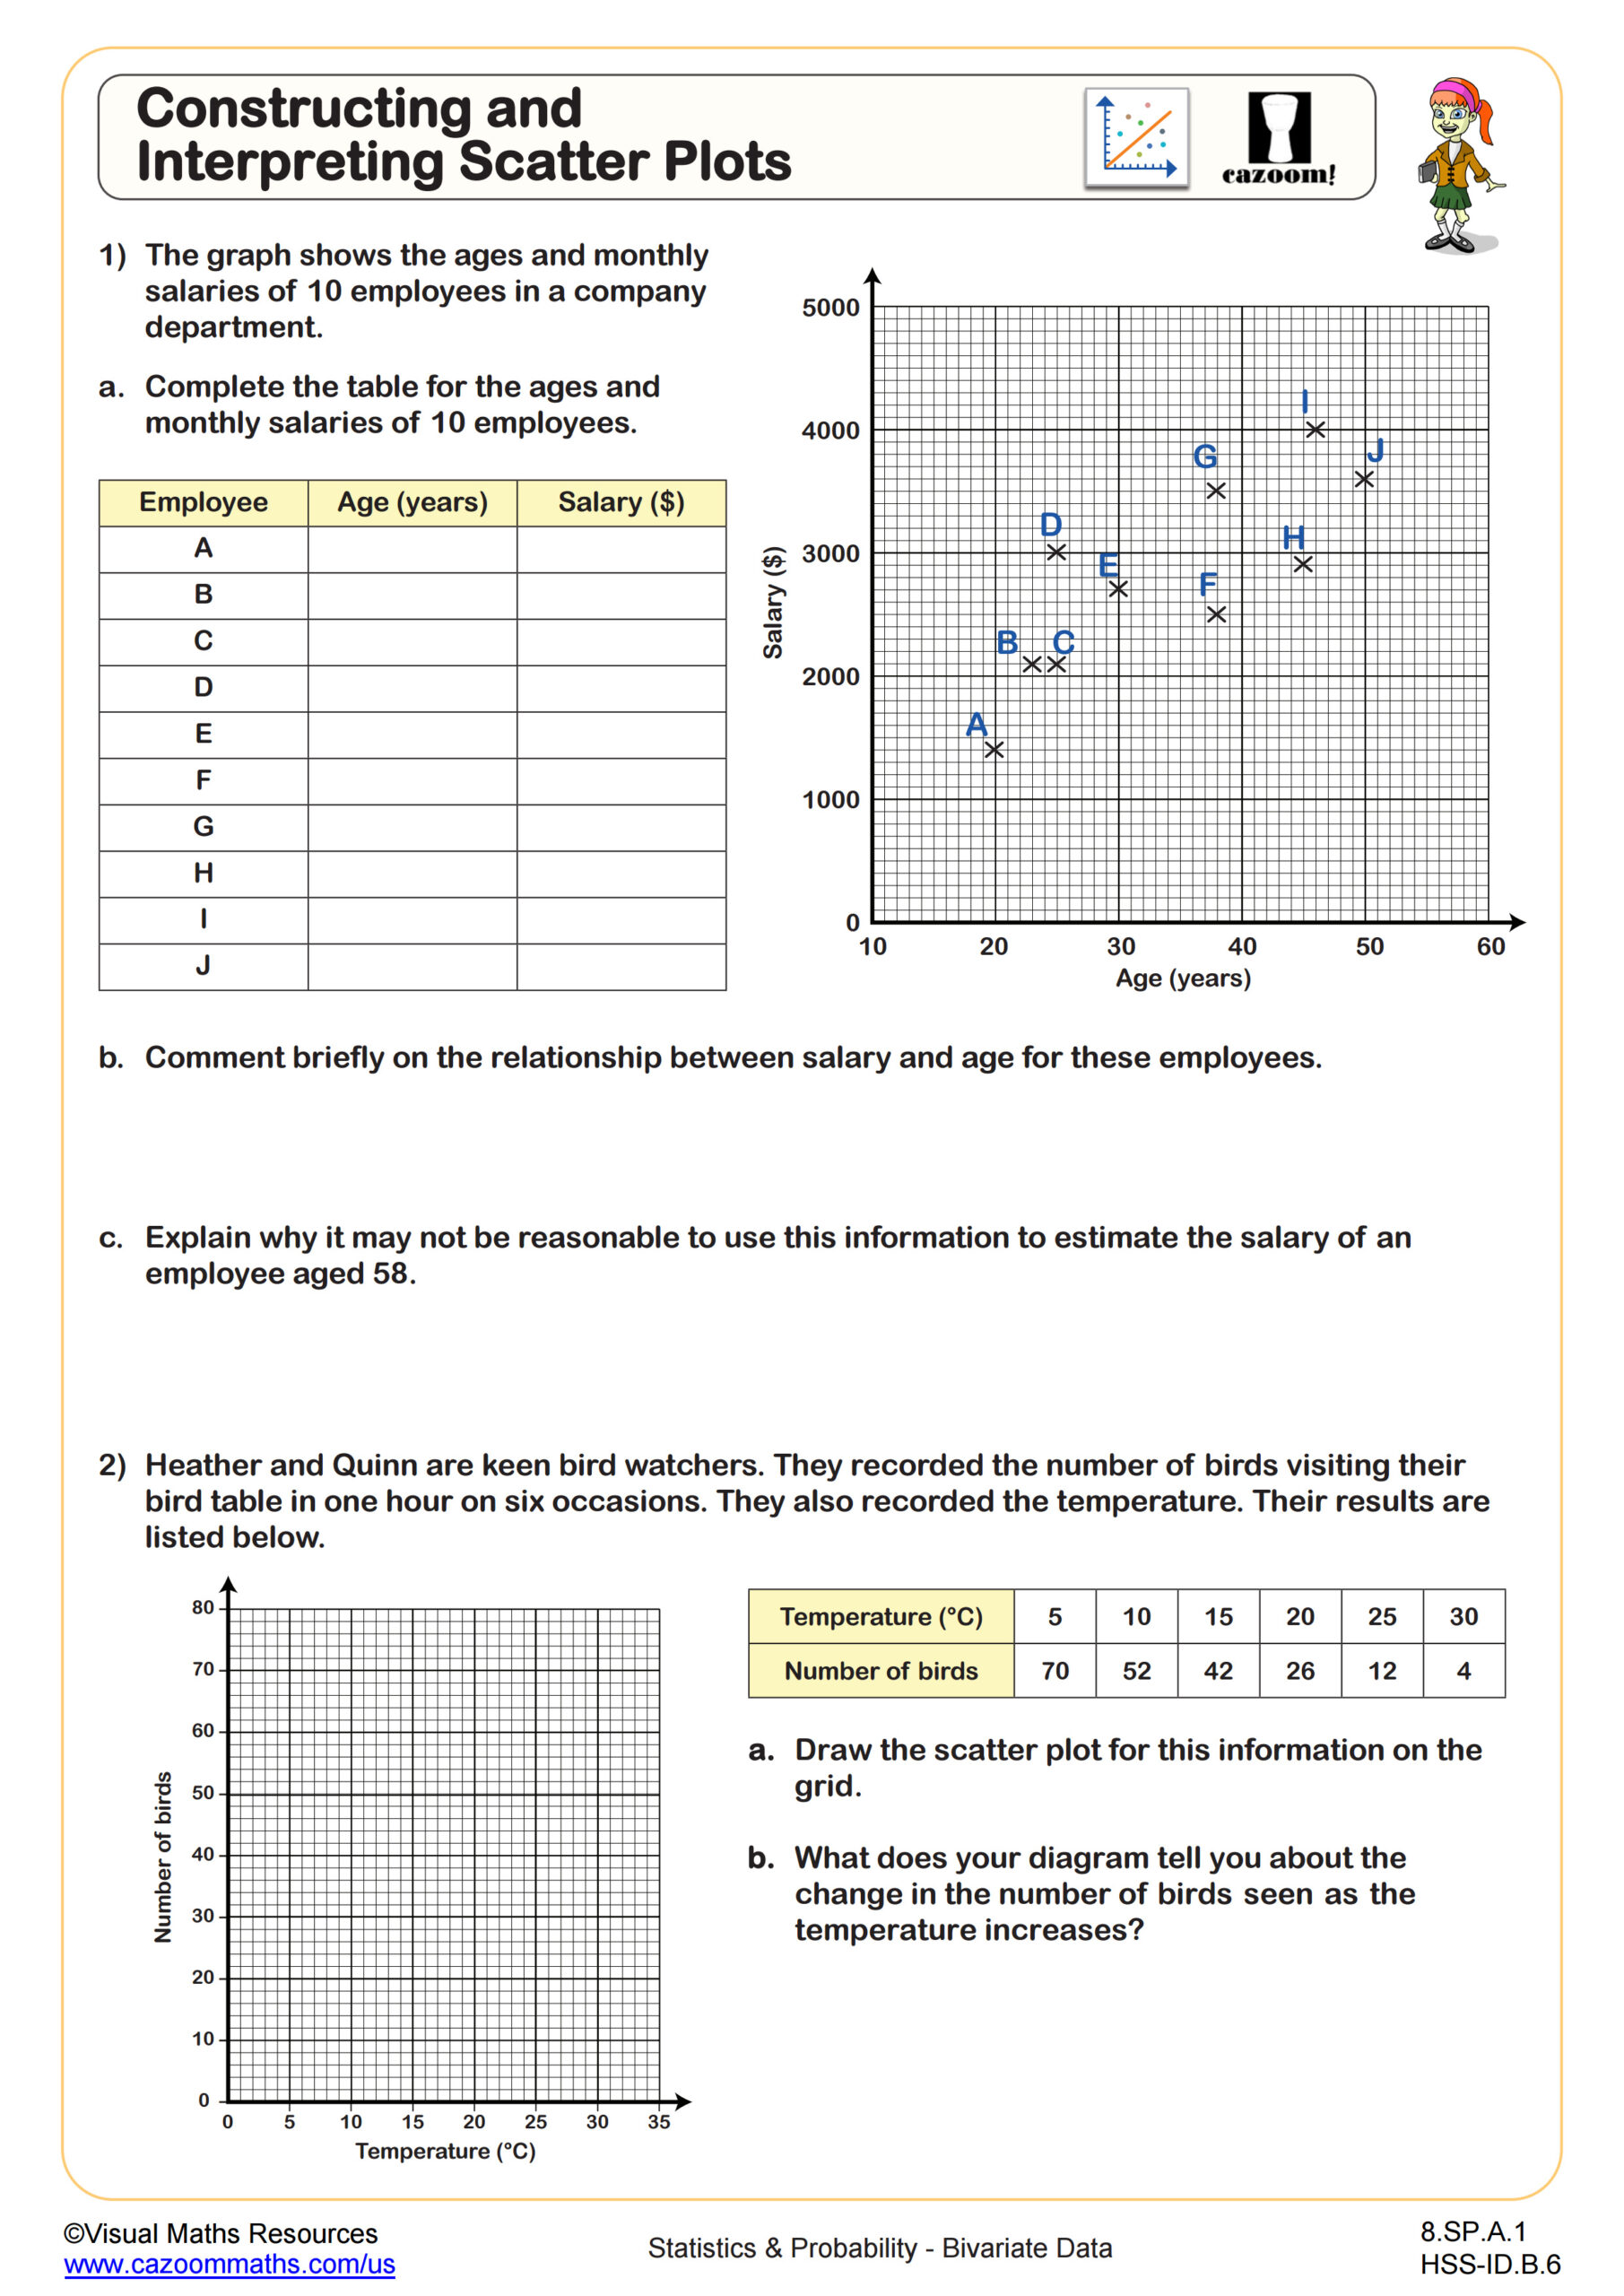
Constructing and Interpreting Scatter Plots
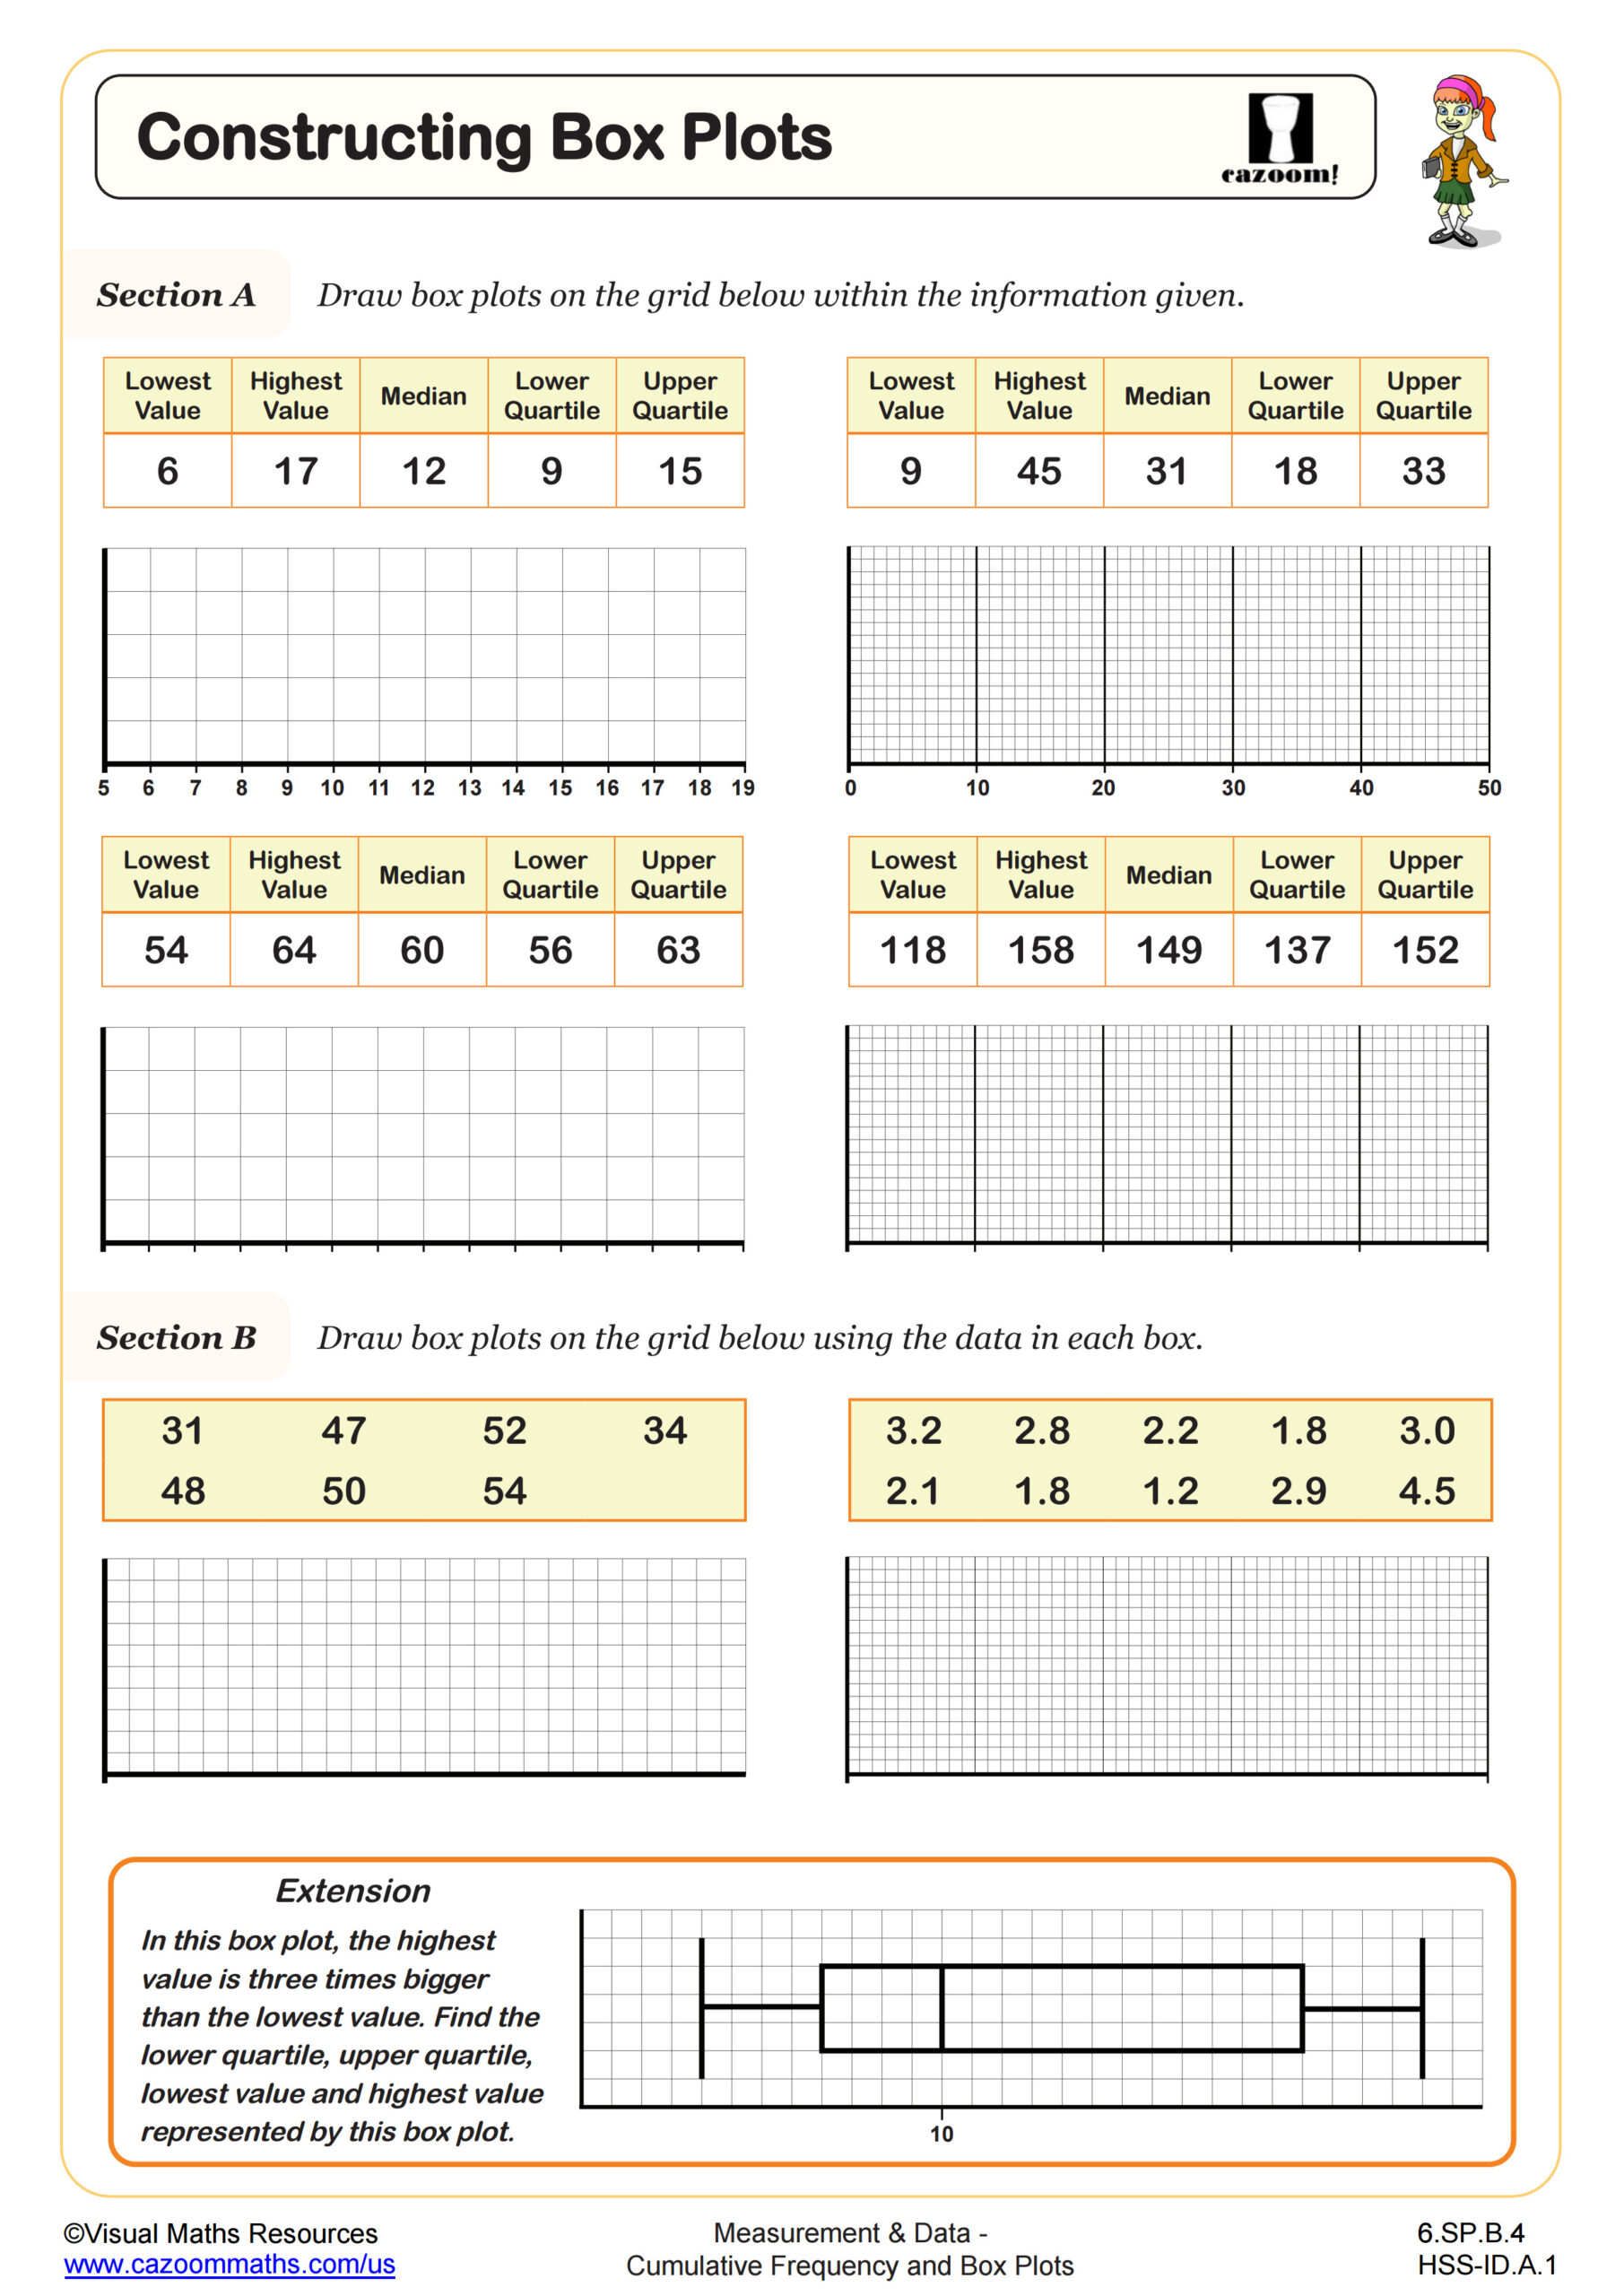
Constructing Box Plots
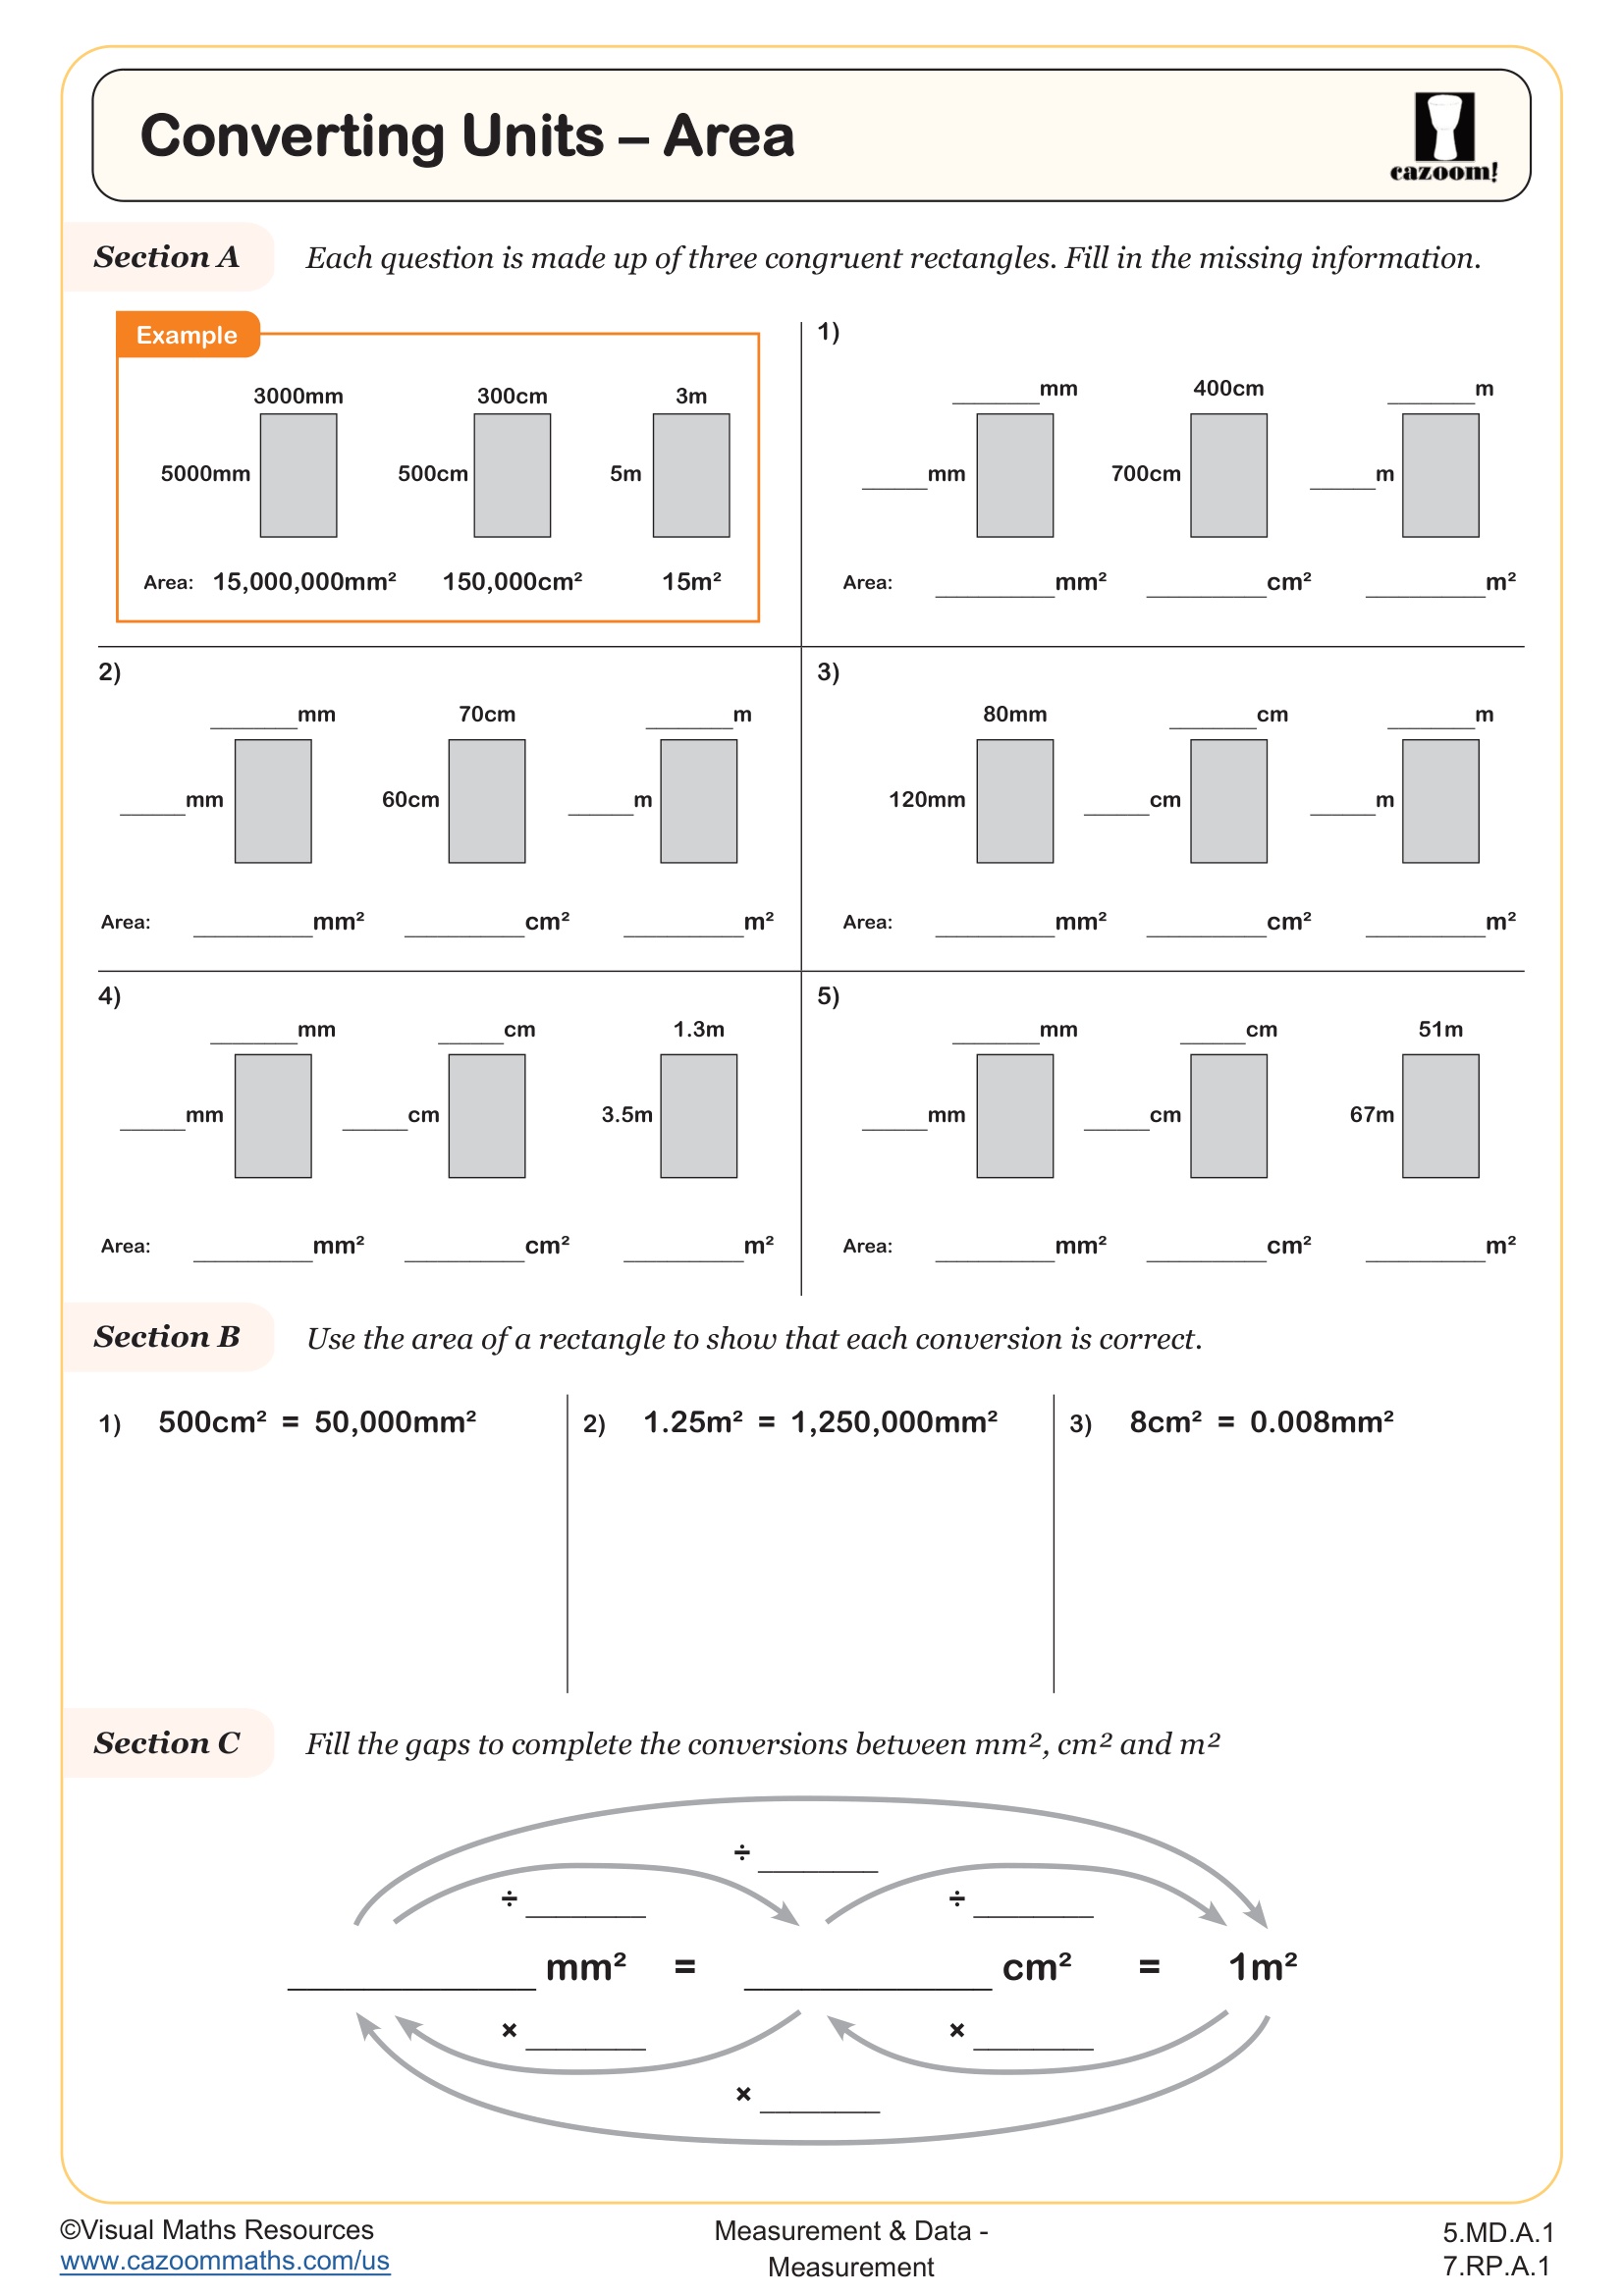
Converting Units - Area
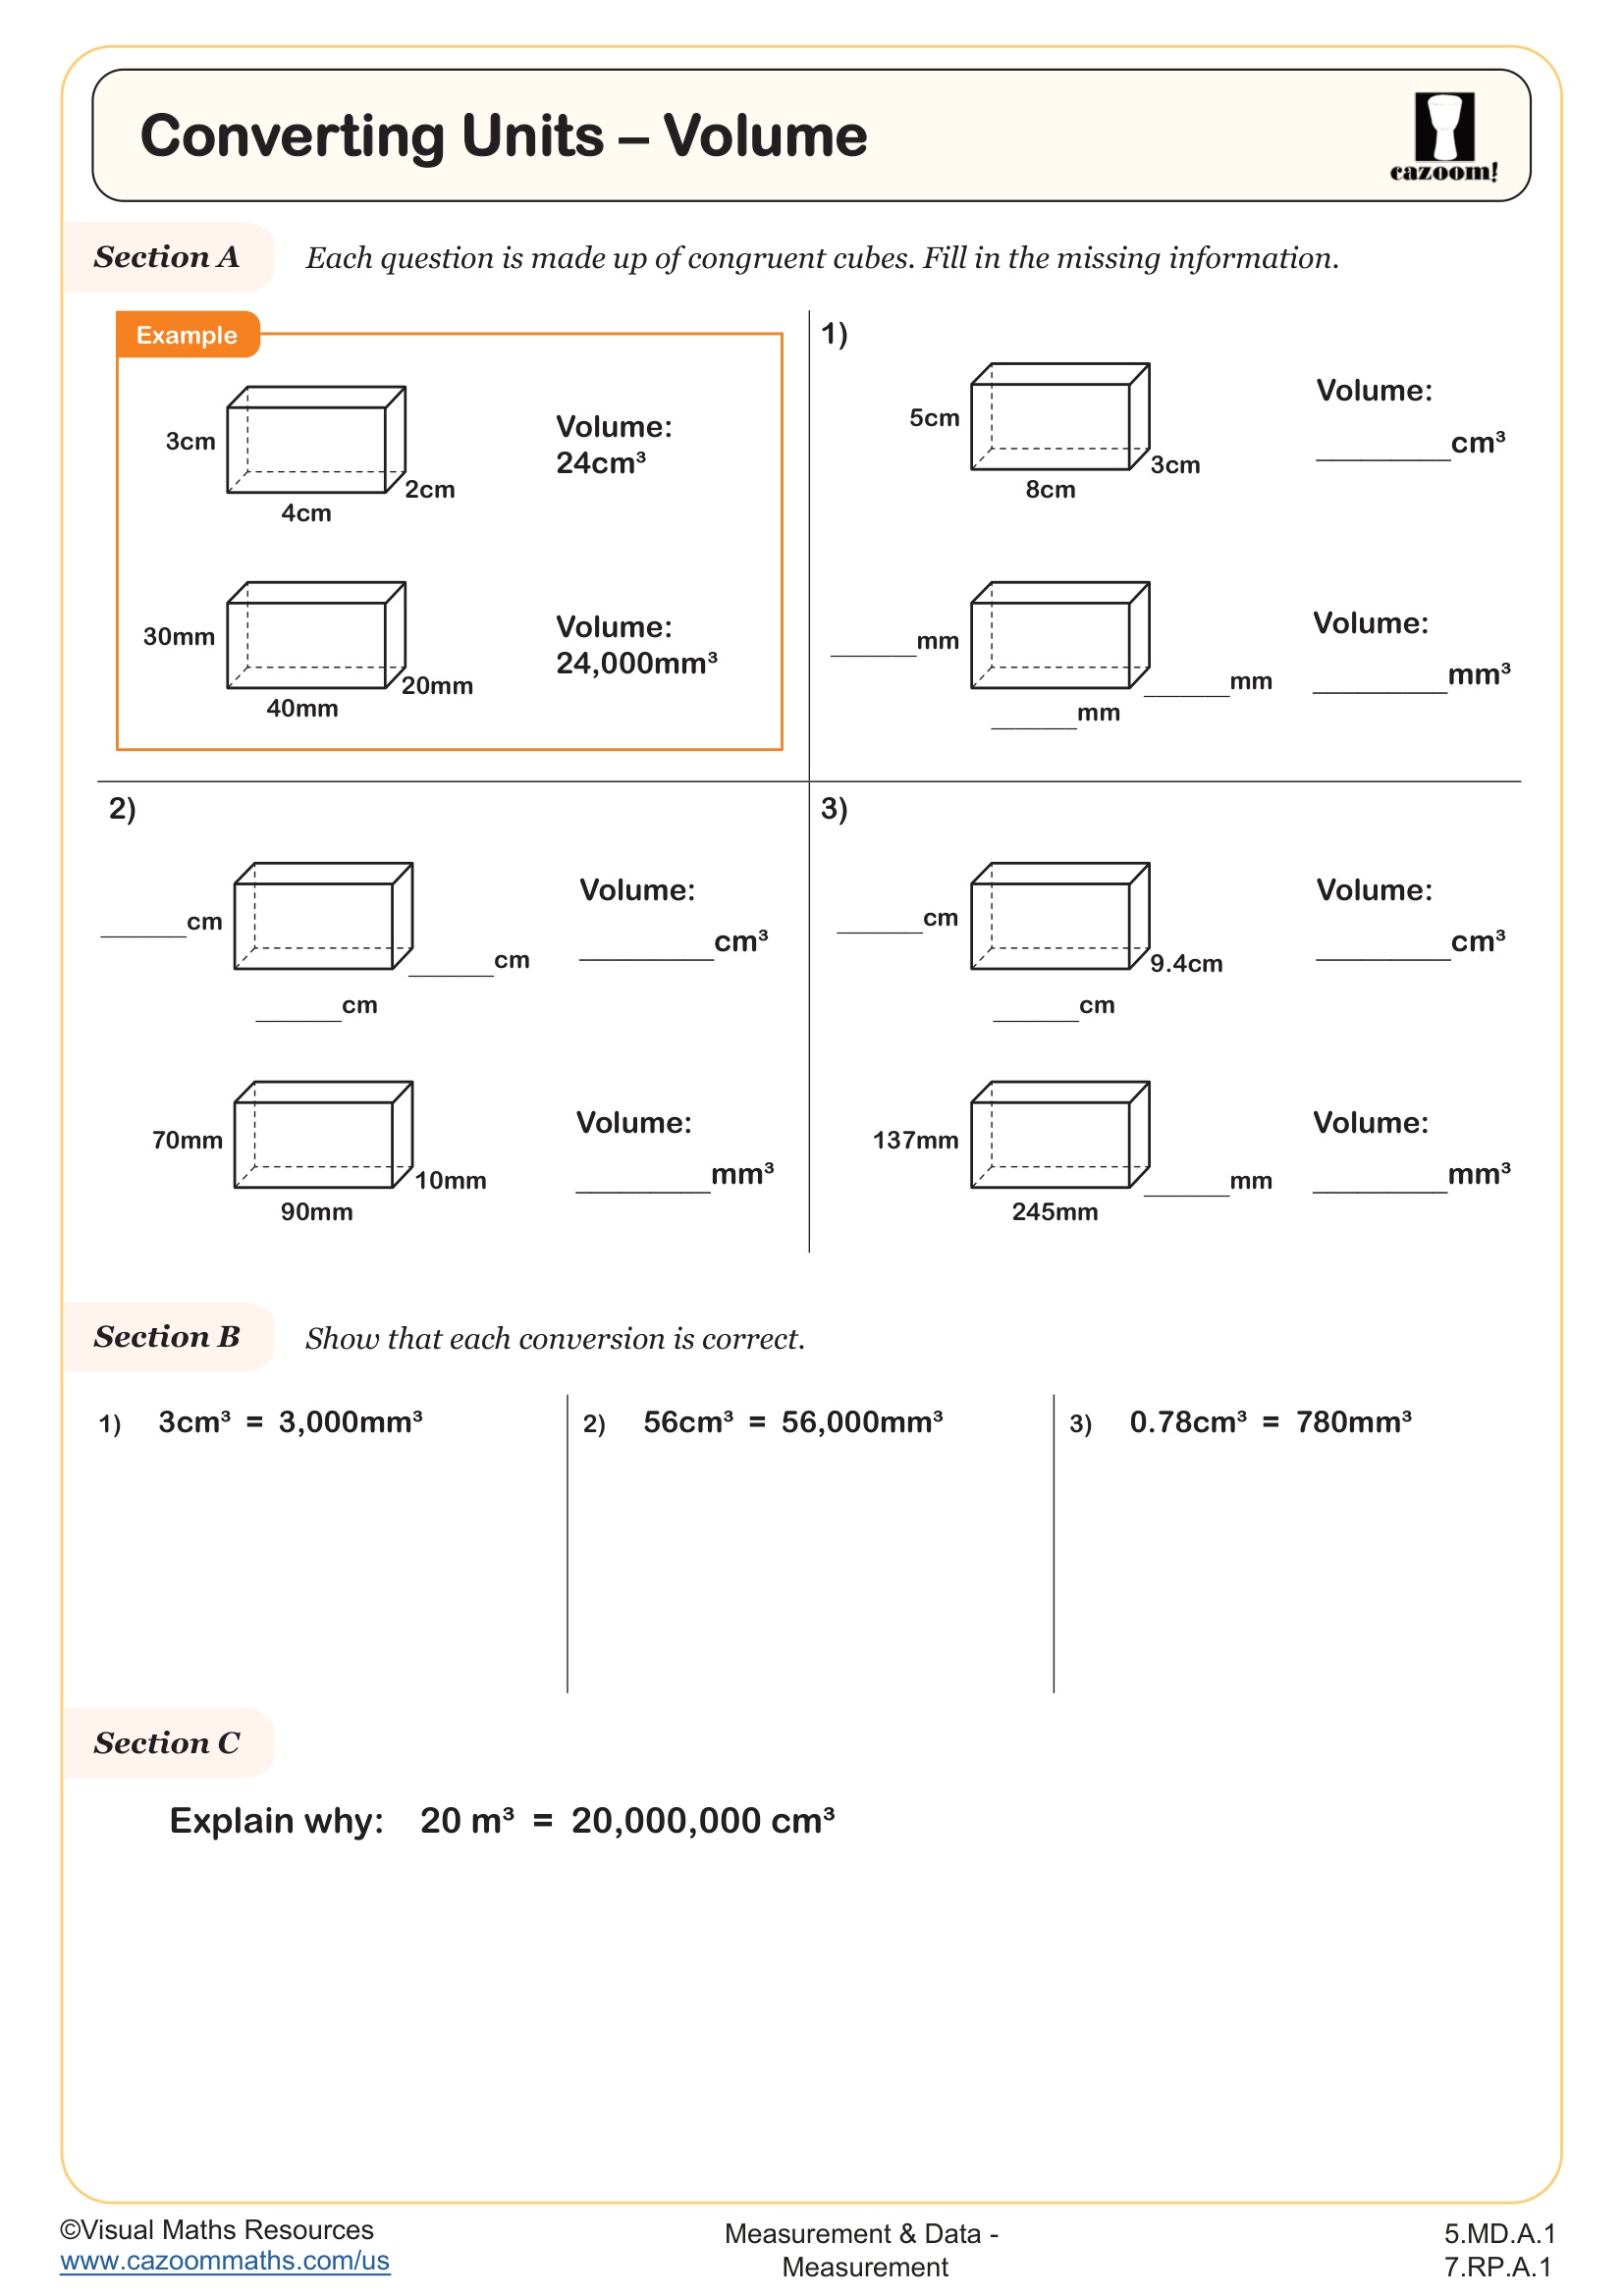
Converting Units - Volume
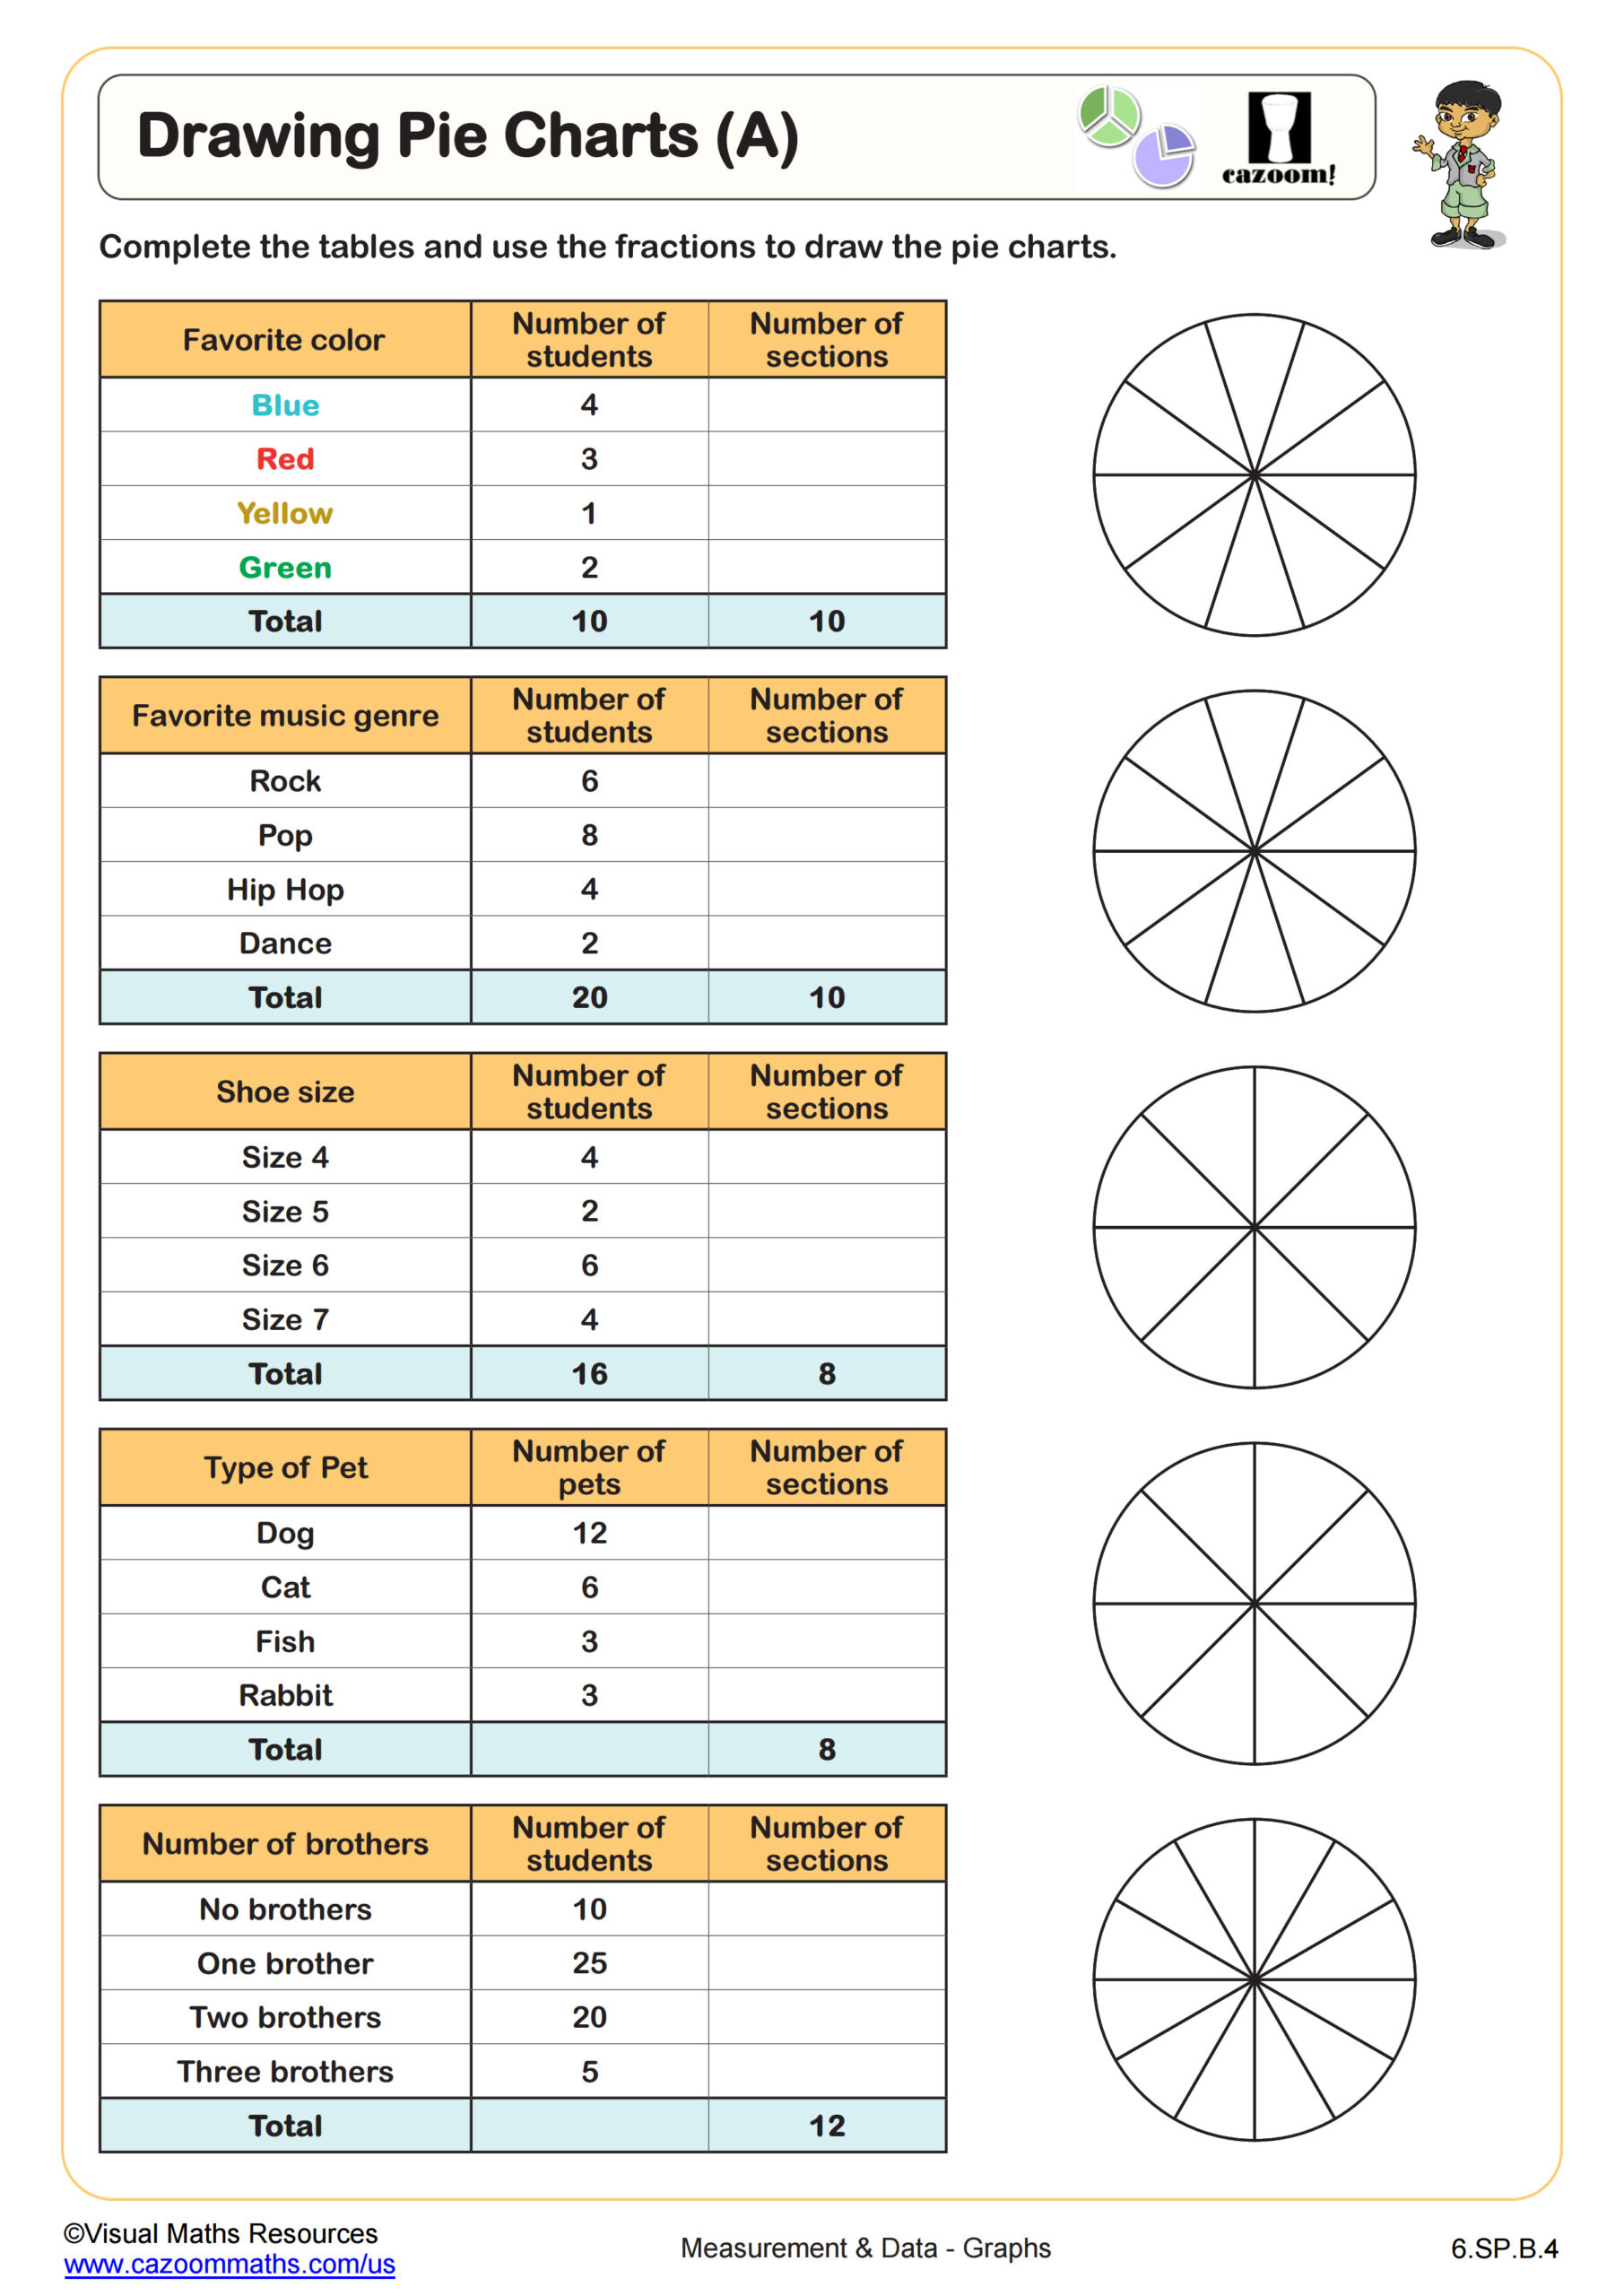
Drawing Pie Charts (A)
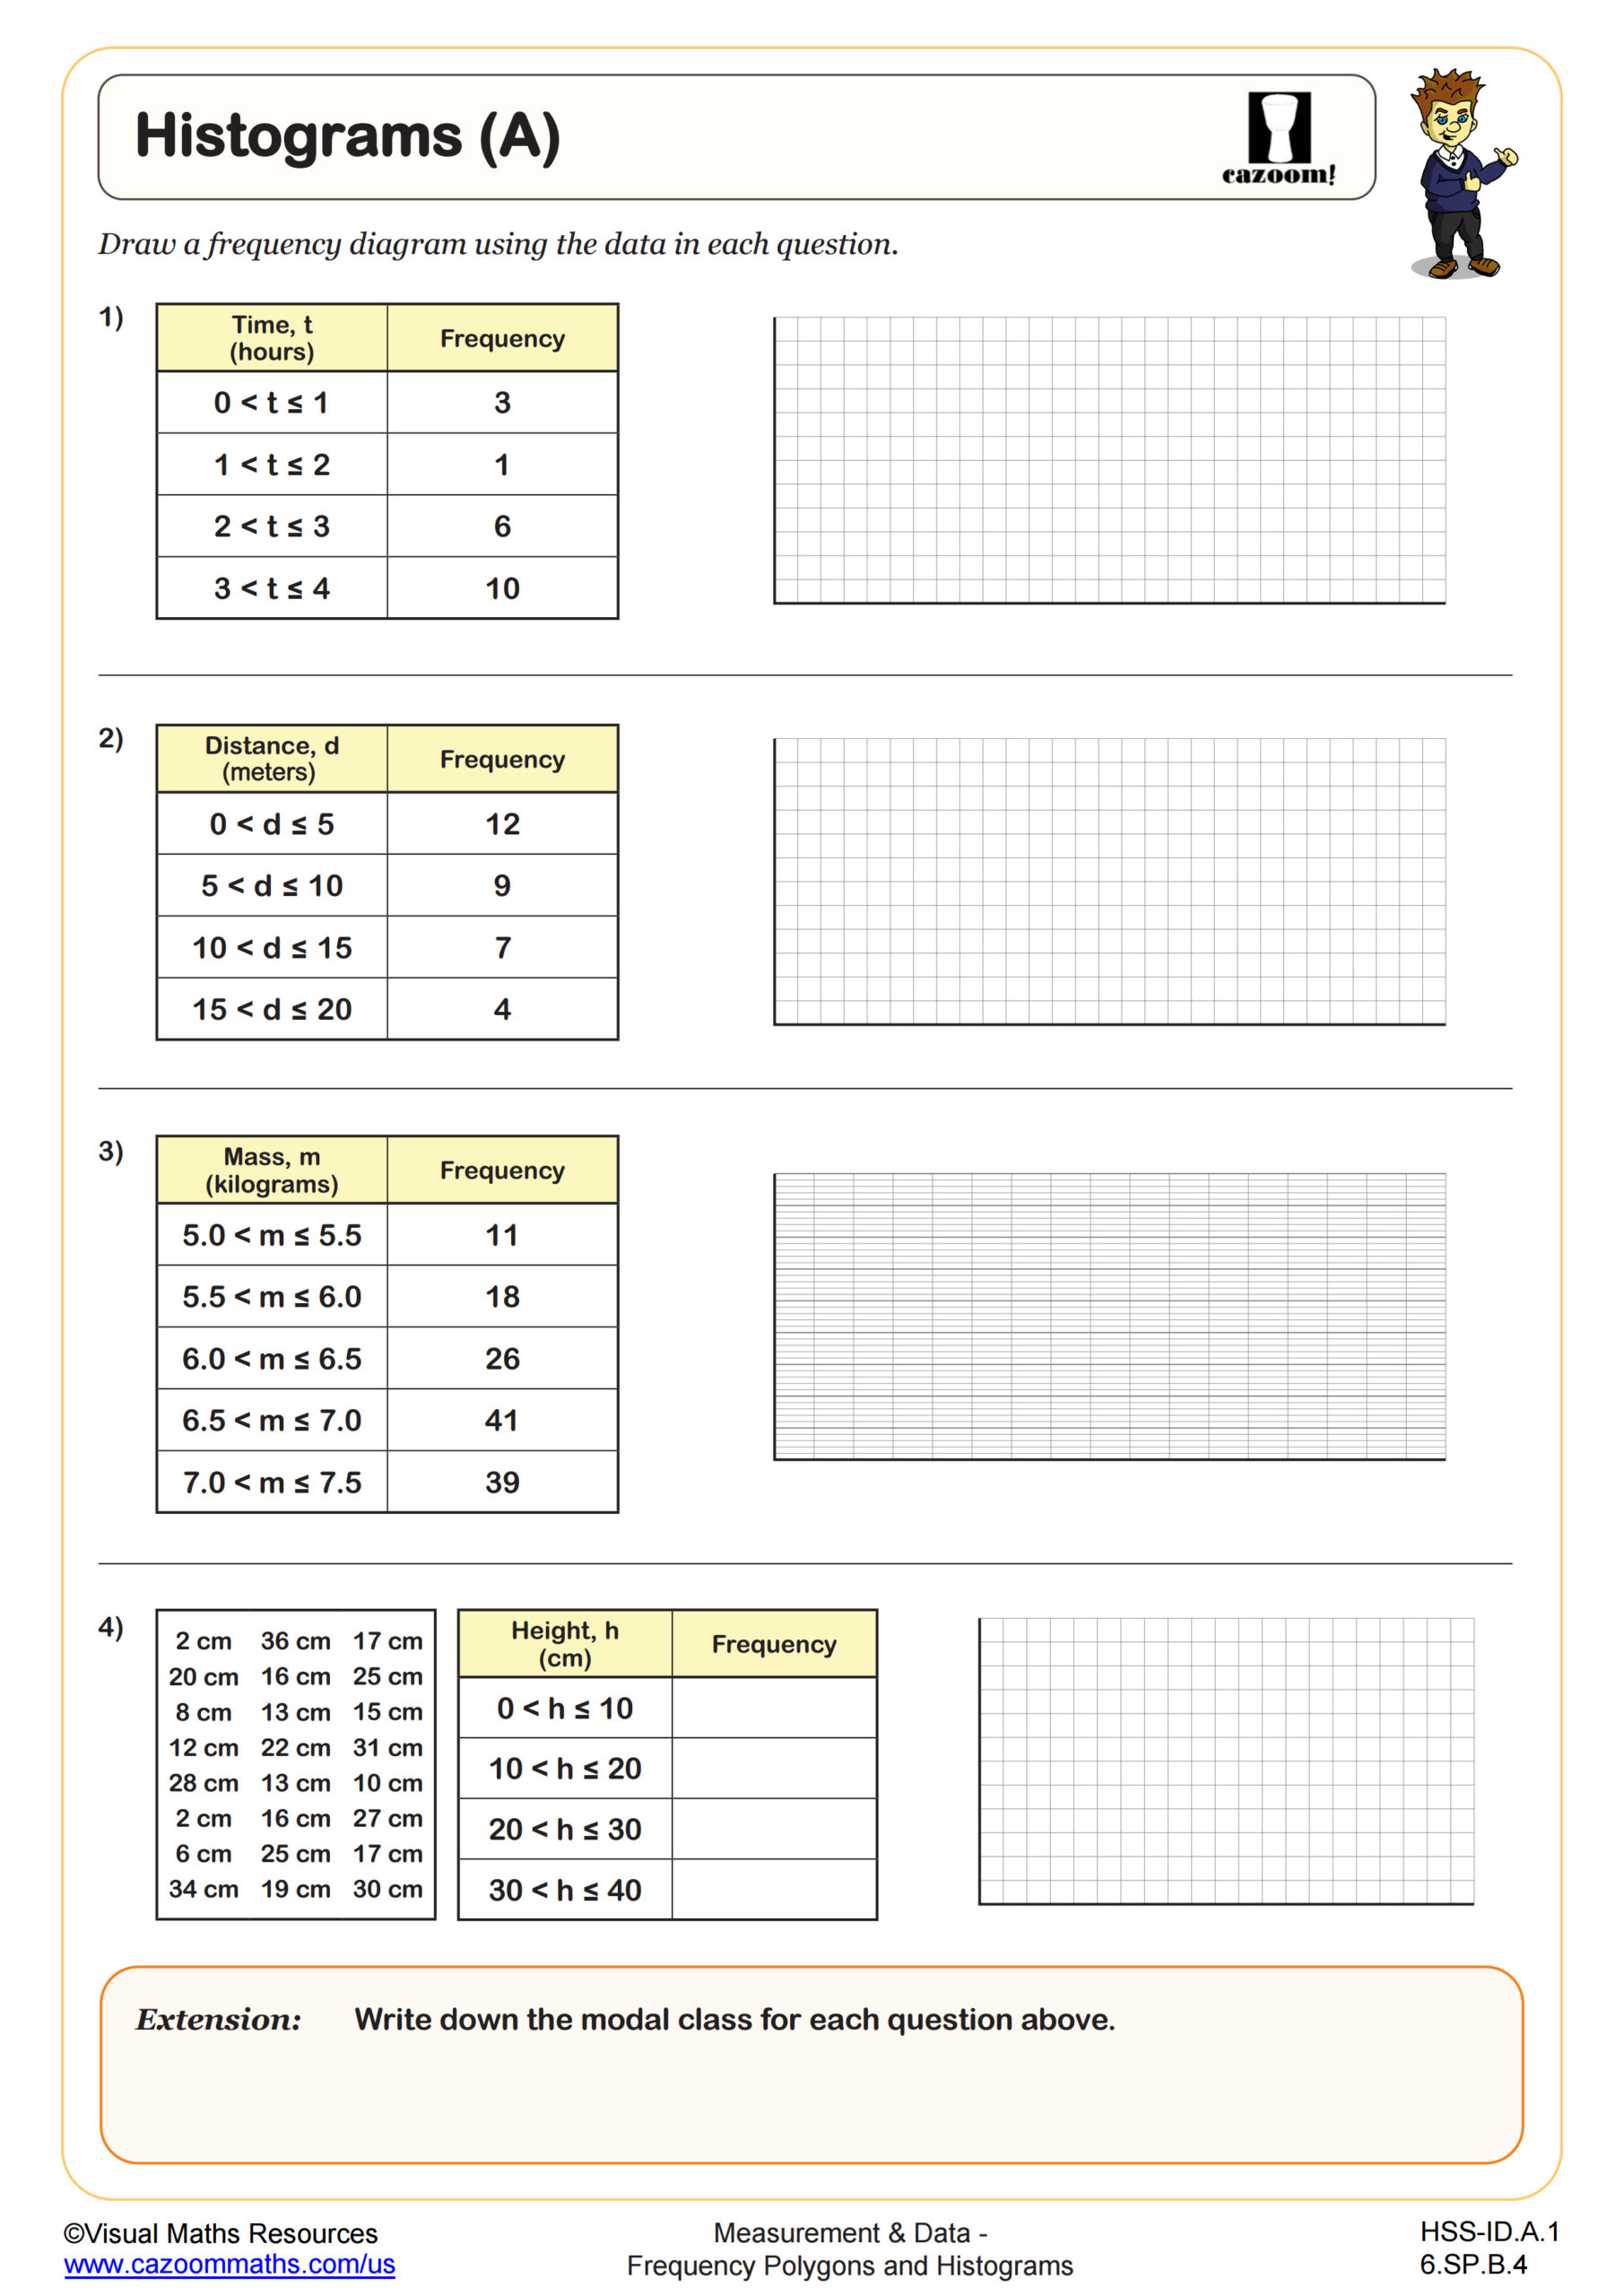
Histograms (A)
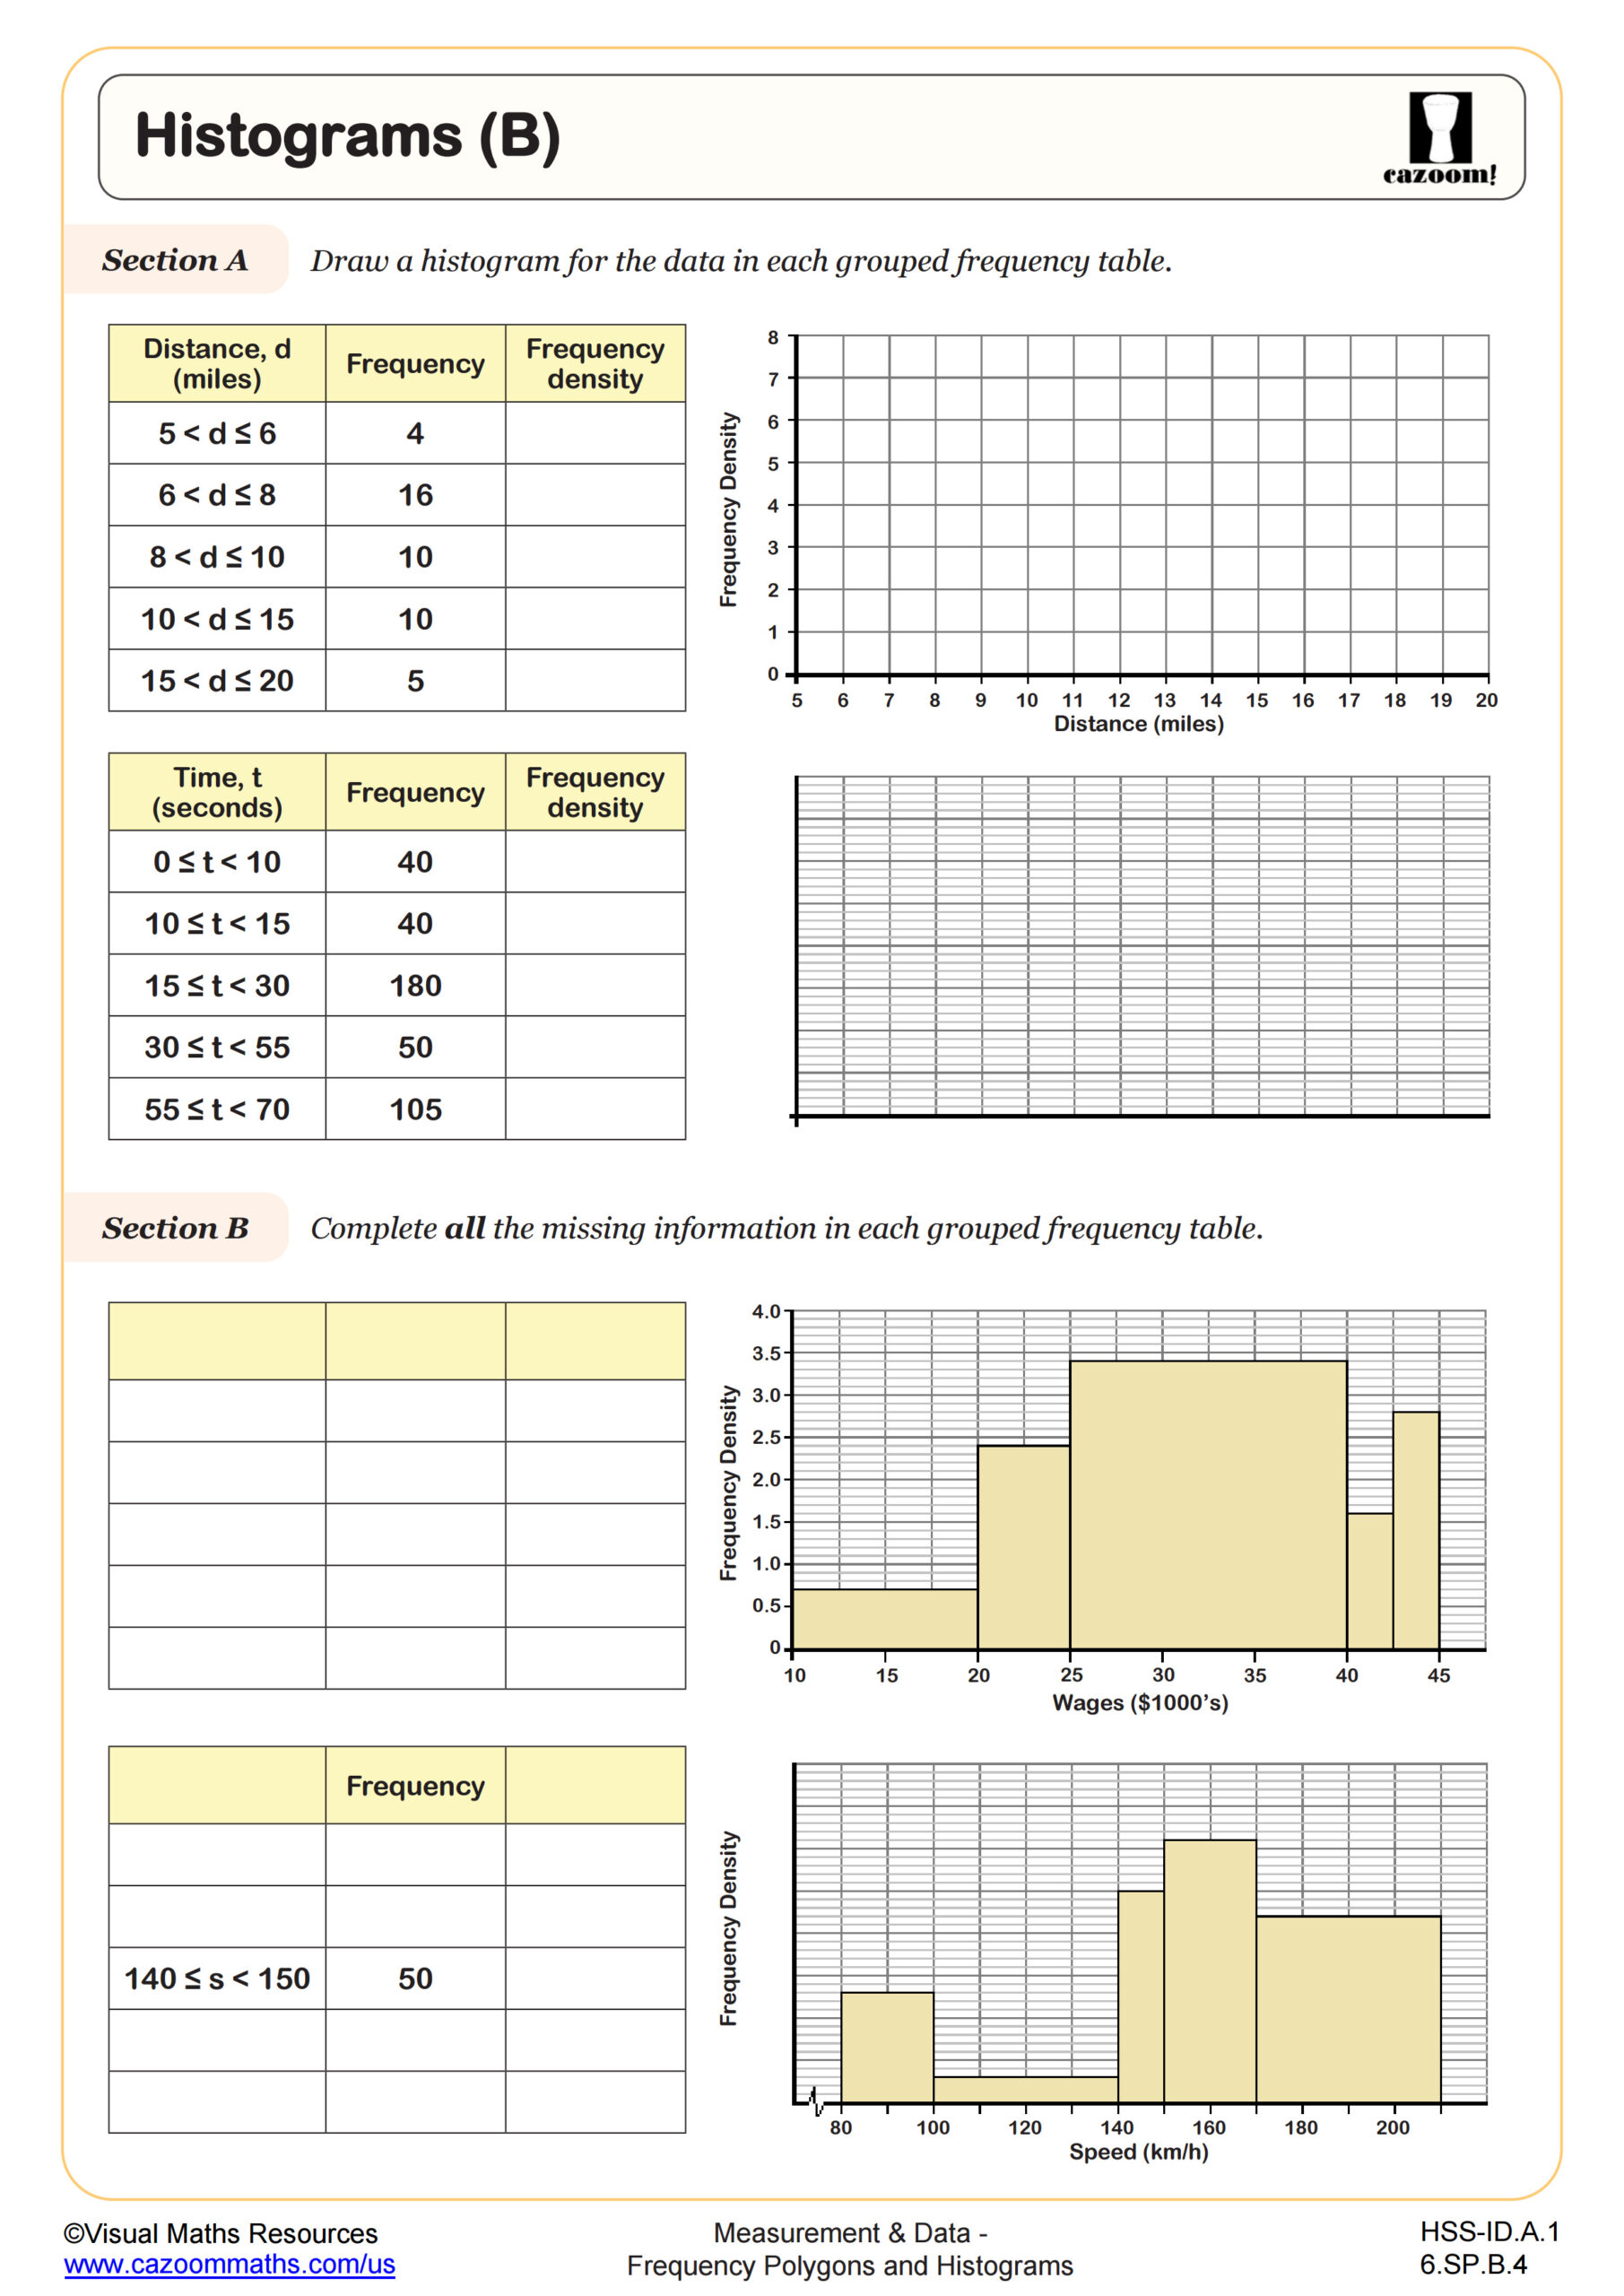
Histograms (B)
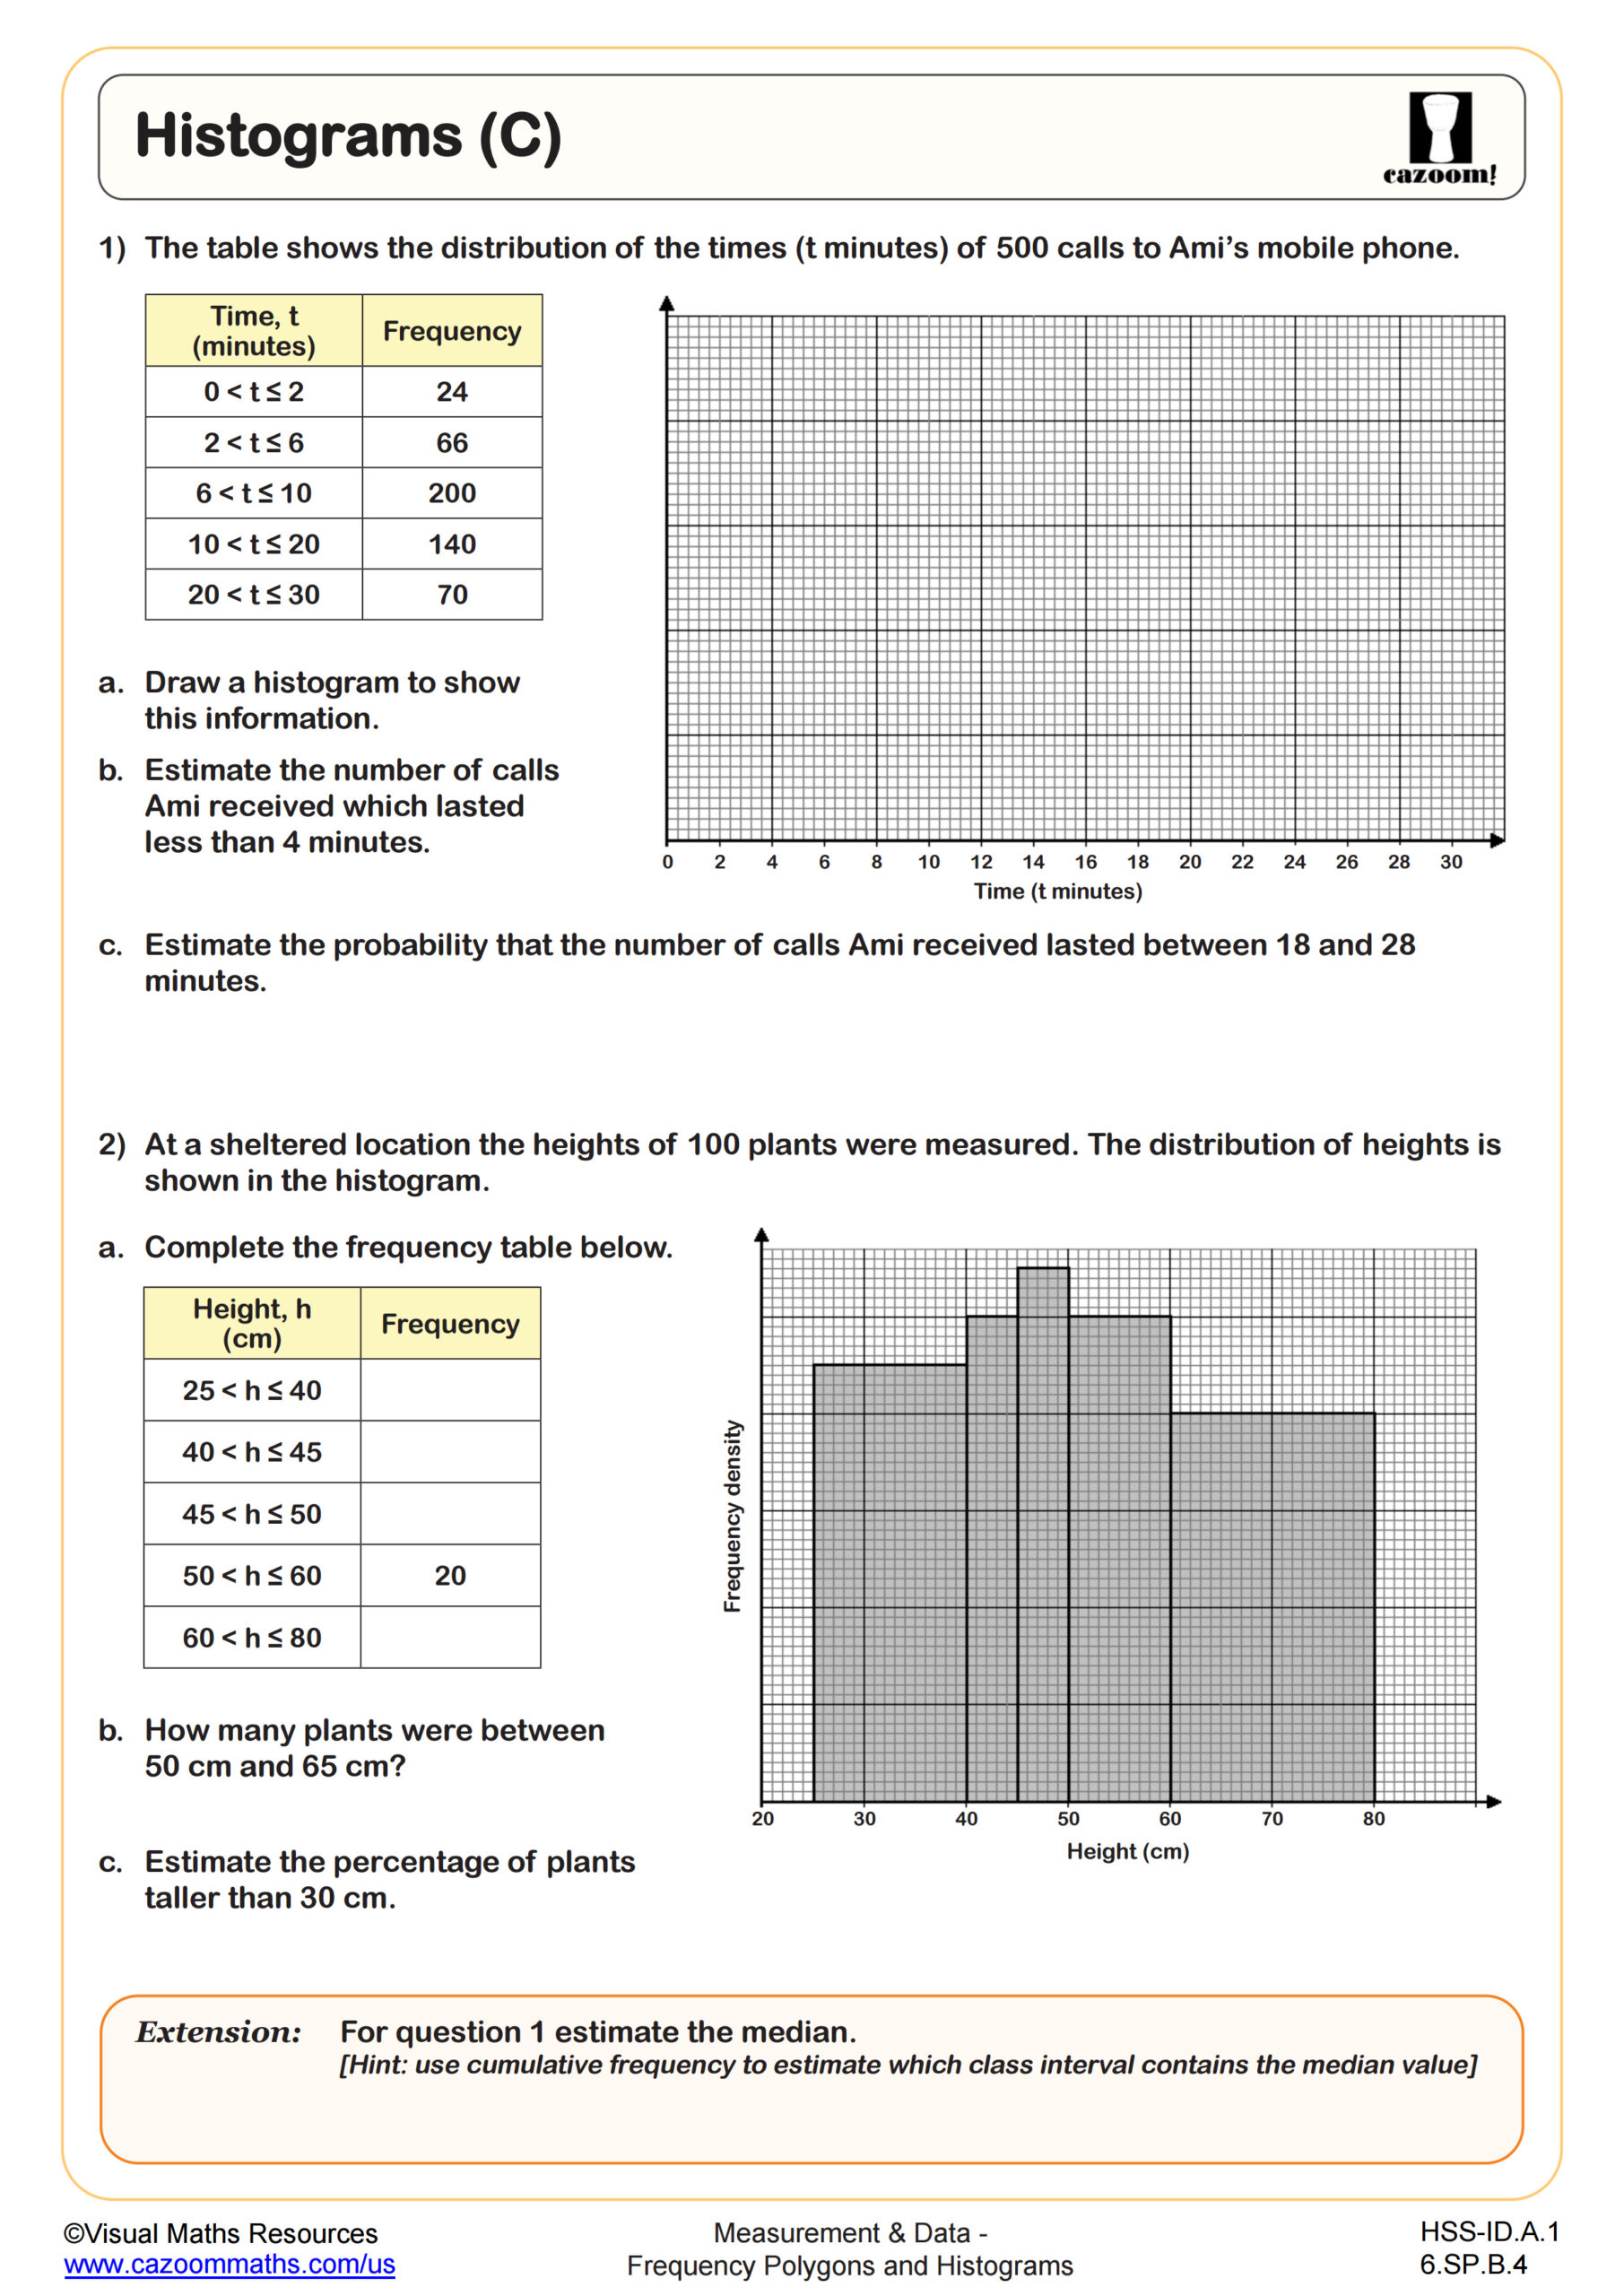
Histograms (C)
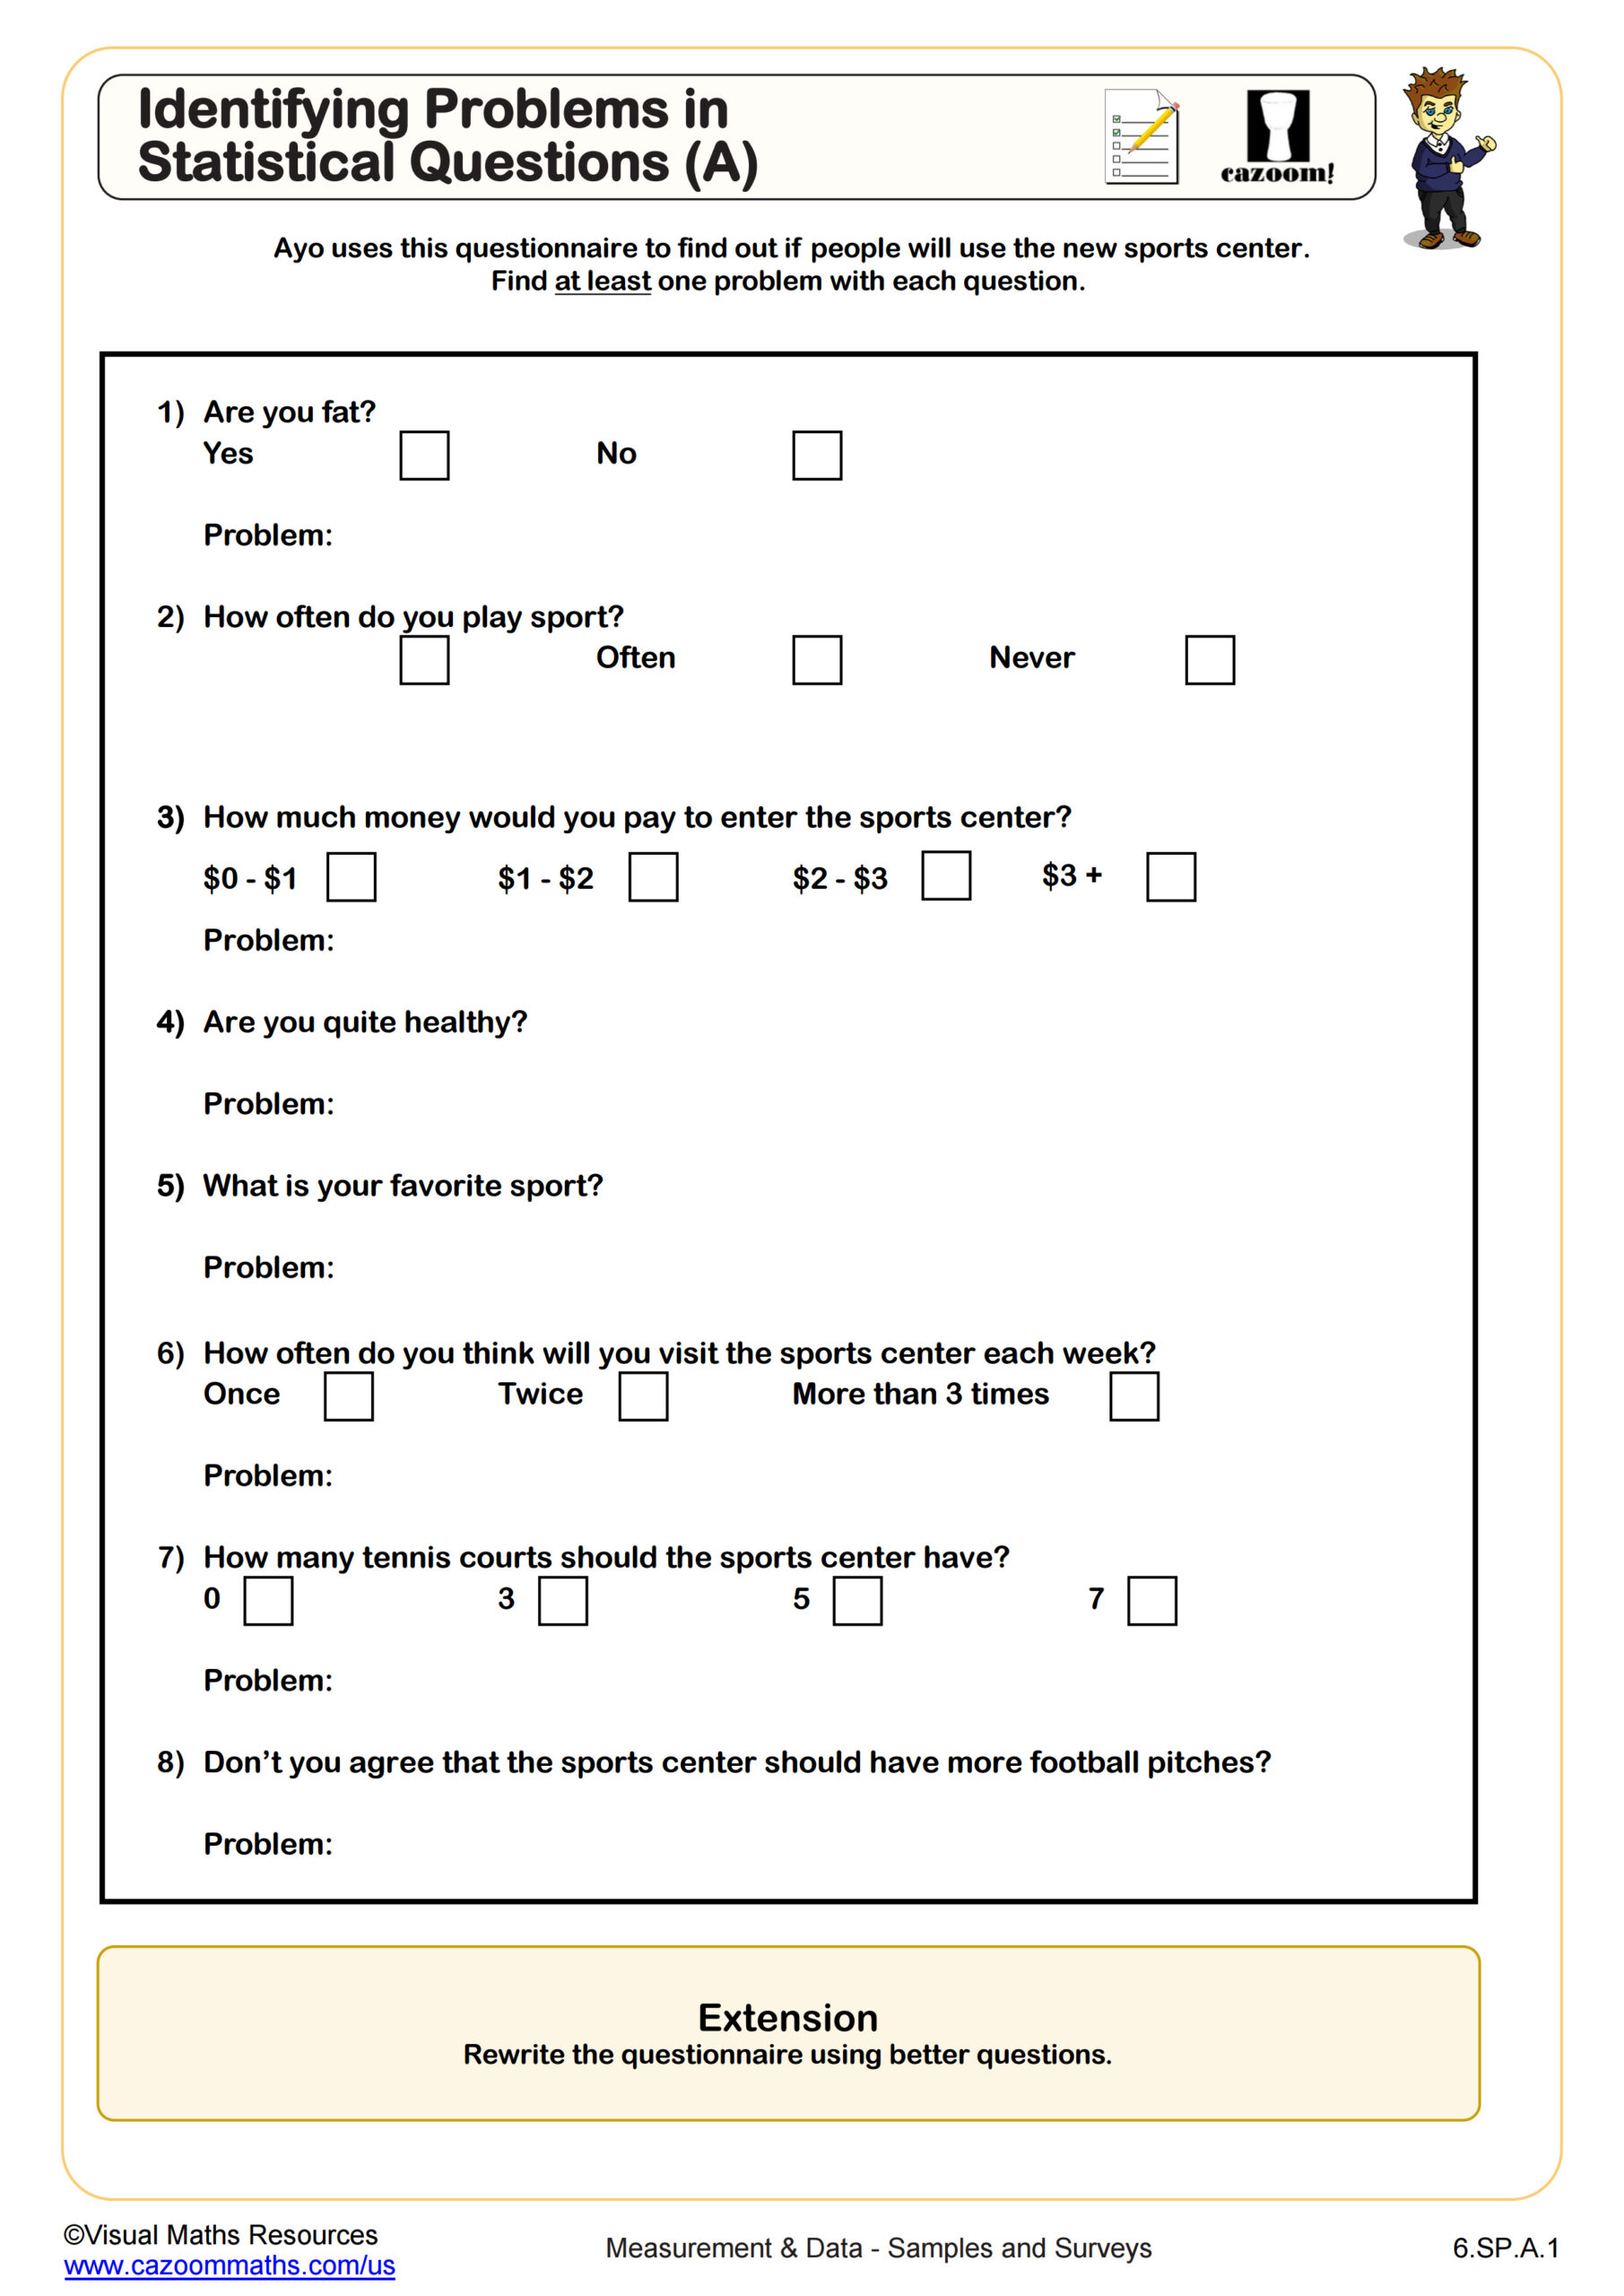
Identifying Problems in Statistical Questions (A)
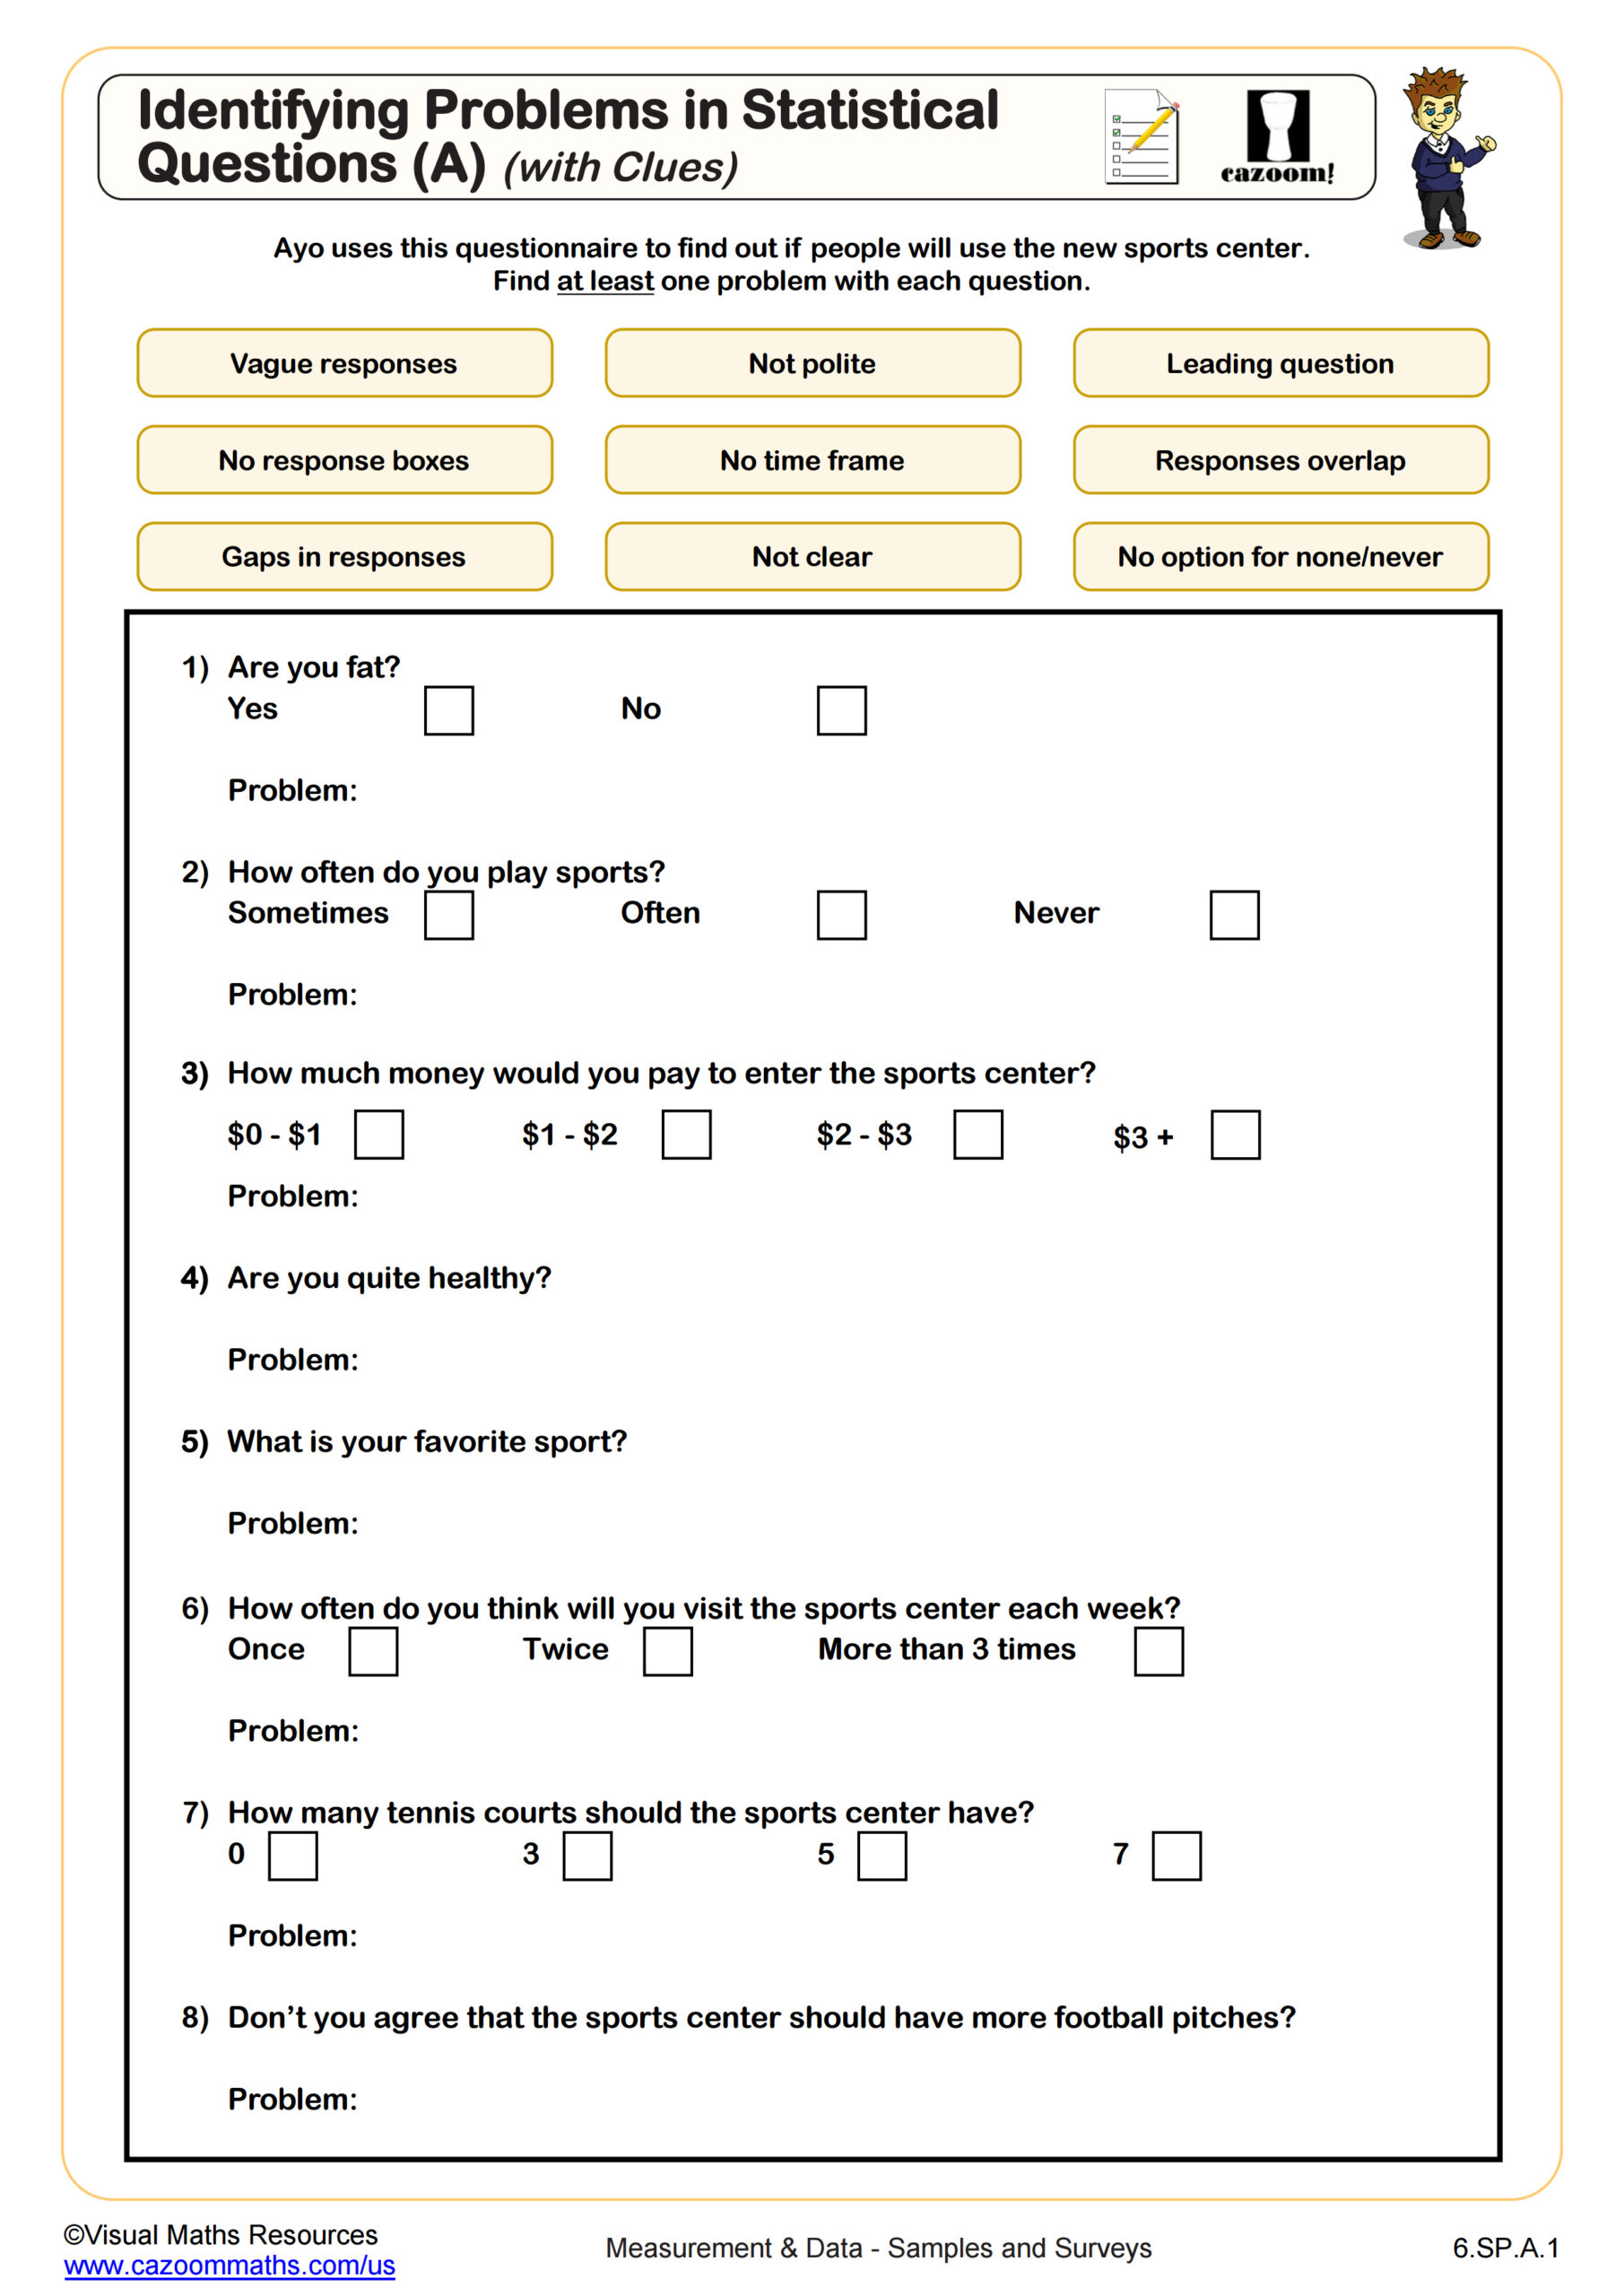
Identifying Problems in Statistical Questions (A) (With Clues)
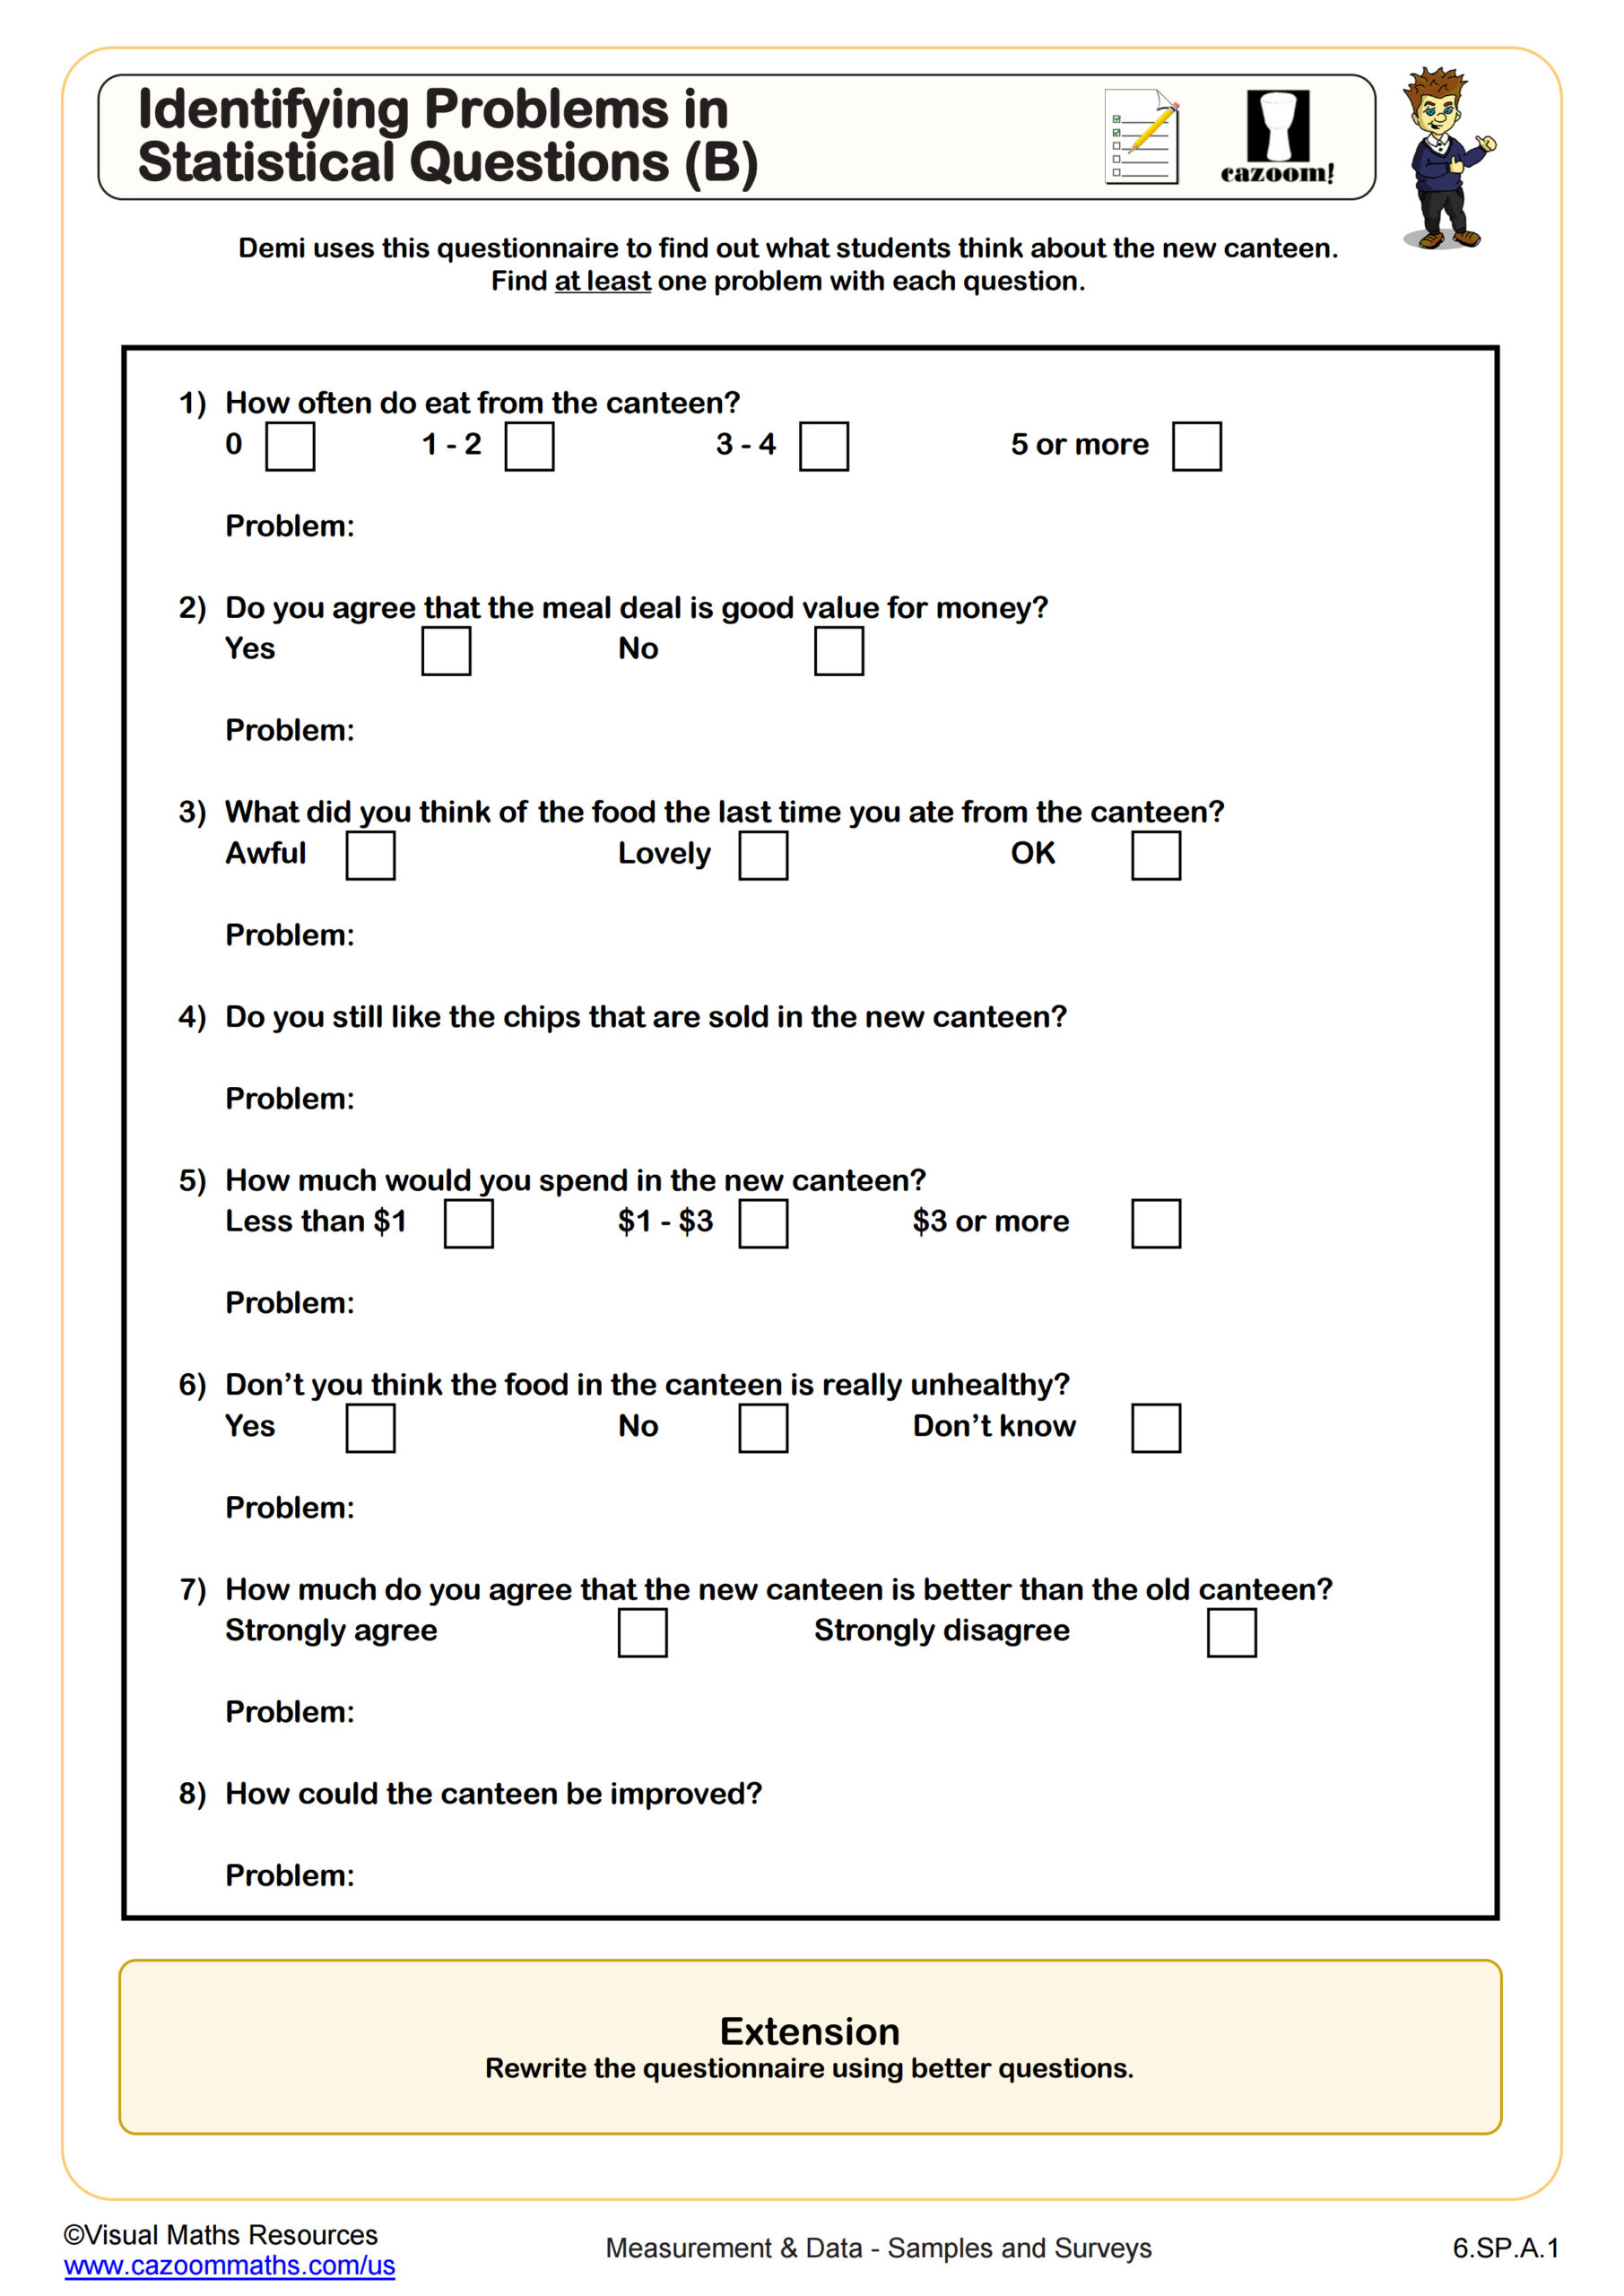
Identifying Problems in Statistical Questions (B)
Interpreting Boxplots
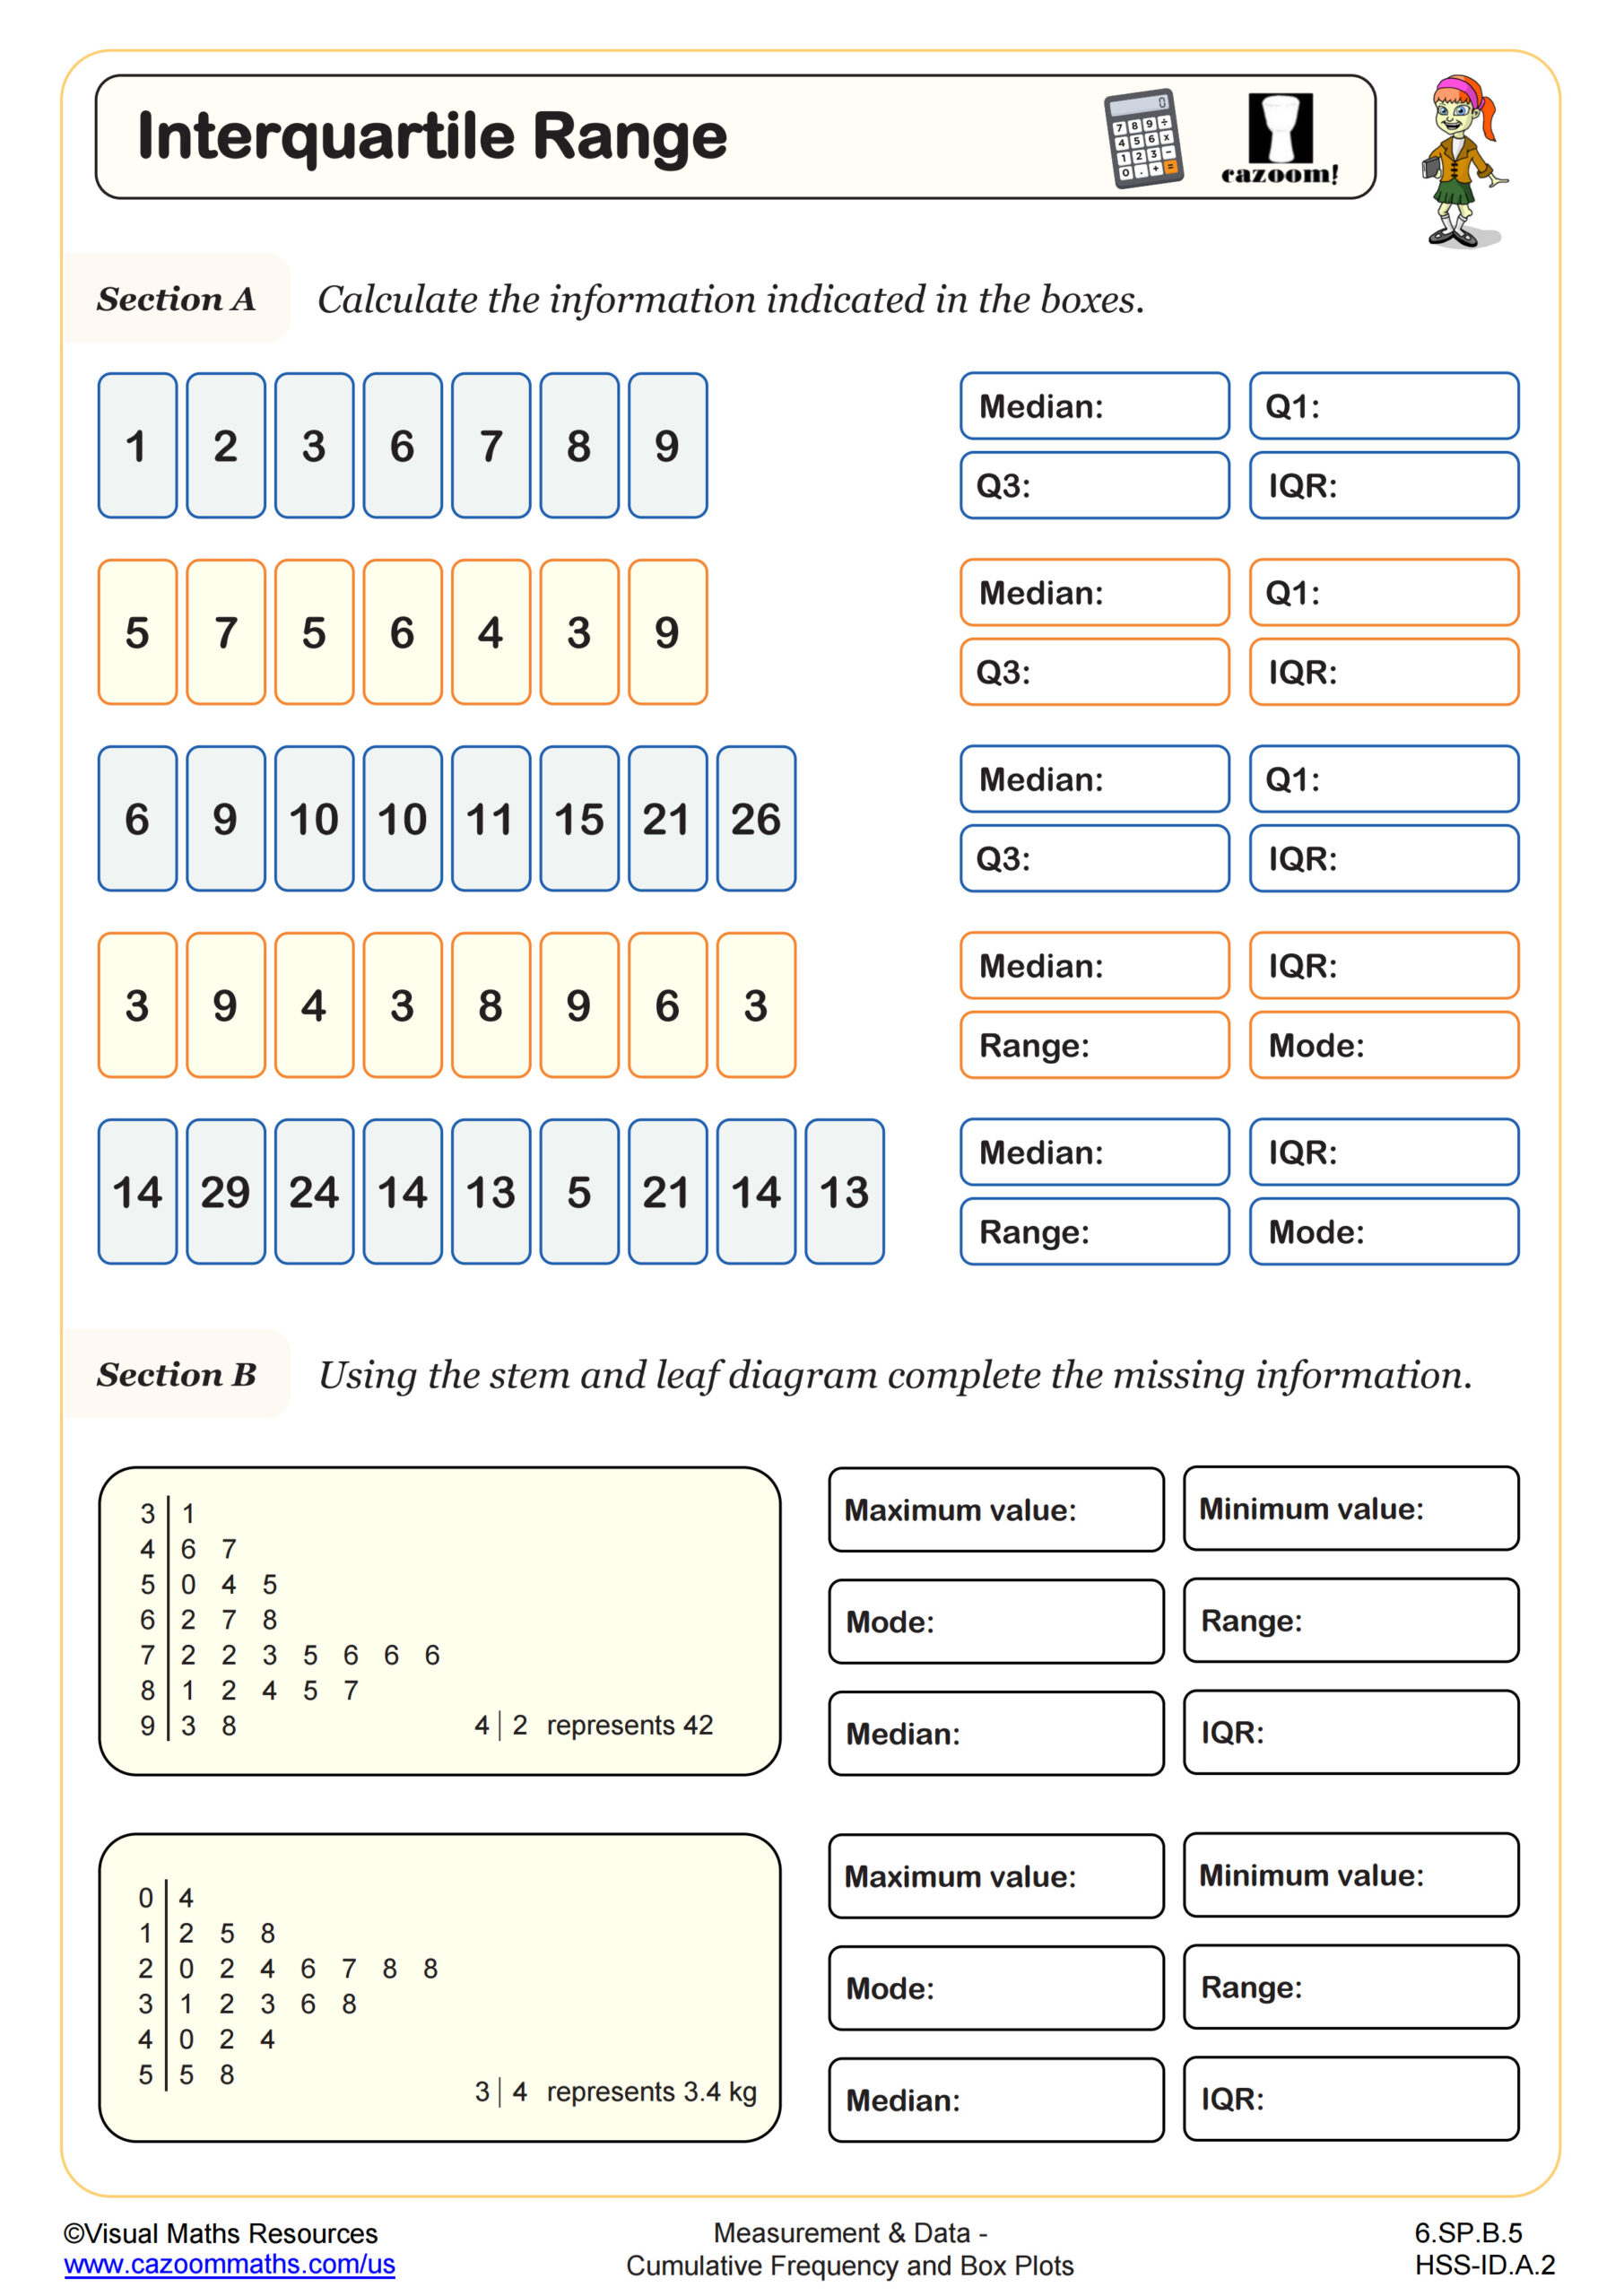
Interquartile Range
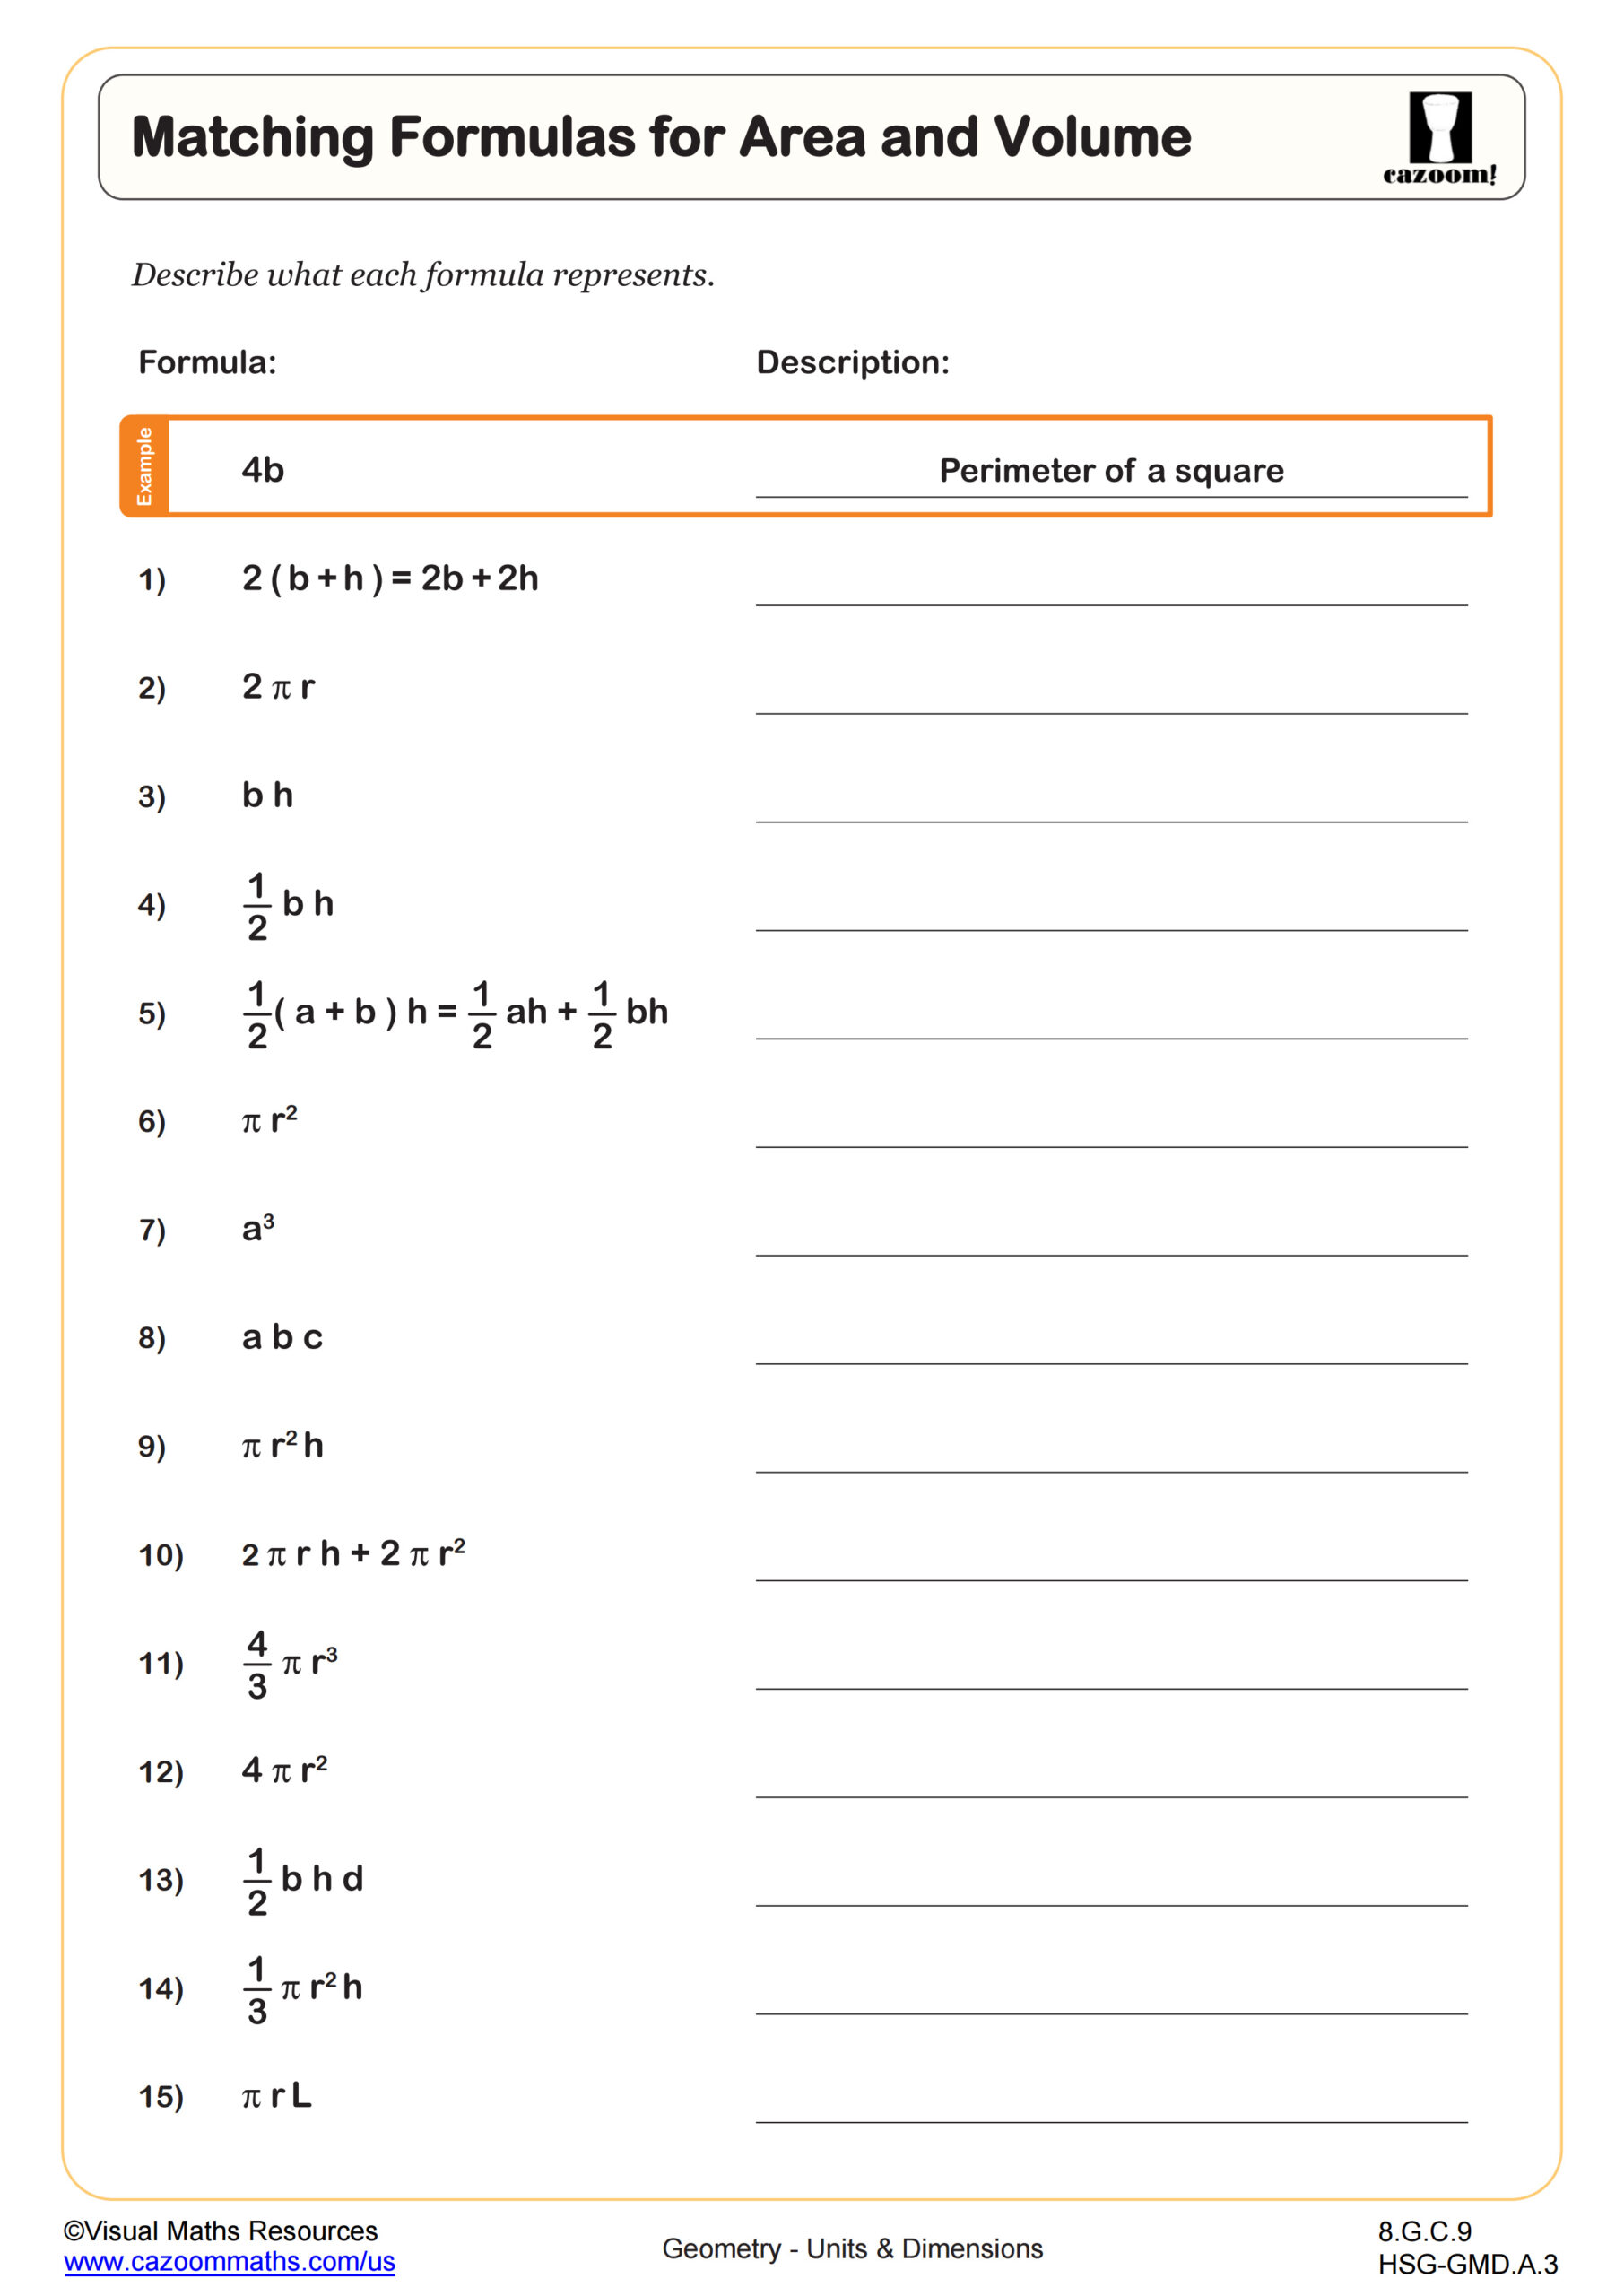
Matching Formulas for Area and Volume
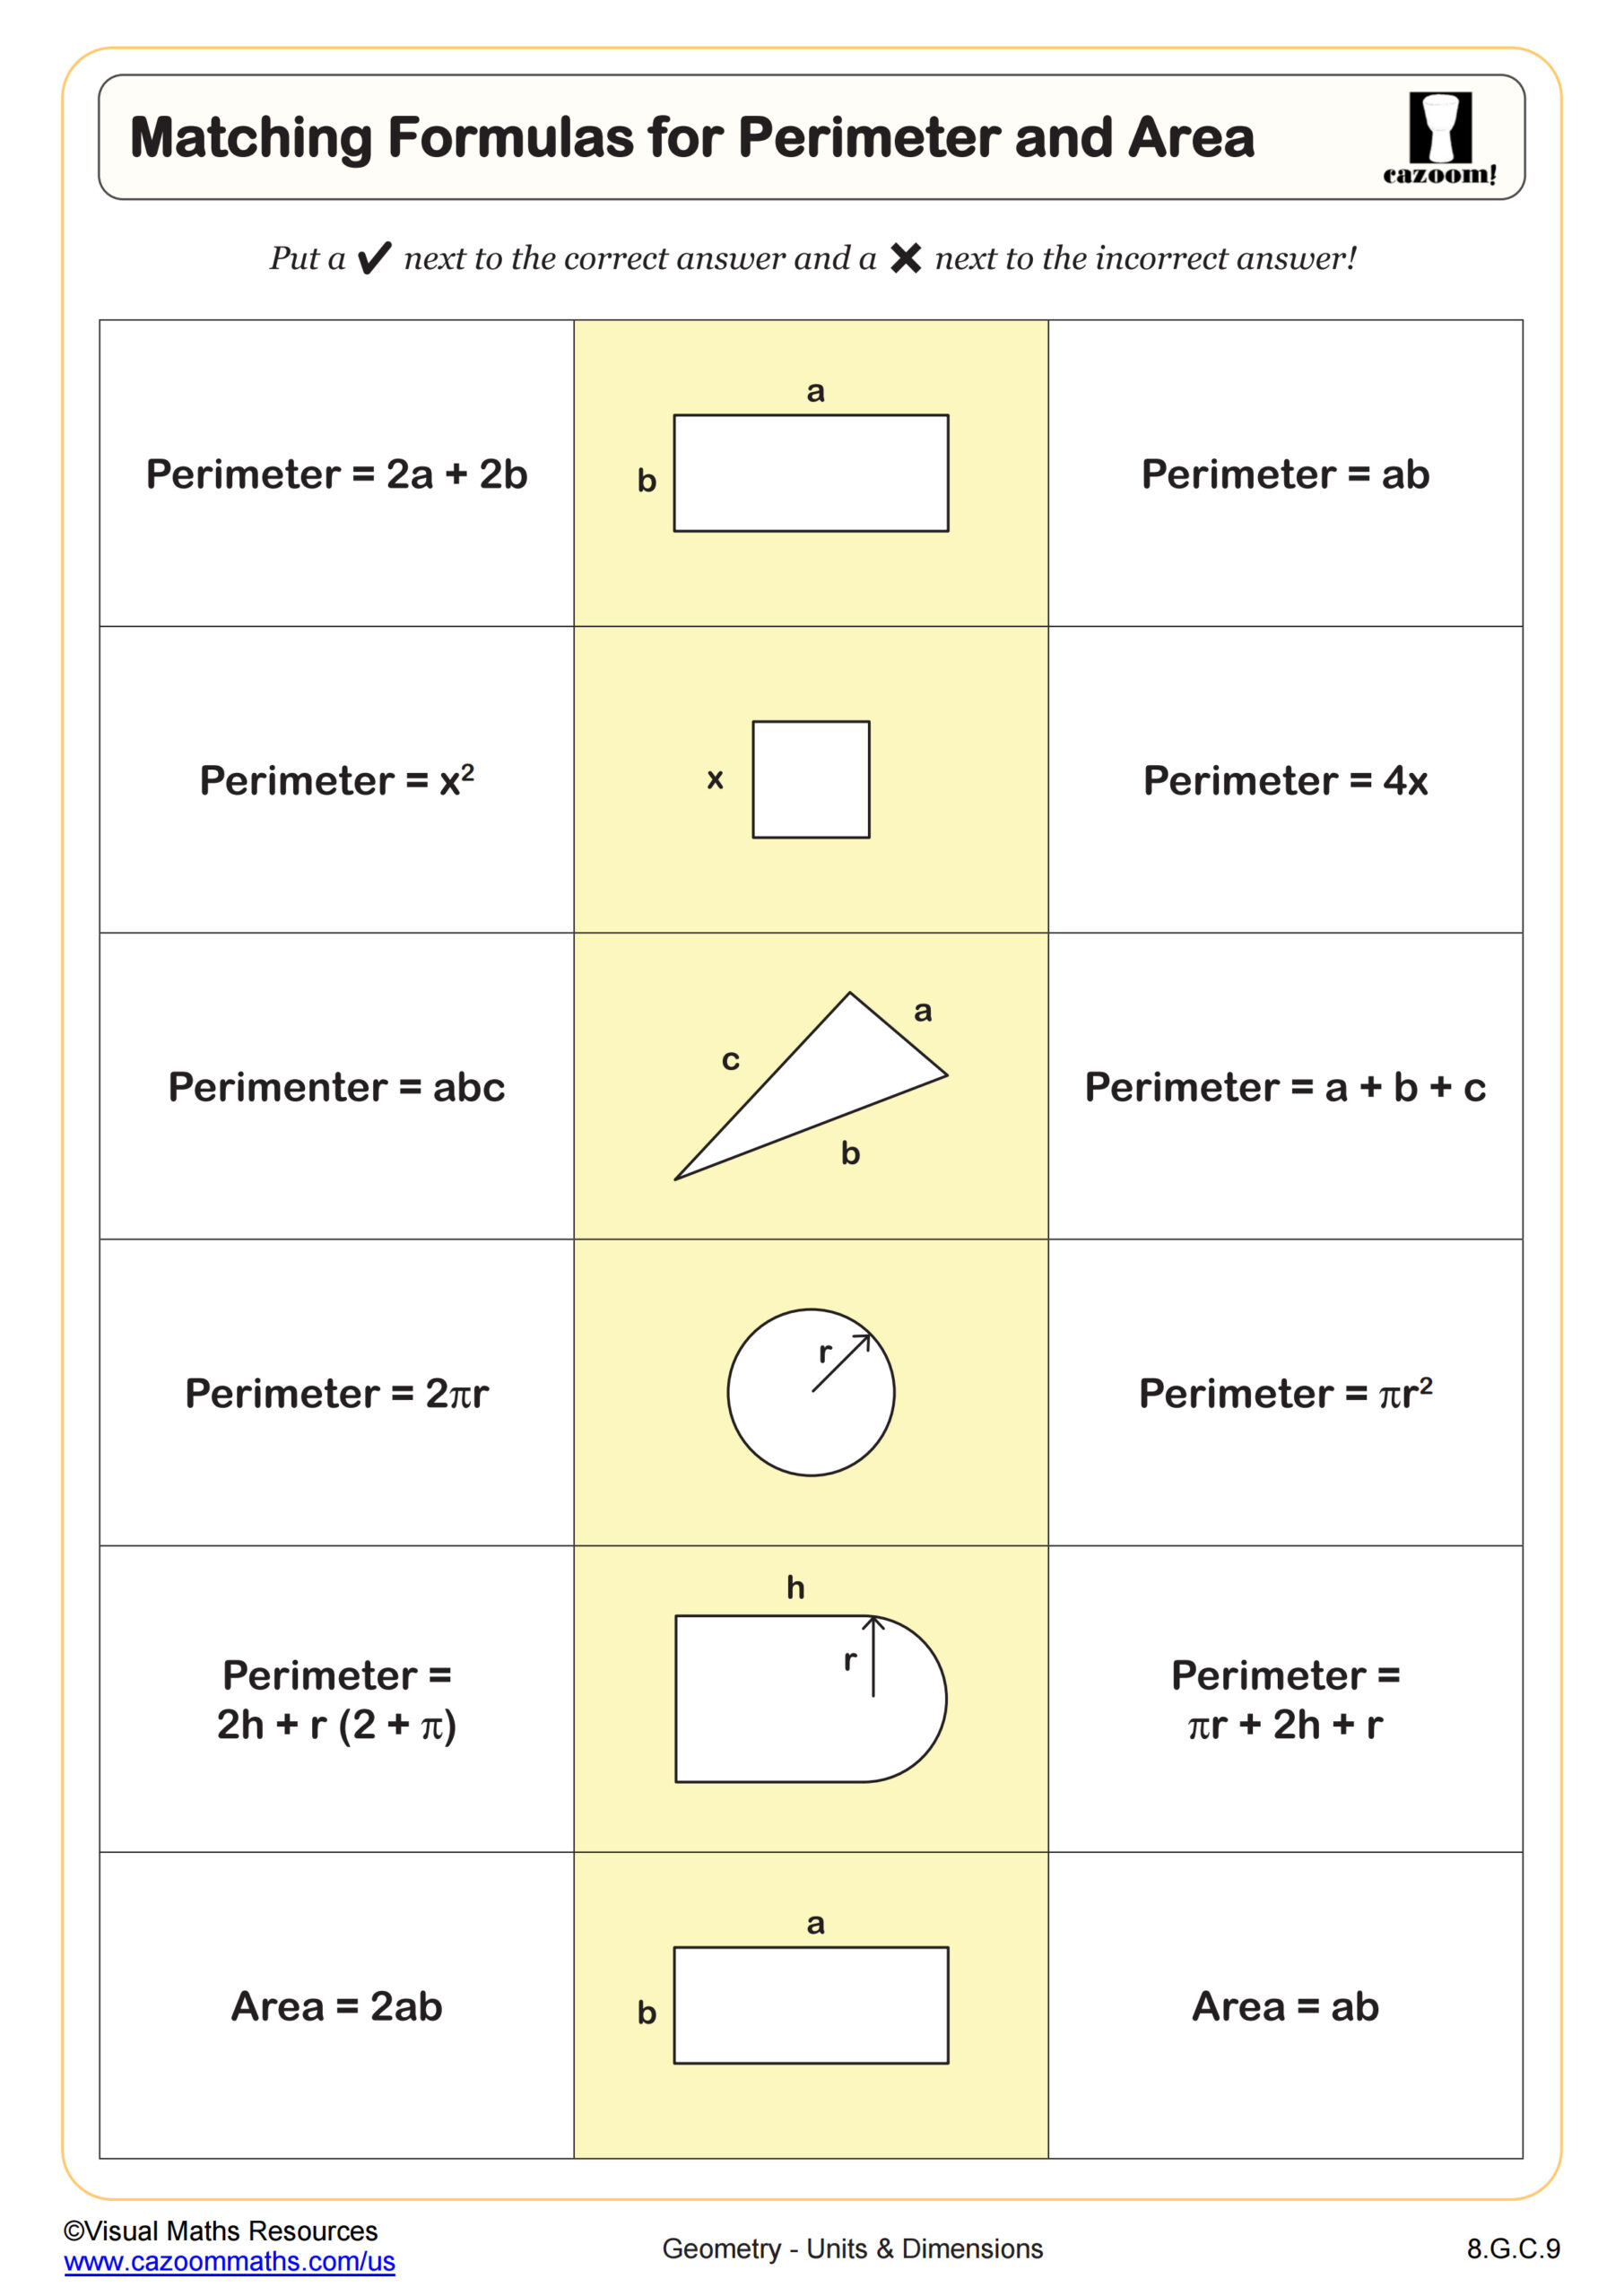
Matching Formulas for Perimeter and Area
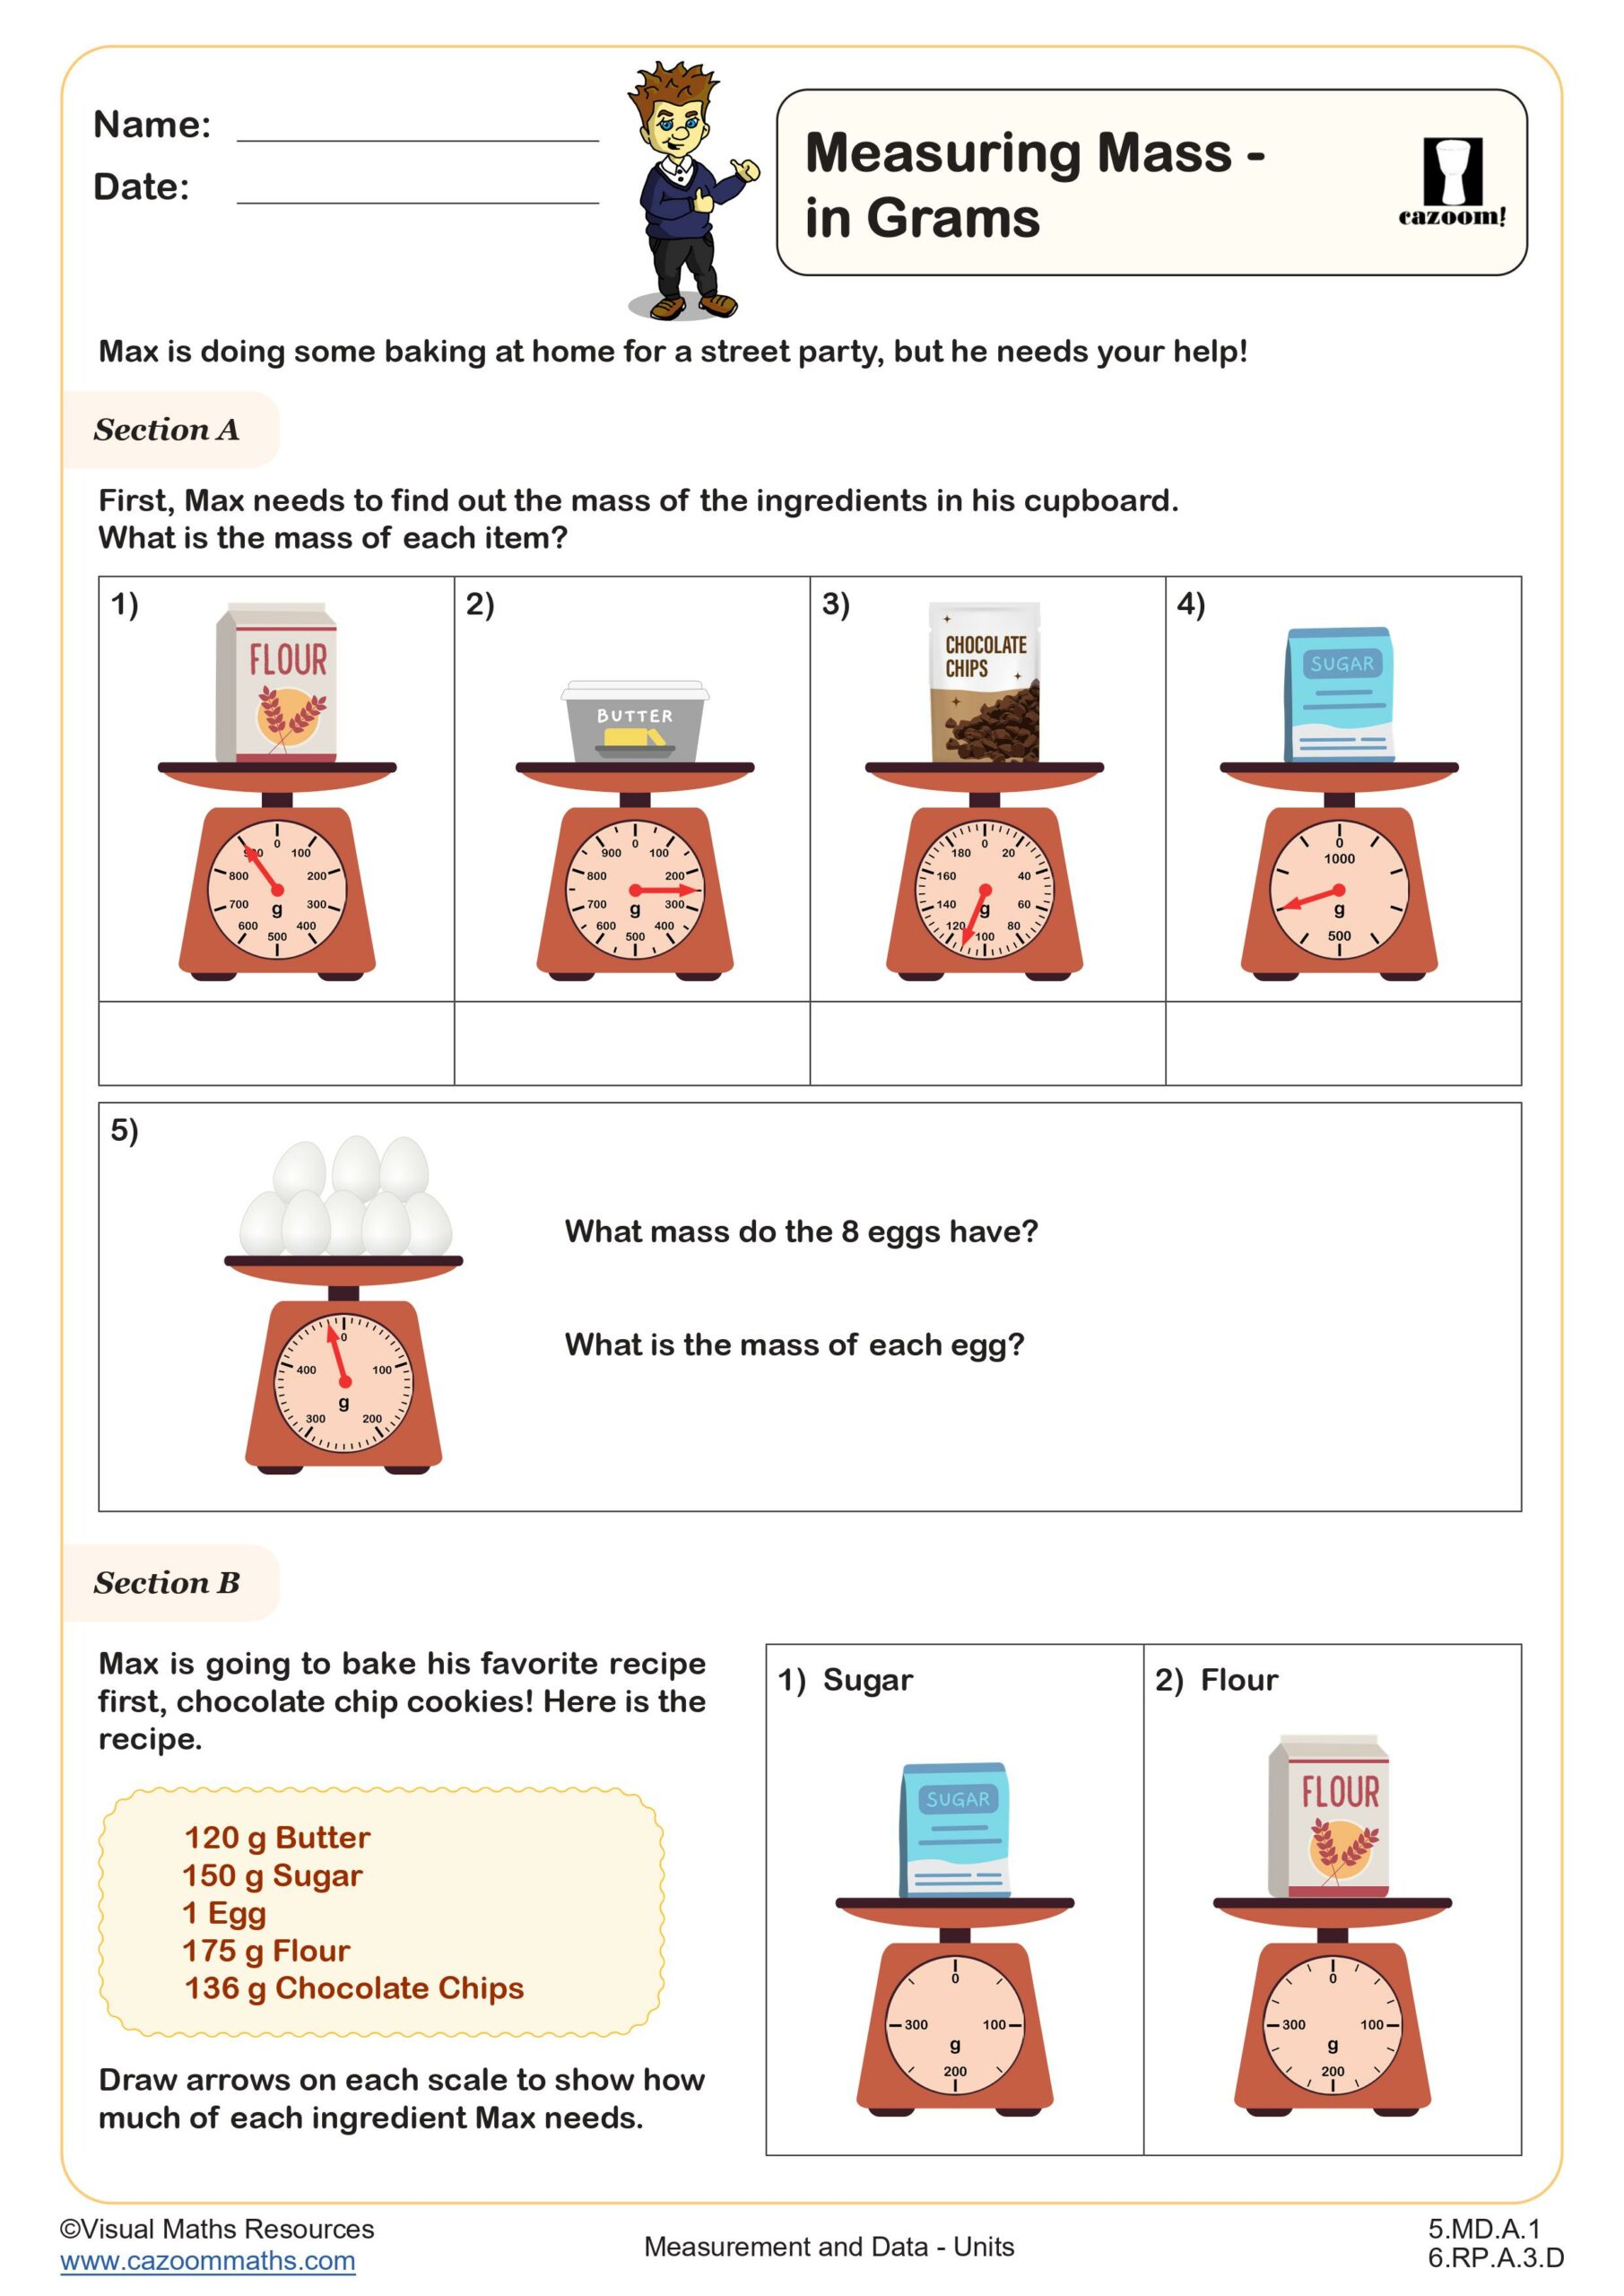
Measure Mass - in Grams
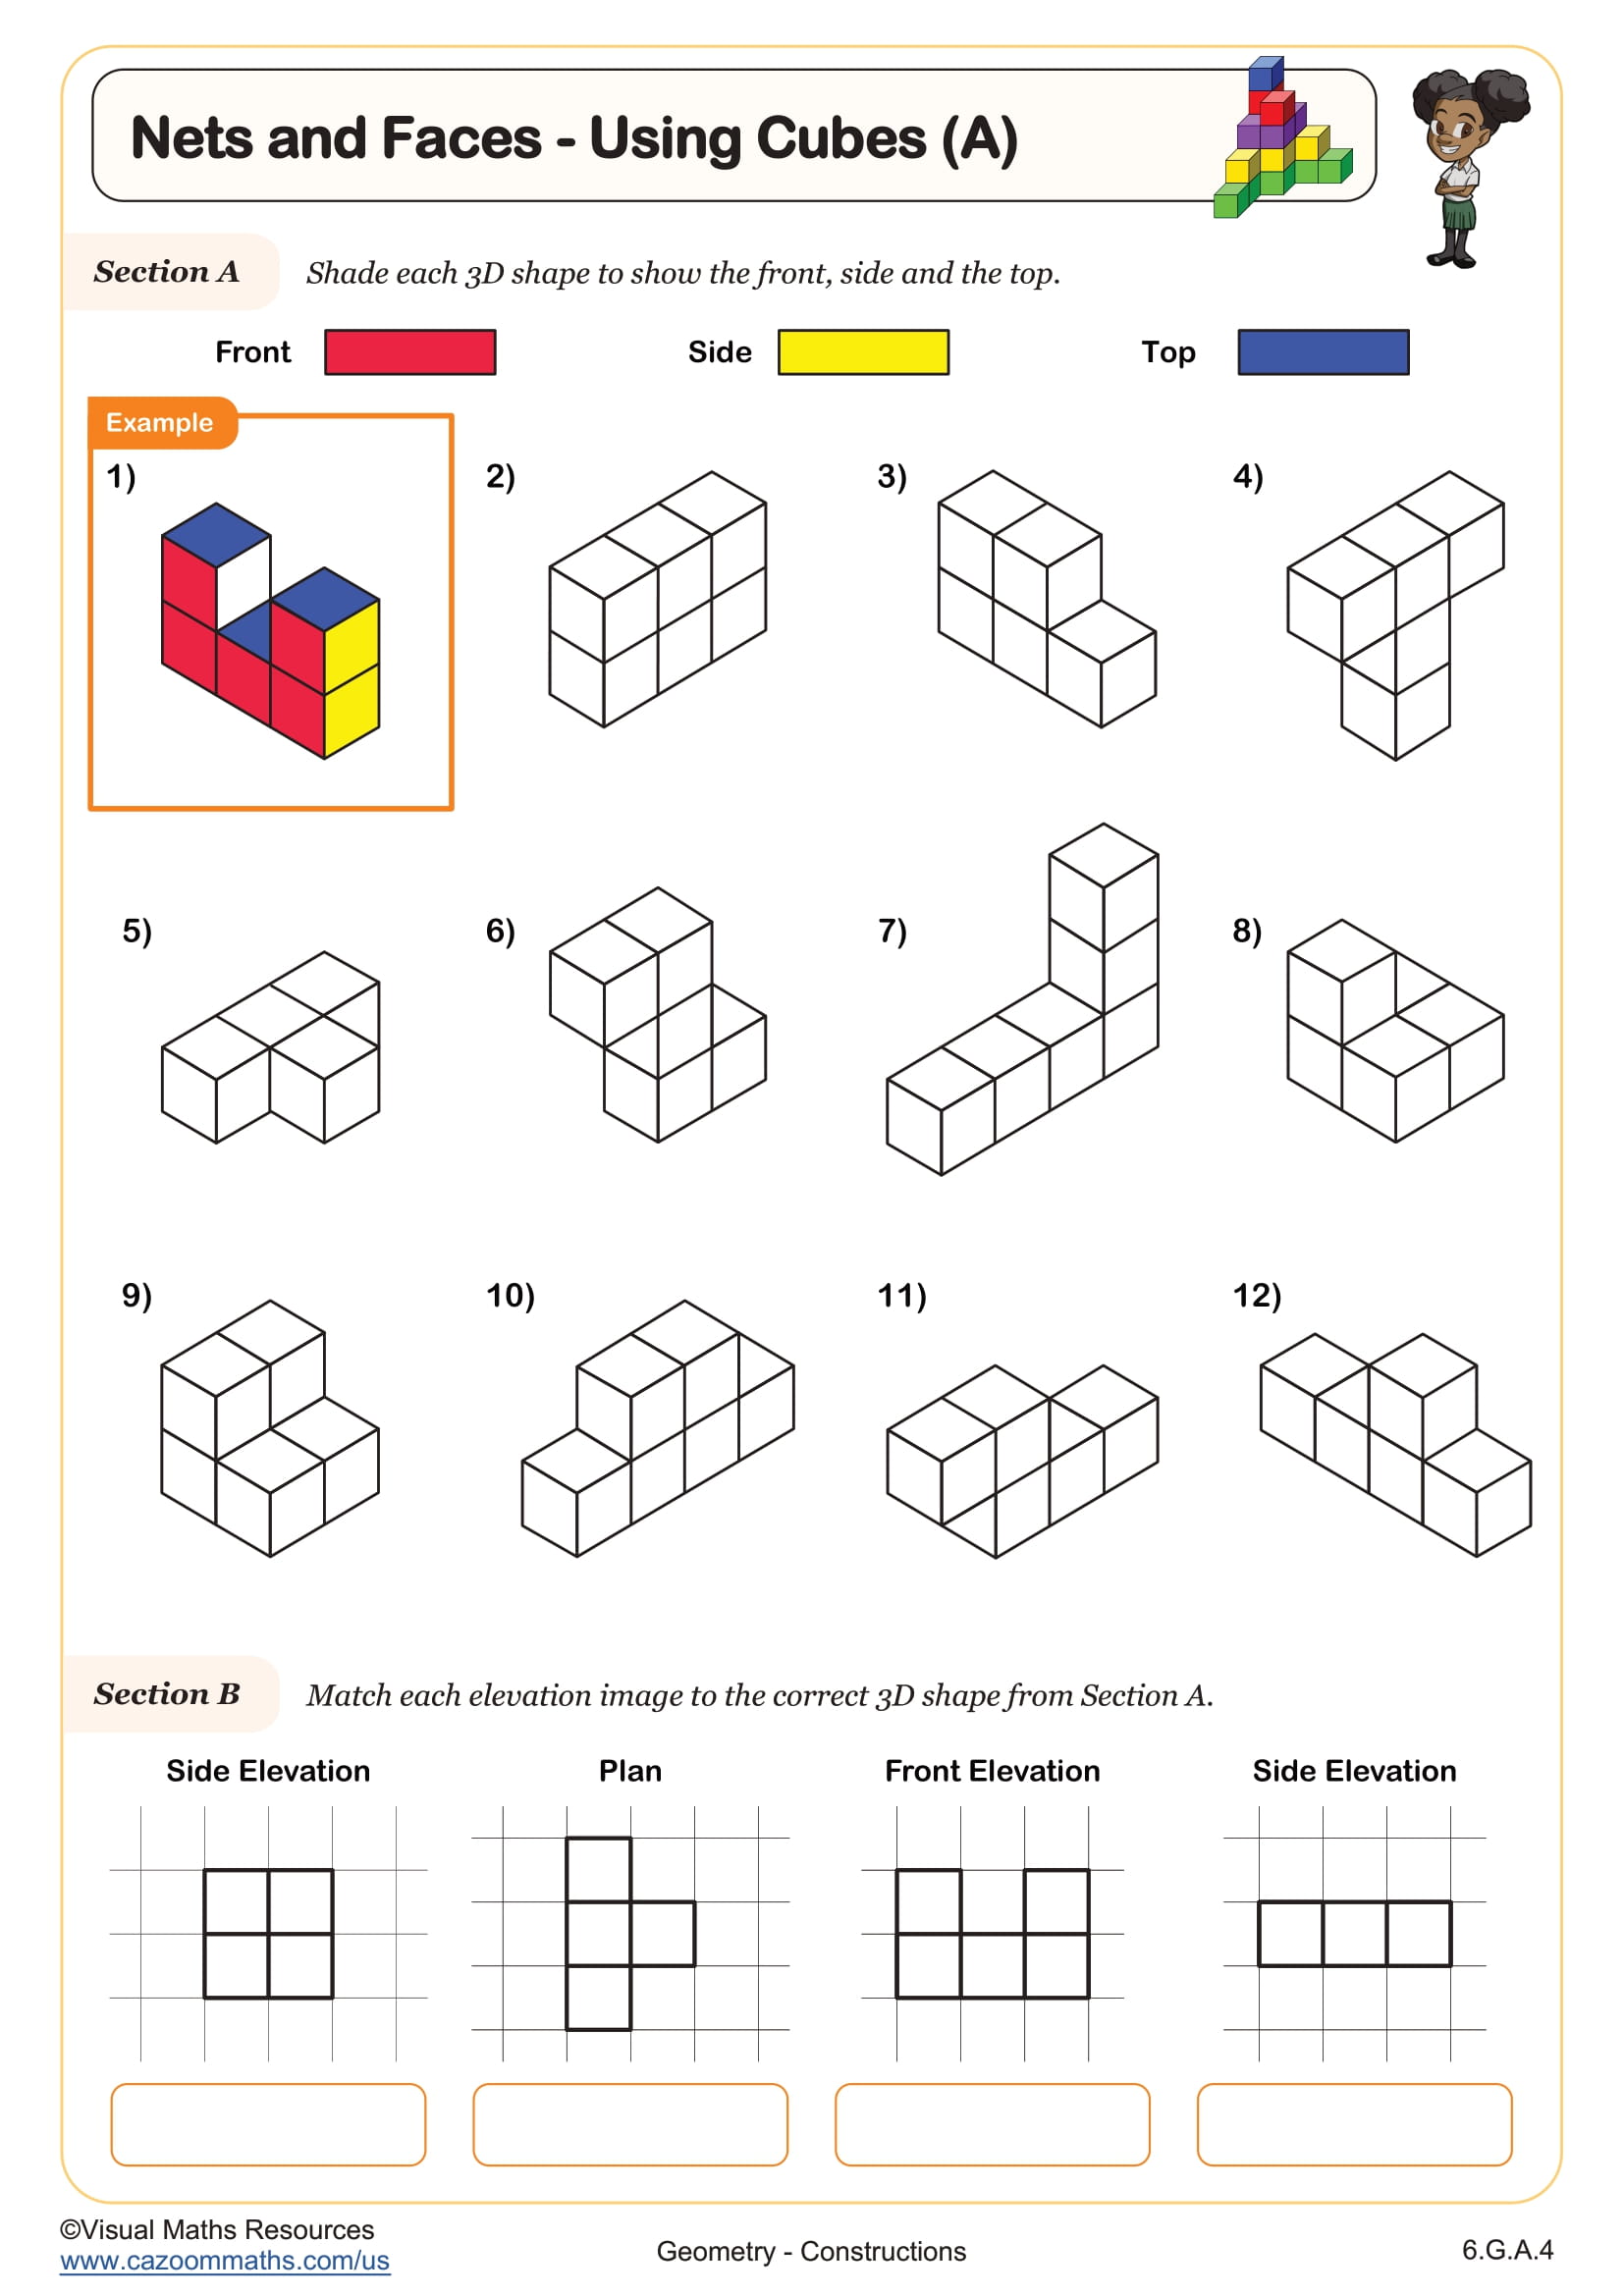
Nets and Faces - Using Cubes (A)
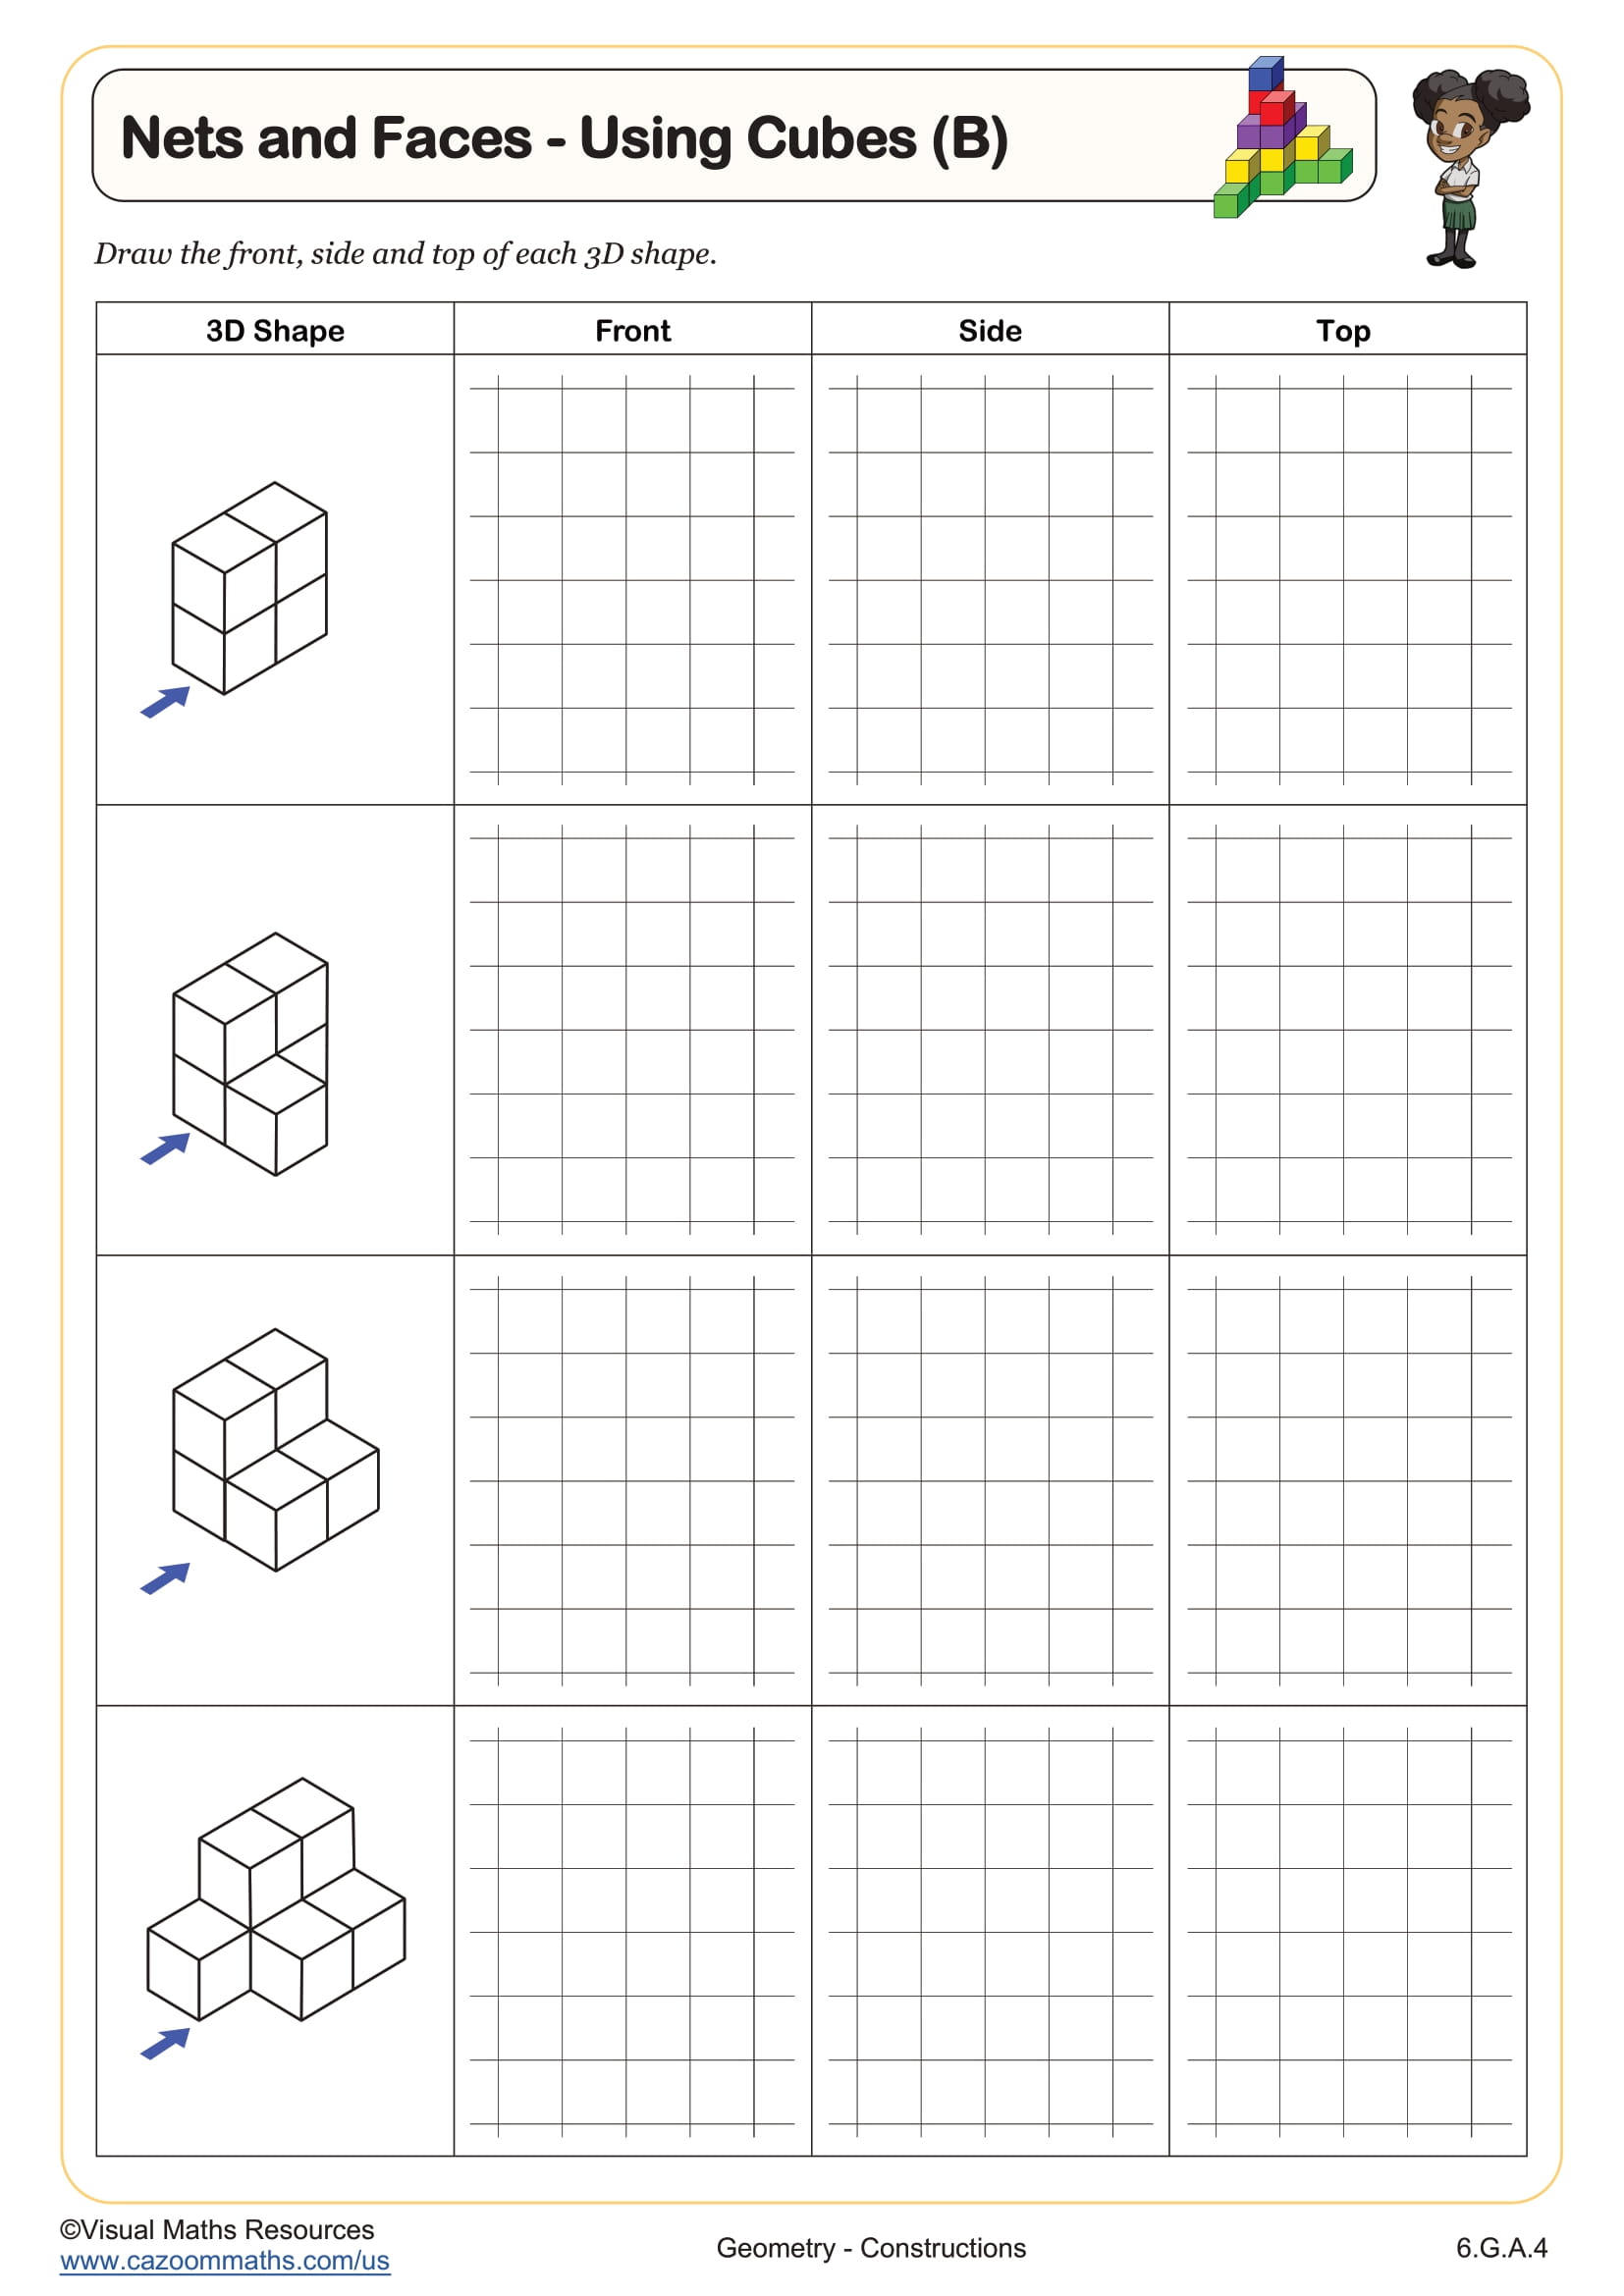
Nets and Faces - Using Cubes (B)
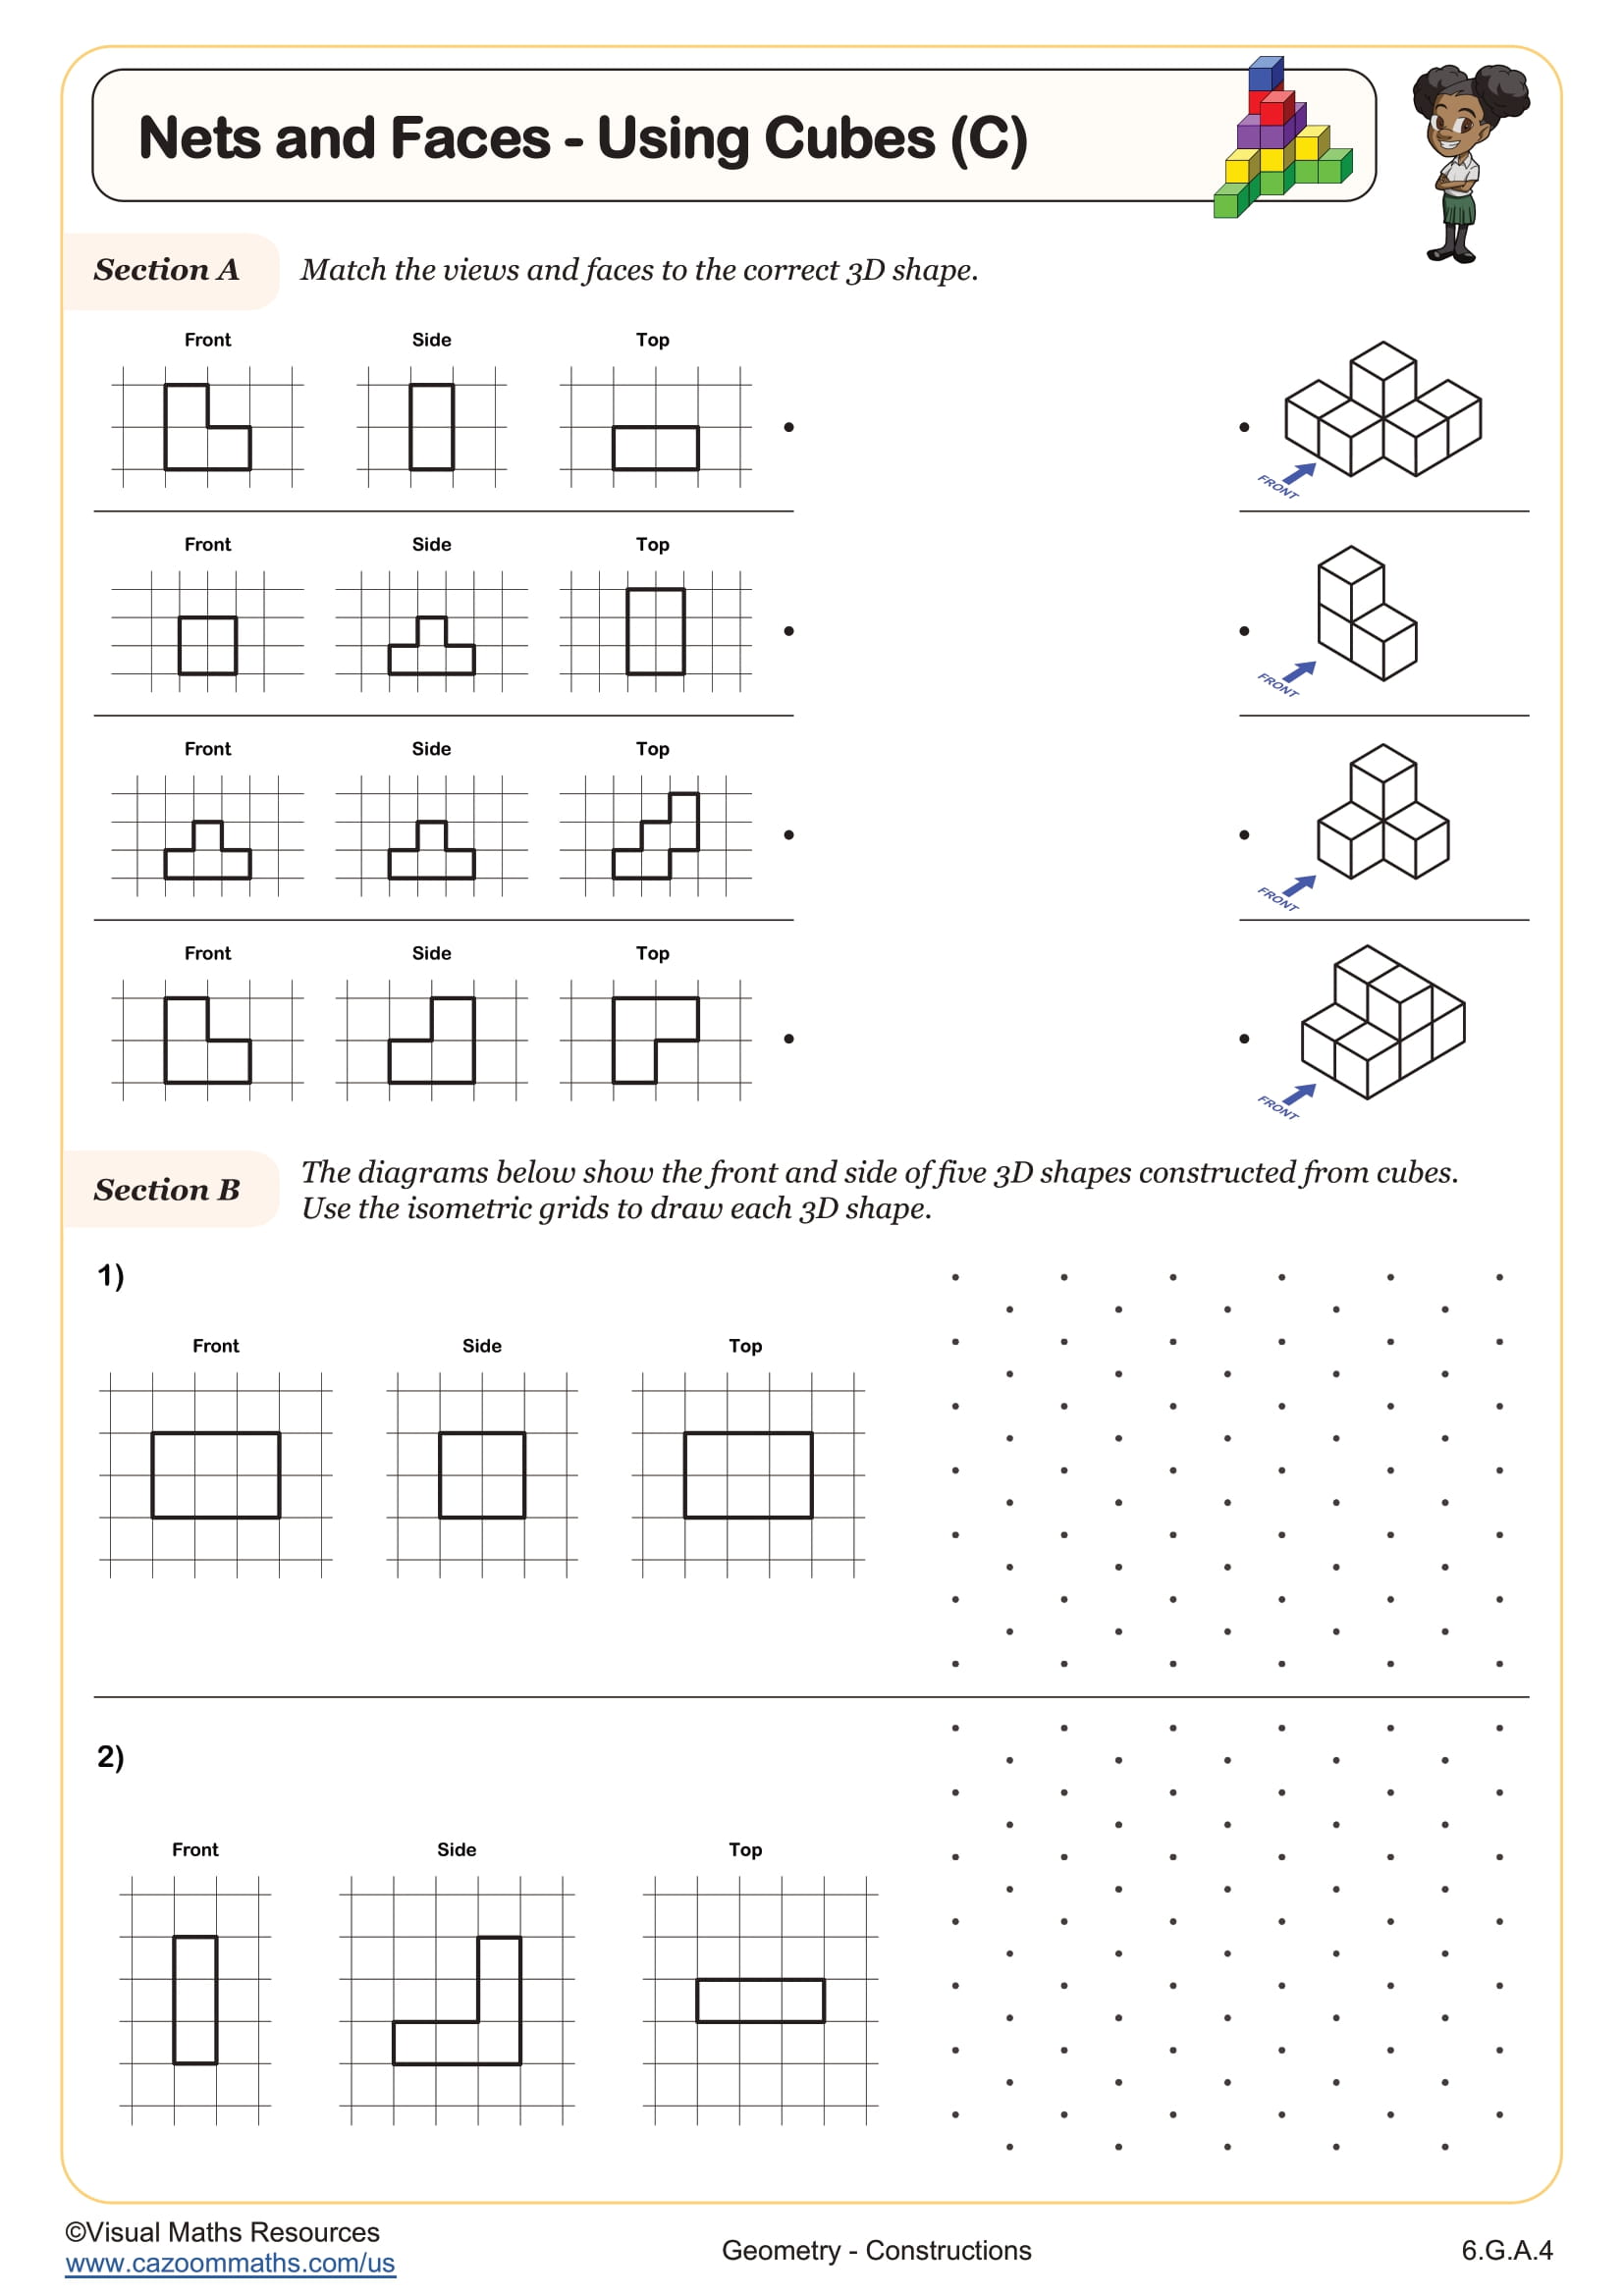
Nets and Faces - Using Cubes (C)
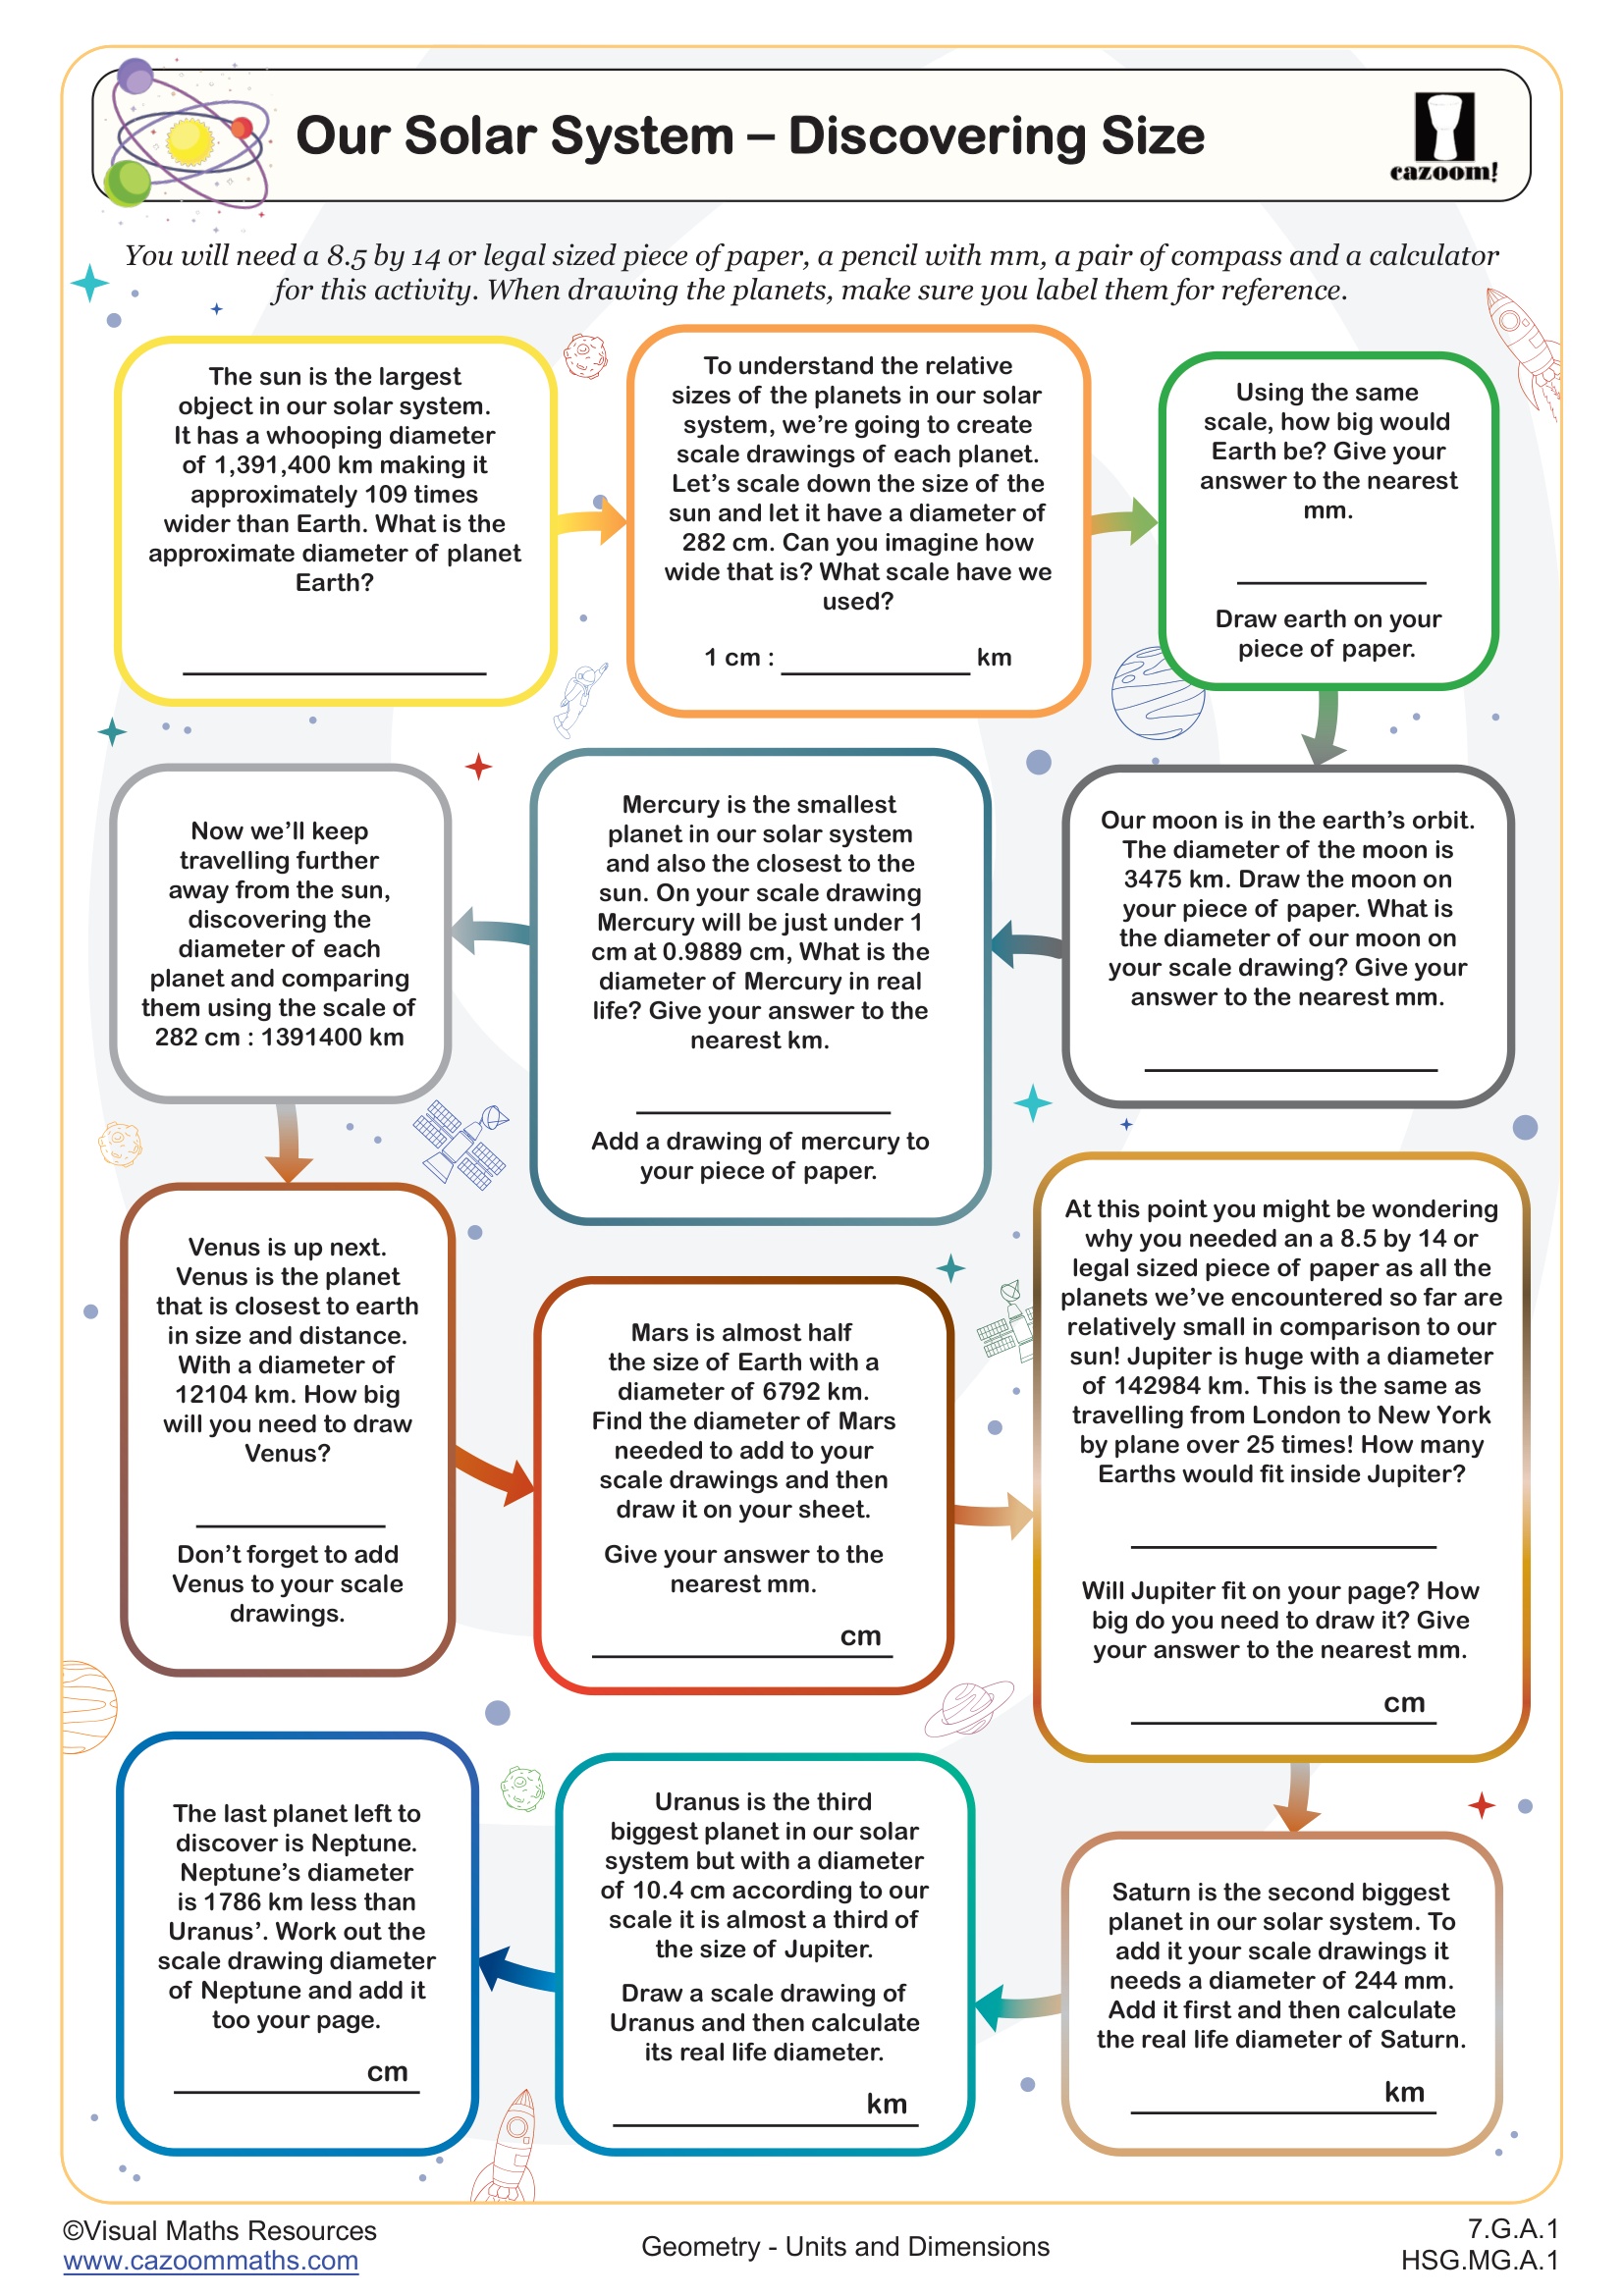
Our Solar System- Discovering Size
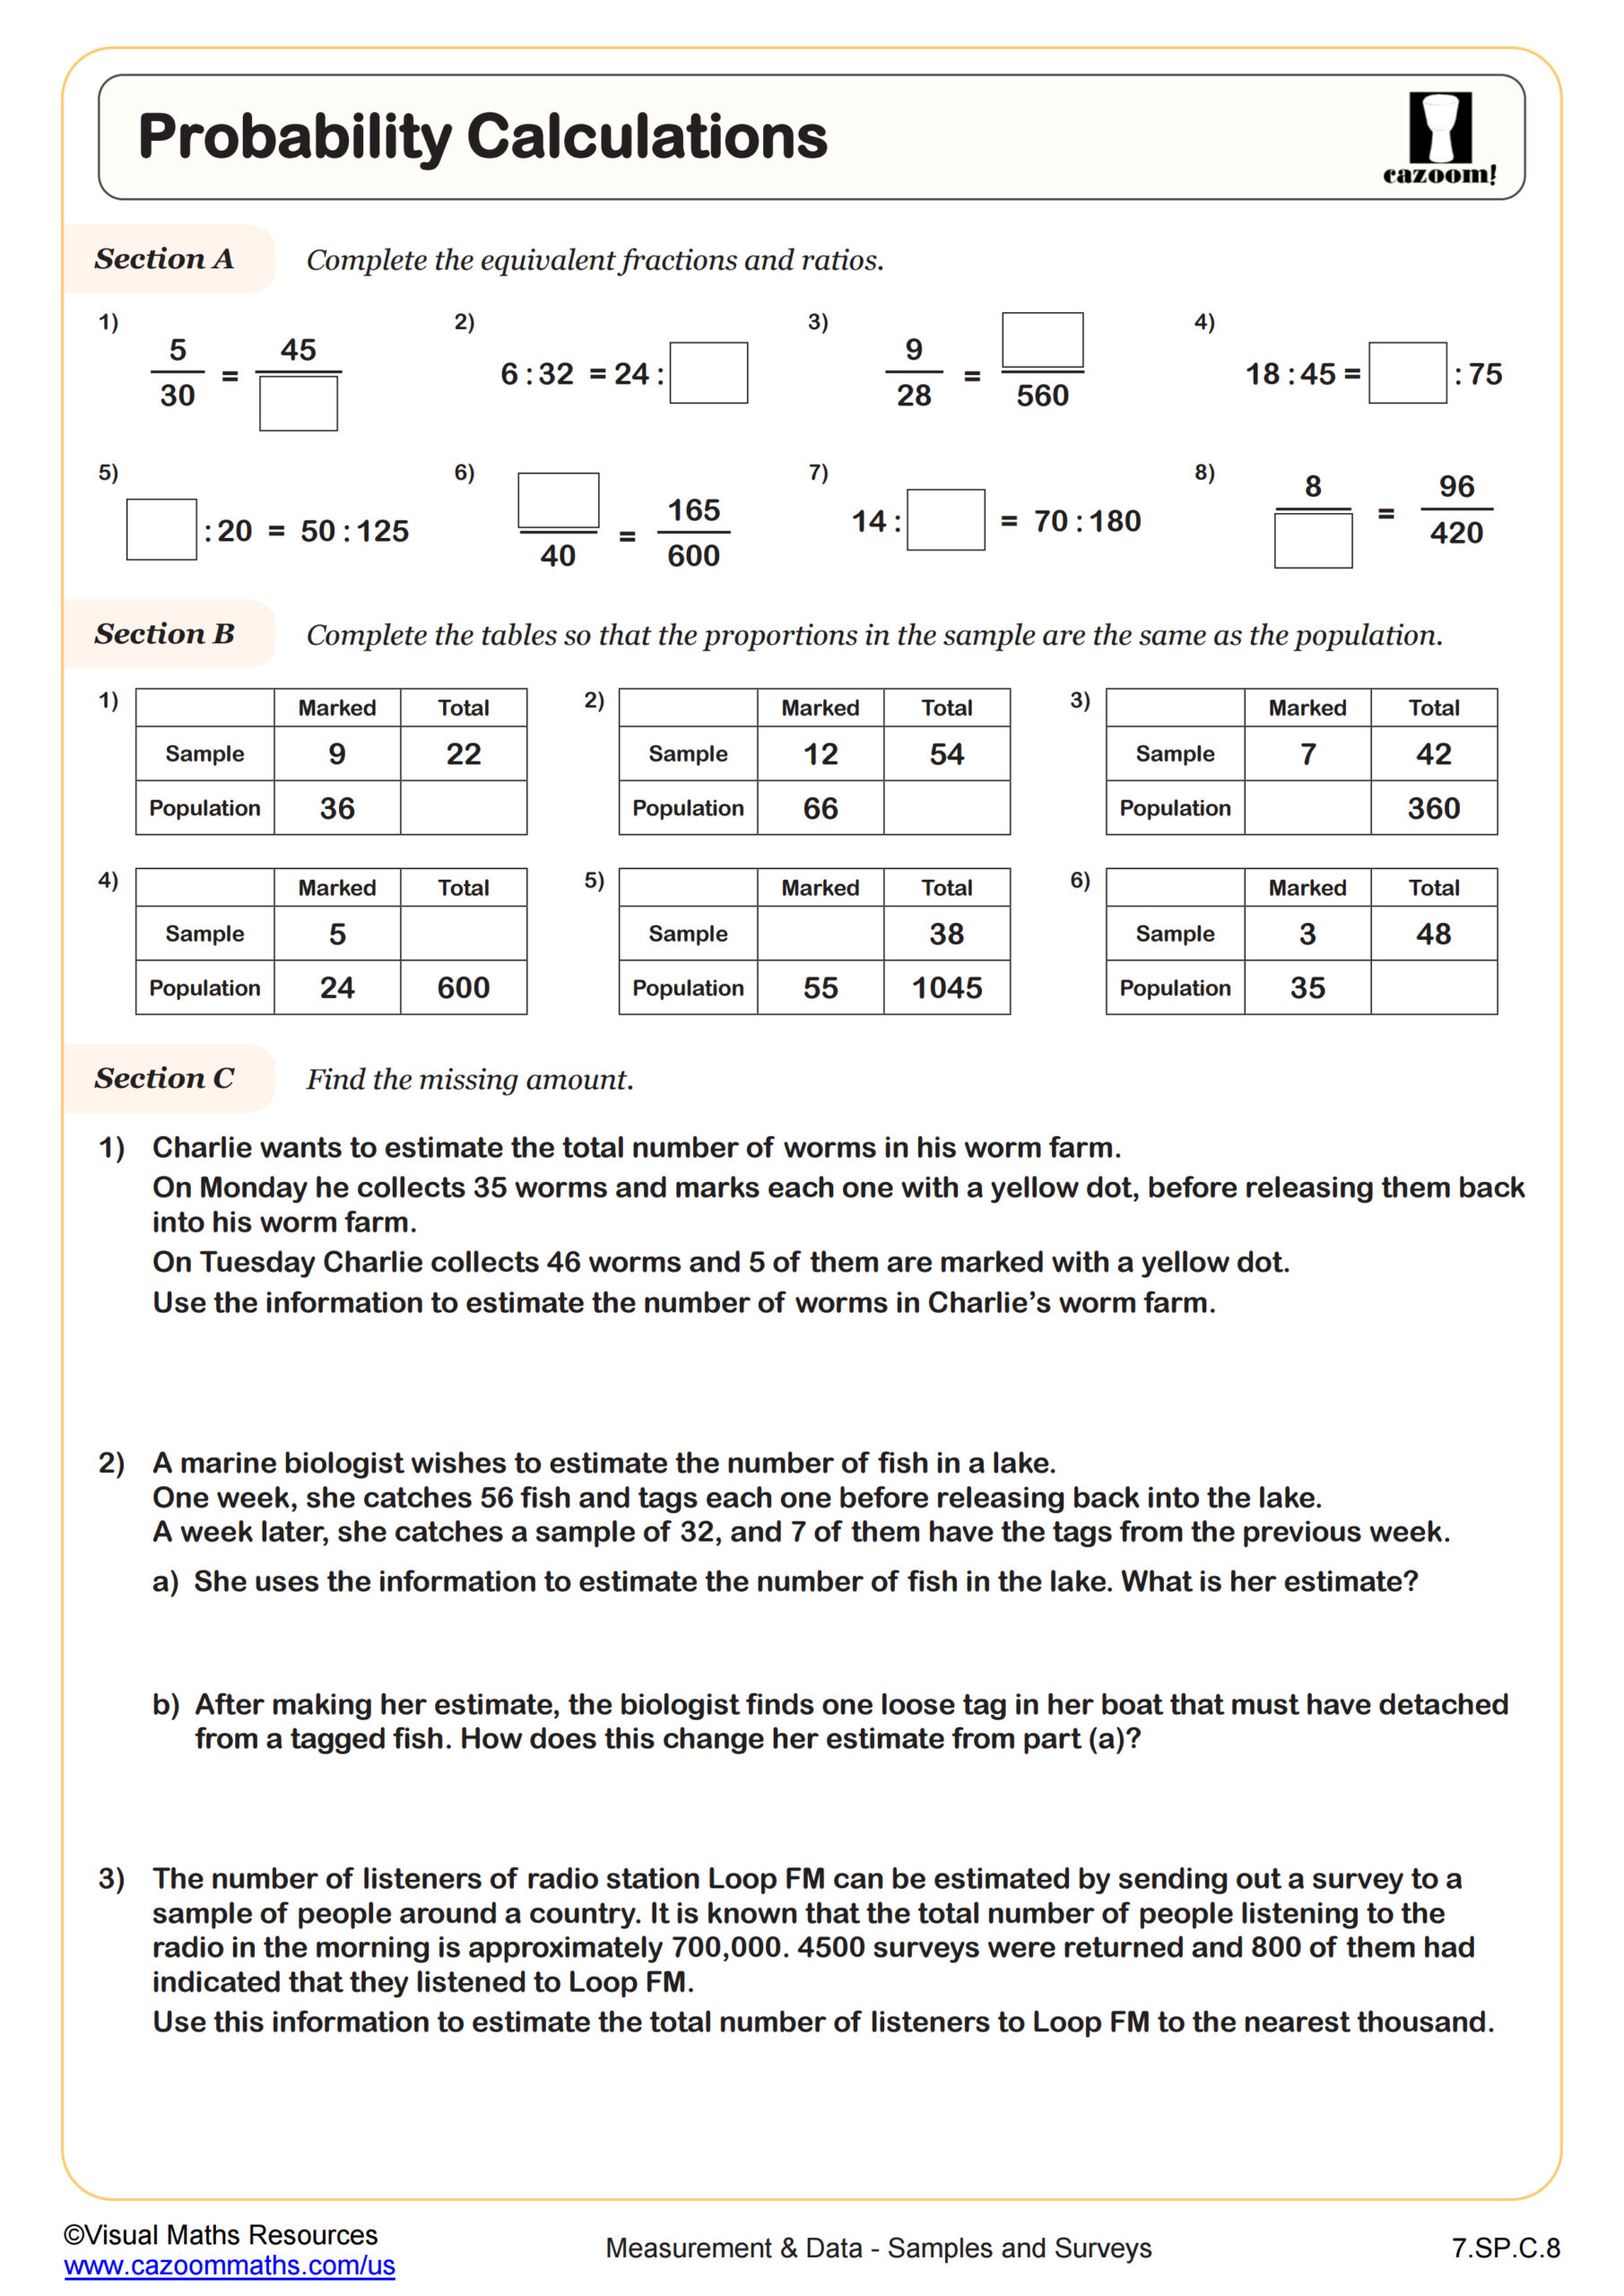
Probability Calculations
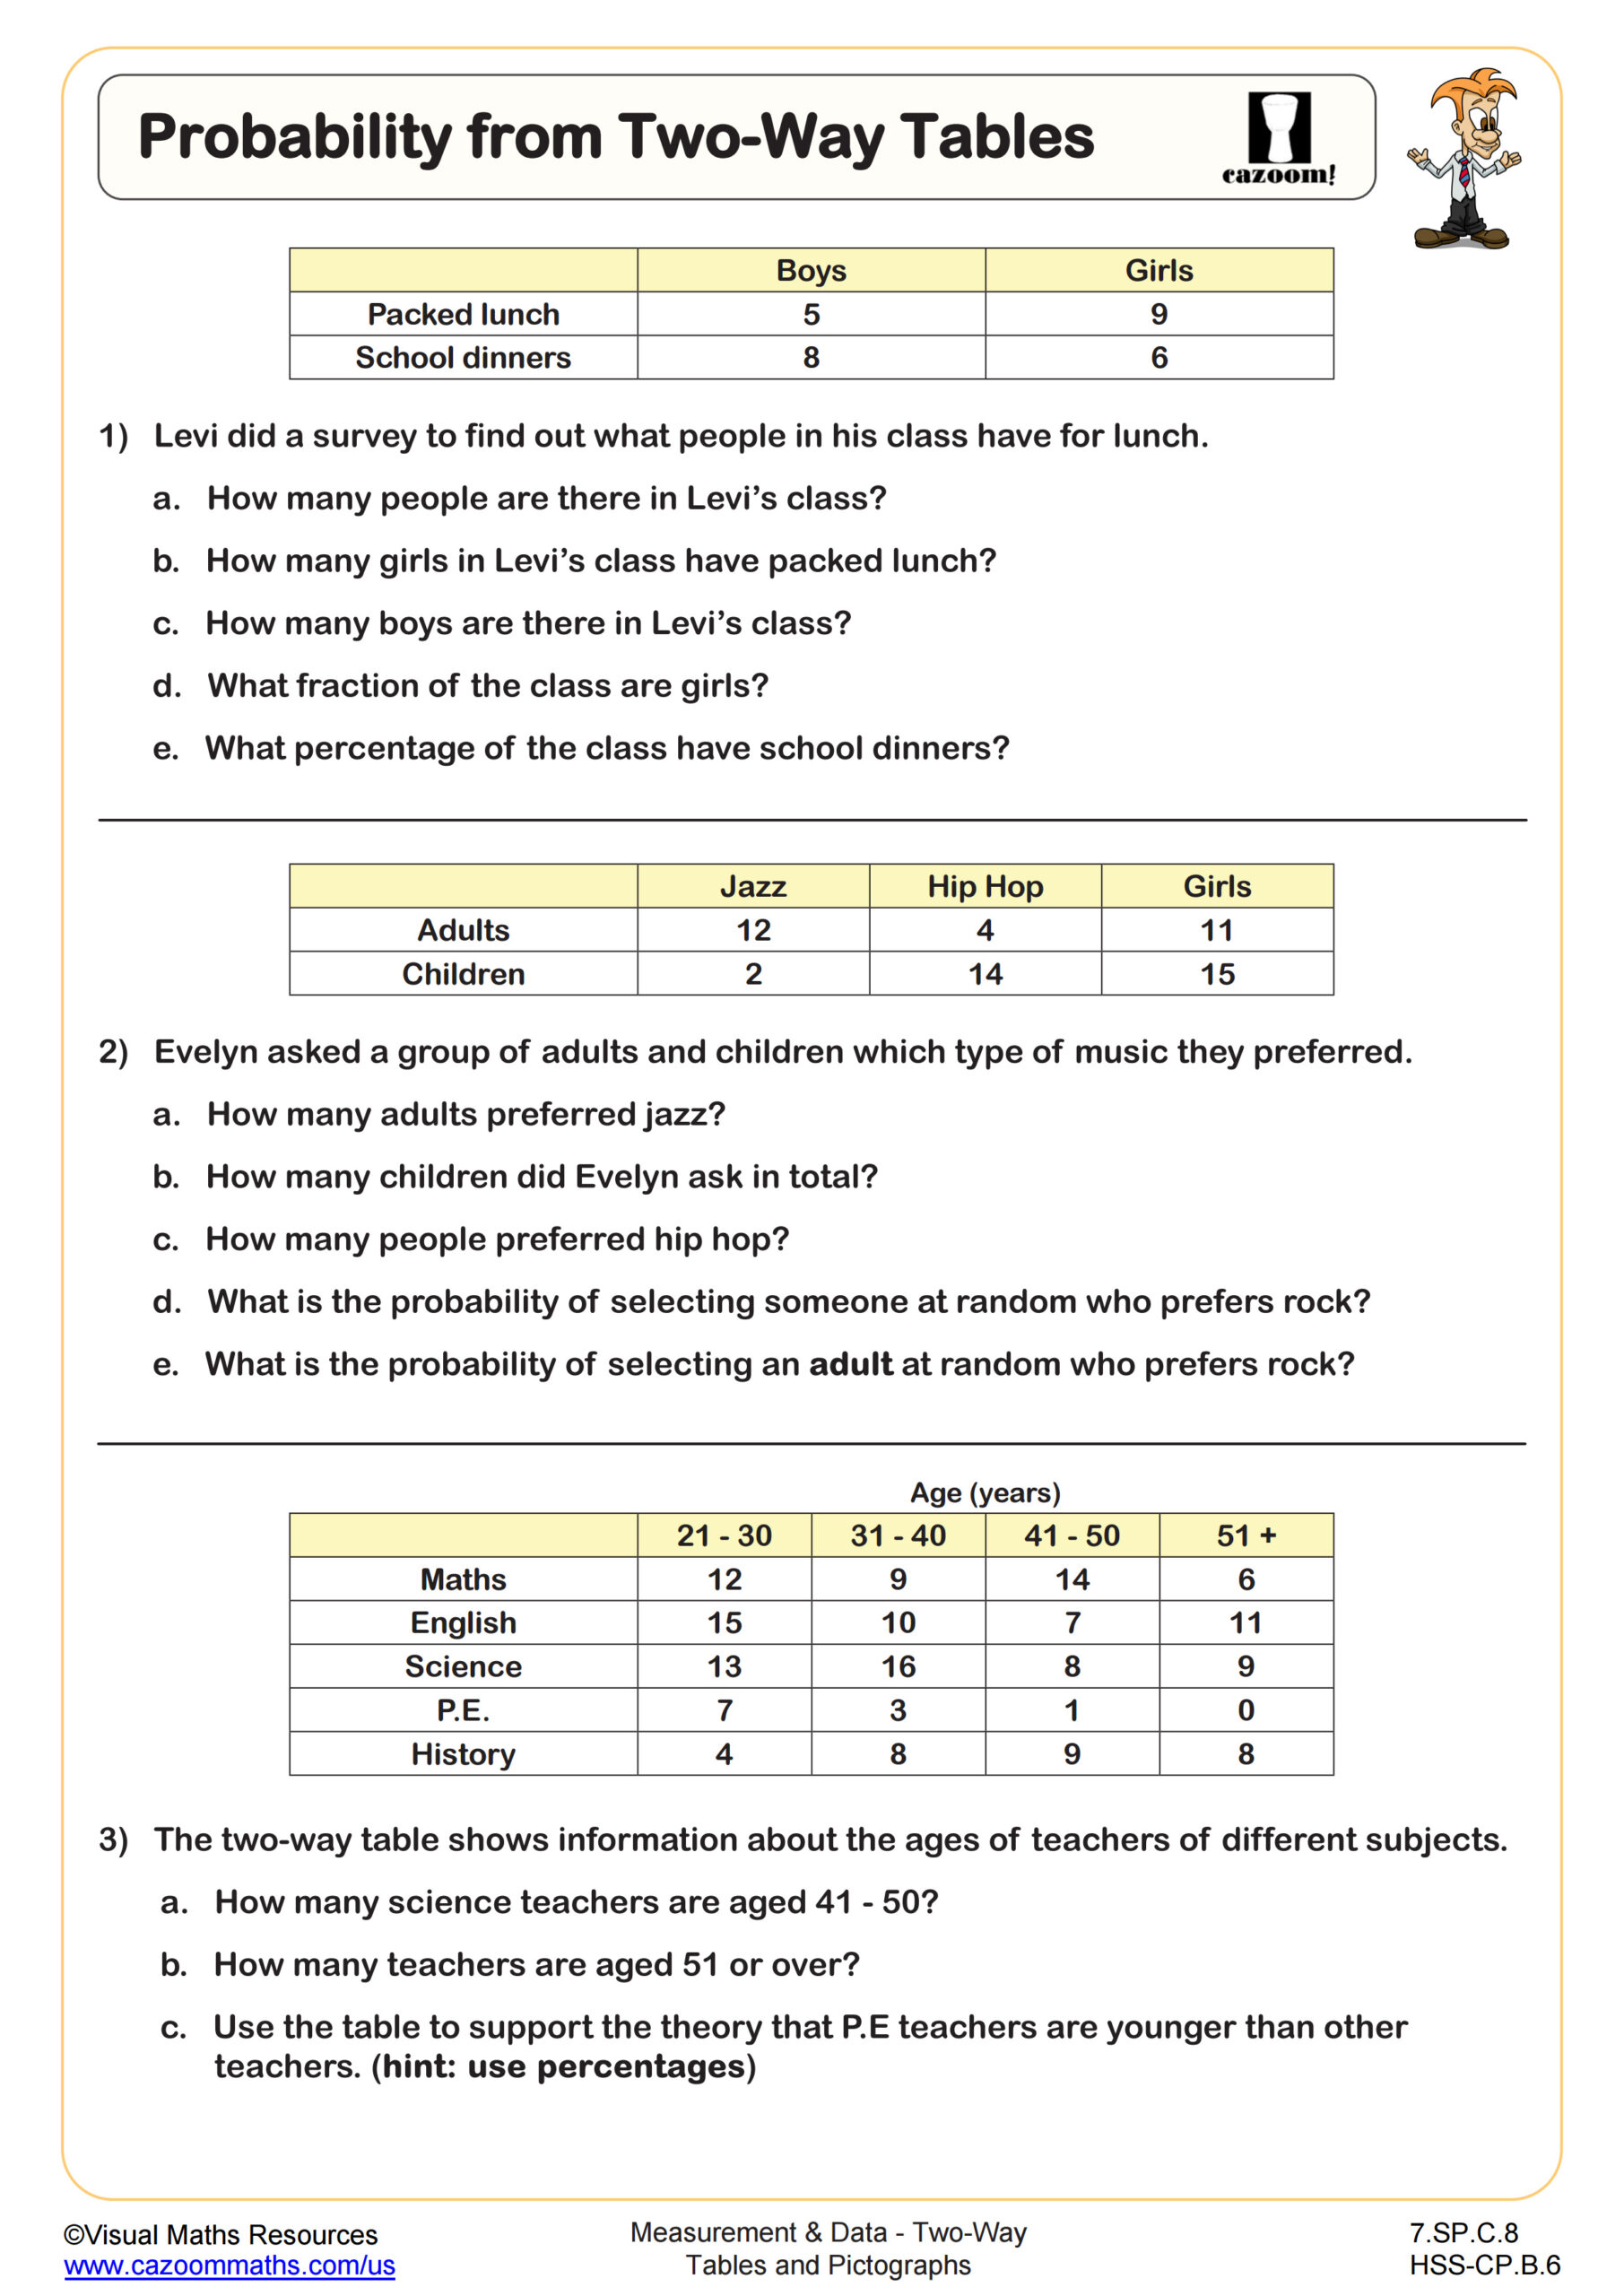
Probability from Two-Way Tables
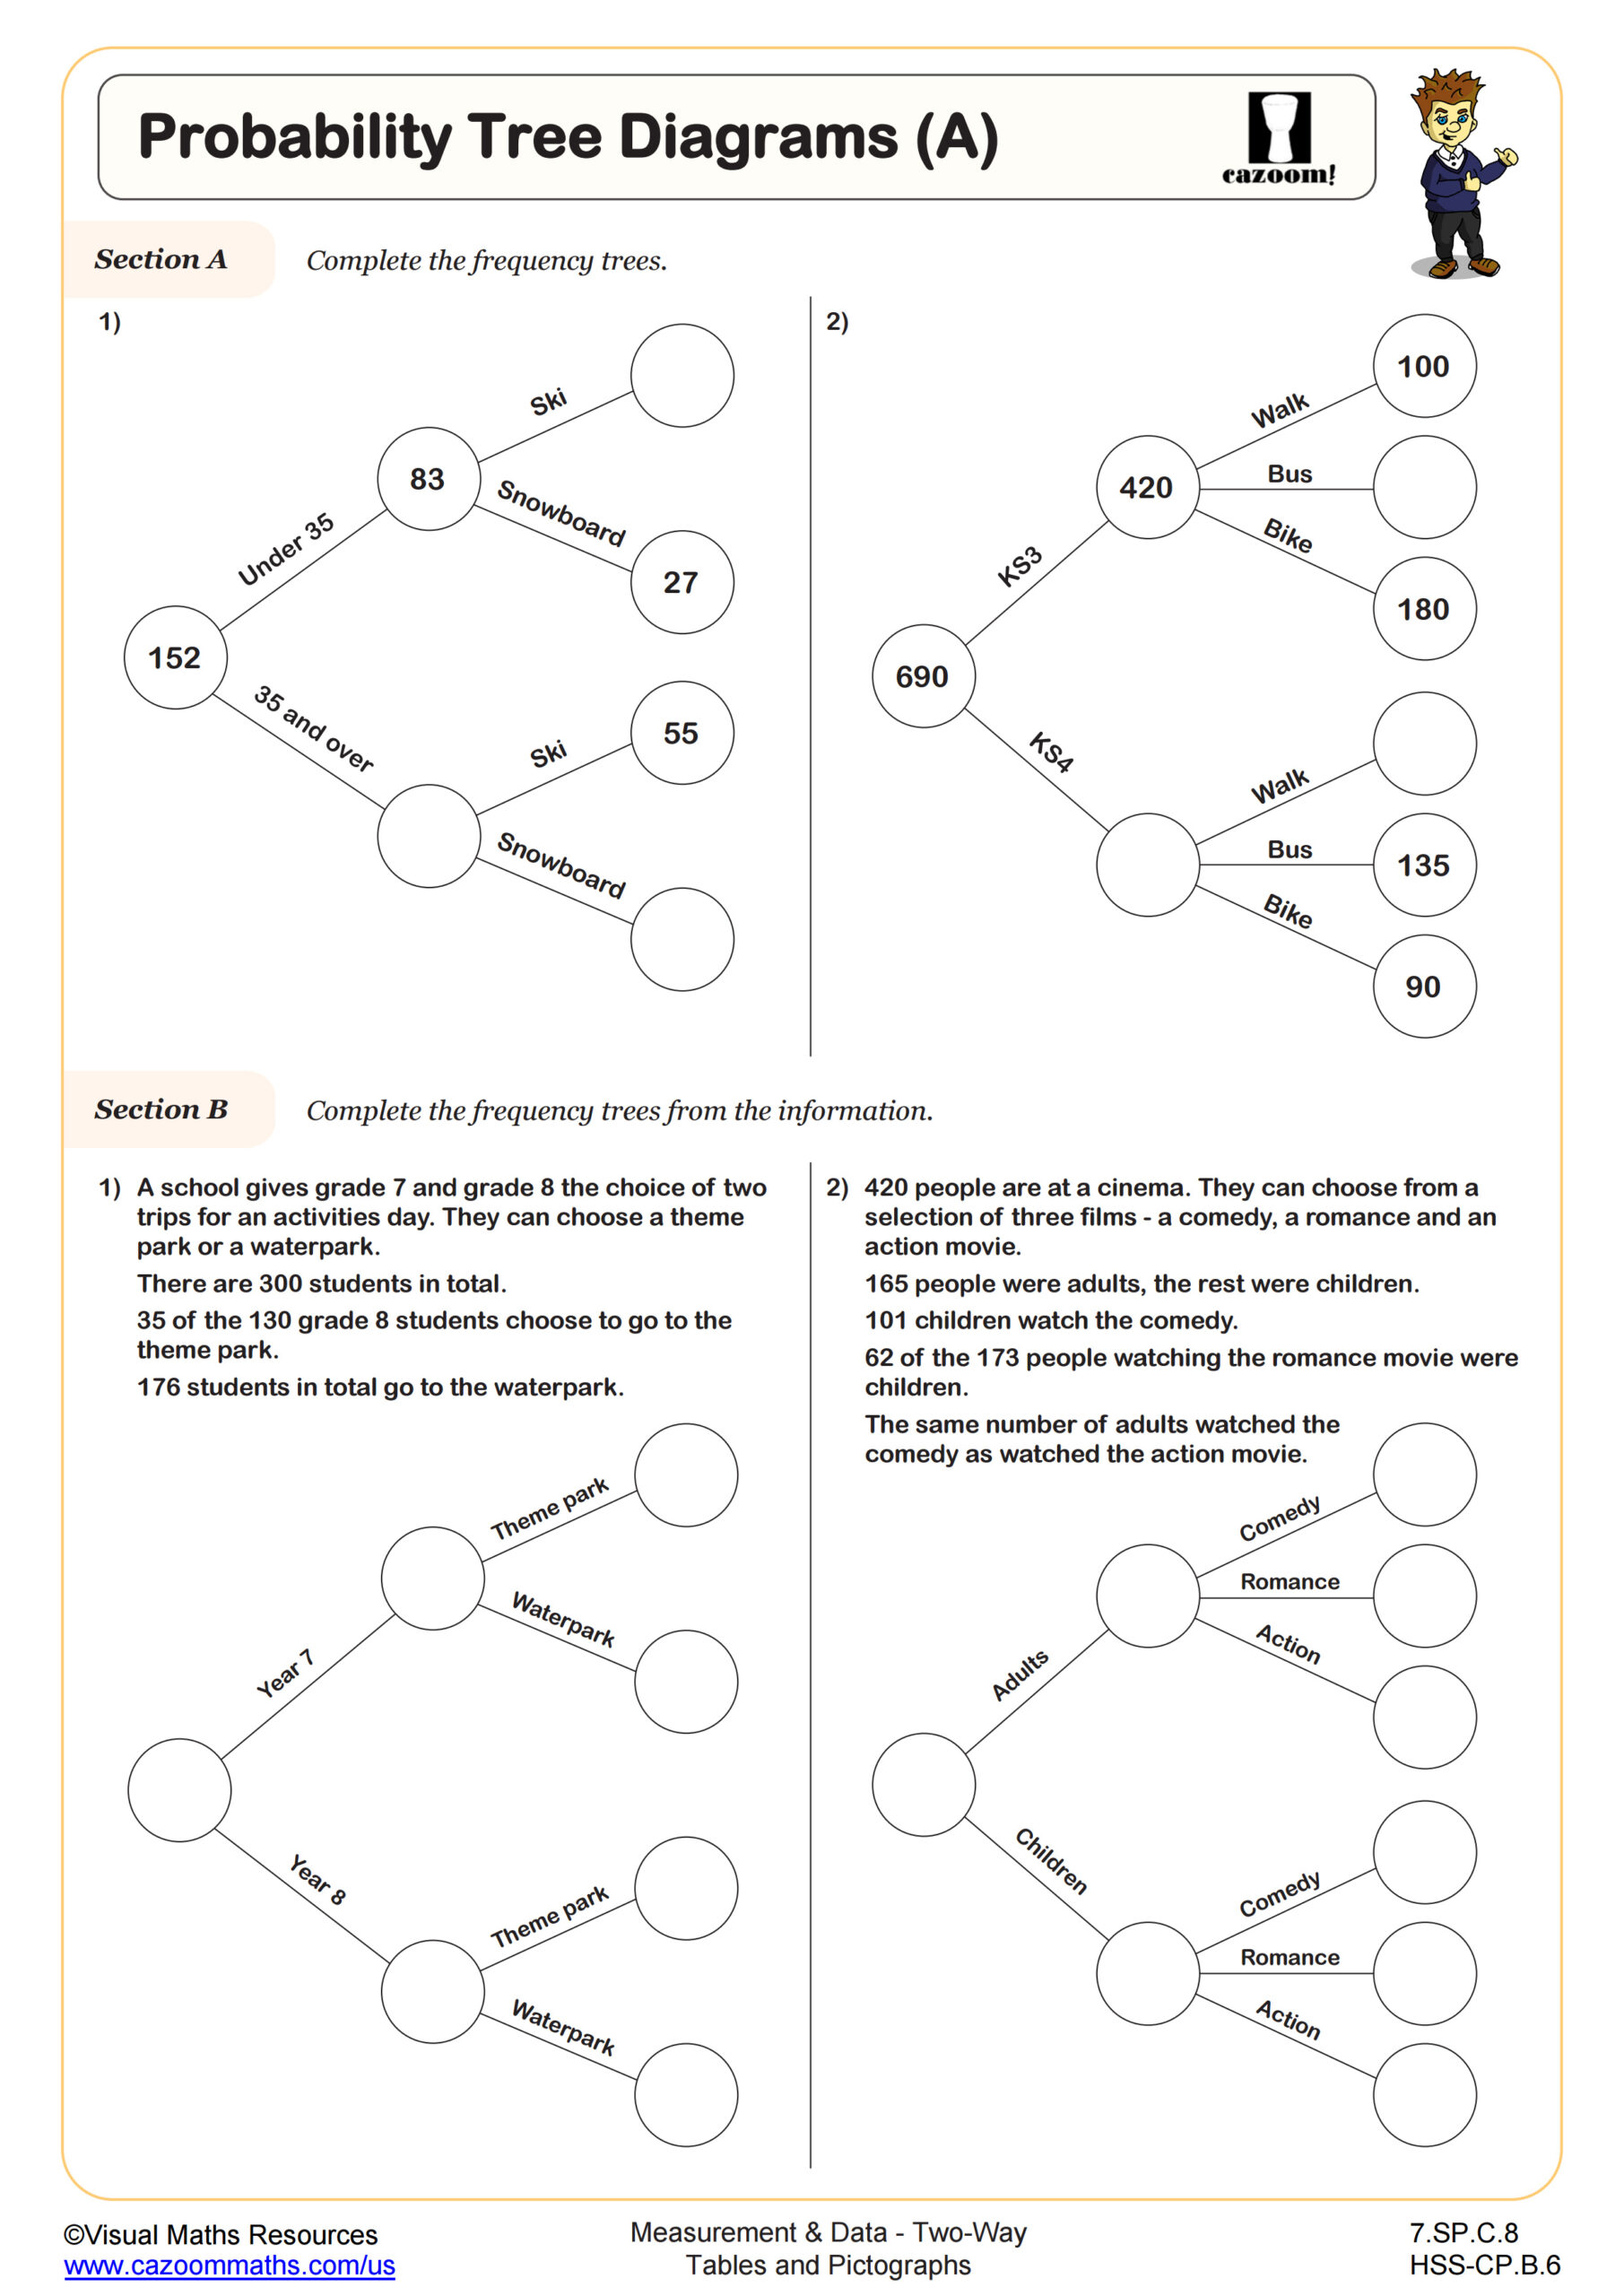
Probability Tree Diagrams (A)
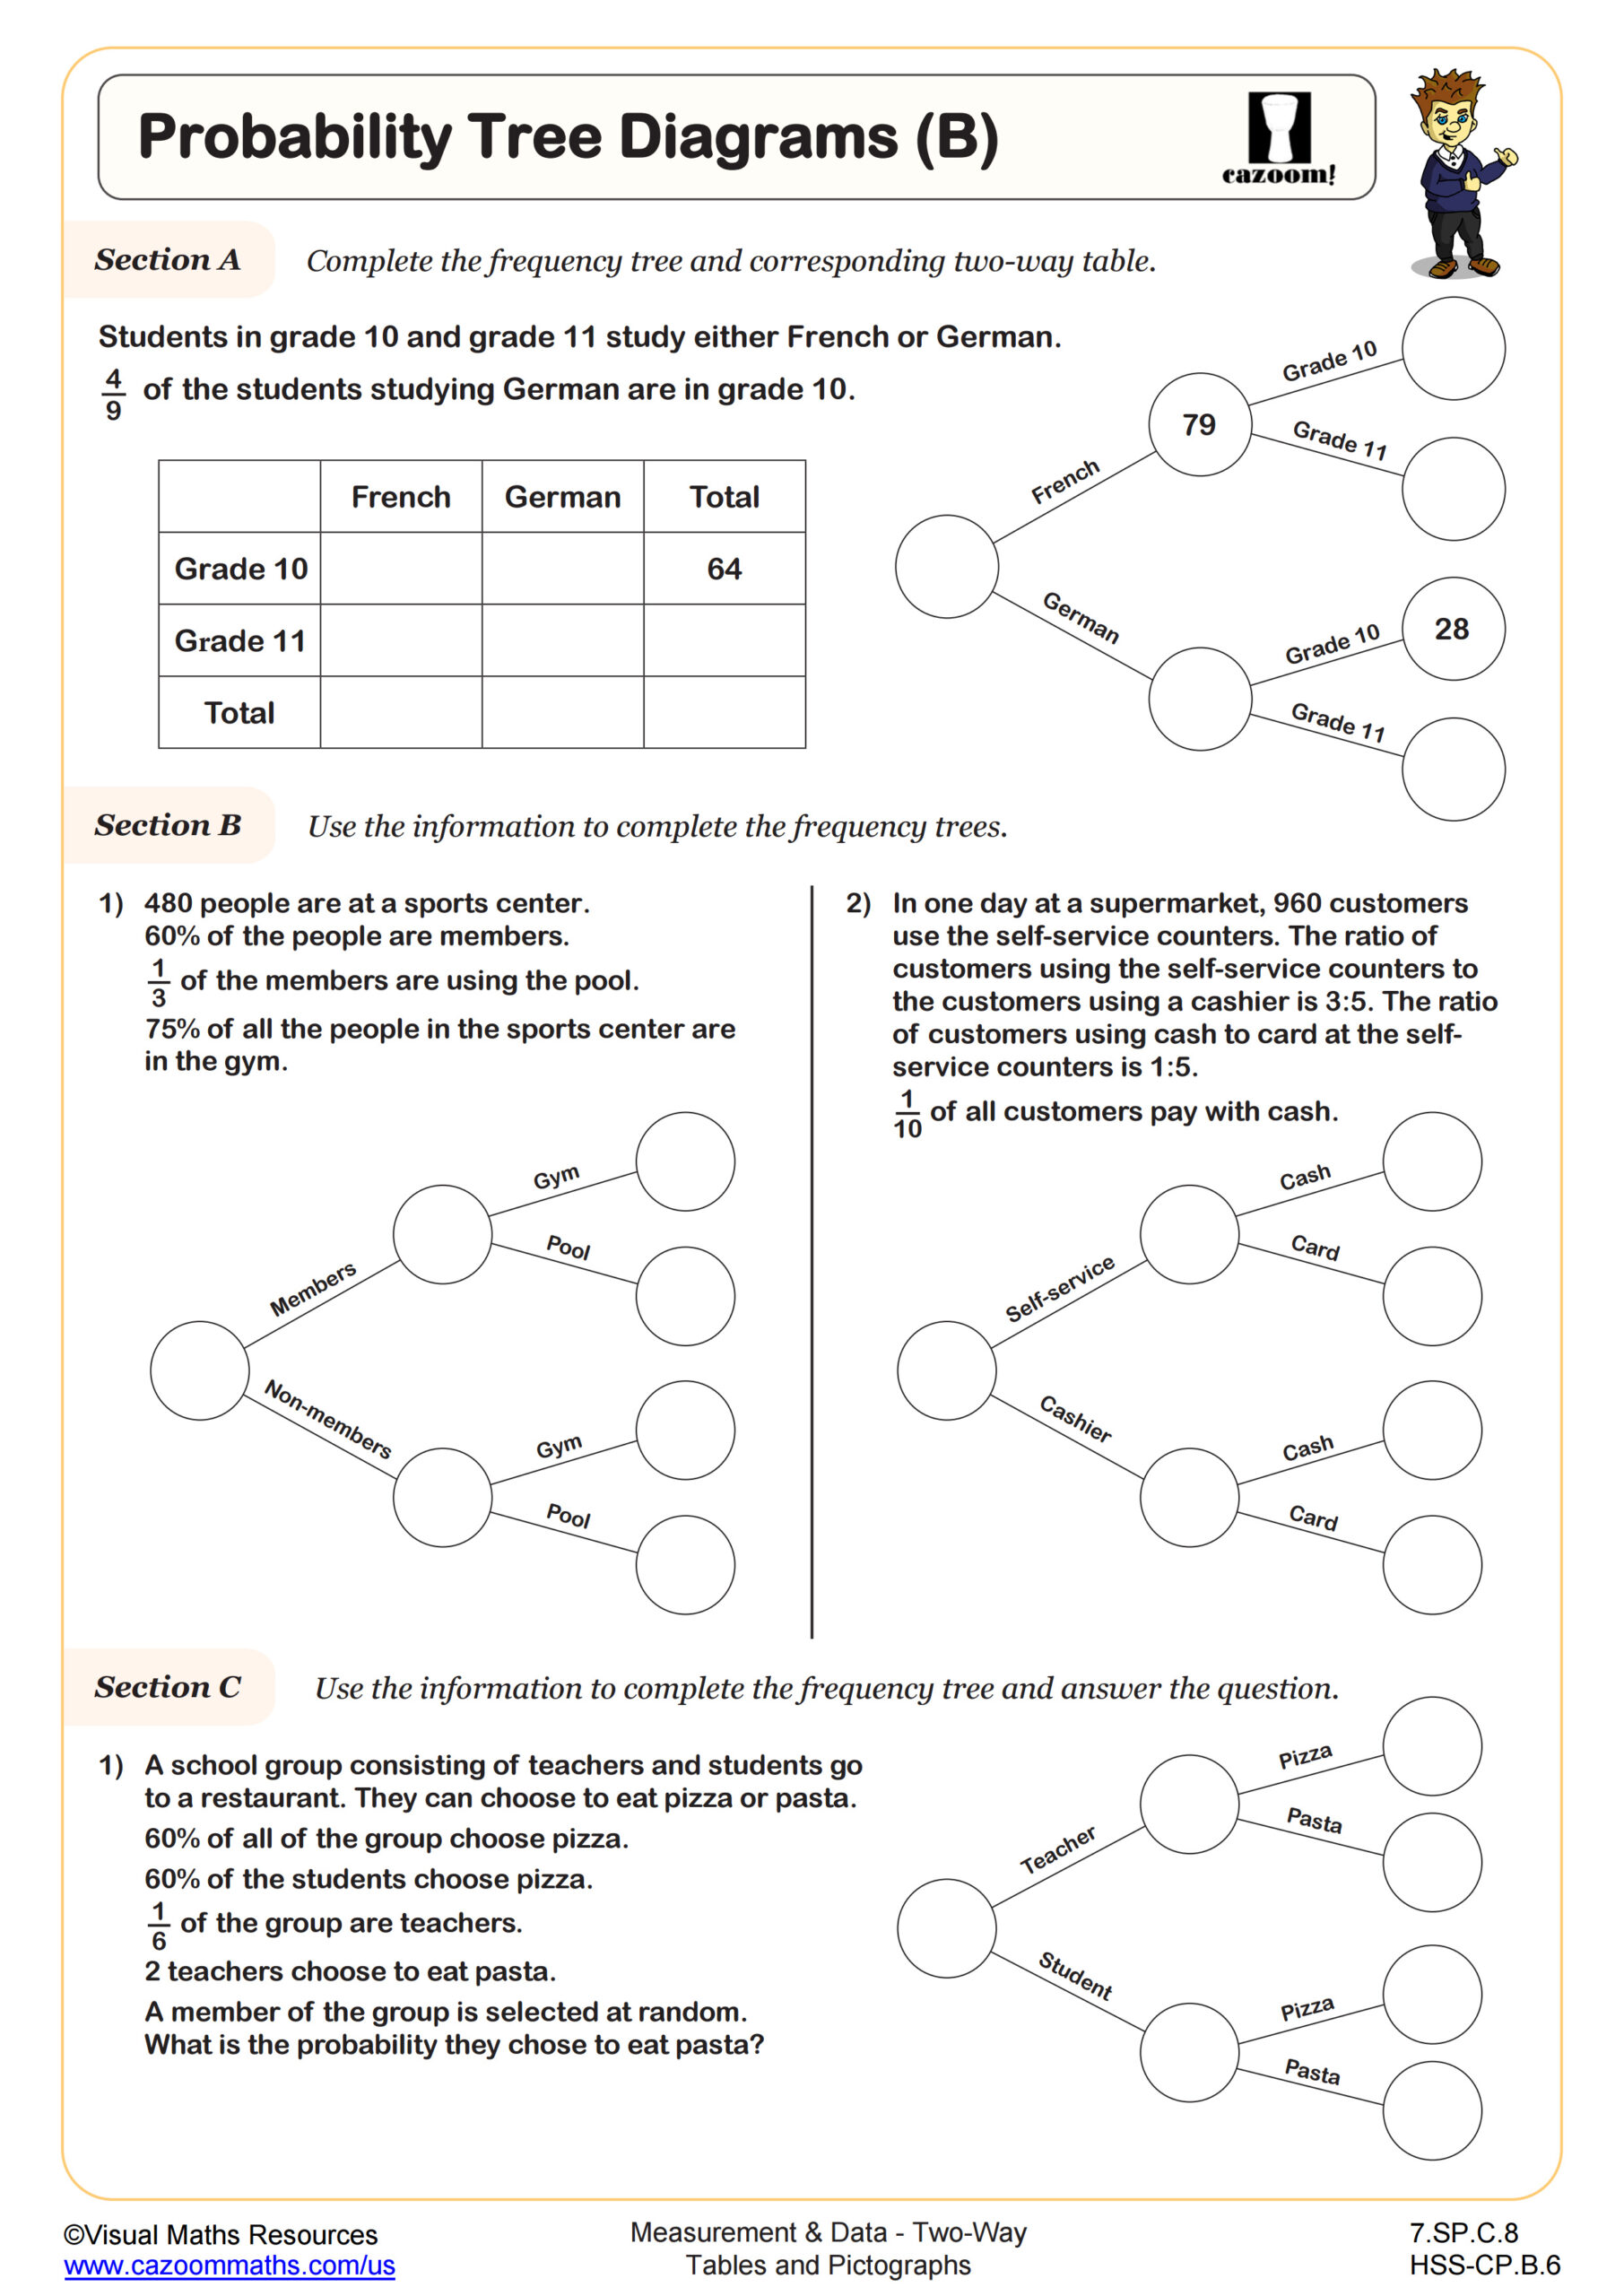
Probability Tree Diagrams (B)
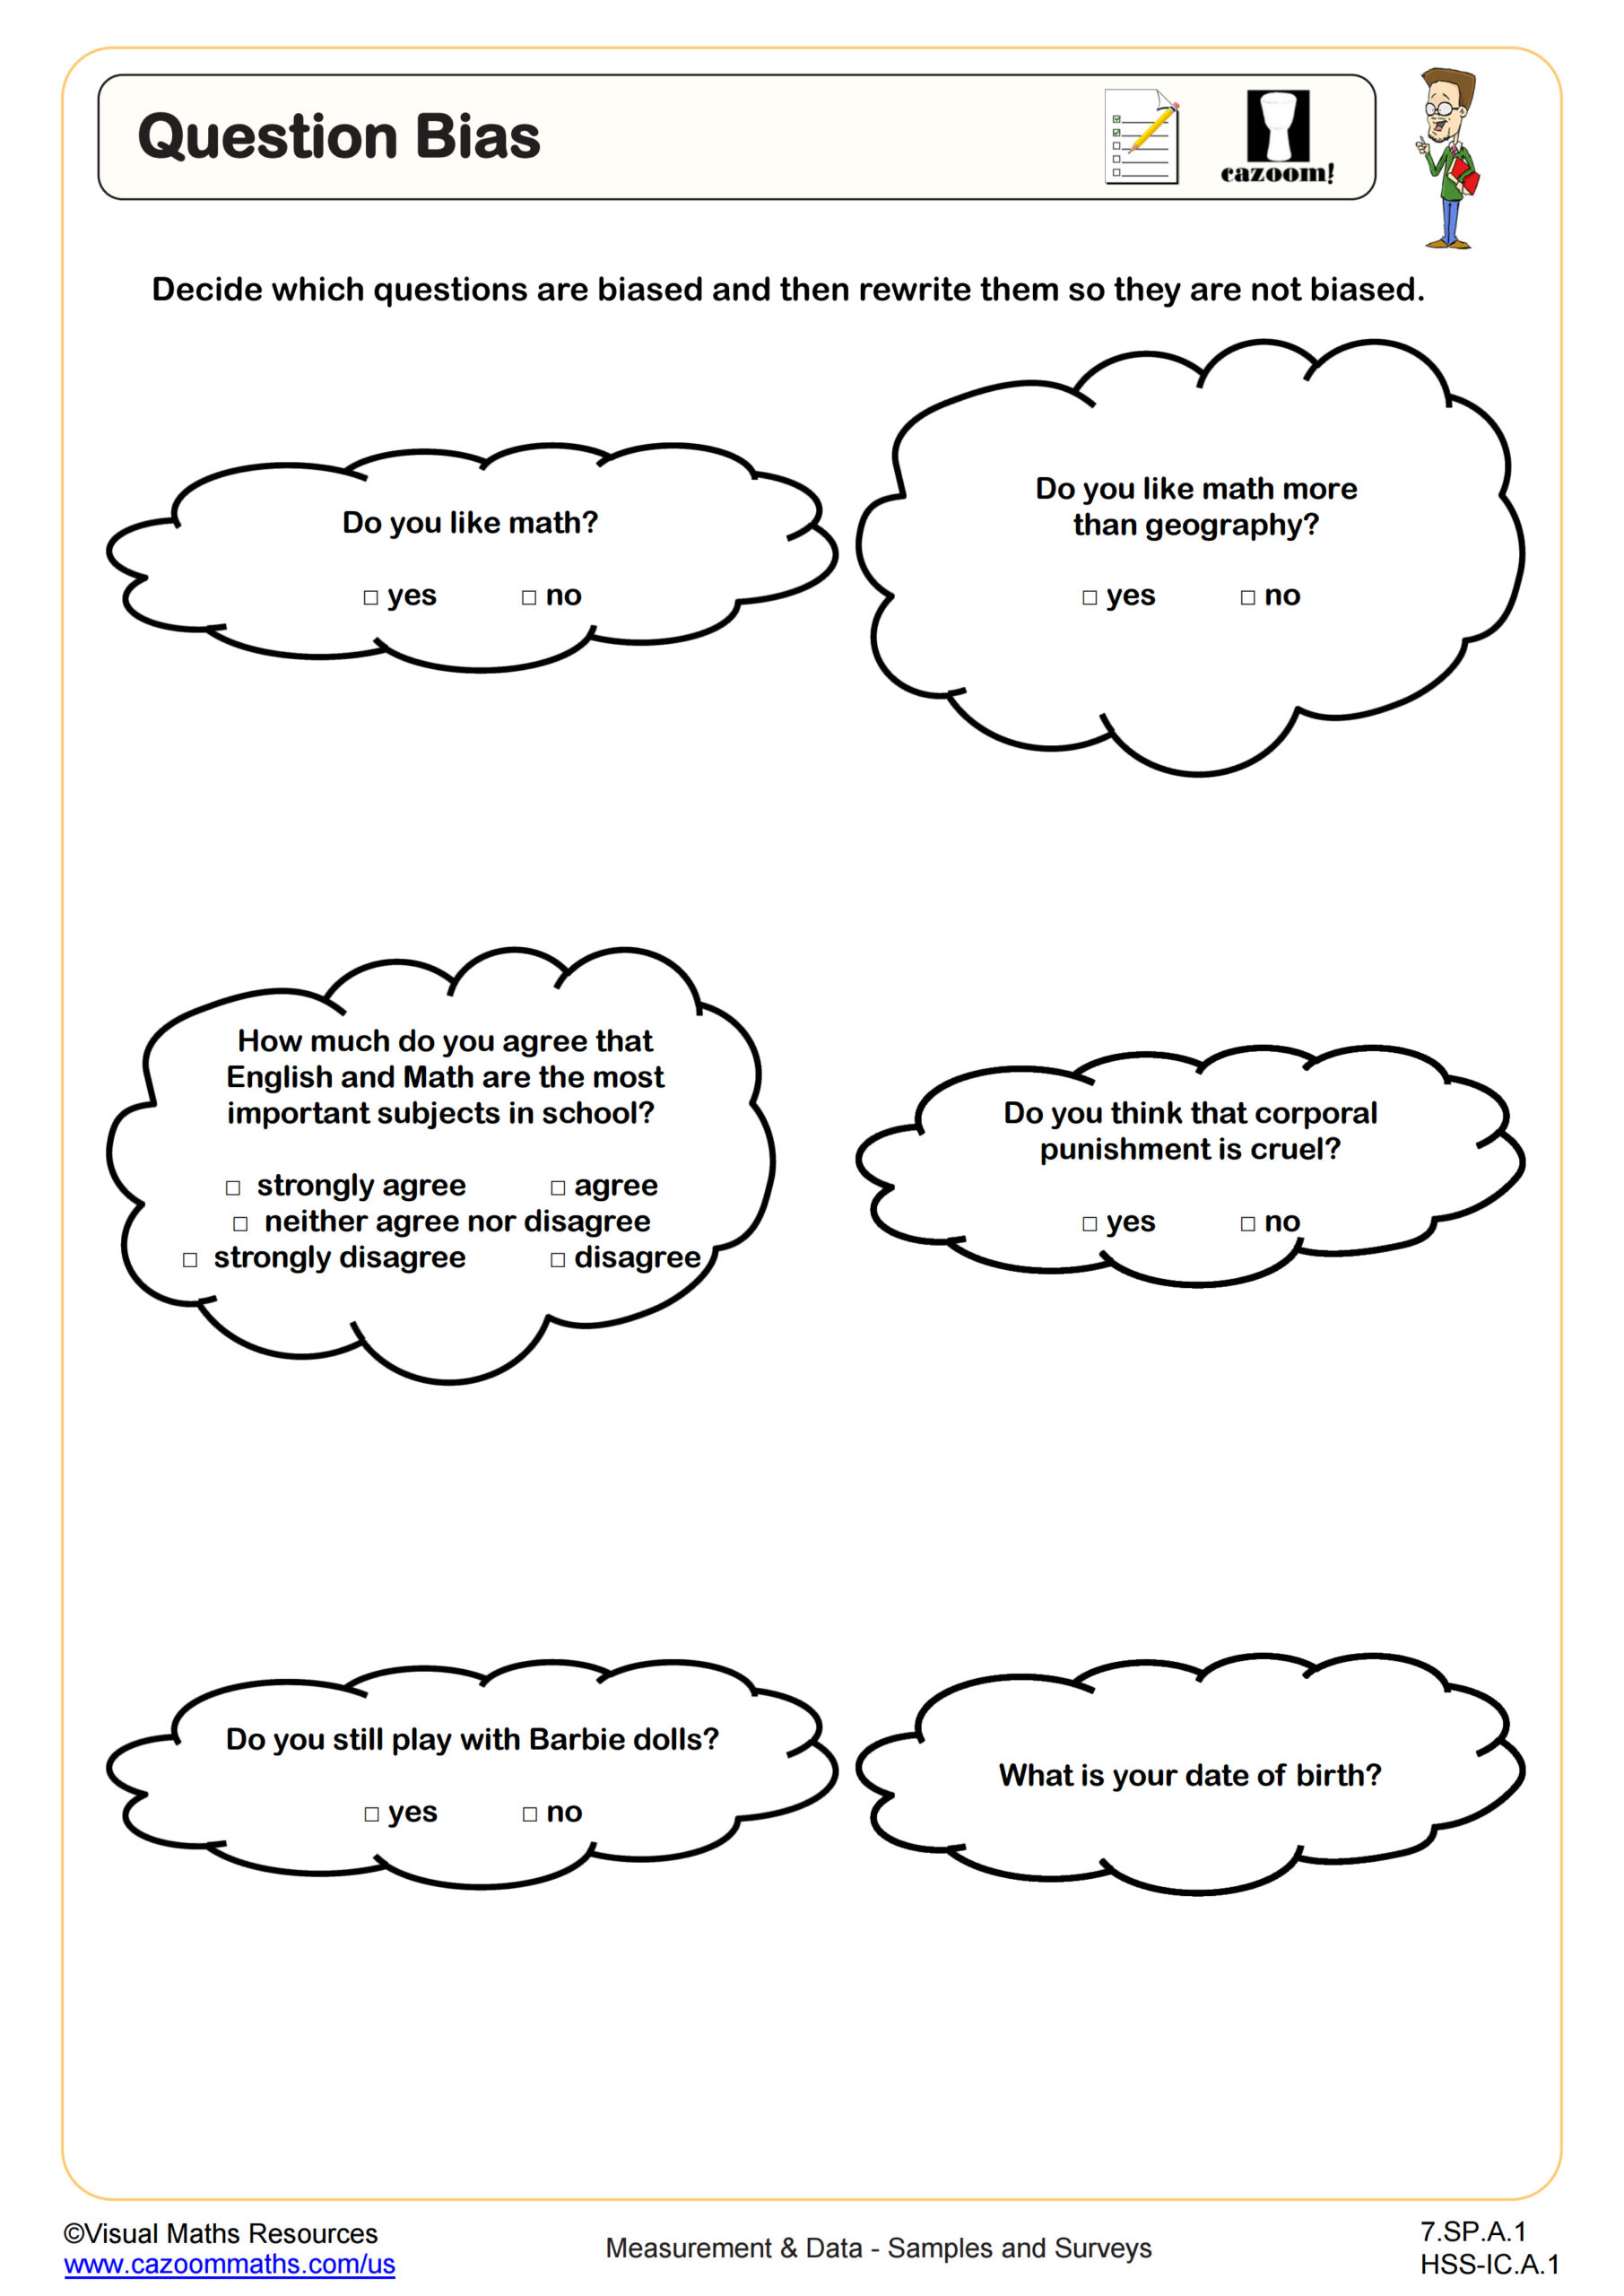
Question Bias
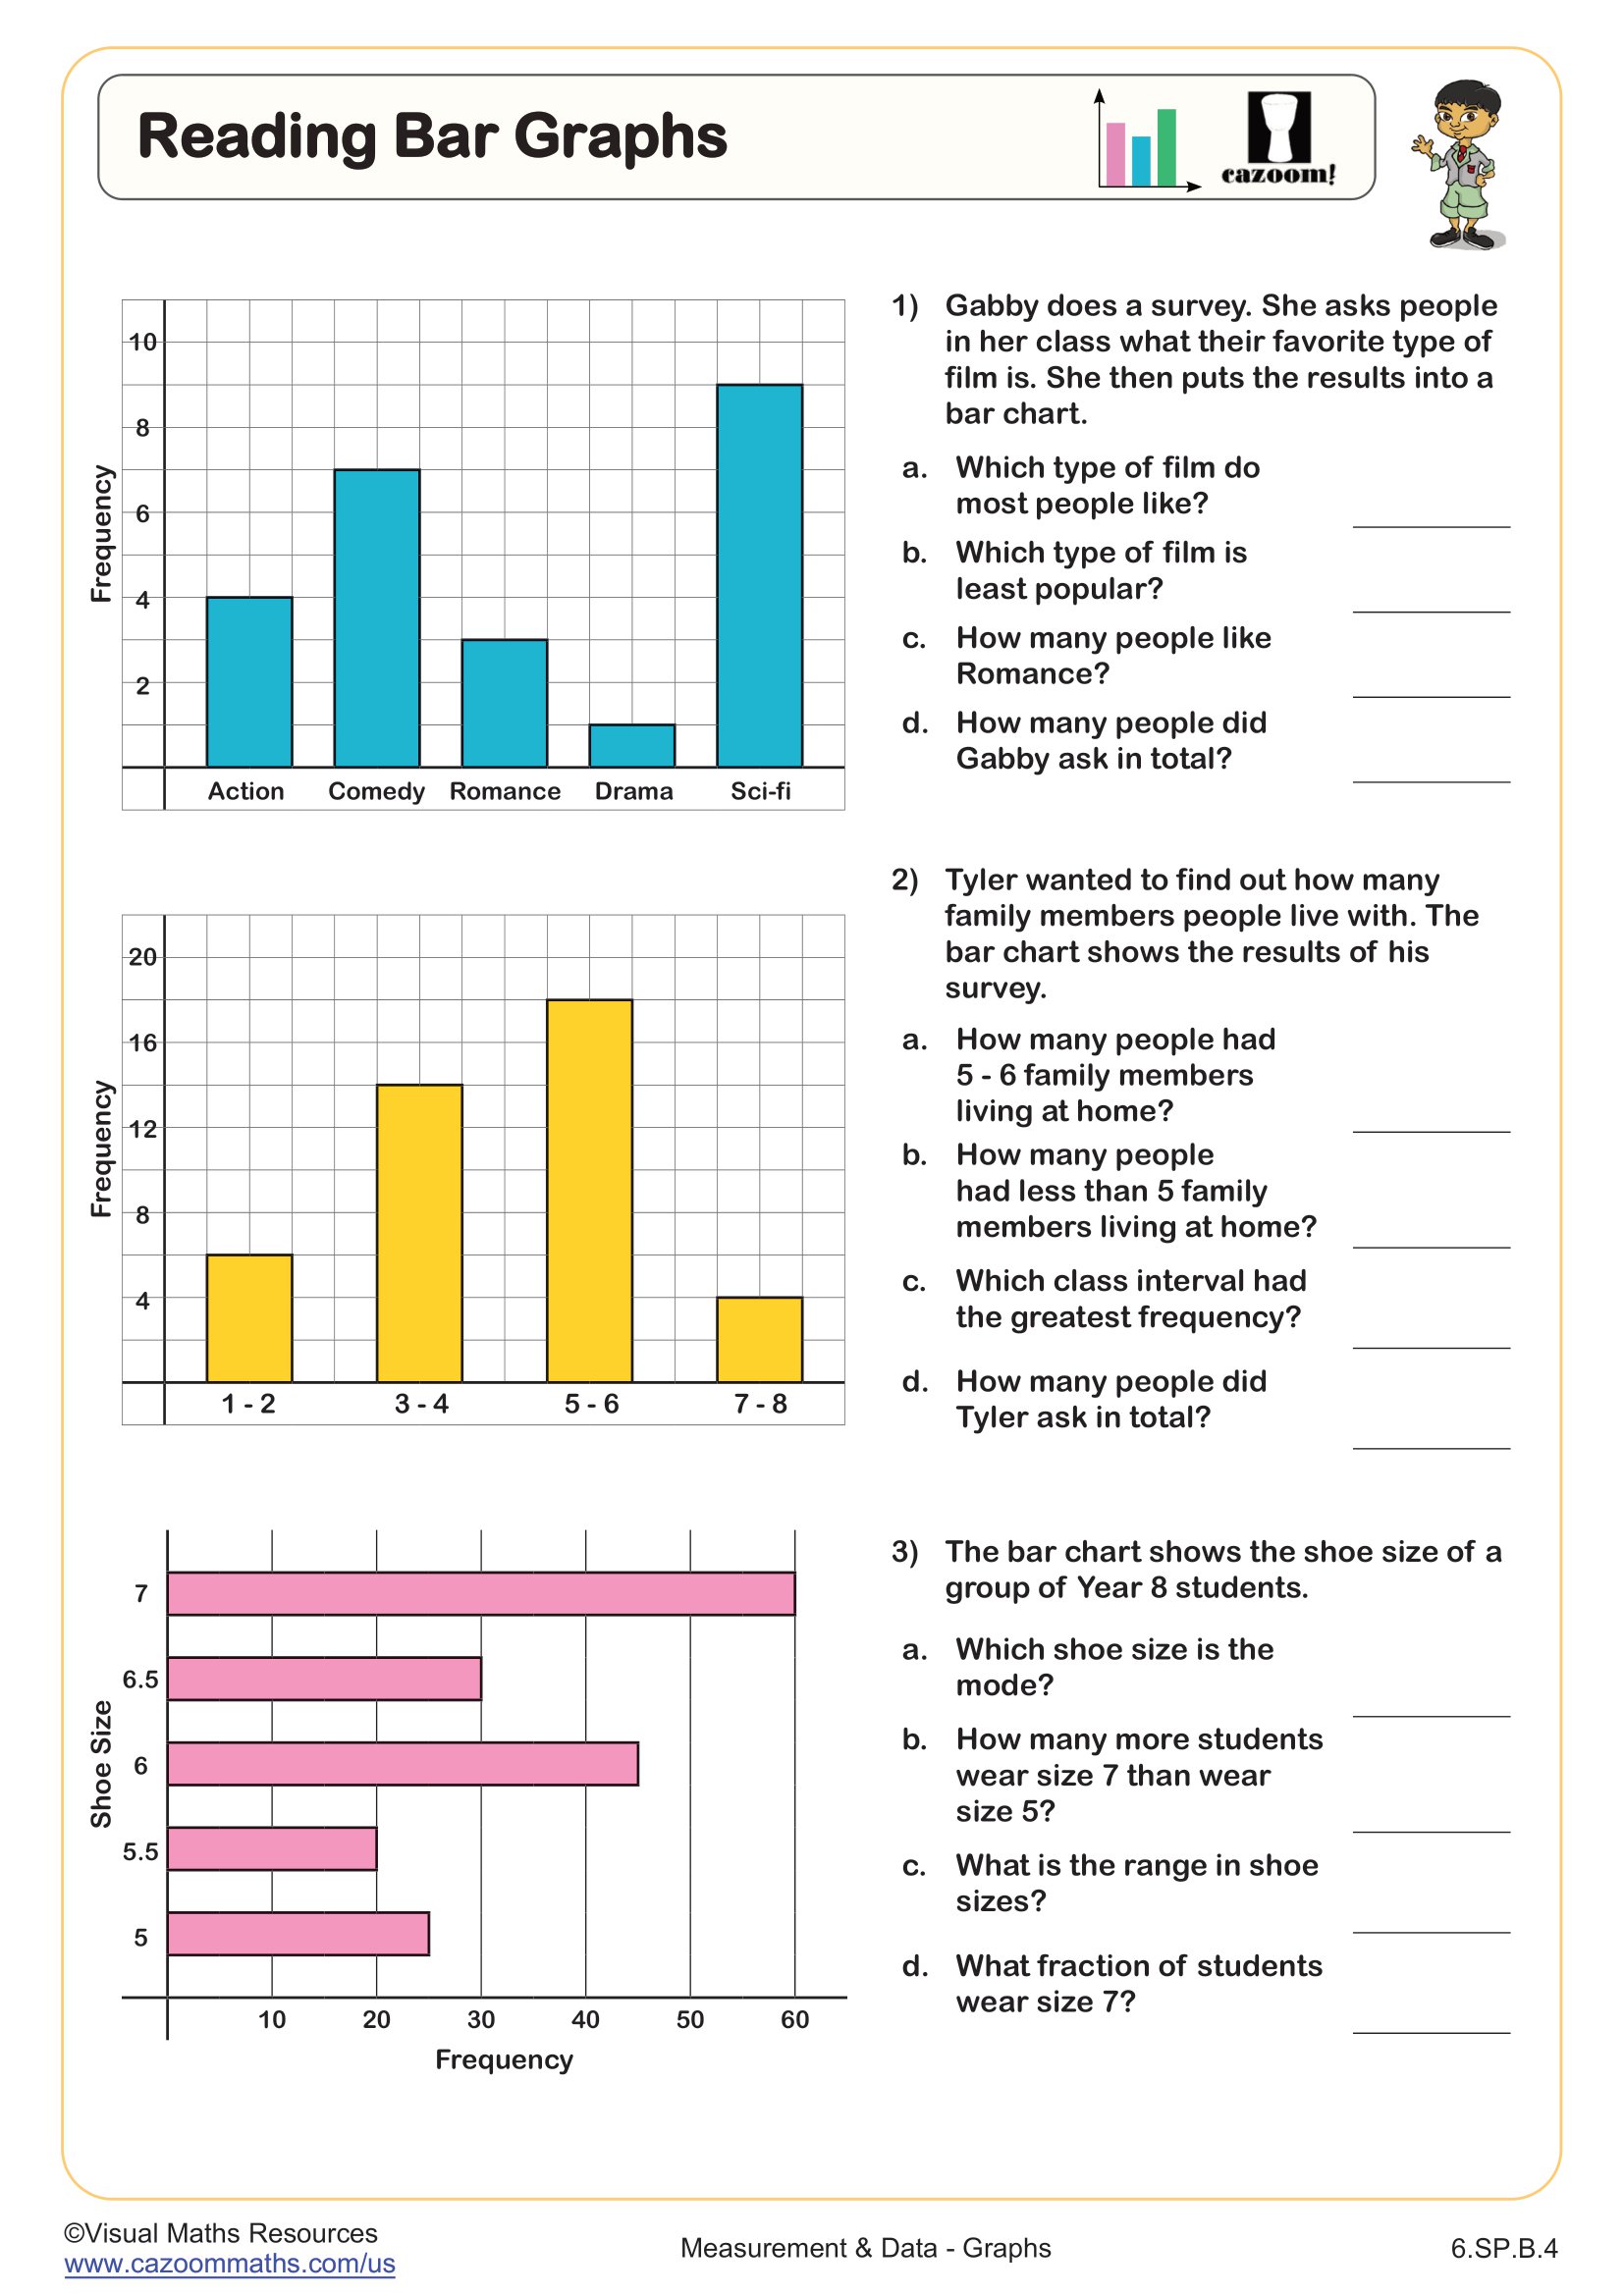
Reading Bar Graphs
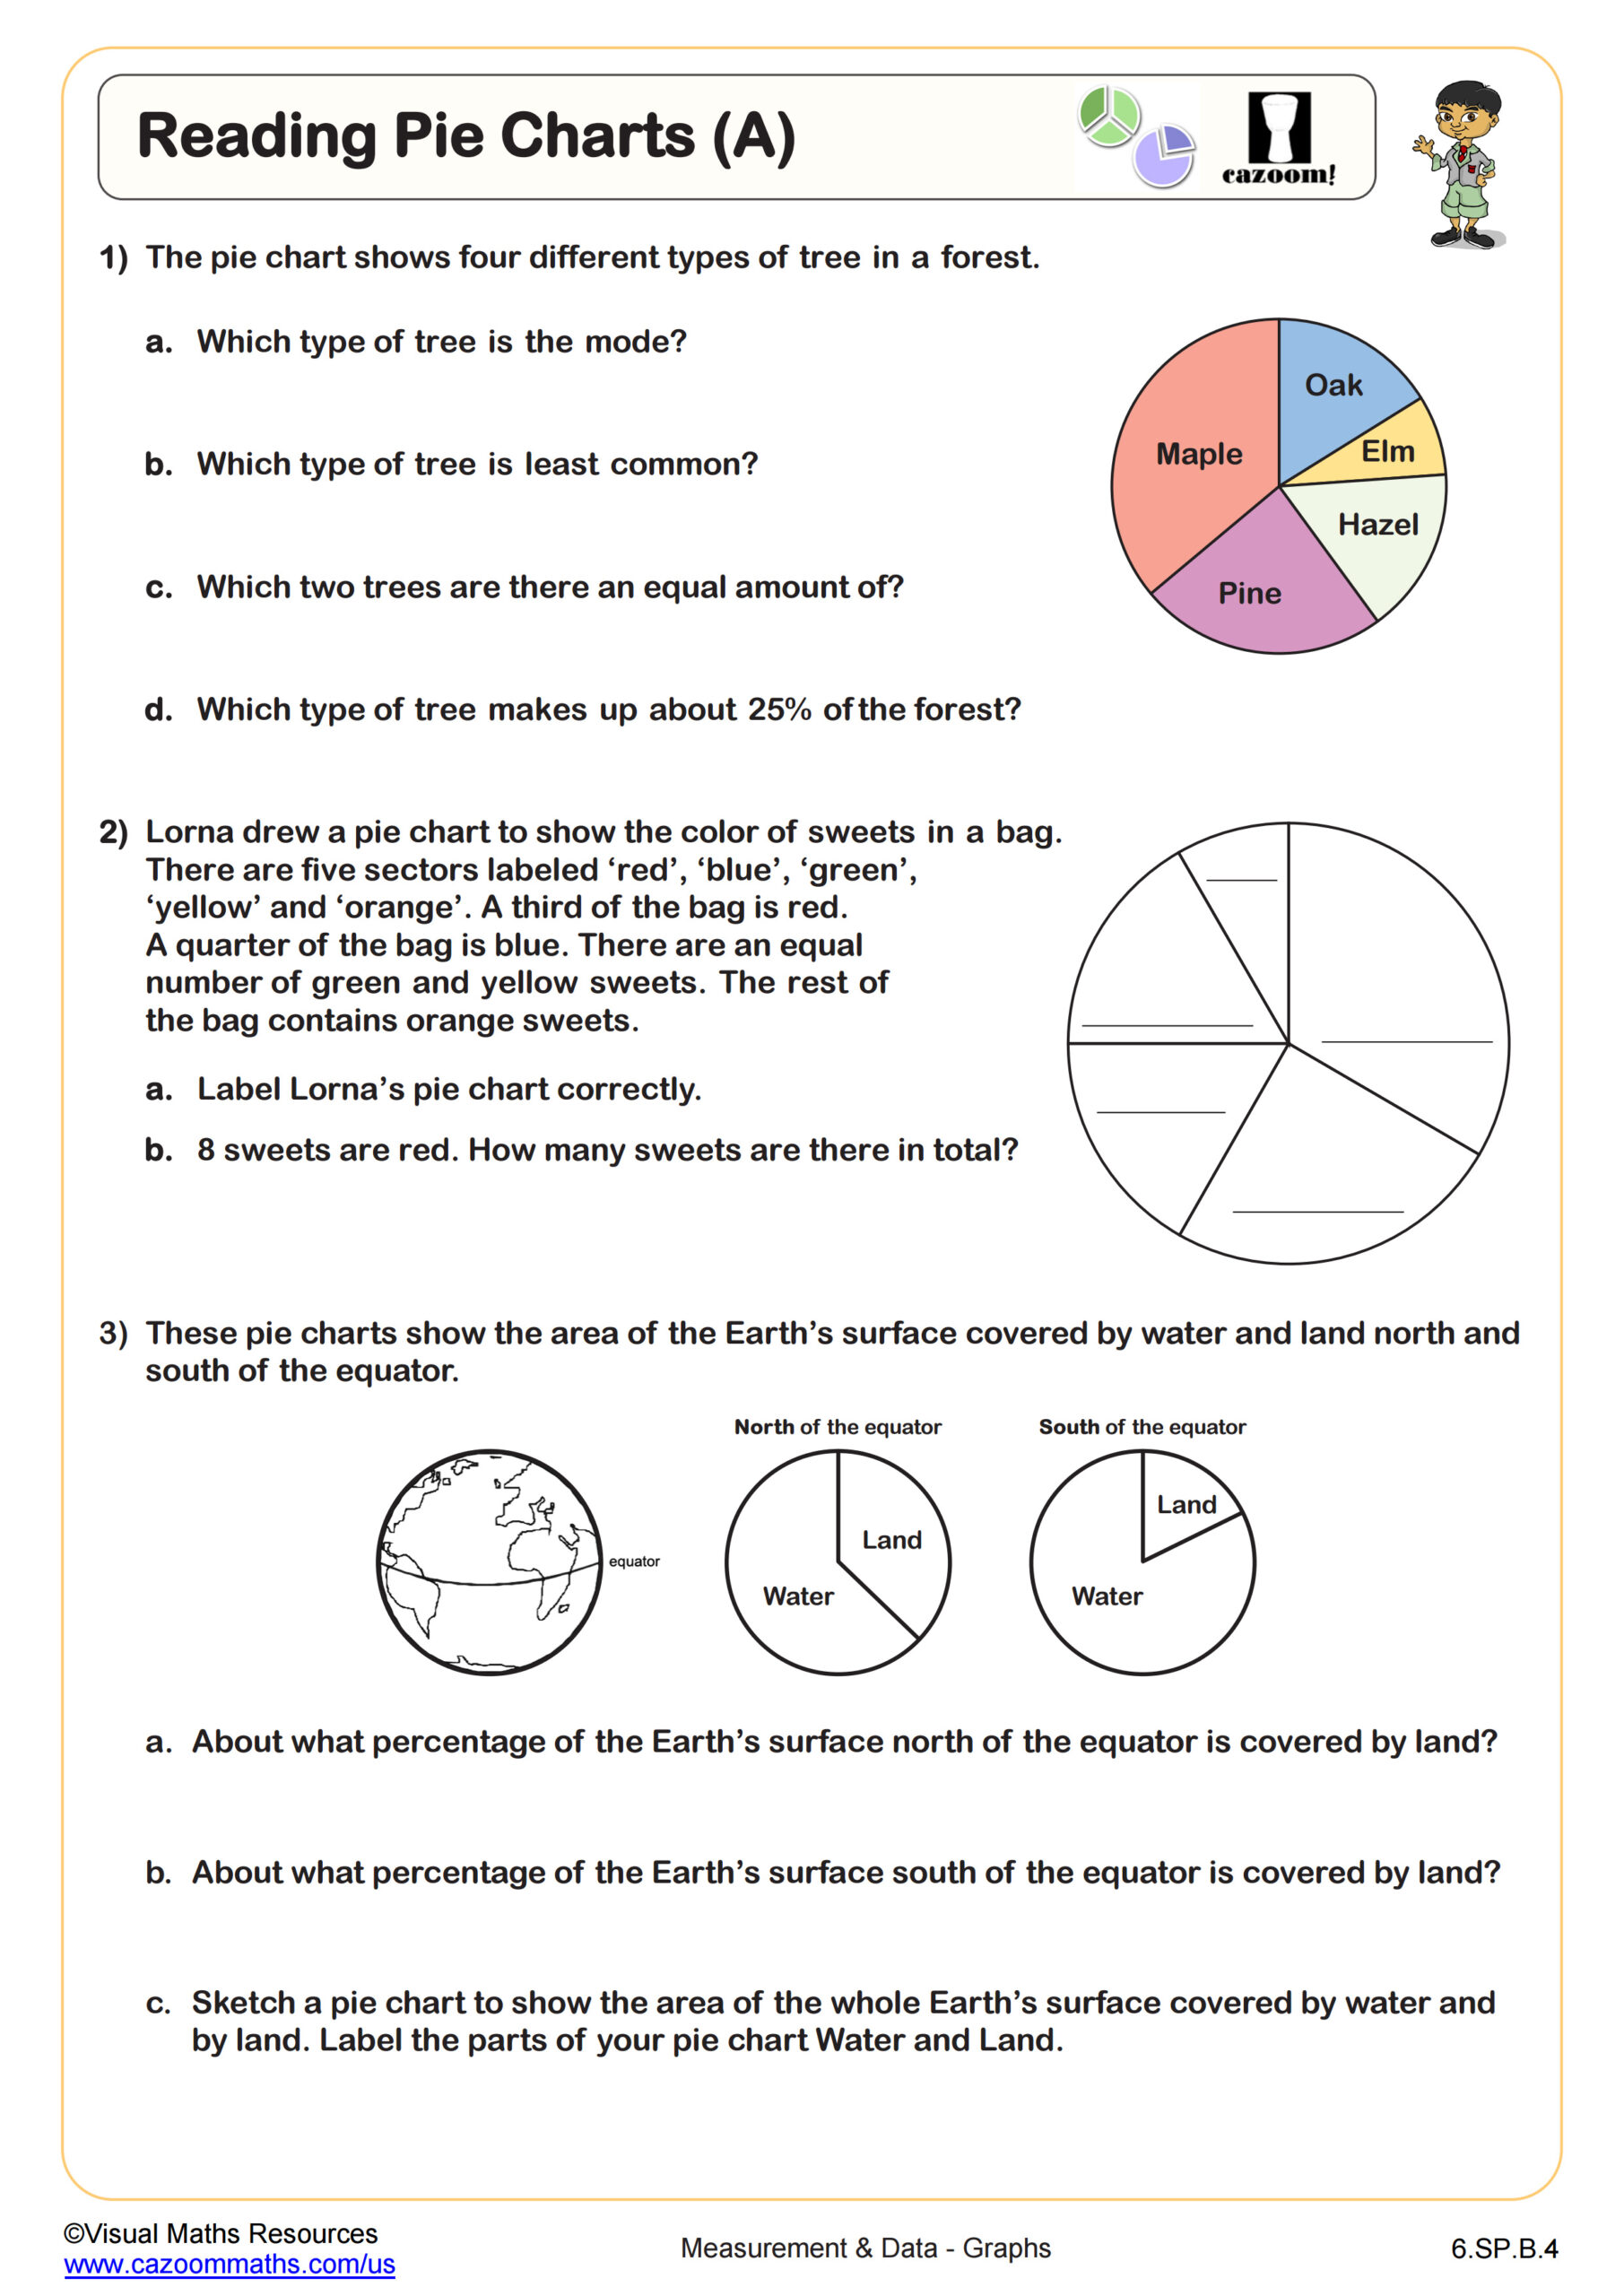
Reading Pie Charts (A)
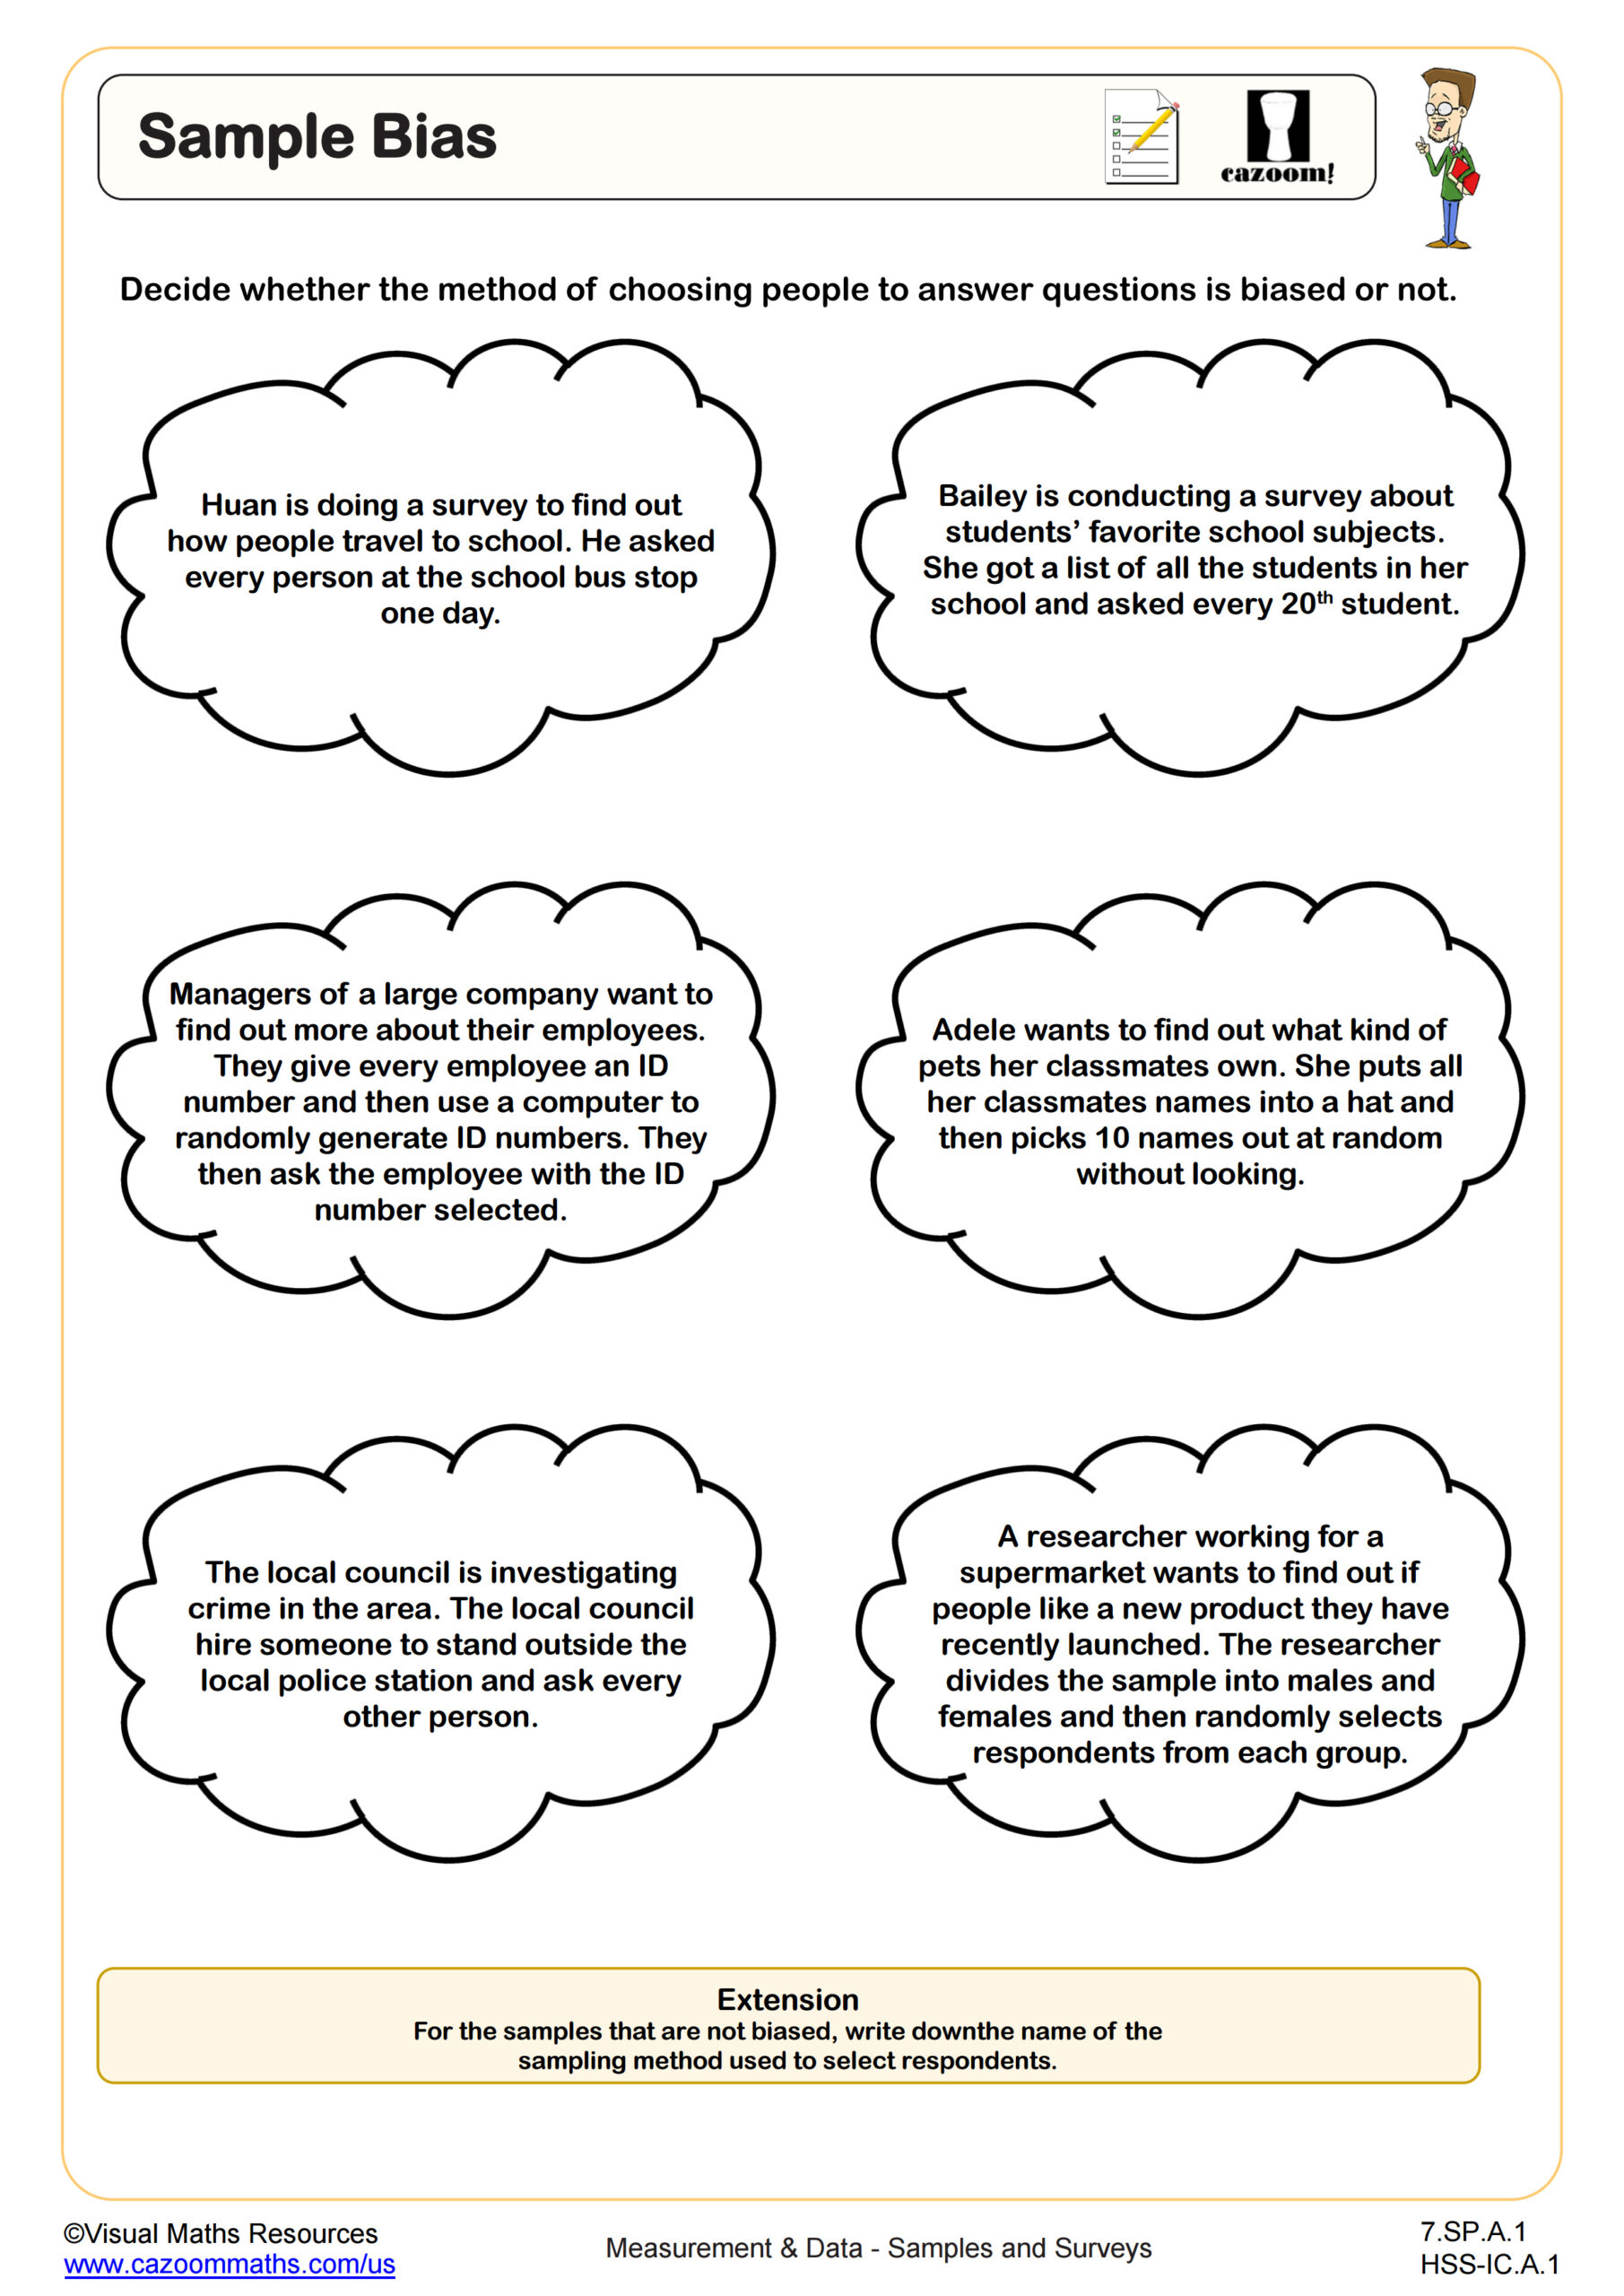
Sample Bias
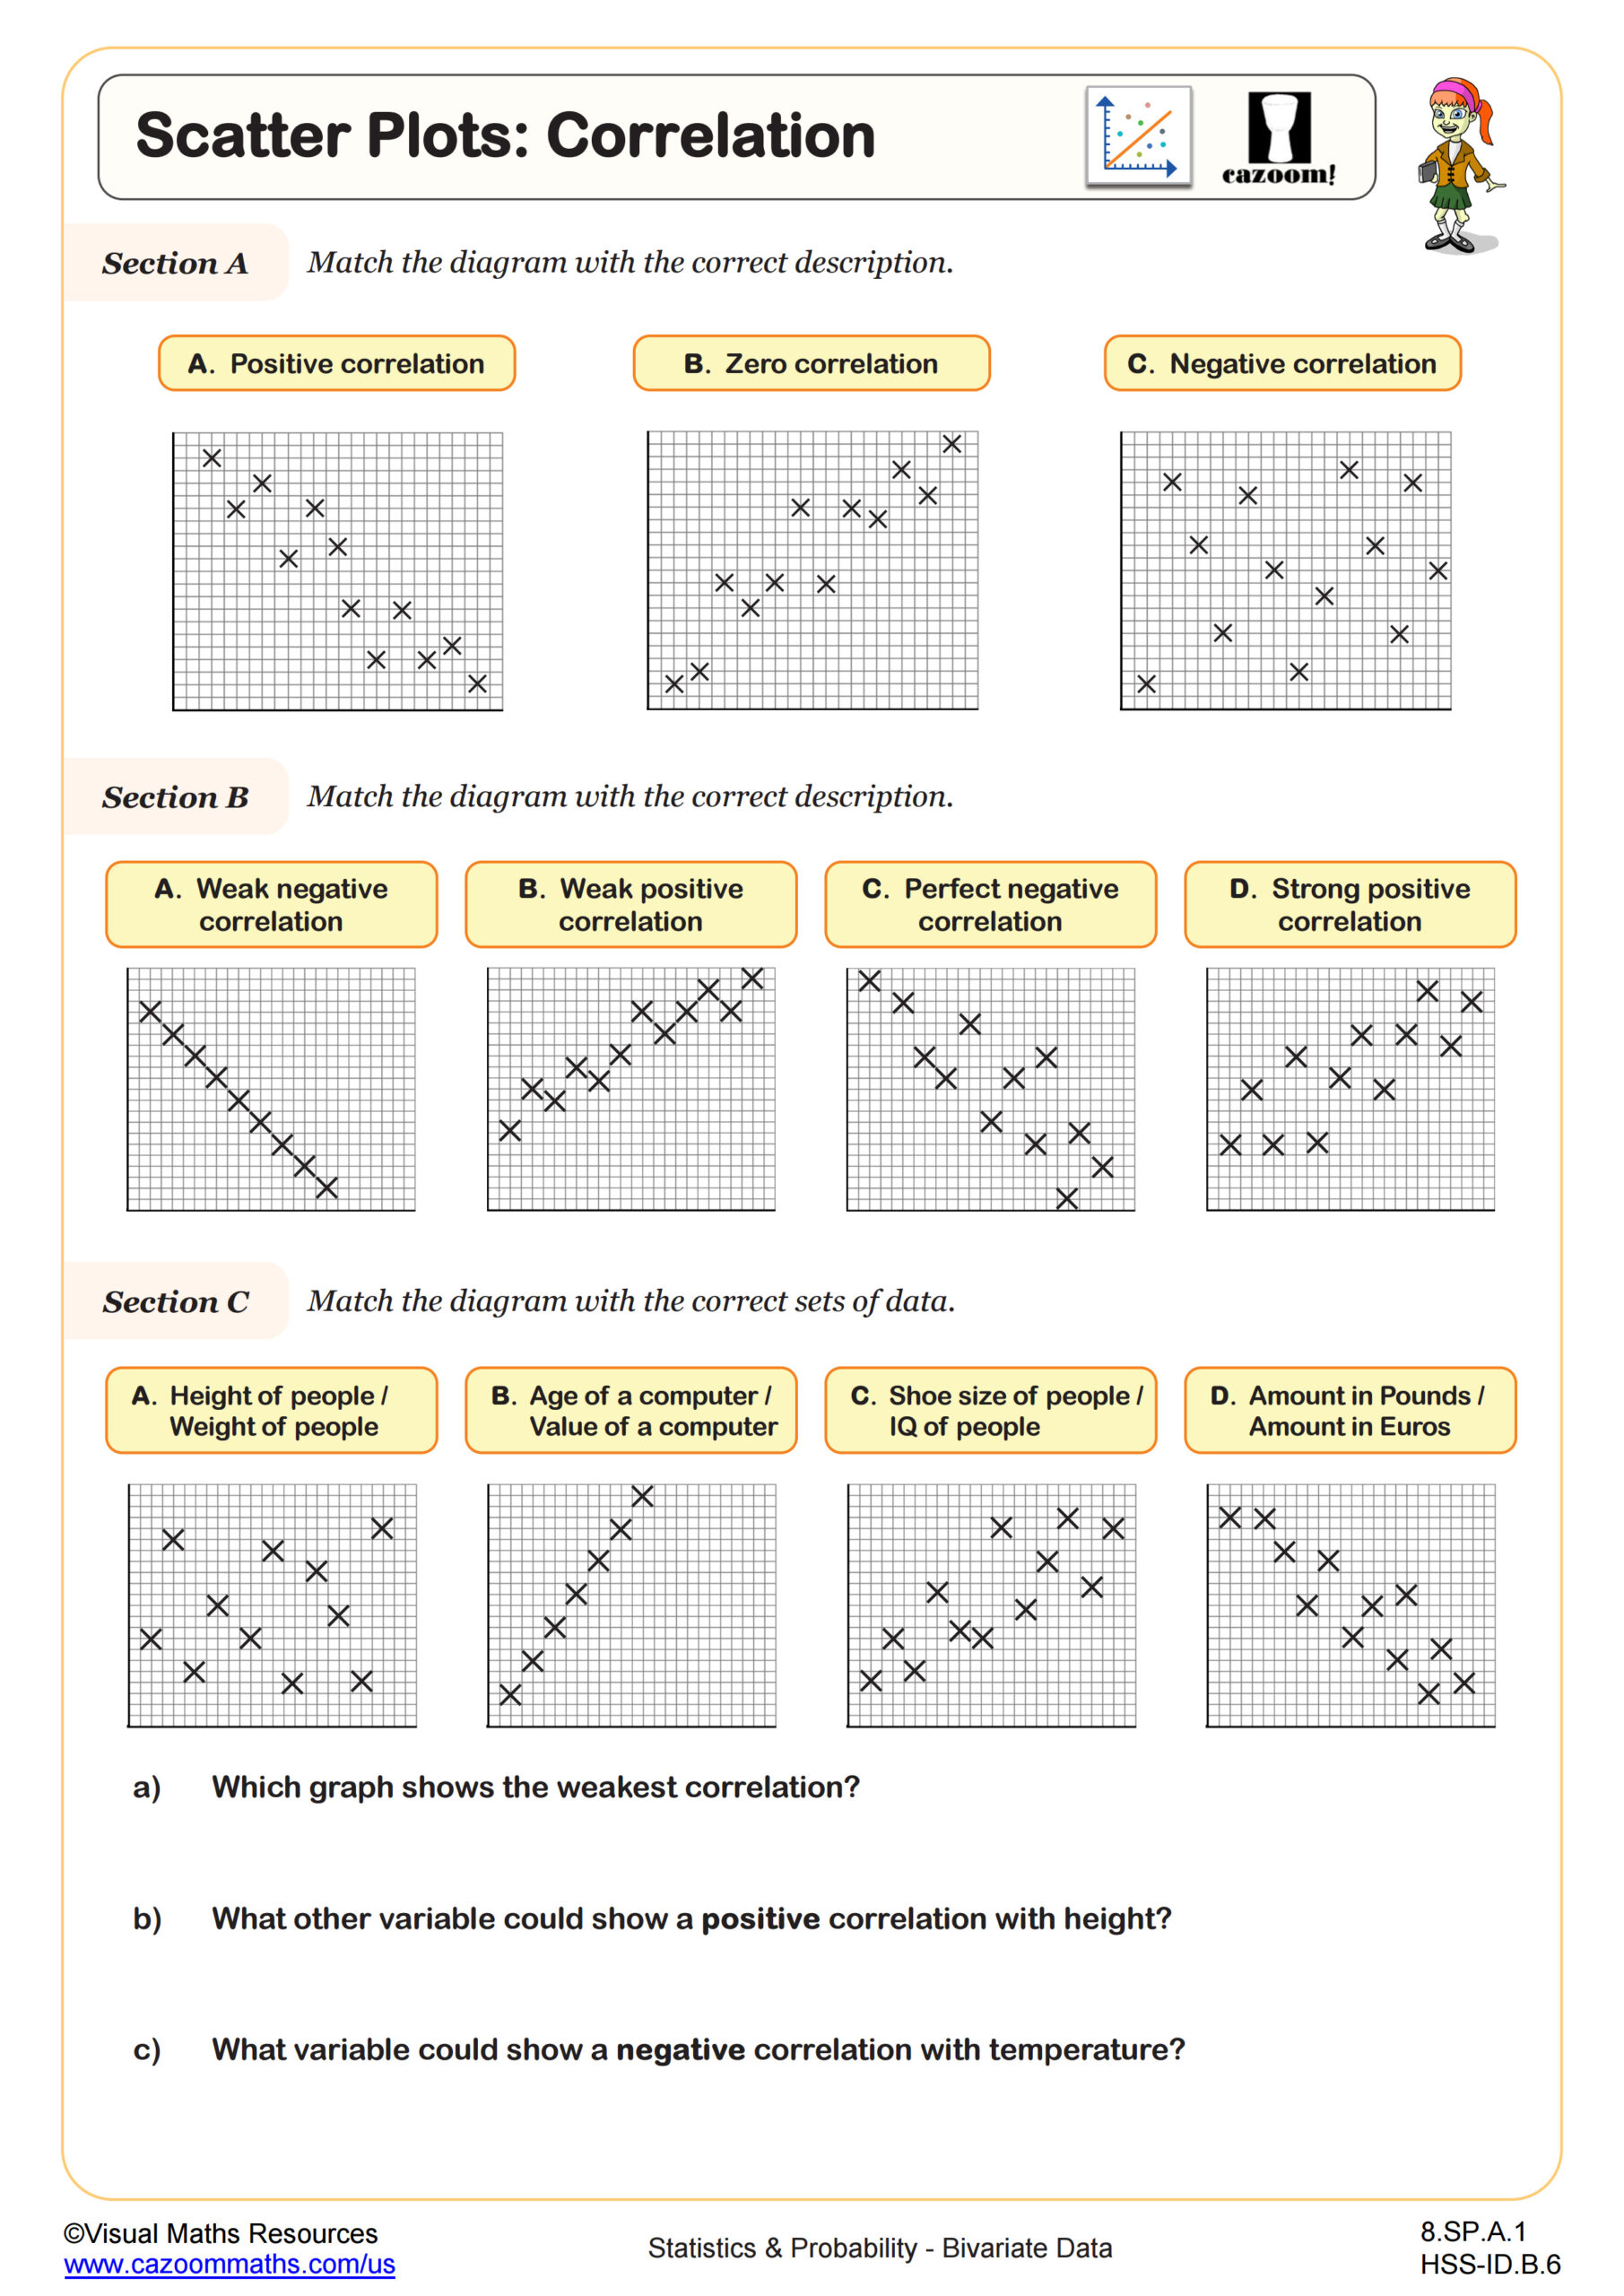
Scatter Plots: Correlation
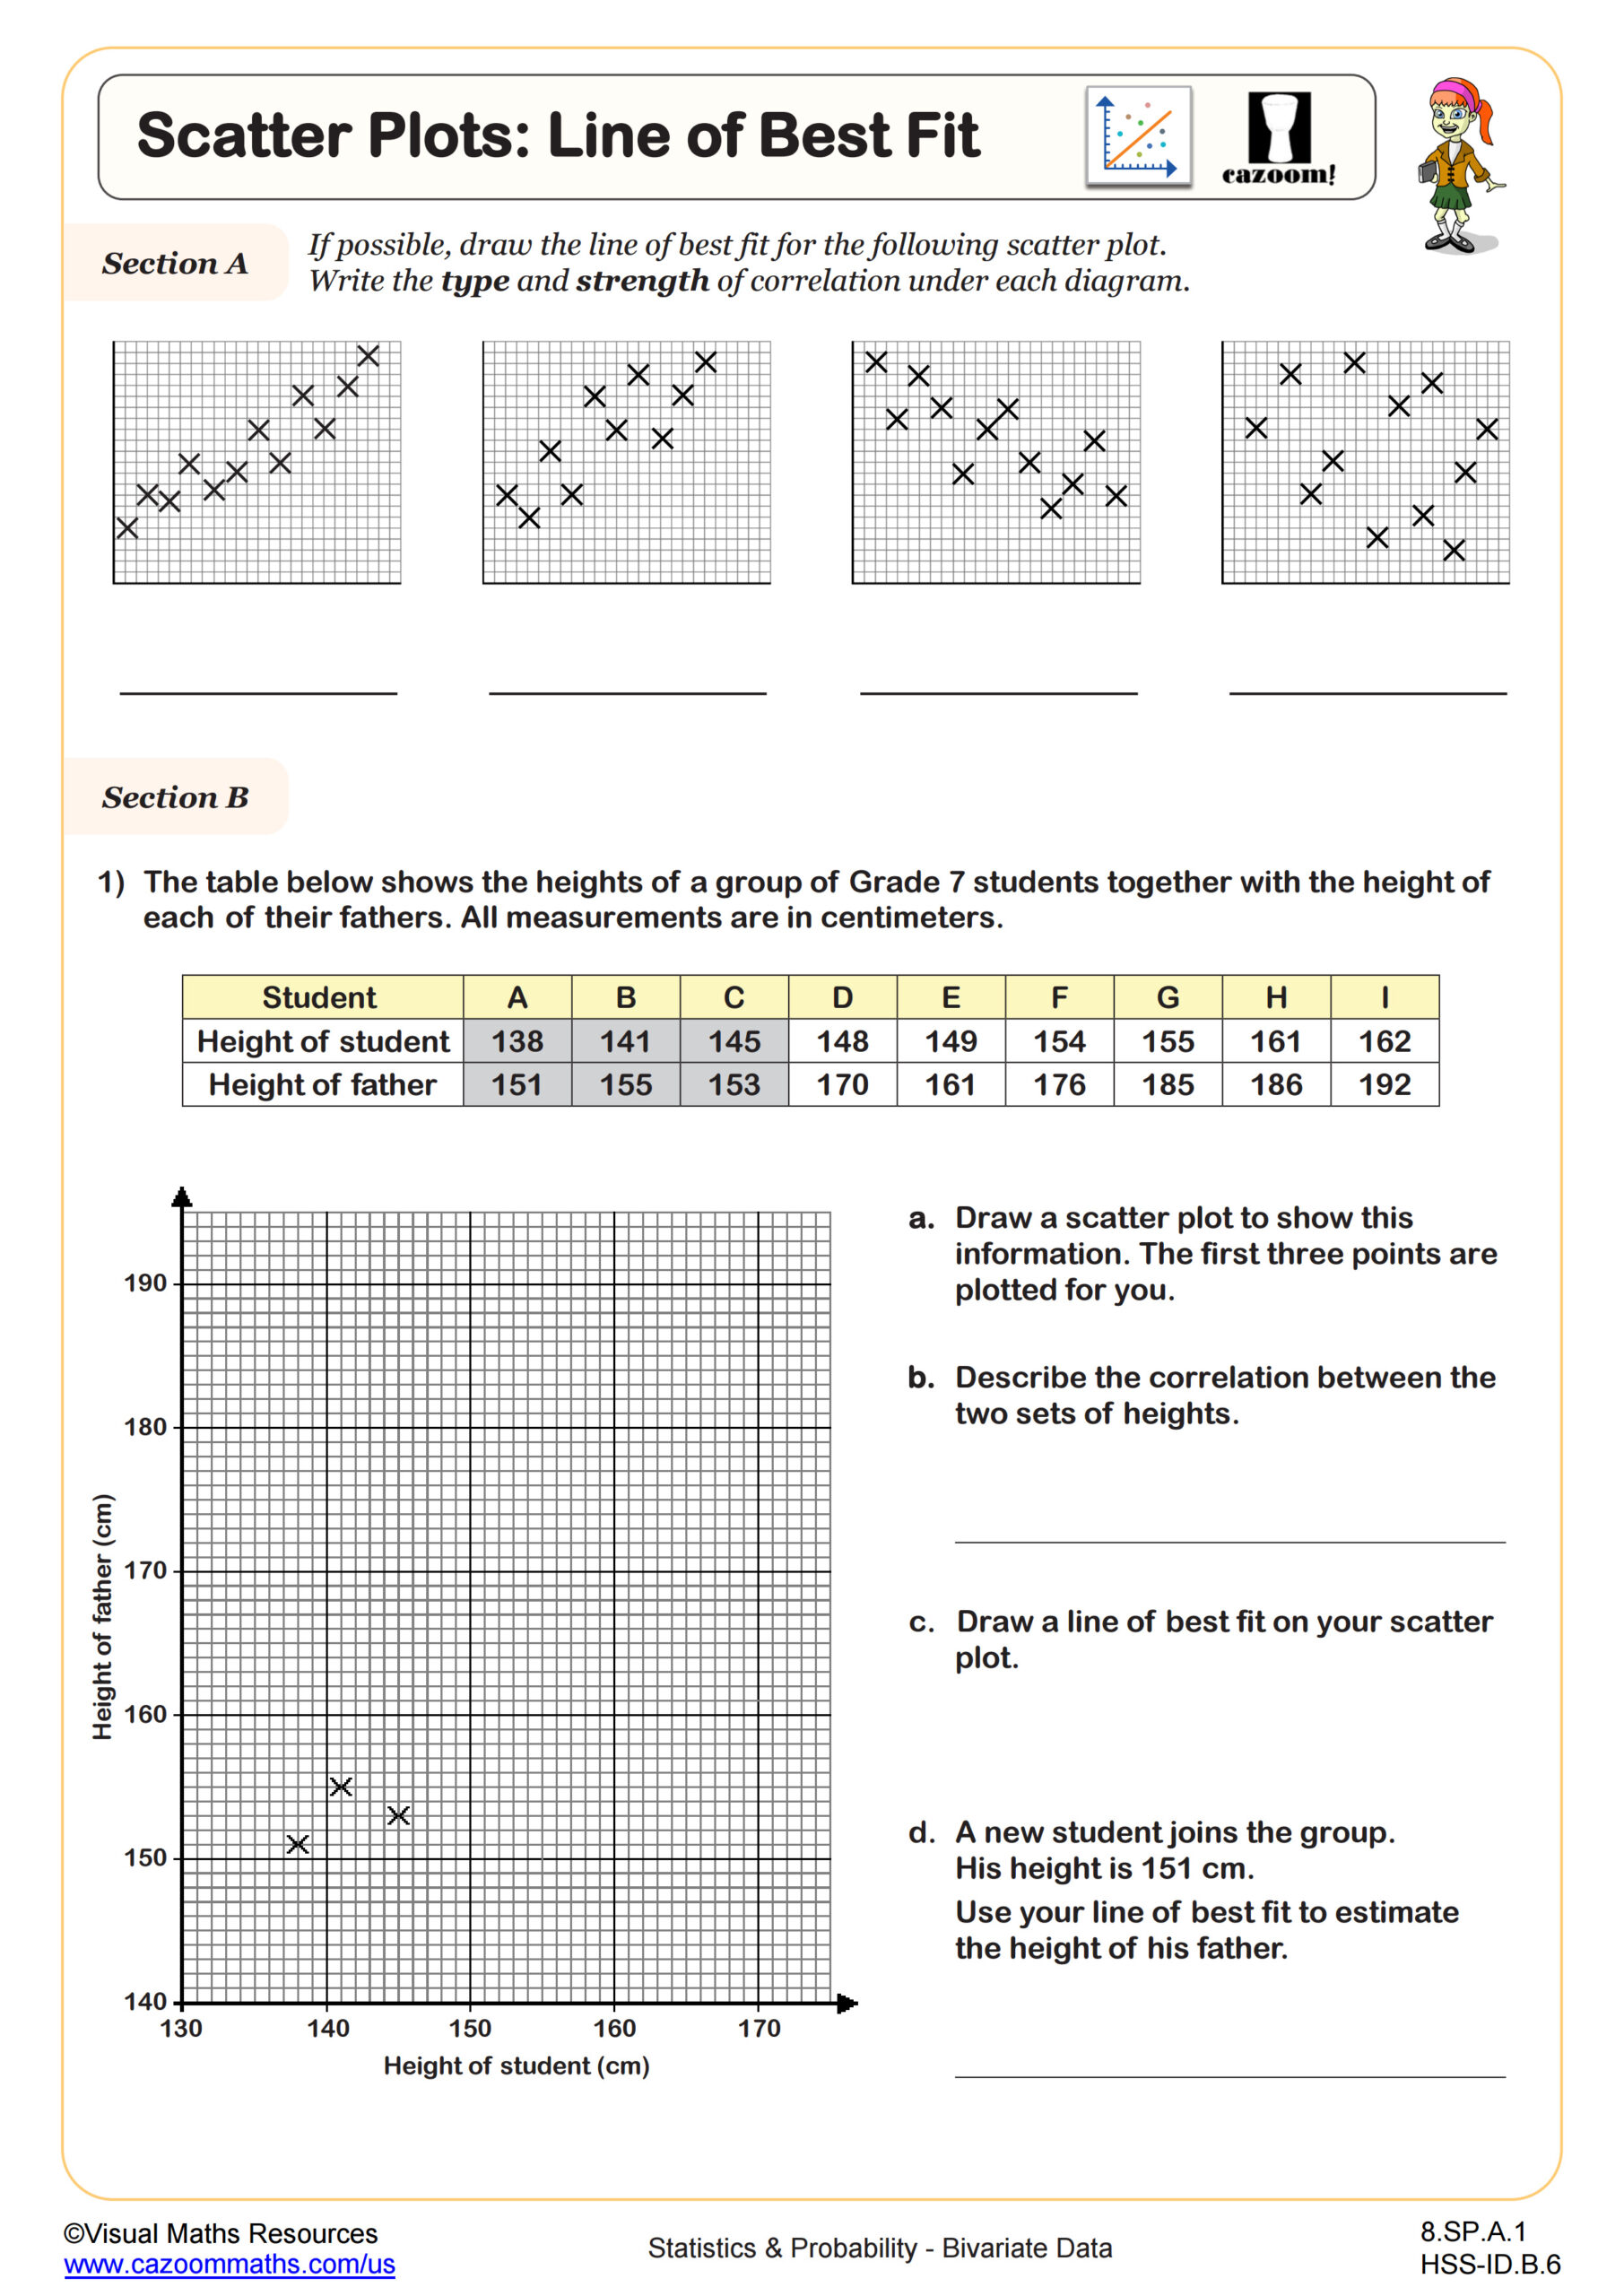
Scatter Plots: Line of Best Fit
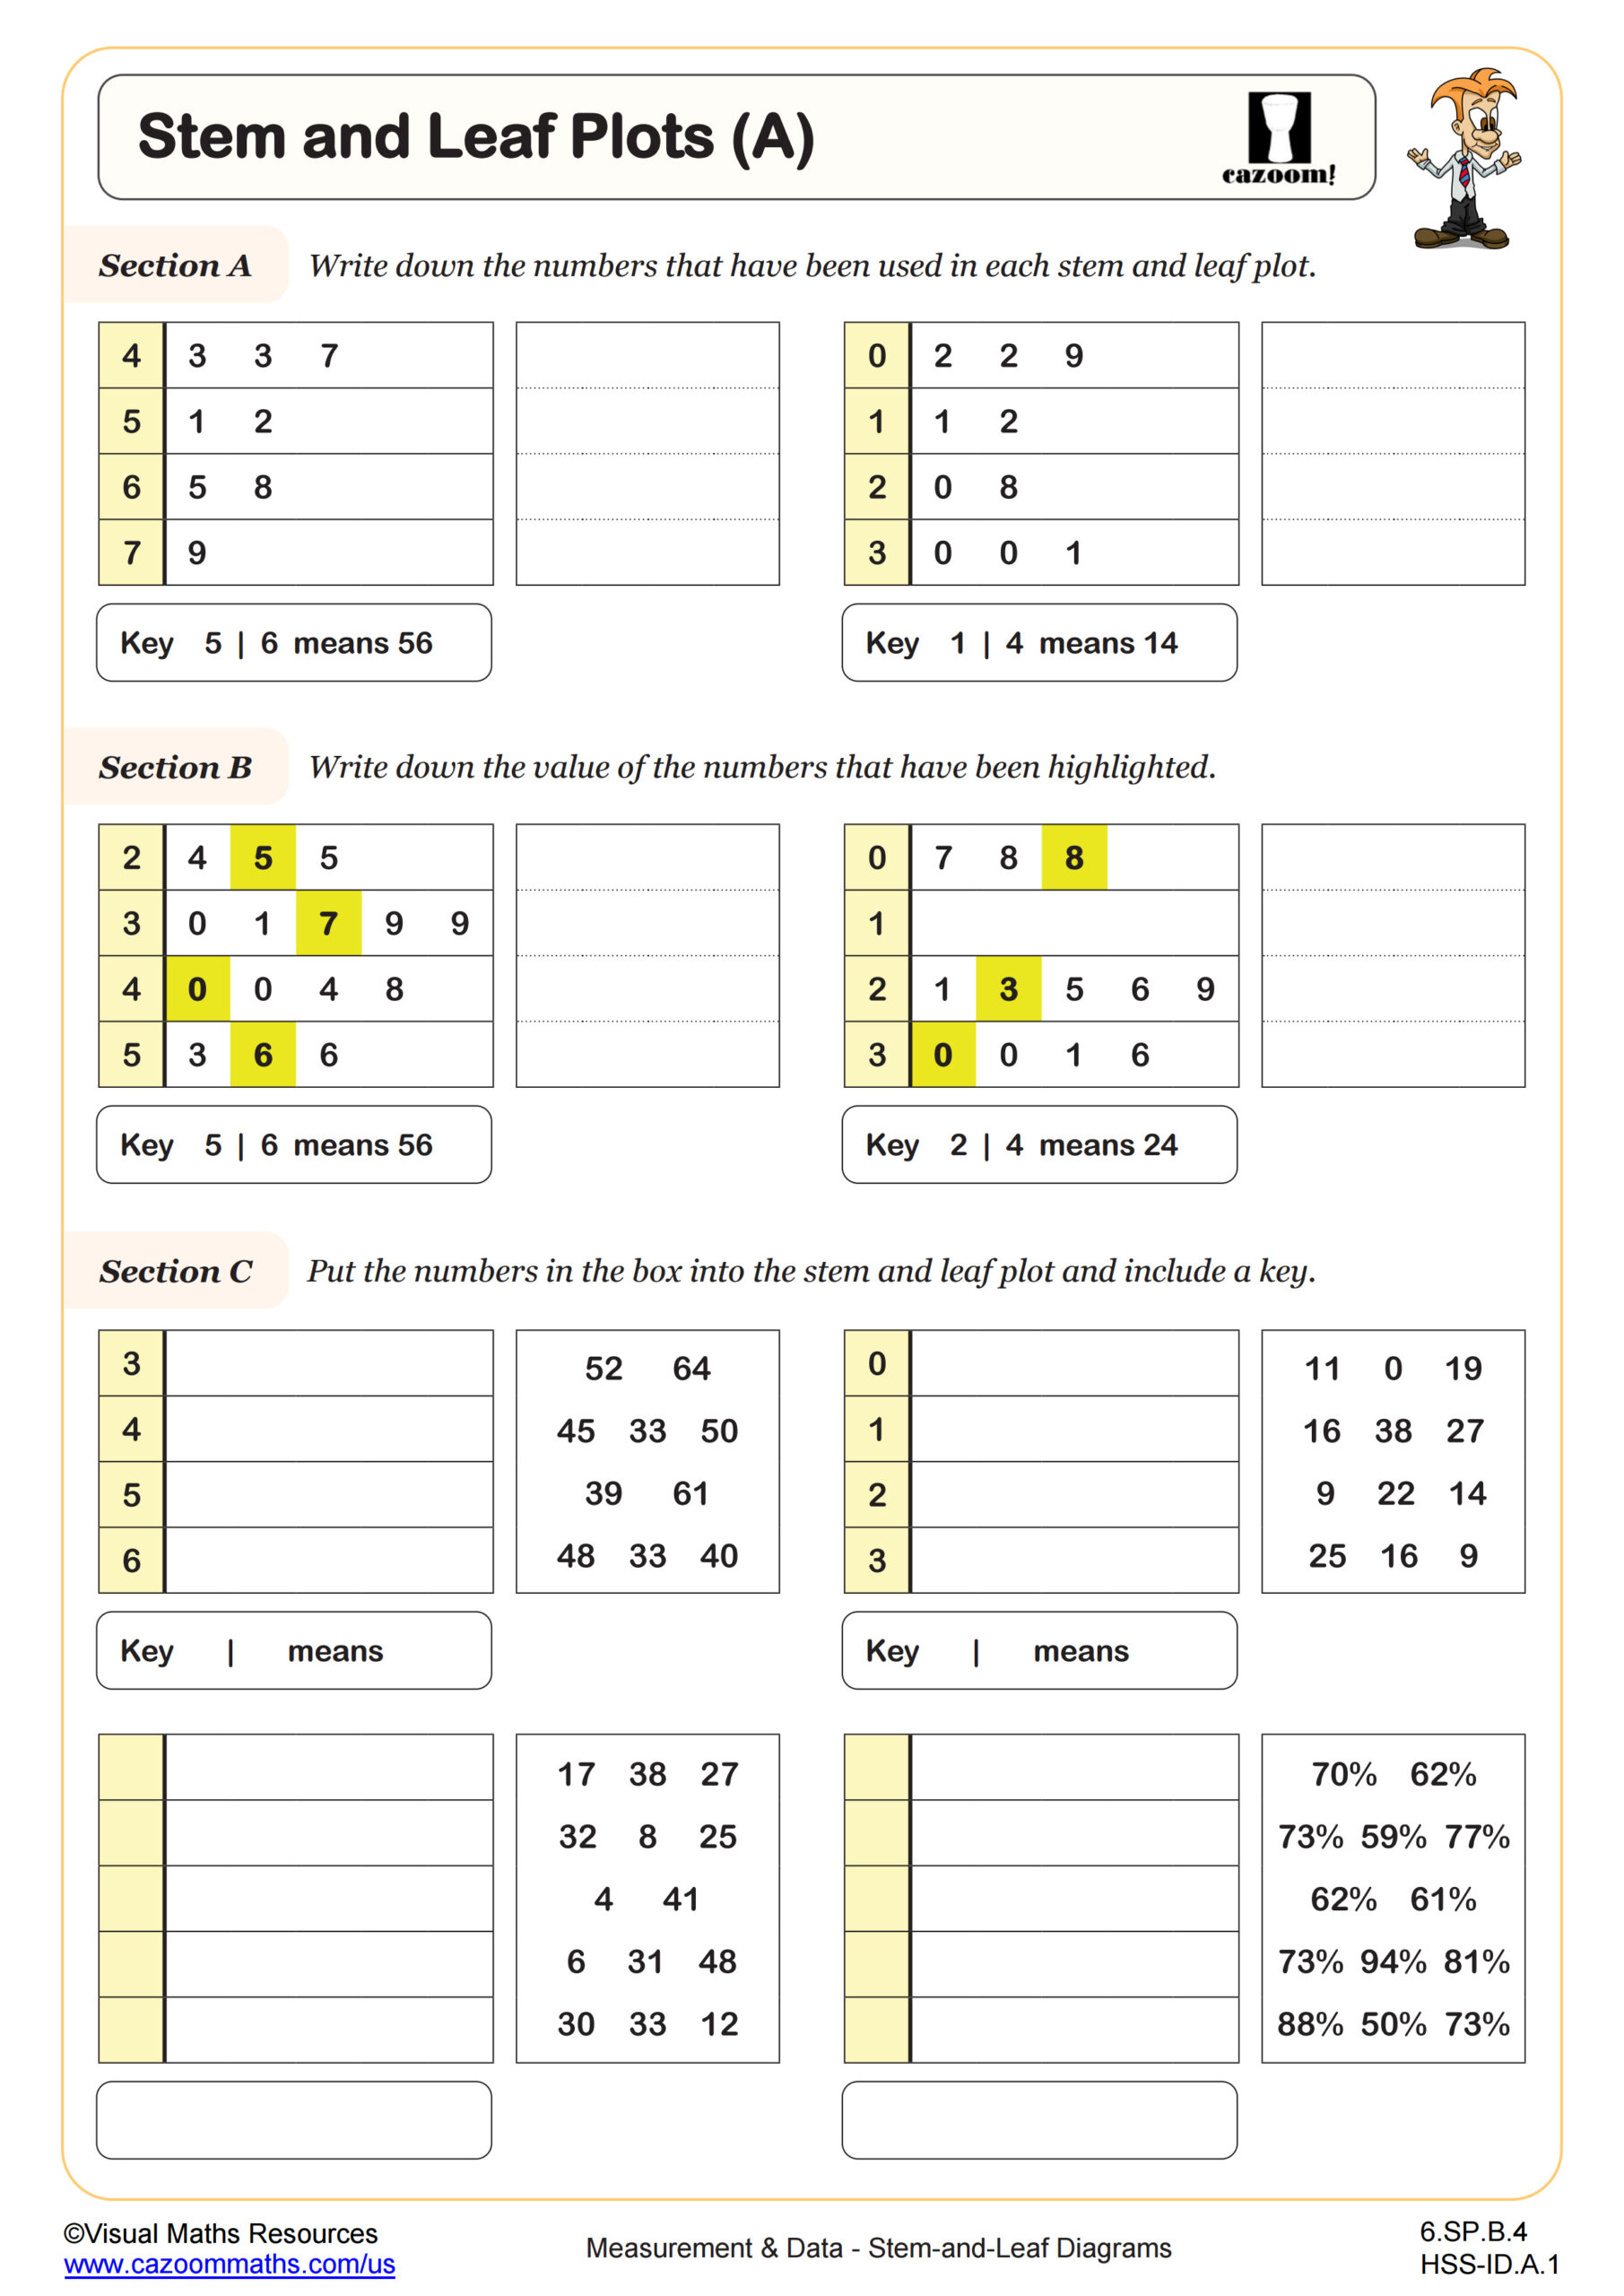
Stem and Leaf Plots (A)
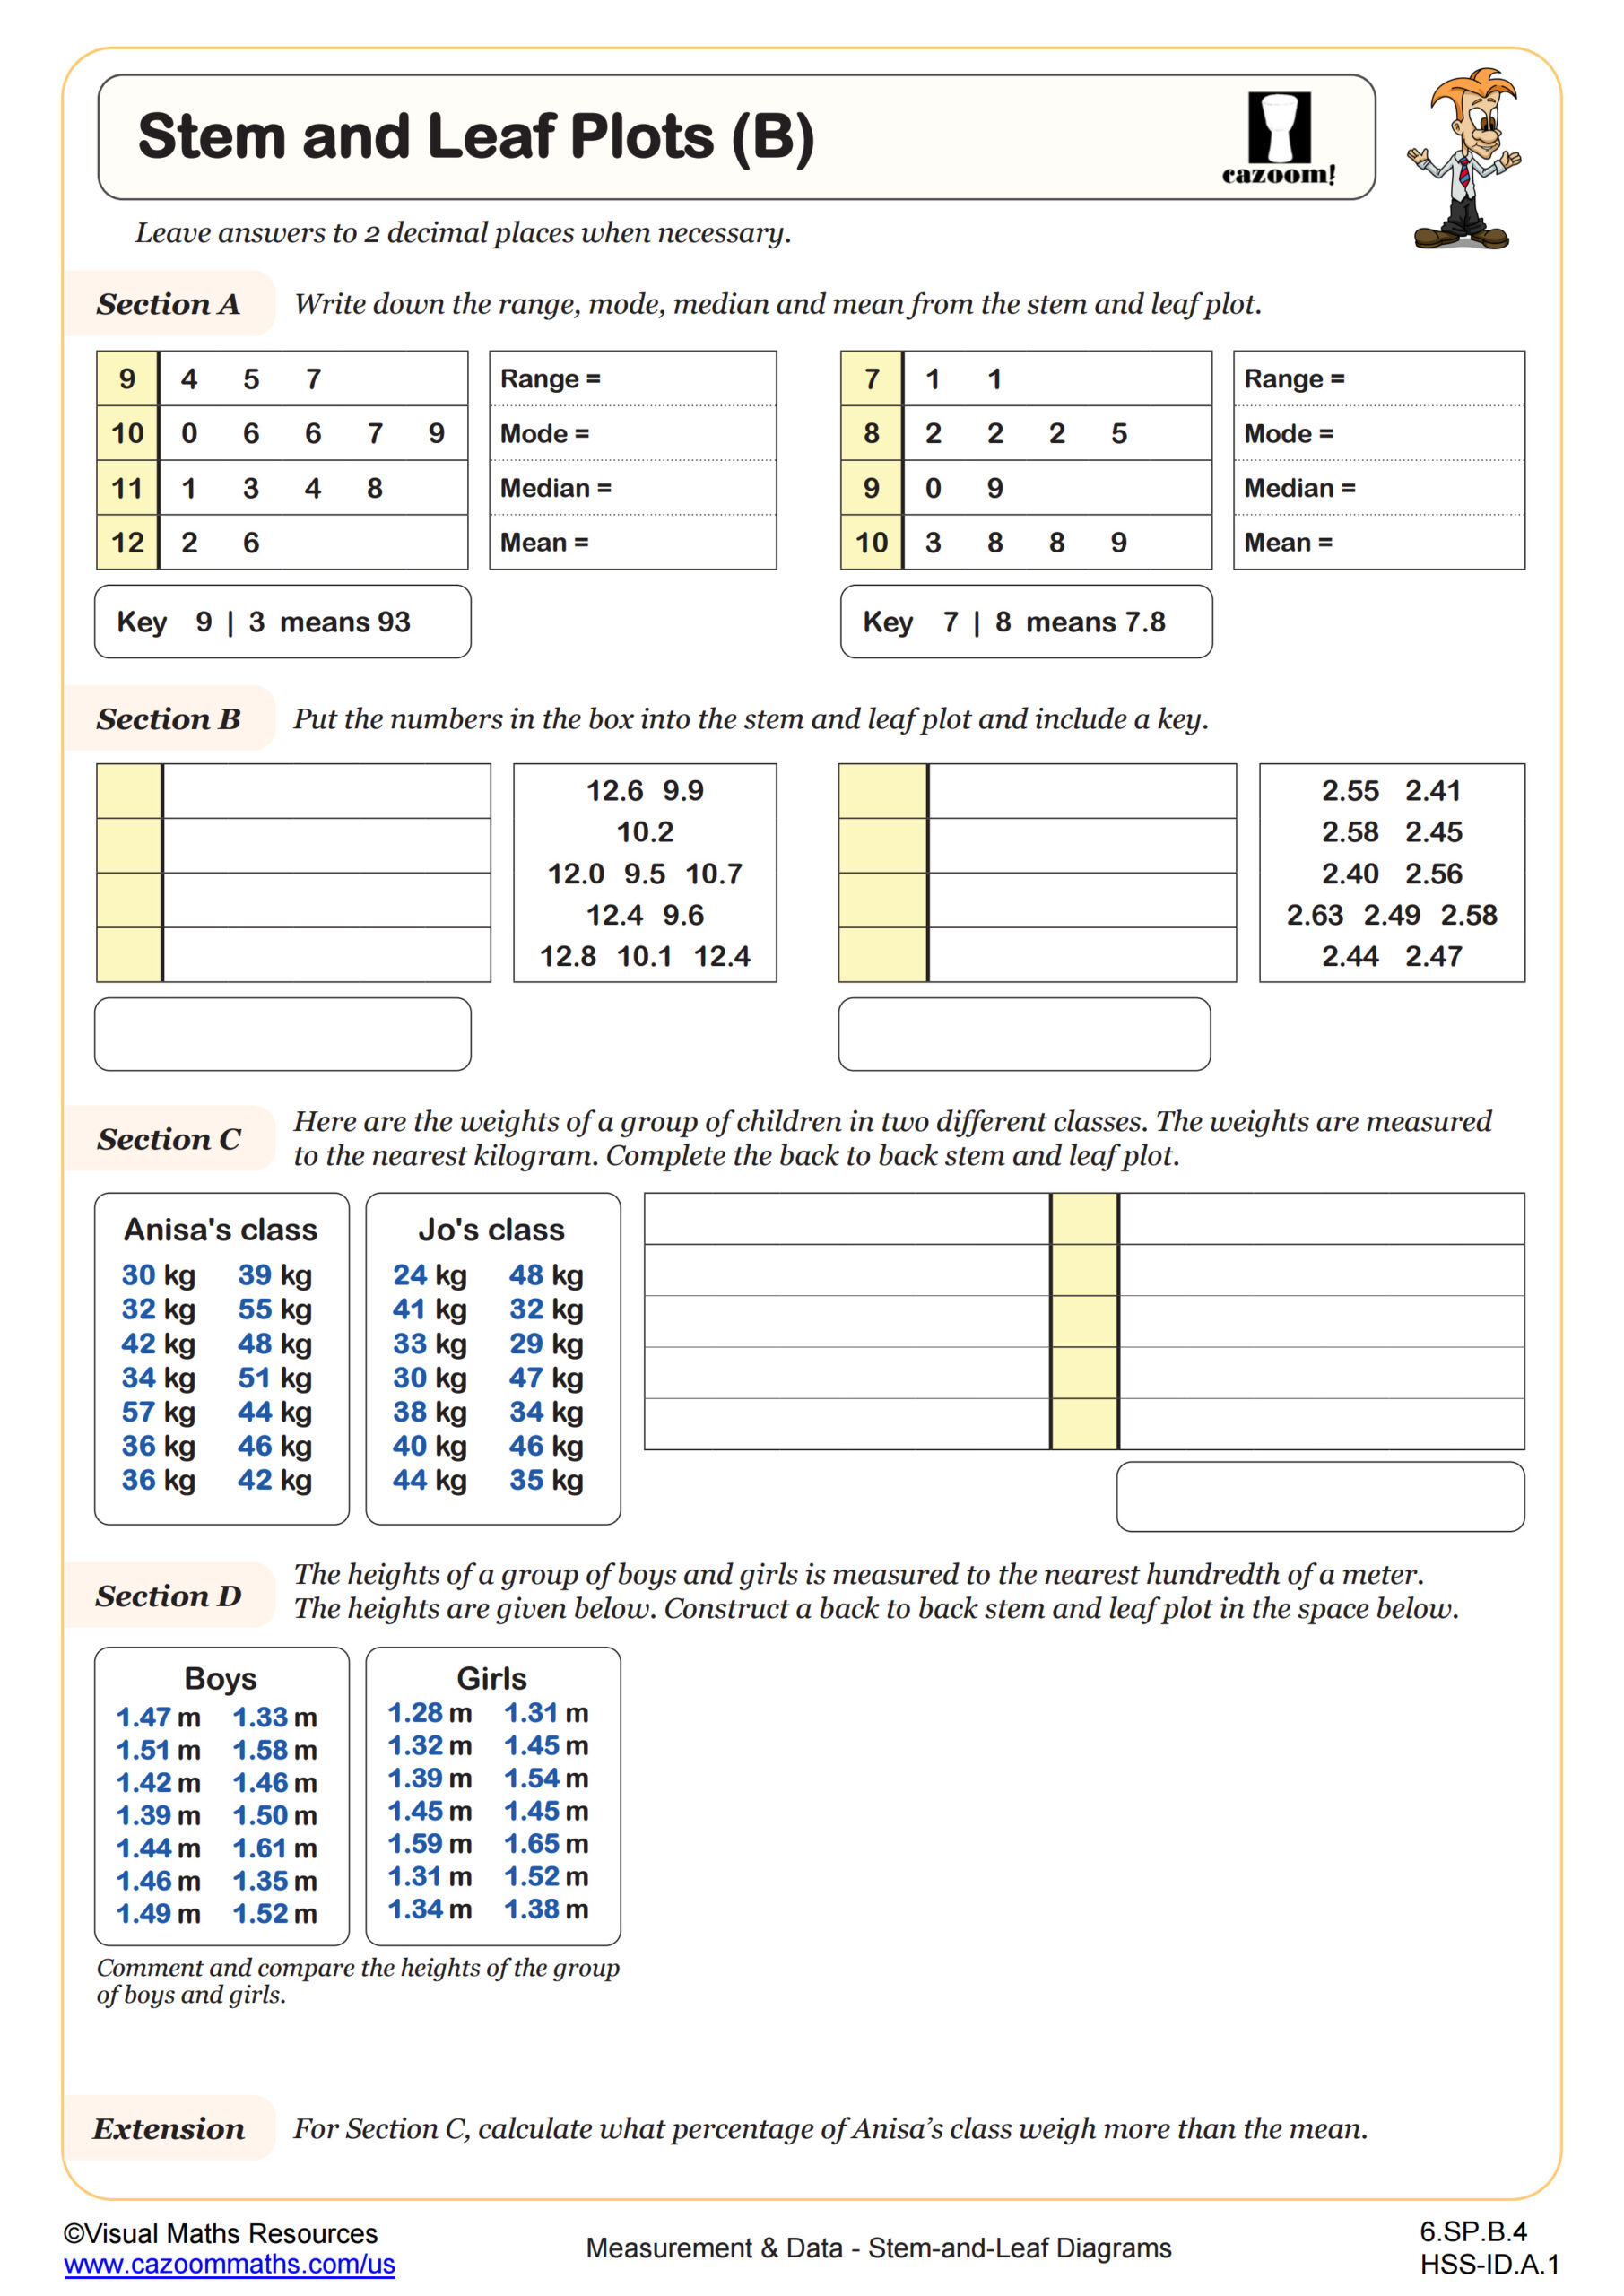
Stem and Leaf Plots (B)
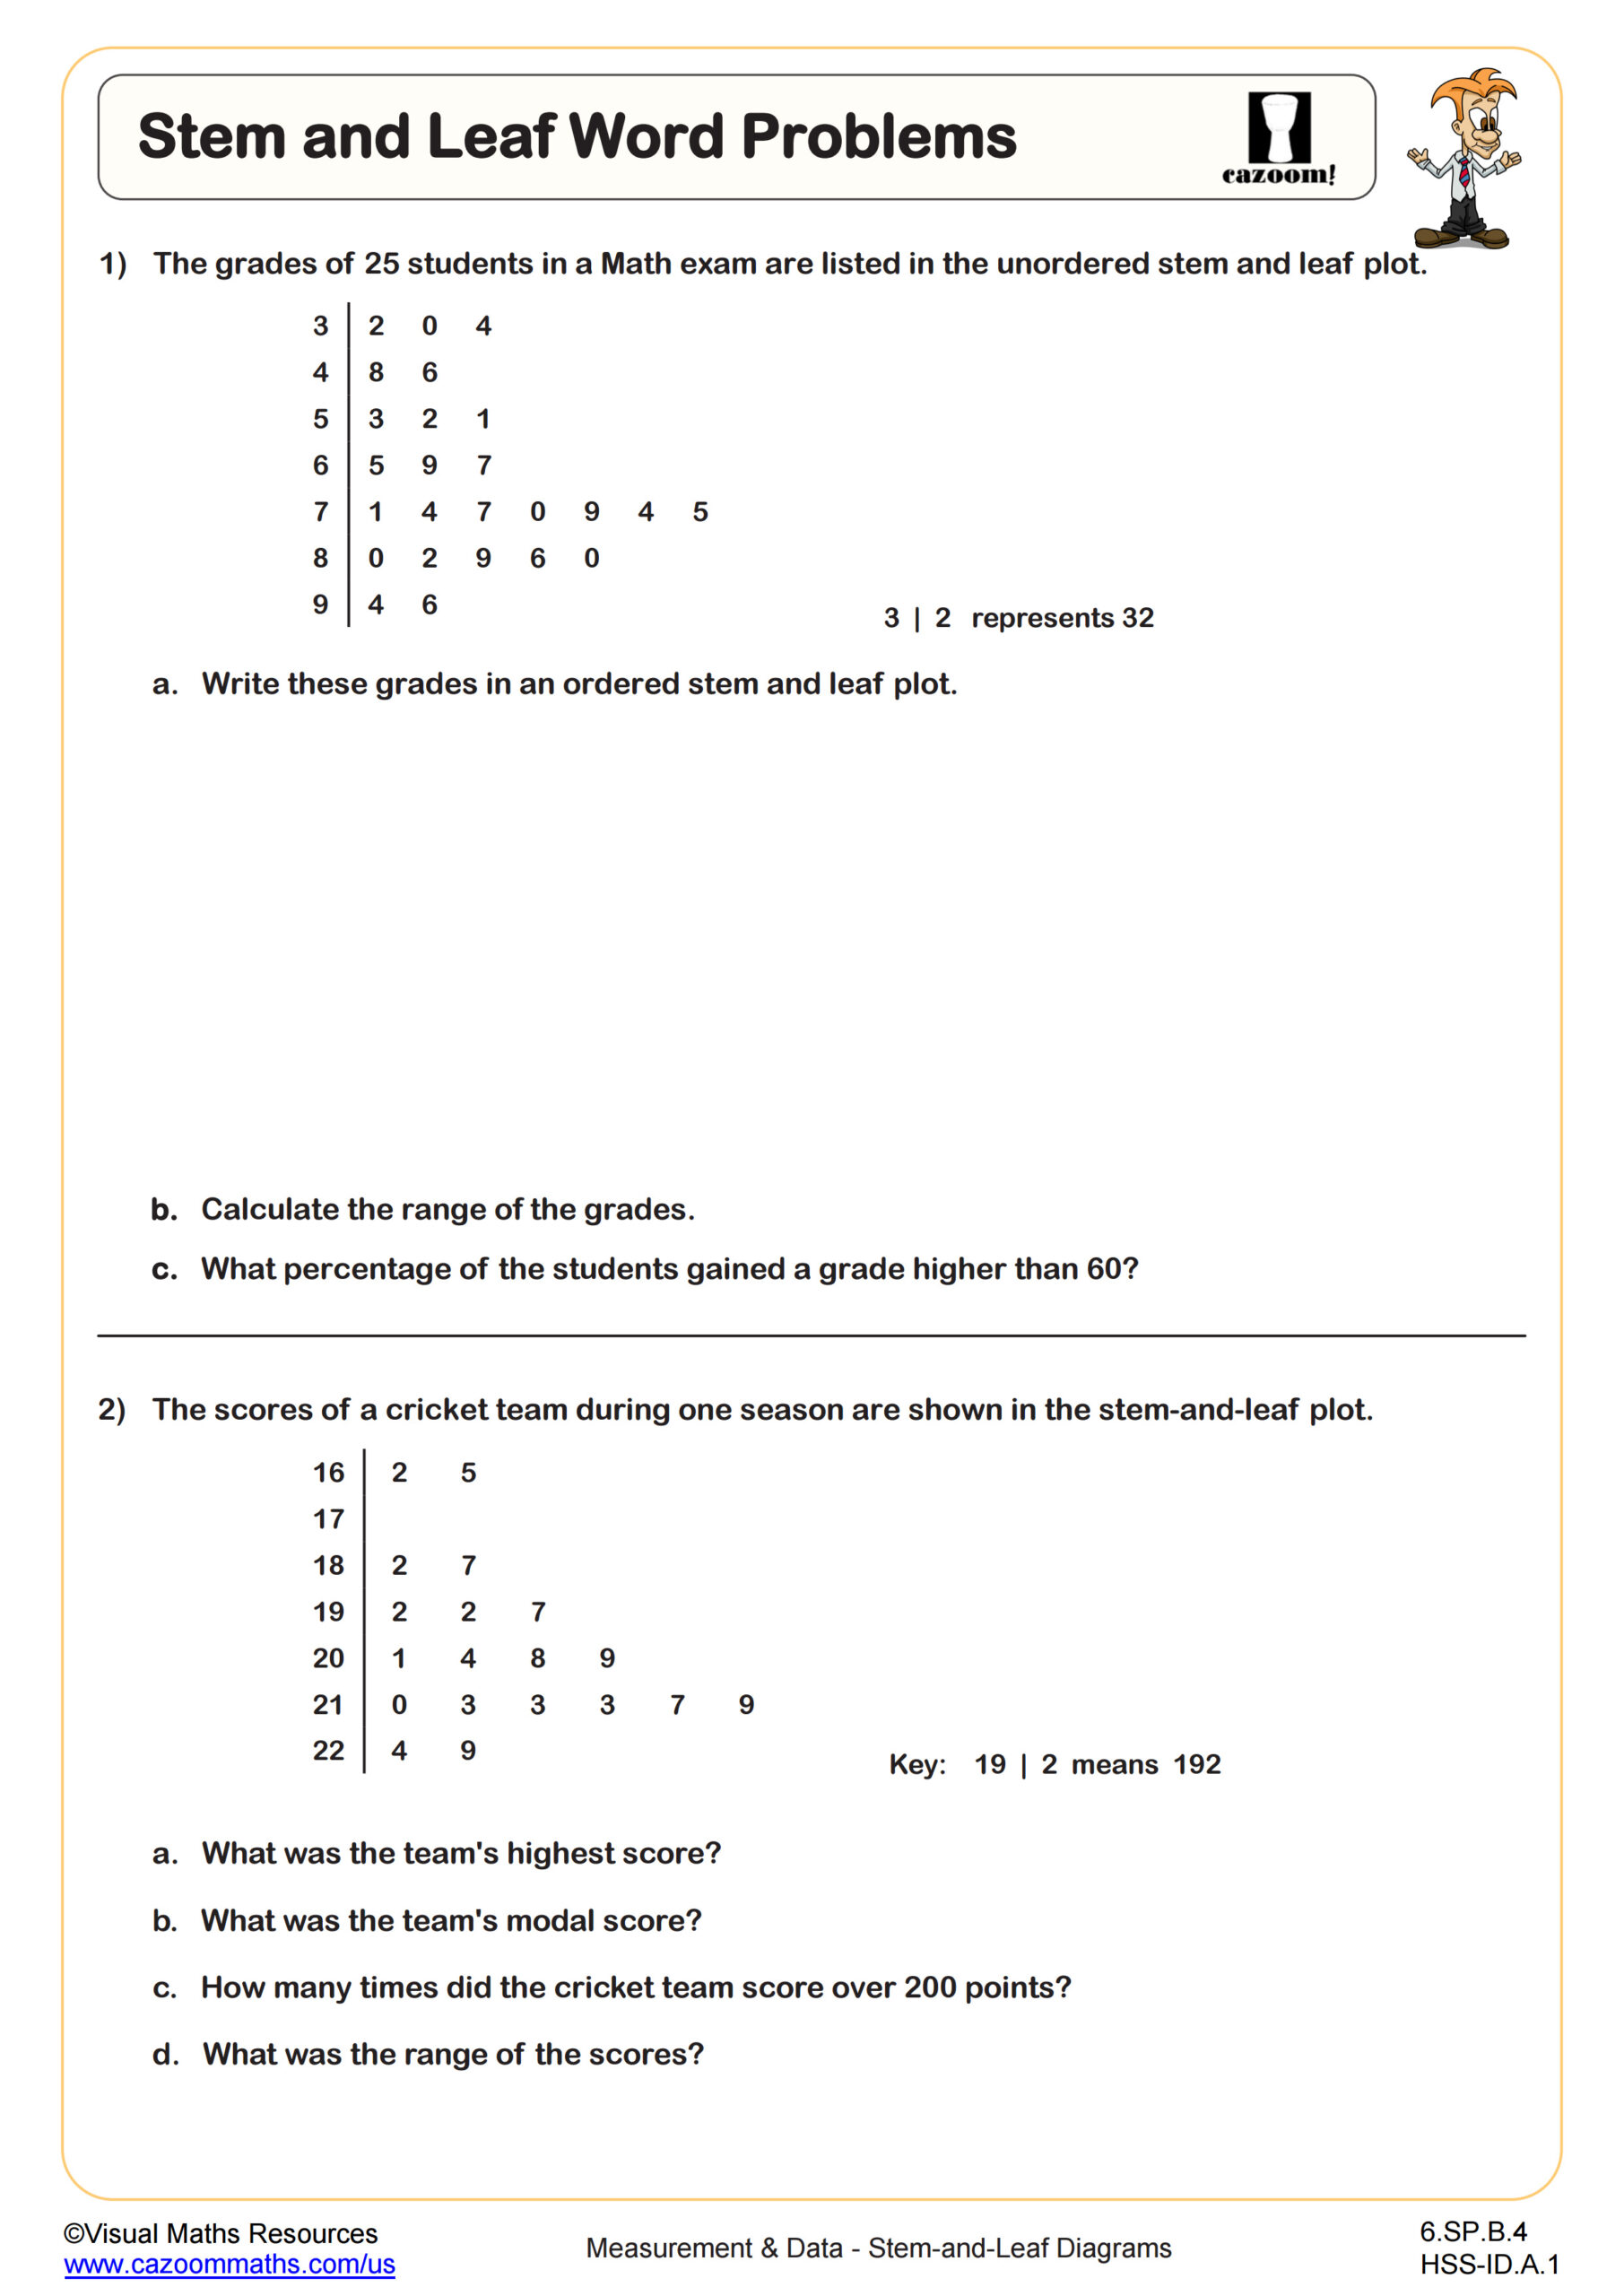
Stem and Leaf Word Problems
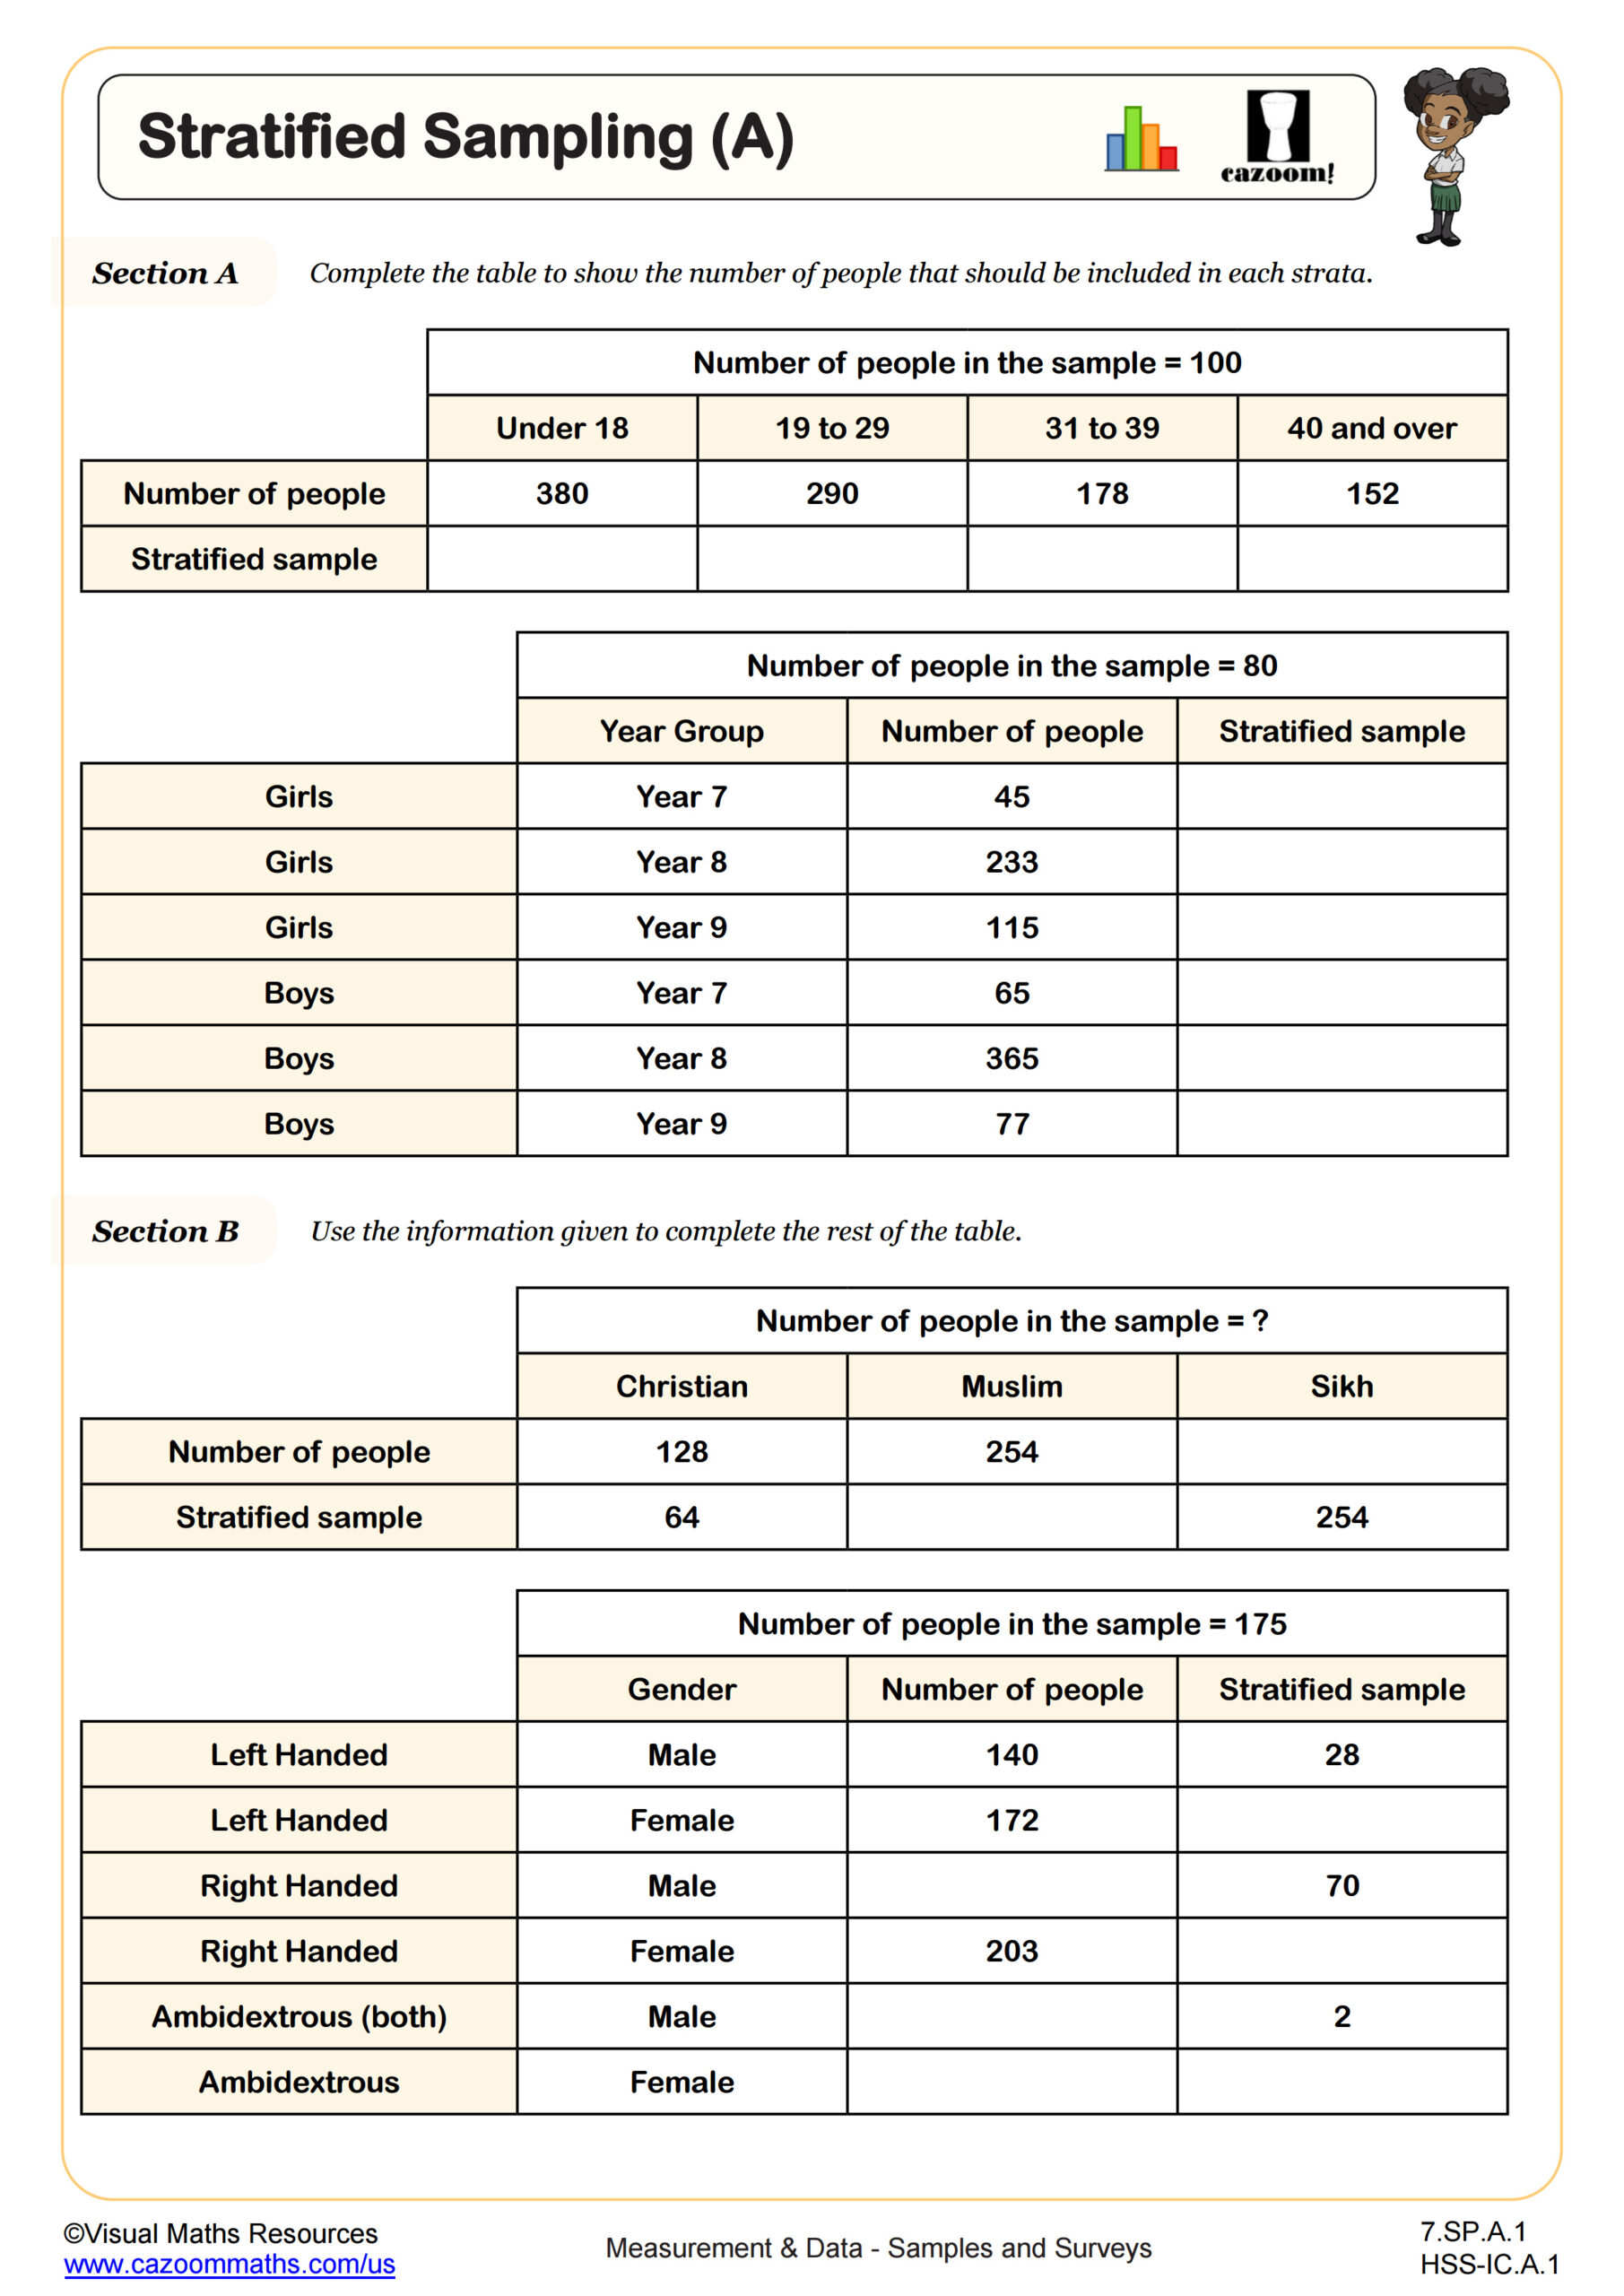
Stratified Sampling (A)
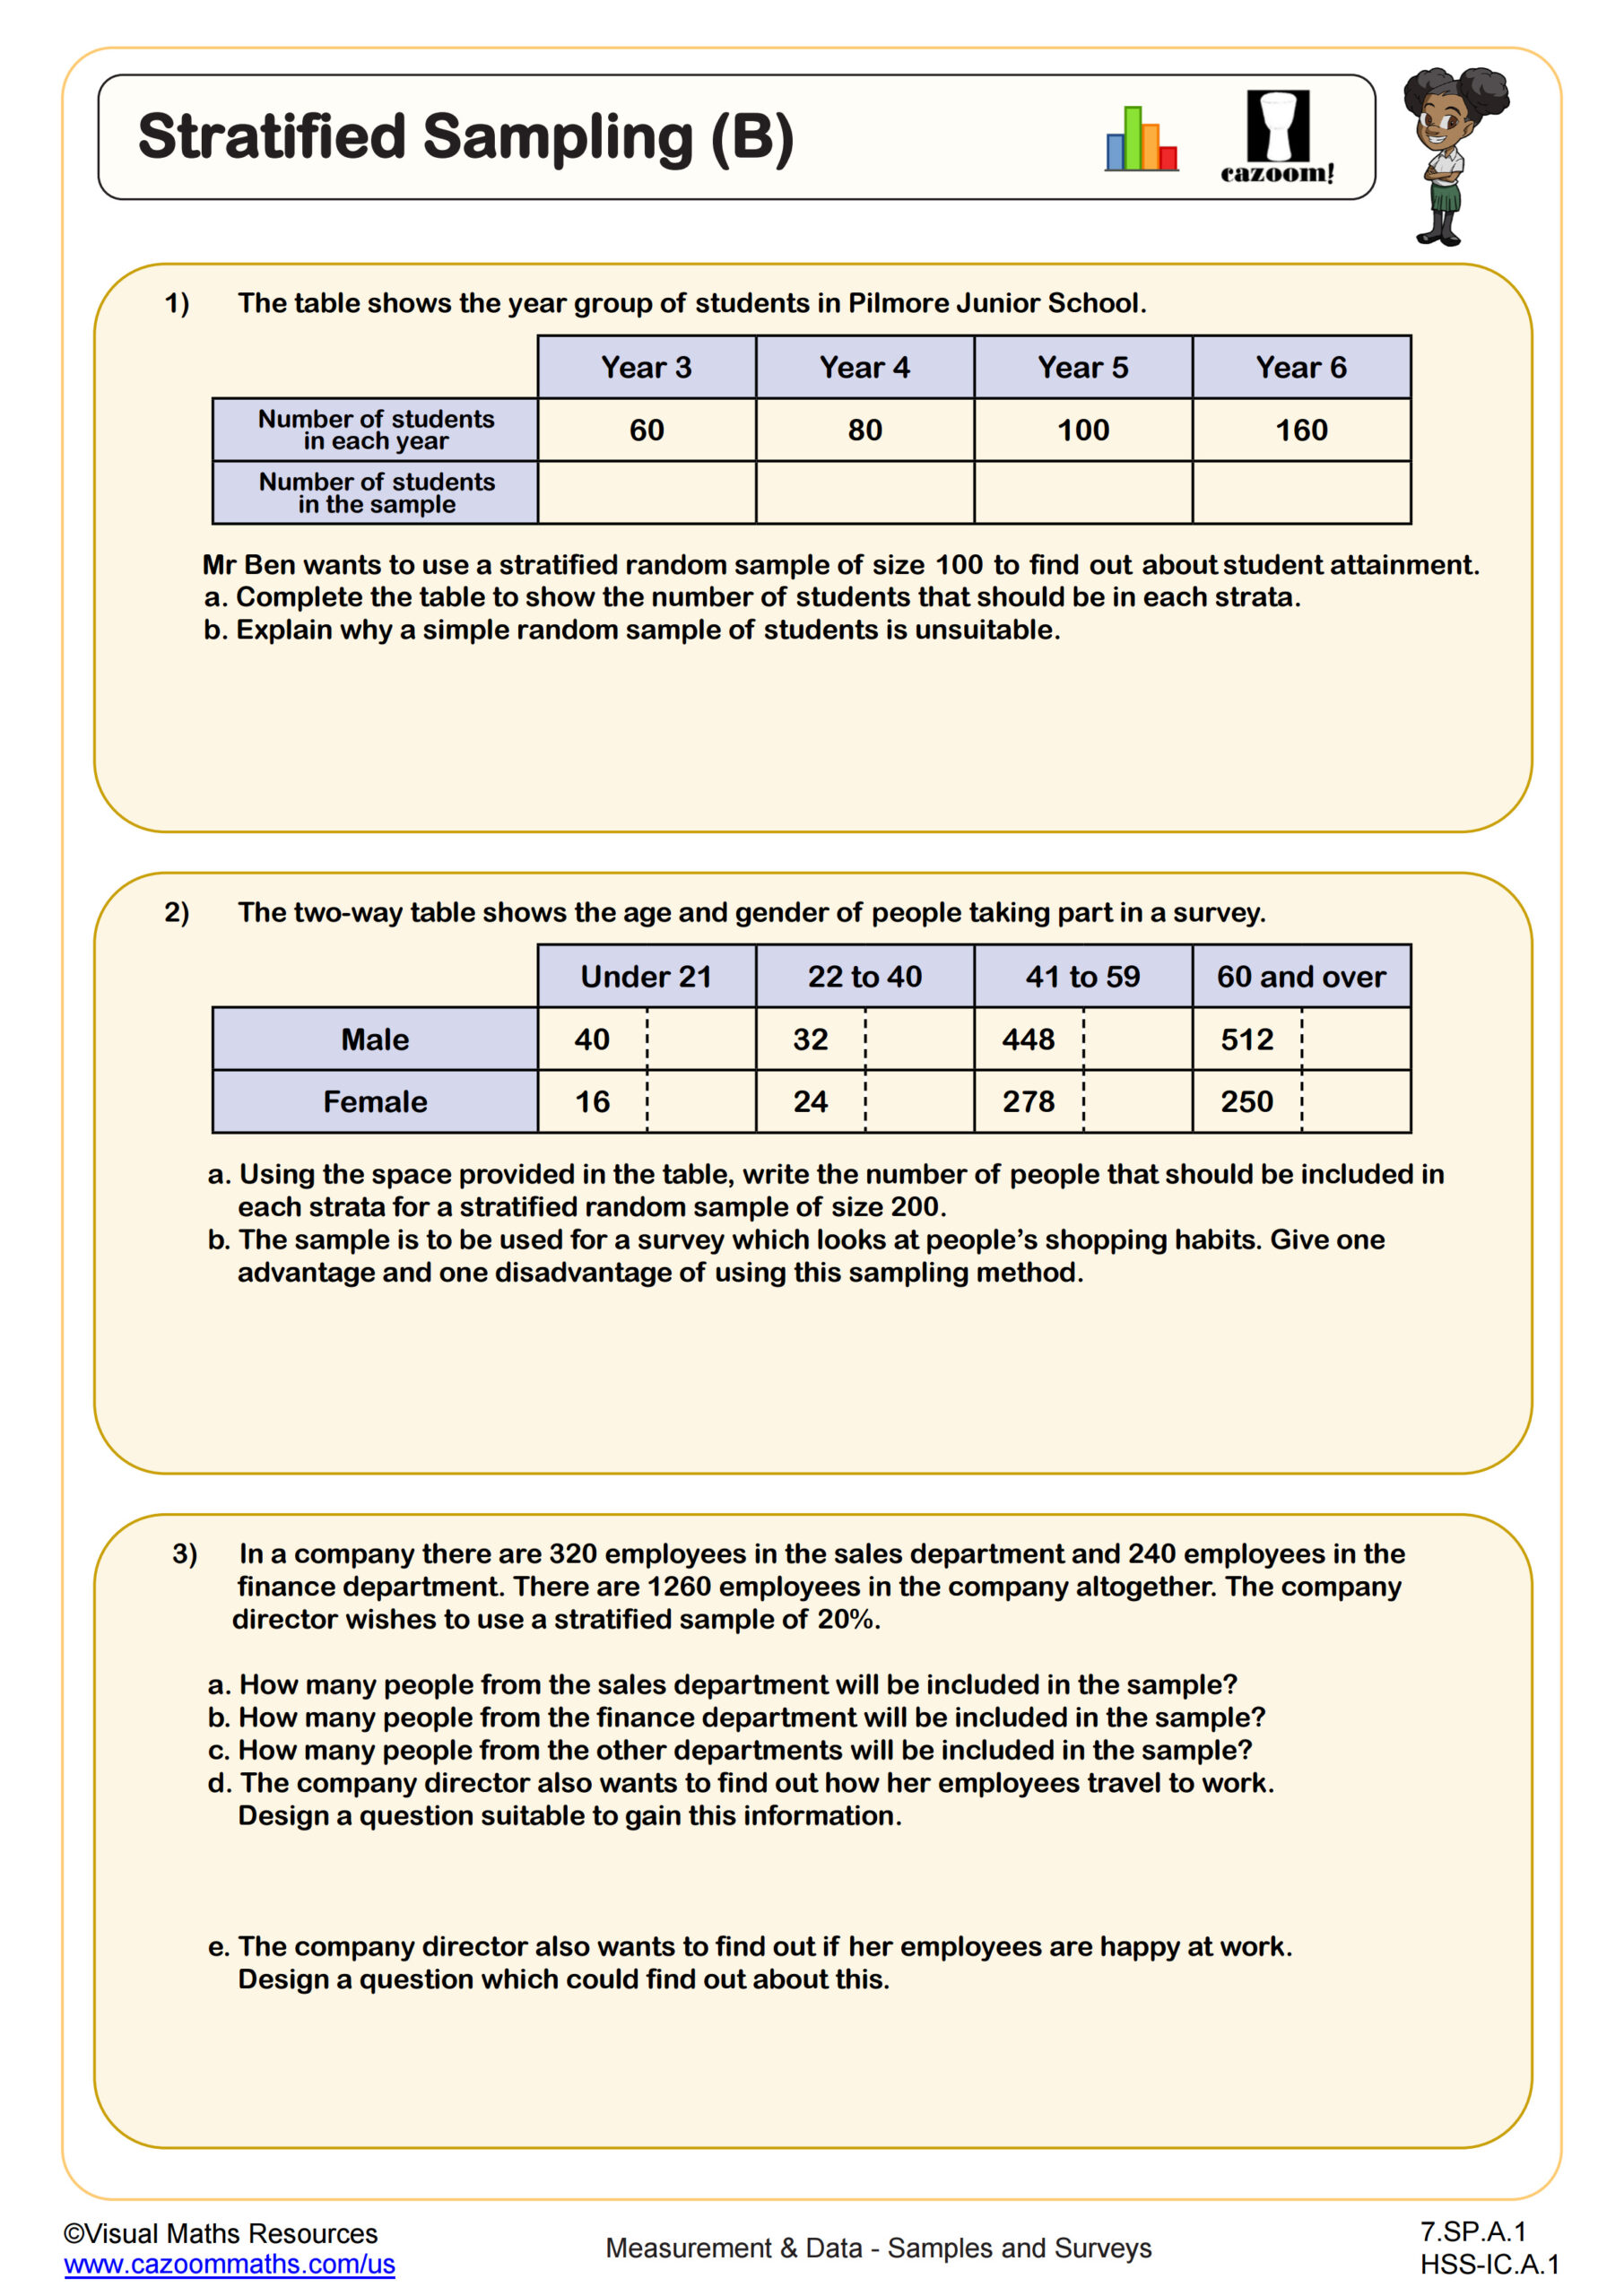
Stratified Sampling (B)
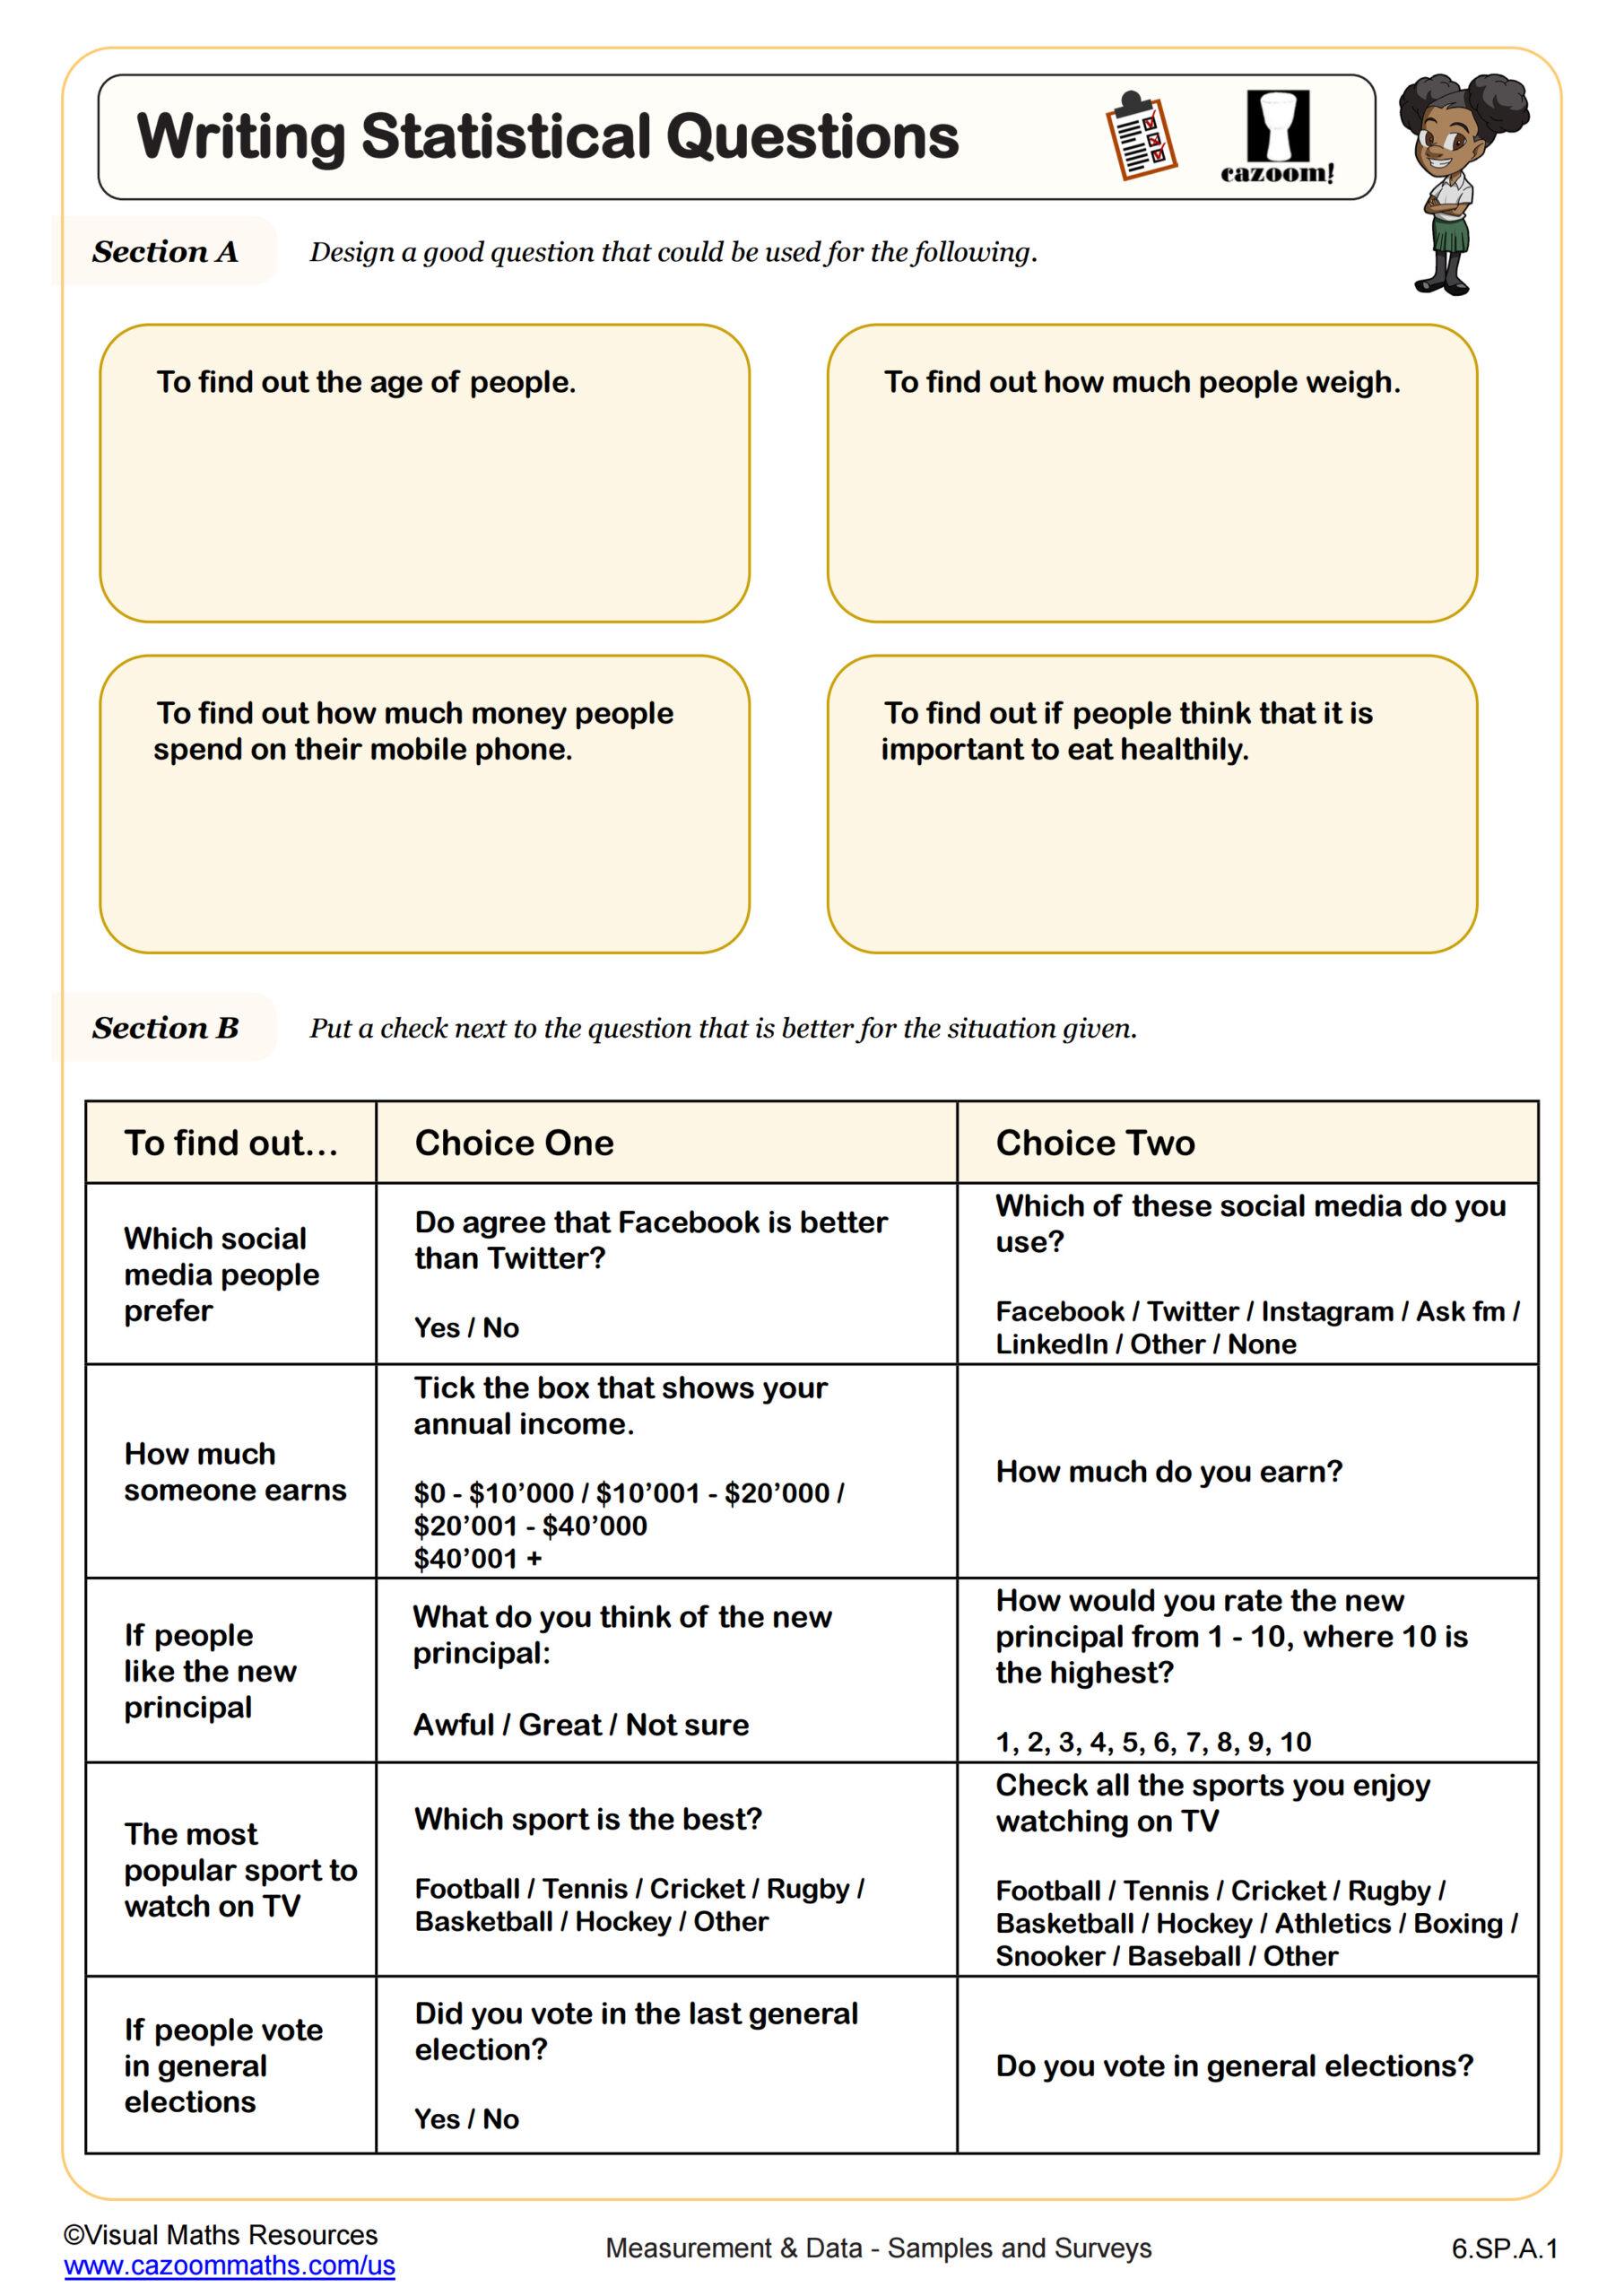
Writing Statistical Questions
All worksheets are created by the team of experienced teachers at Cazoom Math.
Boost Measurement Accuracy and Problem-Solving Skills With Our Printable Middle School Math Resources
Students enter with basic measurement knowledge and simple data displays from elementary grades. These worksheets extend that foundation by introducing statistical concepts like bias, sampling methods, and correlation. Students learn to question data sources and recognize when information may be incomplete or misleading. The progression from reading charts to constructing complex displays prepares them to analyze information critically rather than accept it passively.
Consistent practice with these concepts prepares students for high school statistics and science courses where data interpretation becomes essential. The measurement skills they develop here—converting between metric and customary units, calculating area and volume, working with precision—apply directly to algebra, geometry, and physics. Students who master these topics can approach quantitative information with clarity and make informed decisions based on evidence.
Key Math Skills Covered in Cazoom Math Measurement and Data Activities
This integrated collection takes students from basic measurement to advanced data analysis and probability. They begin by constructing visual charts before interpreting patterns and drawing conclusions from data. Each worksheet includes full solutions with complete reasoning. Covering unit conversions, data visualization, statistical analysis, sampling methods, and probability, this set builds a strong foundation for understanding how mathematics describes and predicts the world around us.
Why Teachers Choose Our Grade School Measurement and Data Worksheets
The worksheets function effectively in various classroom situations, requiring minimal preparation work. Teachers should provide basic exercises to students who need additional help, but also provide challenging extension problems that appear on multiple worksheets for their advanced learners. The solutions demonstrate the step-by-step reasoning for each problem, which enables students to follow the process and identify their errors when working independently.
The uniform page structure throughout all sections helps students concentrate on their math work because they do not need to adjust to different page layouts. Teachers use these activities for homework assignments, station work, and substitute teaching because they provide students with sufficient direction to work independently. The consistent format of worksheets helps teachers save time because they do not need to explain the mechanics of the worksheets to students.
Travel Plans to Analyzing Election Poll: Where These Skills Show up in Real Life
Your middle school students apply measurement and data concepts whenever they need to make sense of information or compare options, often without realizing it. Here are some real-life situations where these concepts are used frequently..
• Reading nutritional labels and servings
• Planning travel routes and fuel needs
• Managing personal budgets and expenses
• Making consumer choices from reviews