Middle School Percentages Worksheets
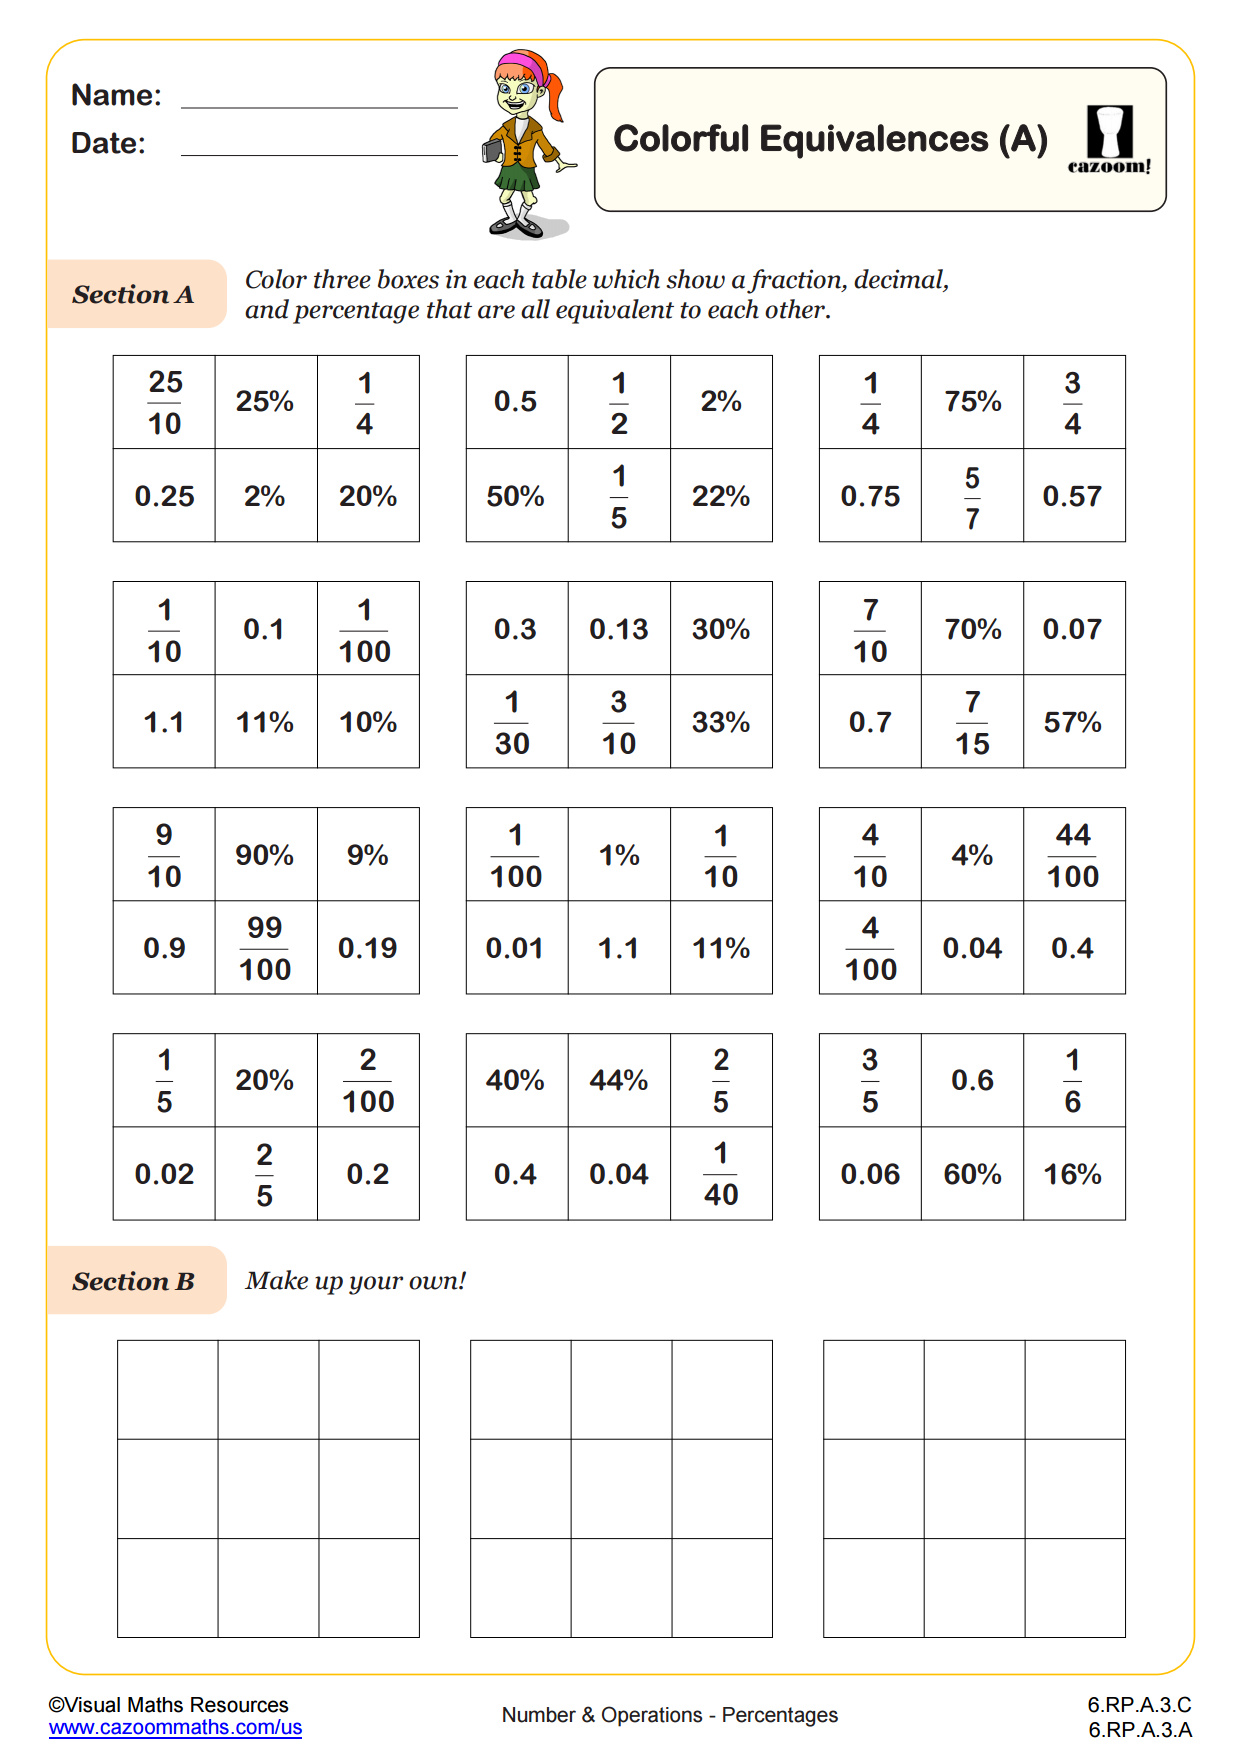
Colourful Equivalances (A)
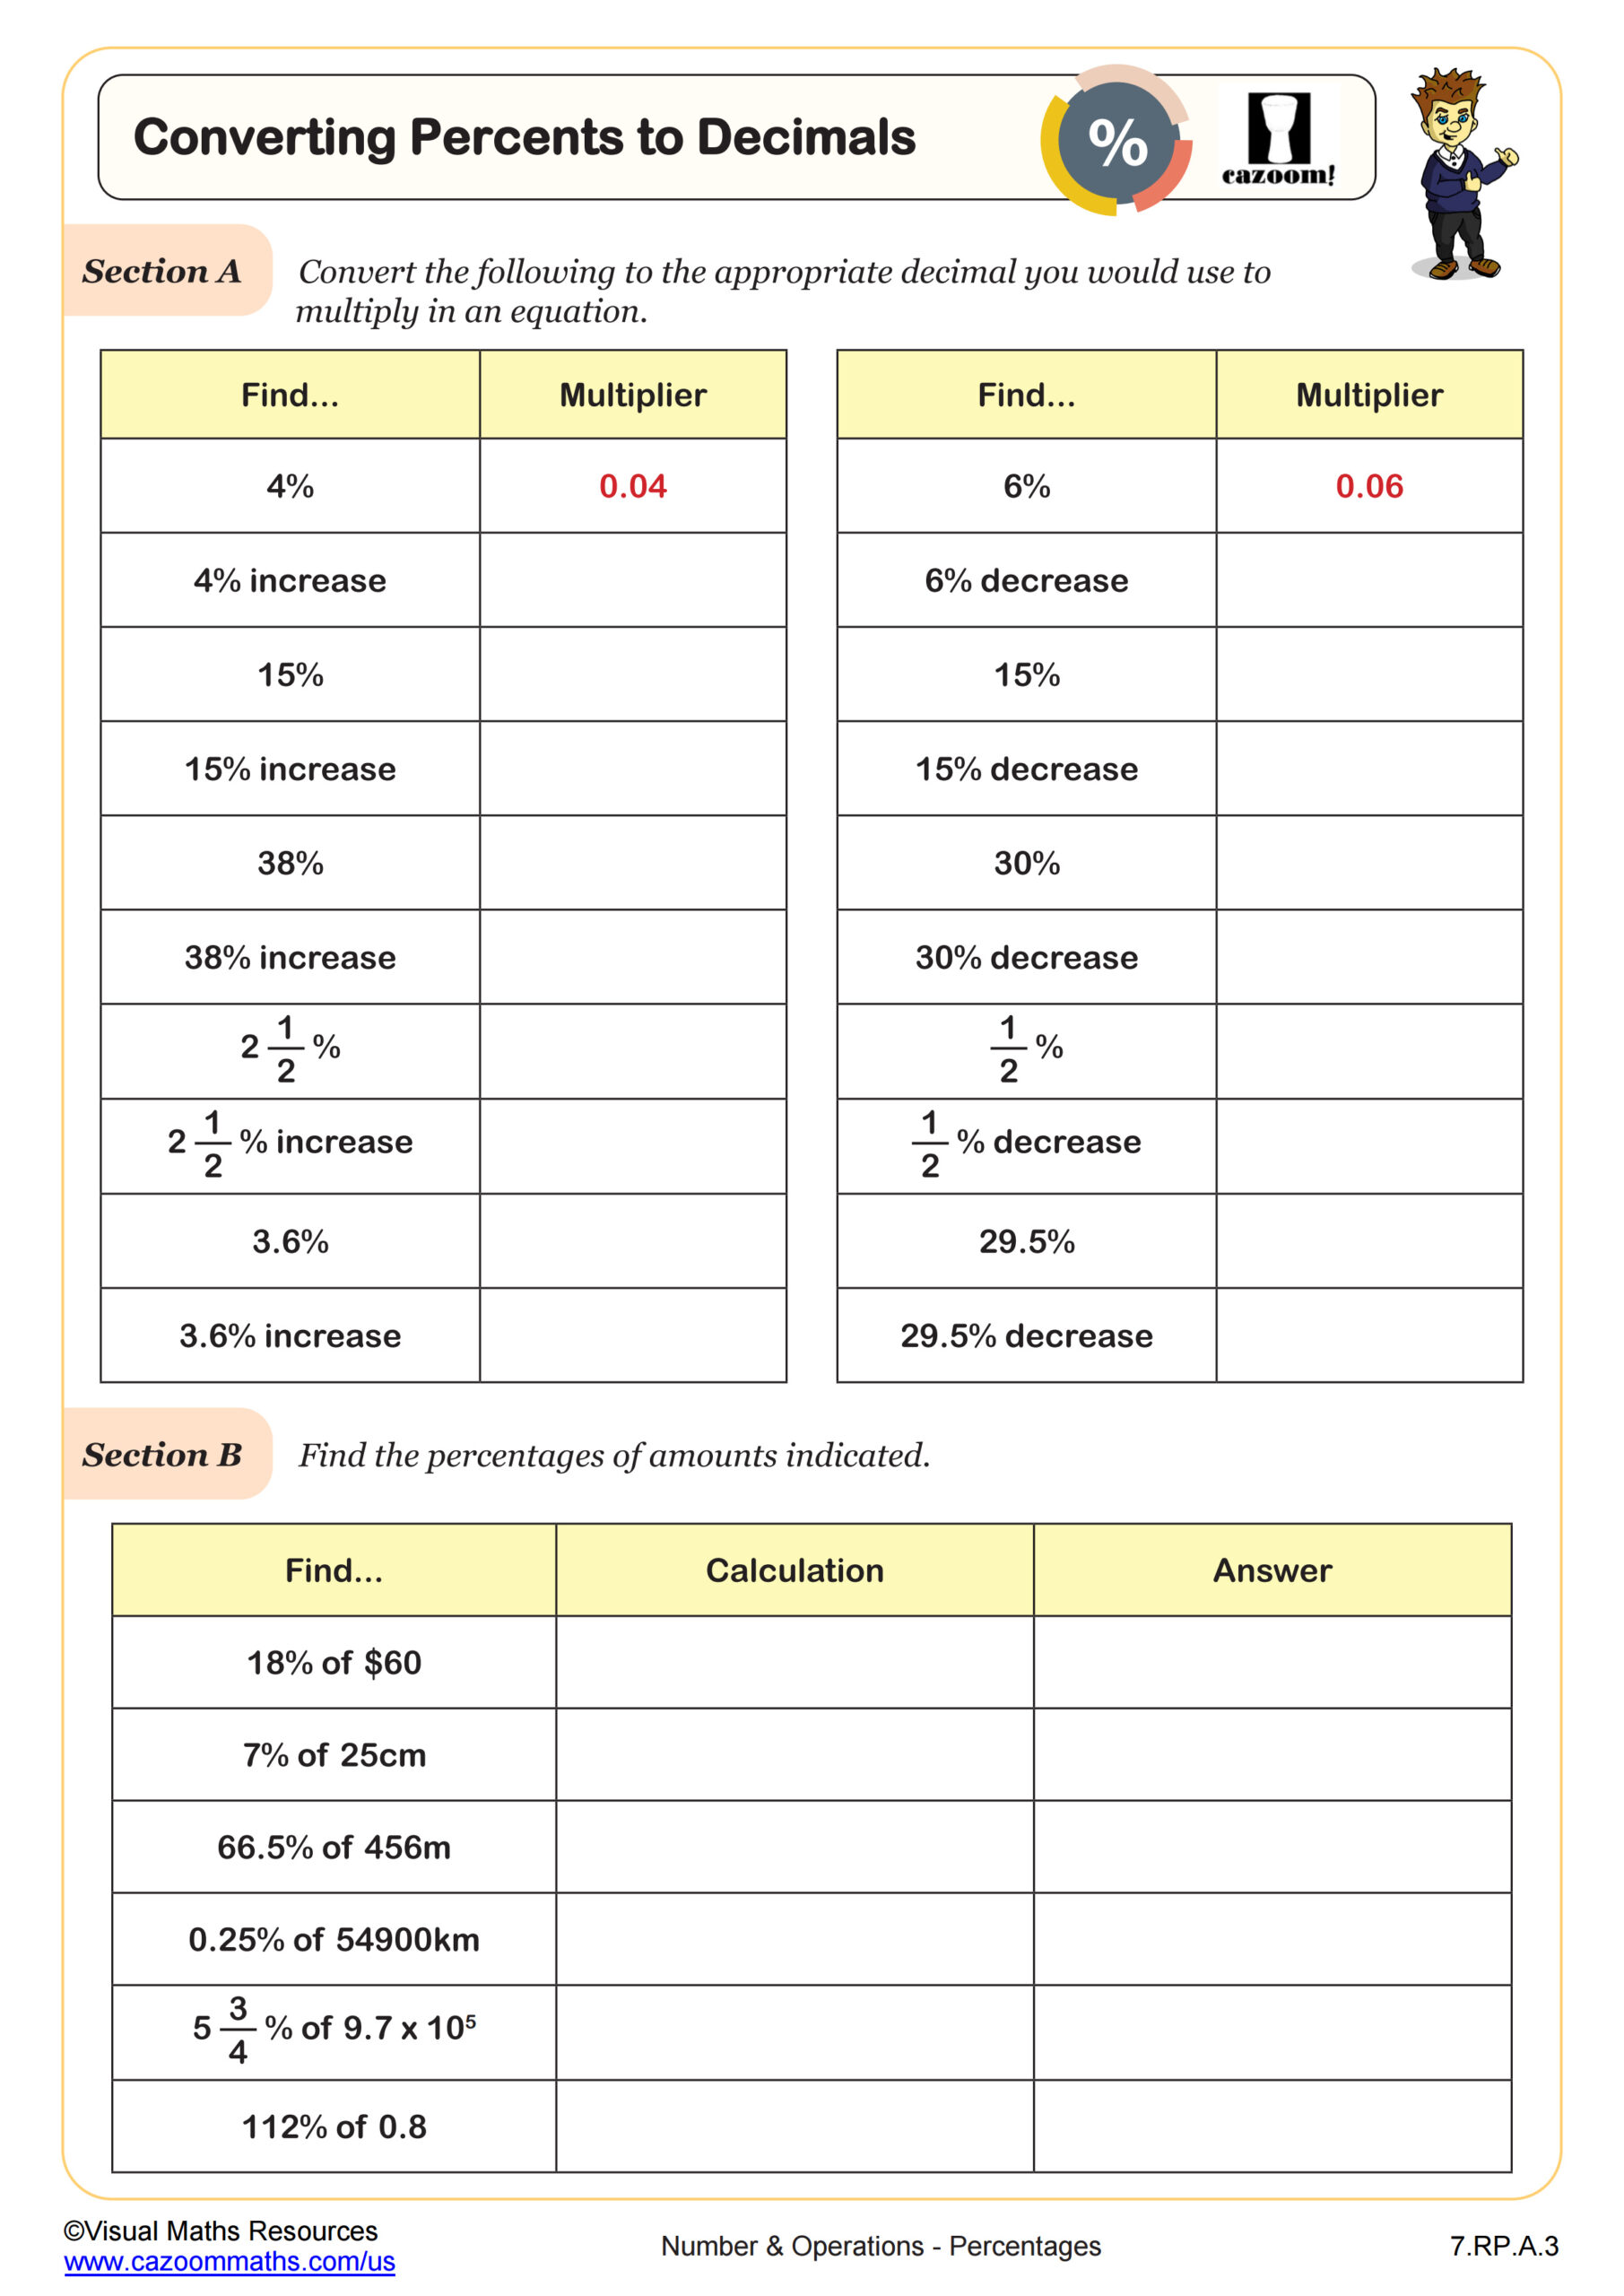
Converting Percents to Decimals
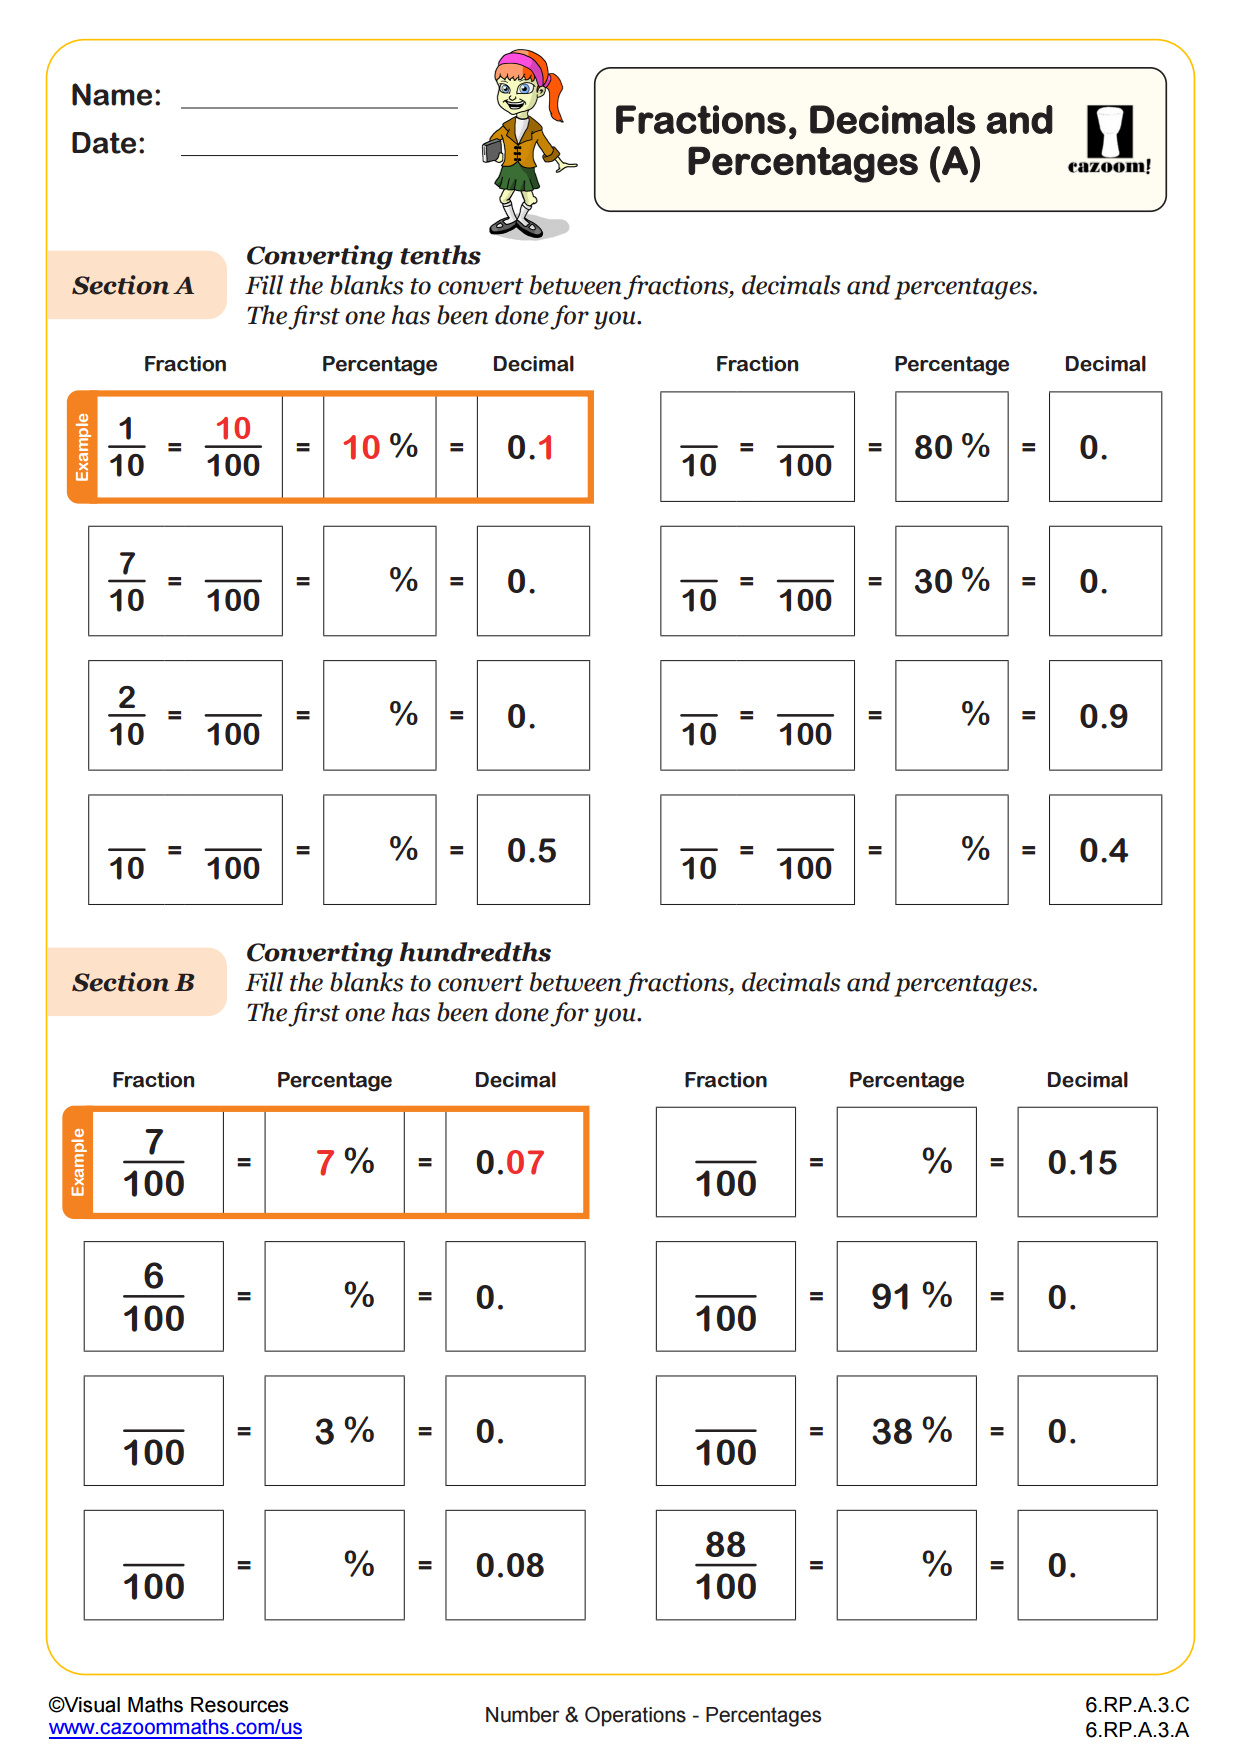
Fractions, Decimals and Percentages (A)
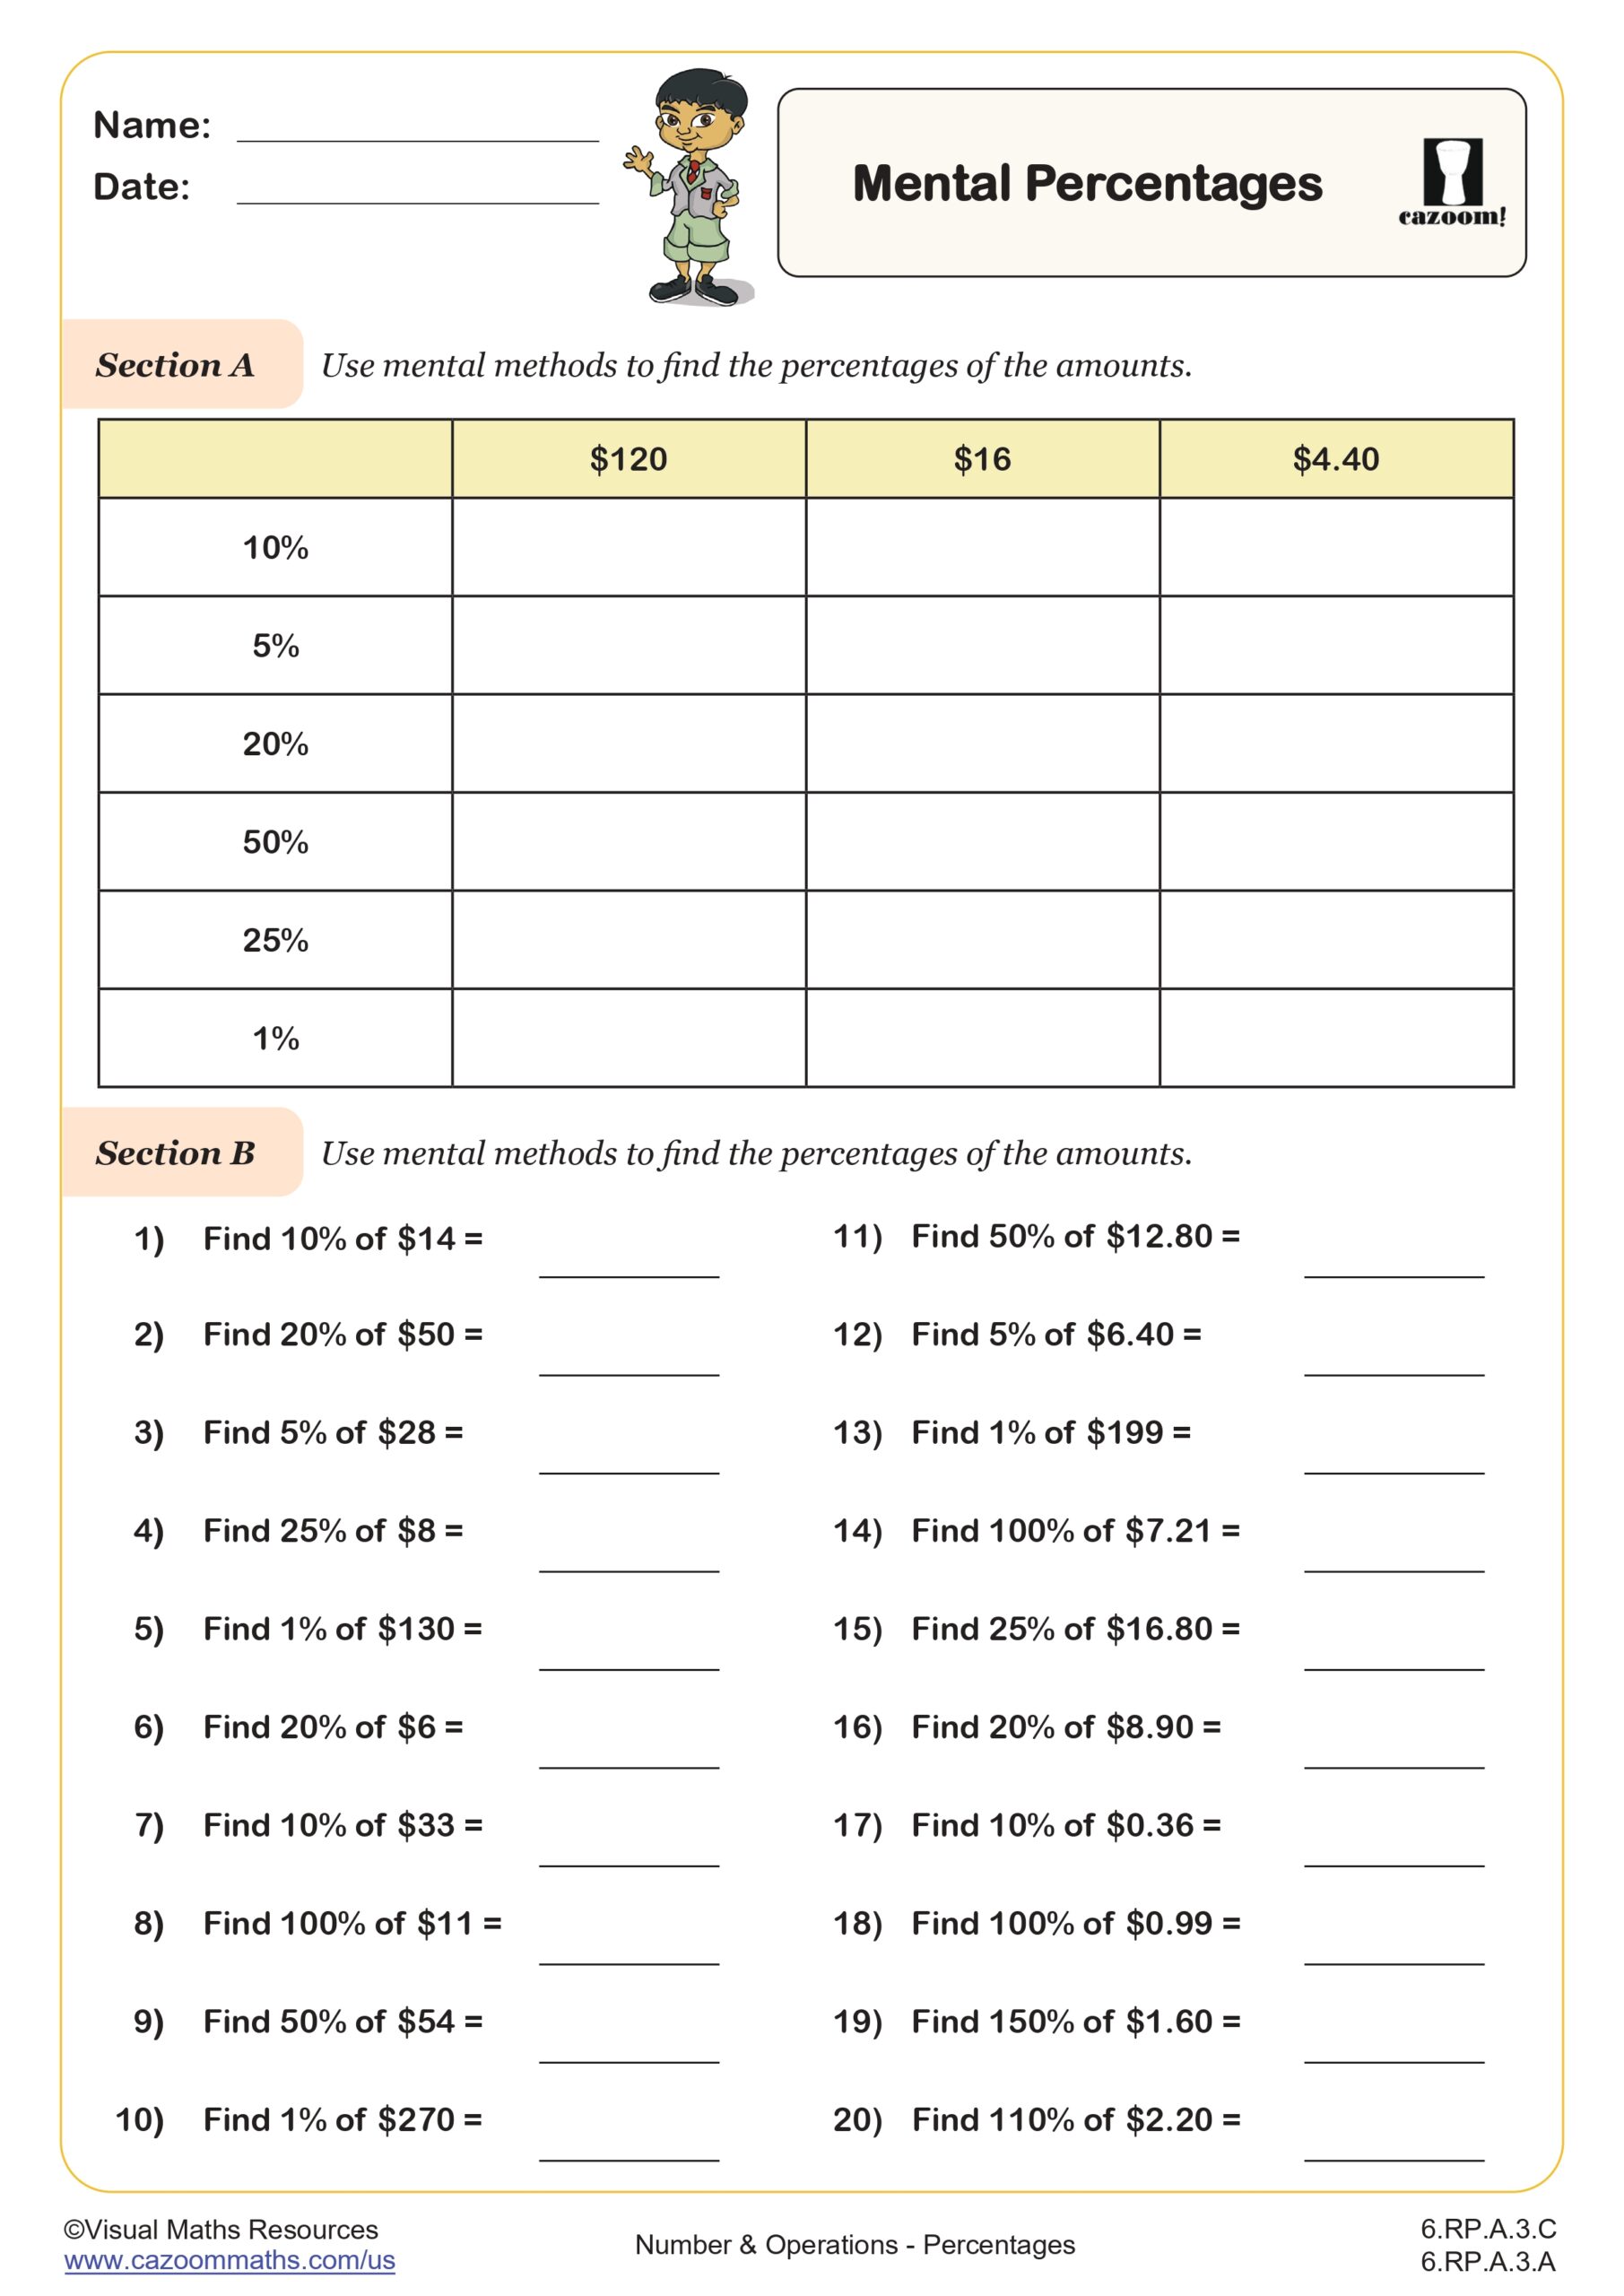
Mental Percentages
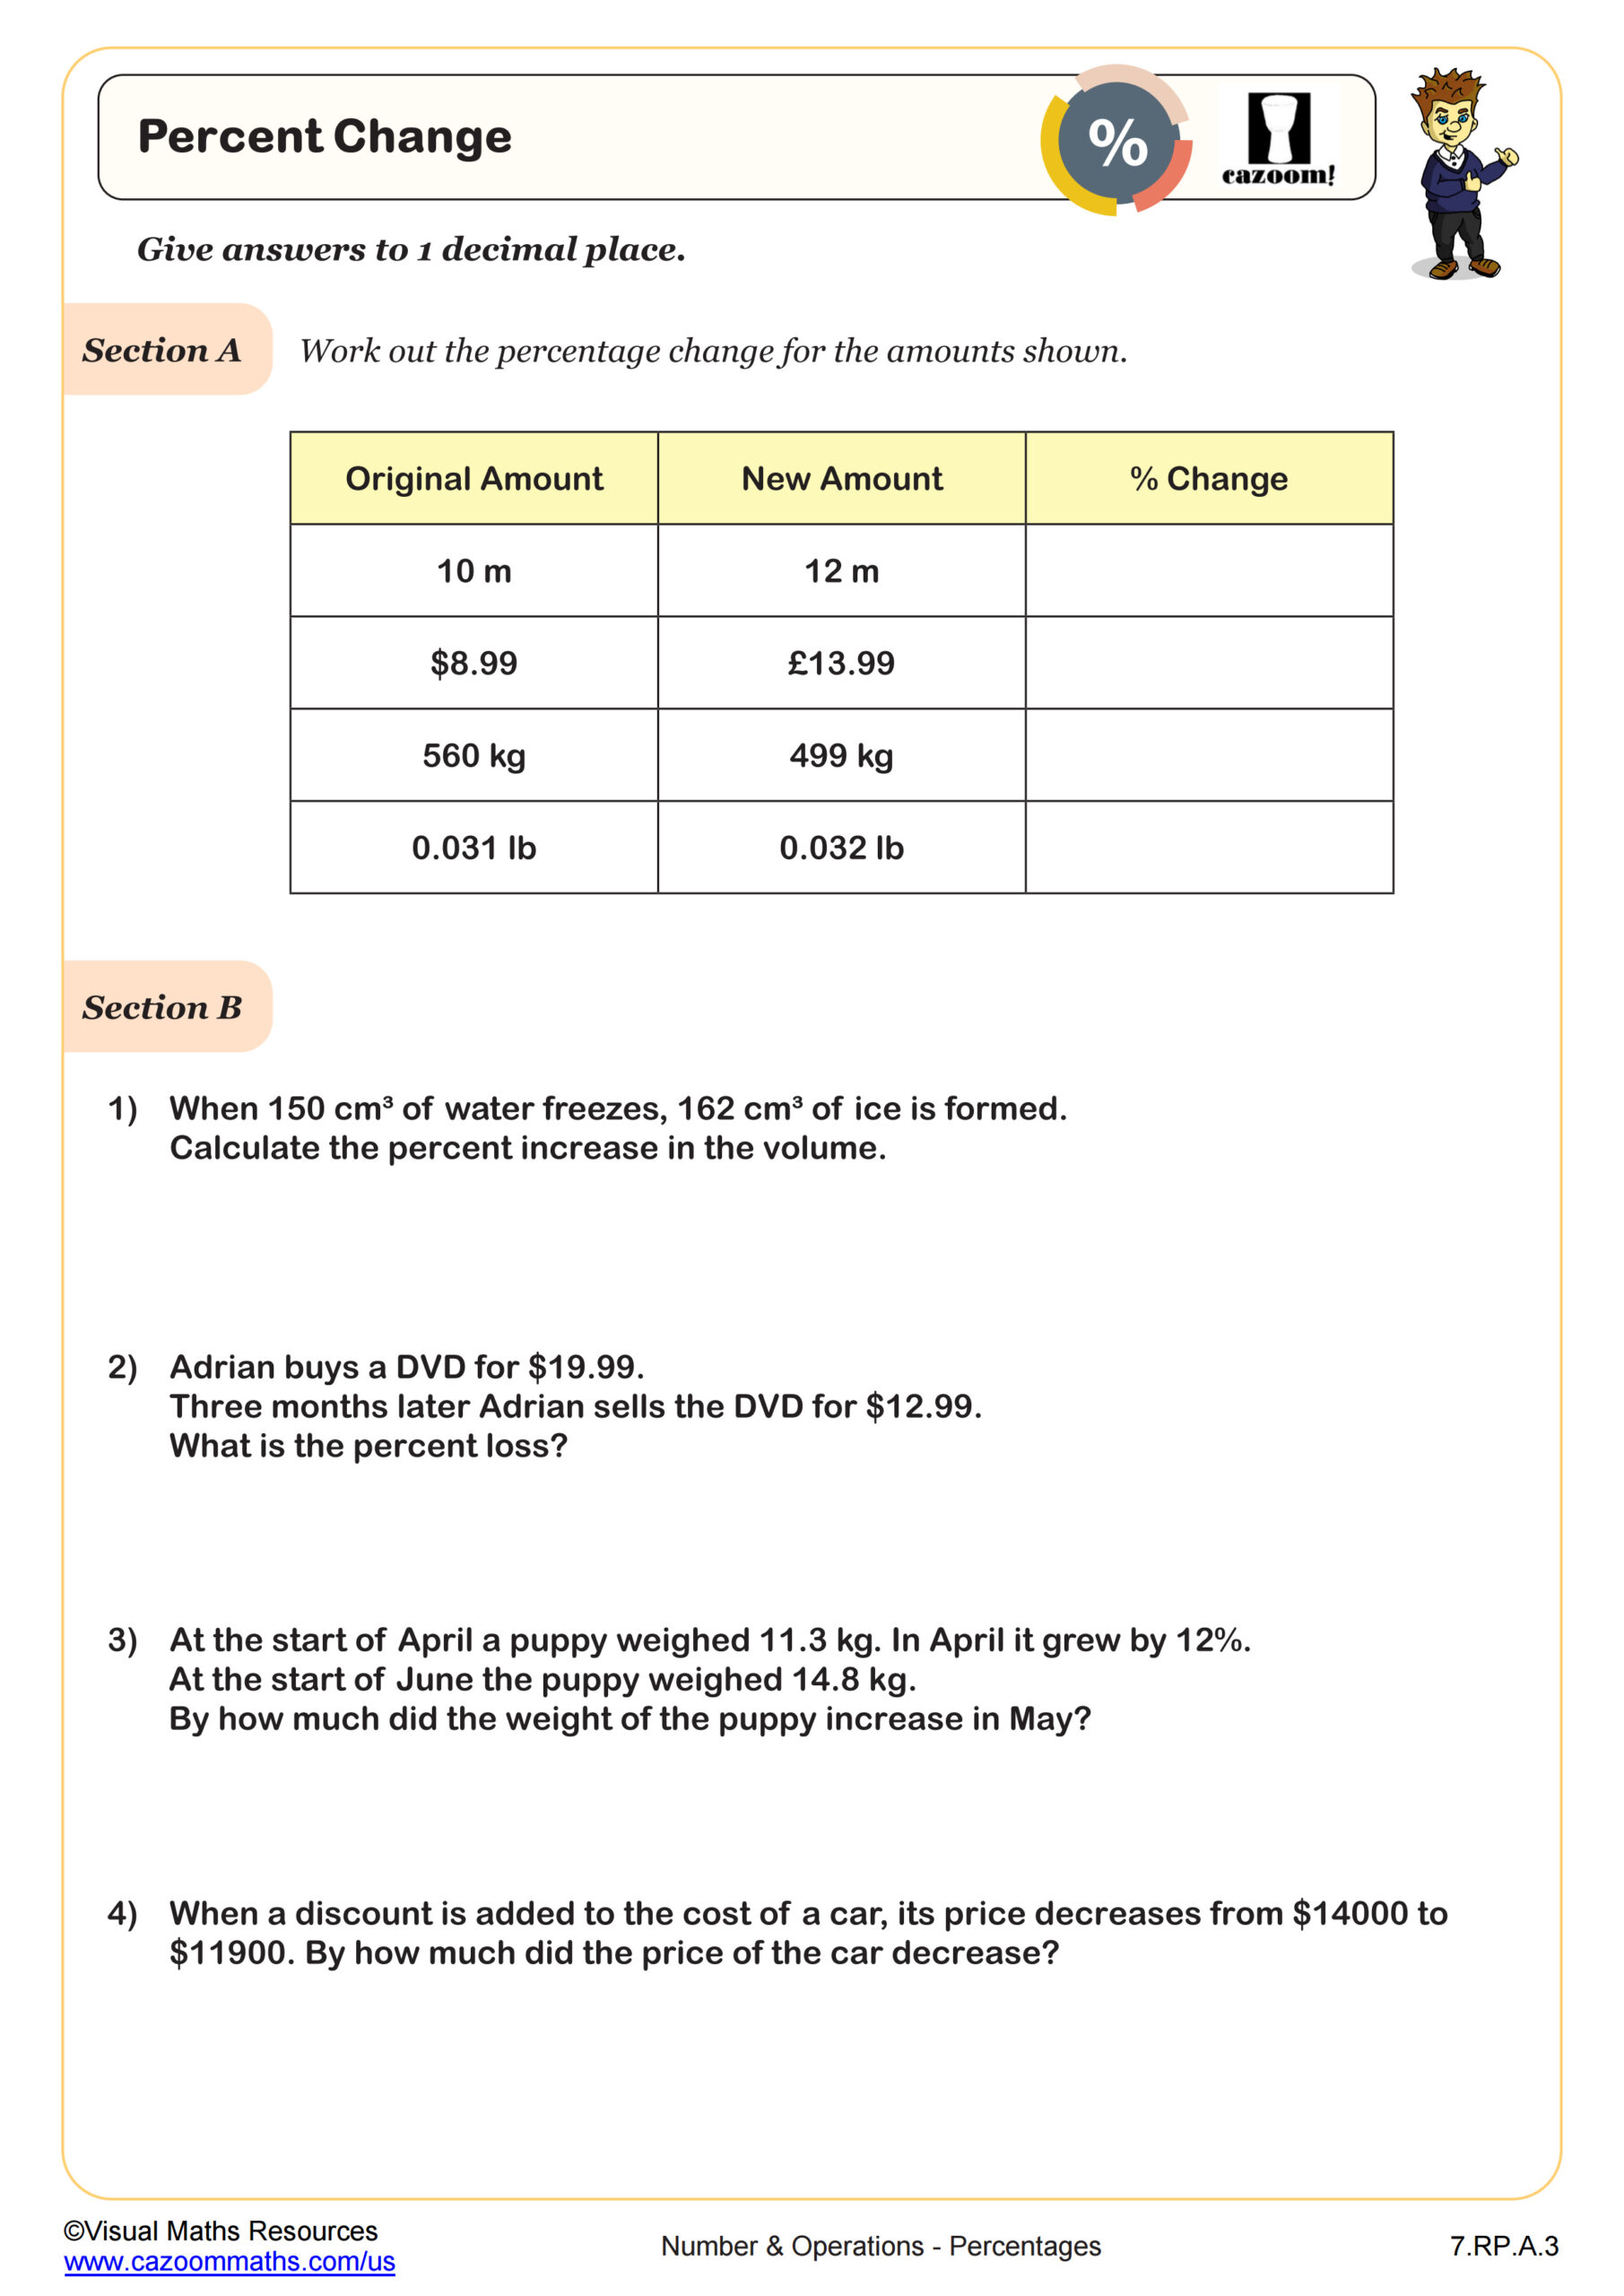
Percent Change
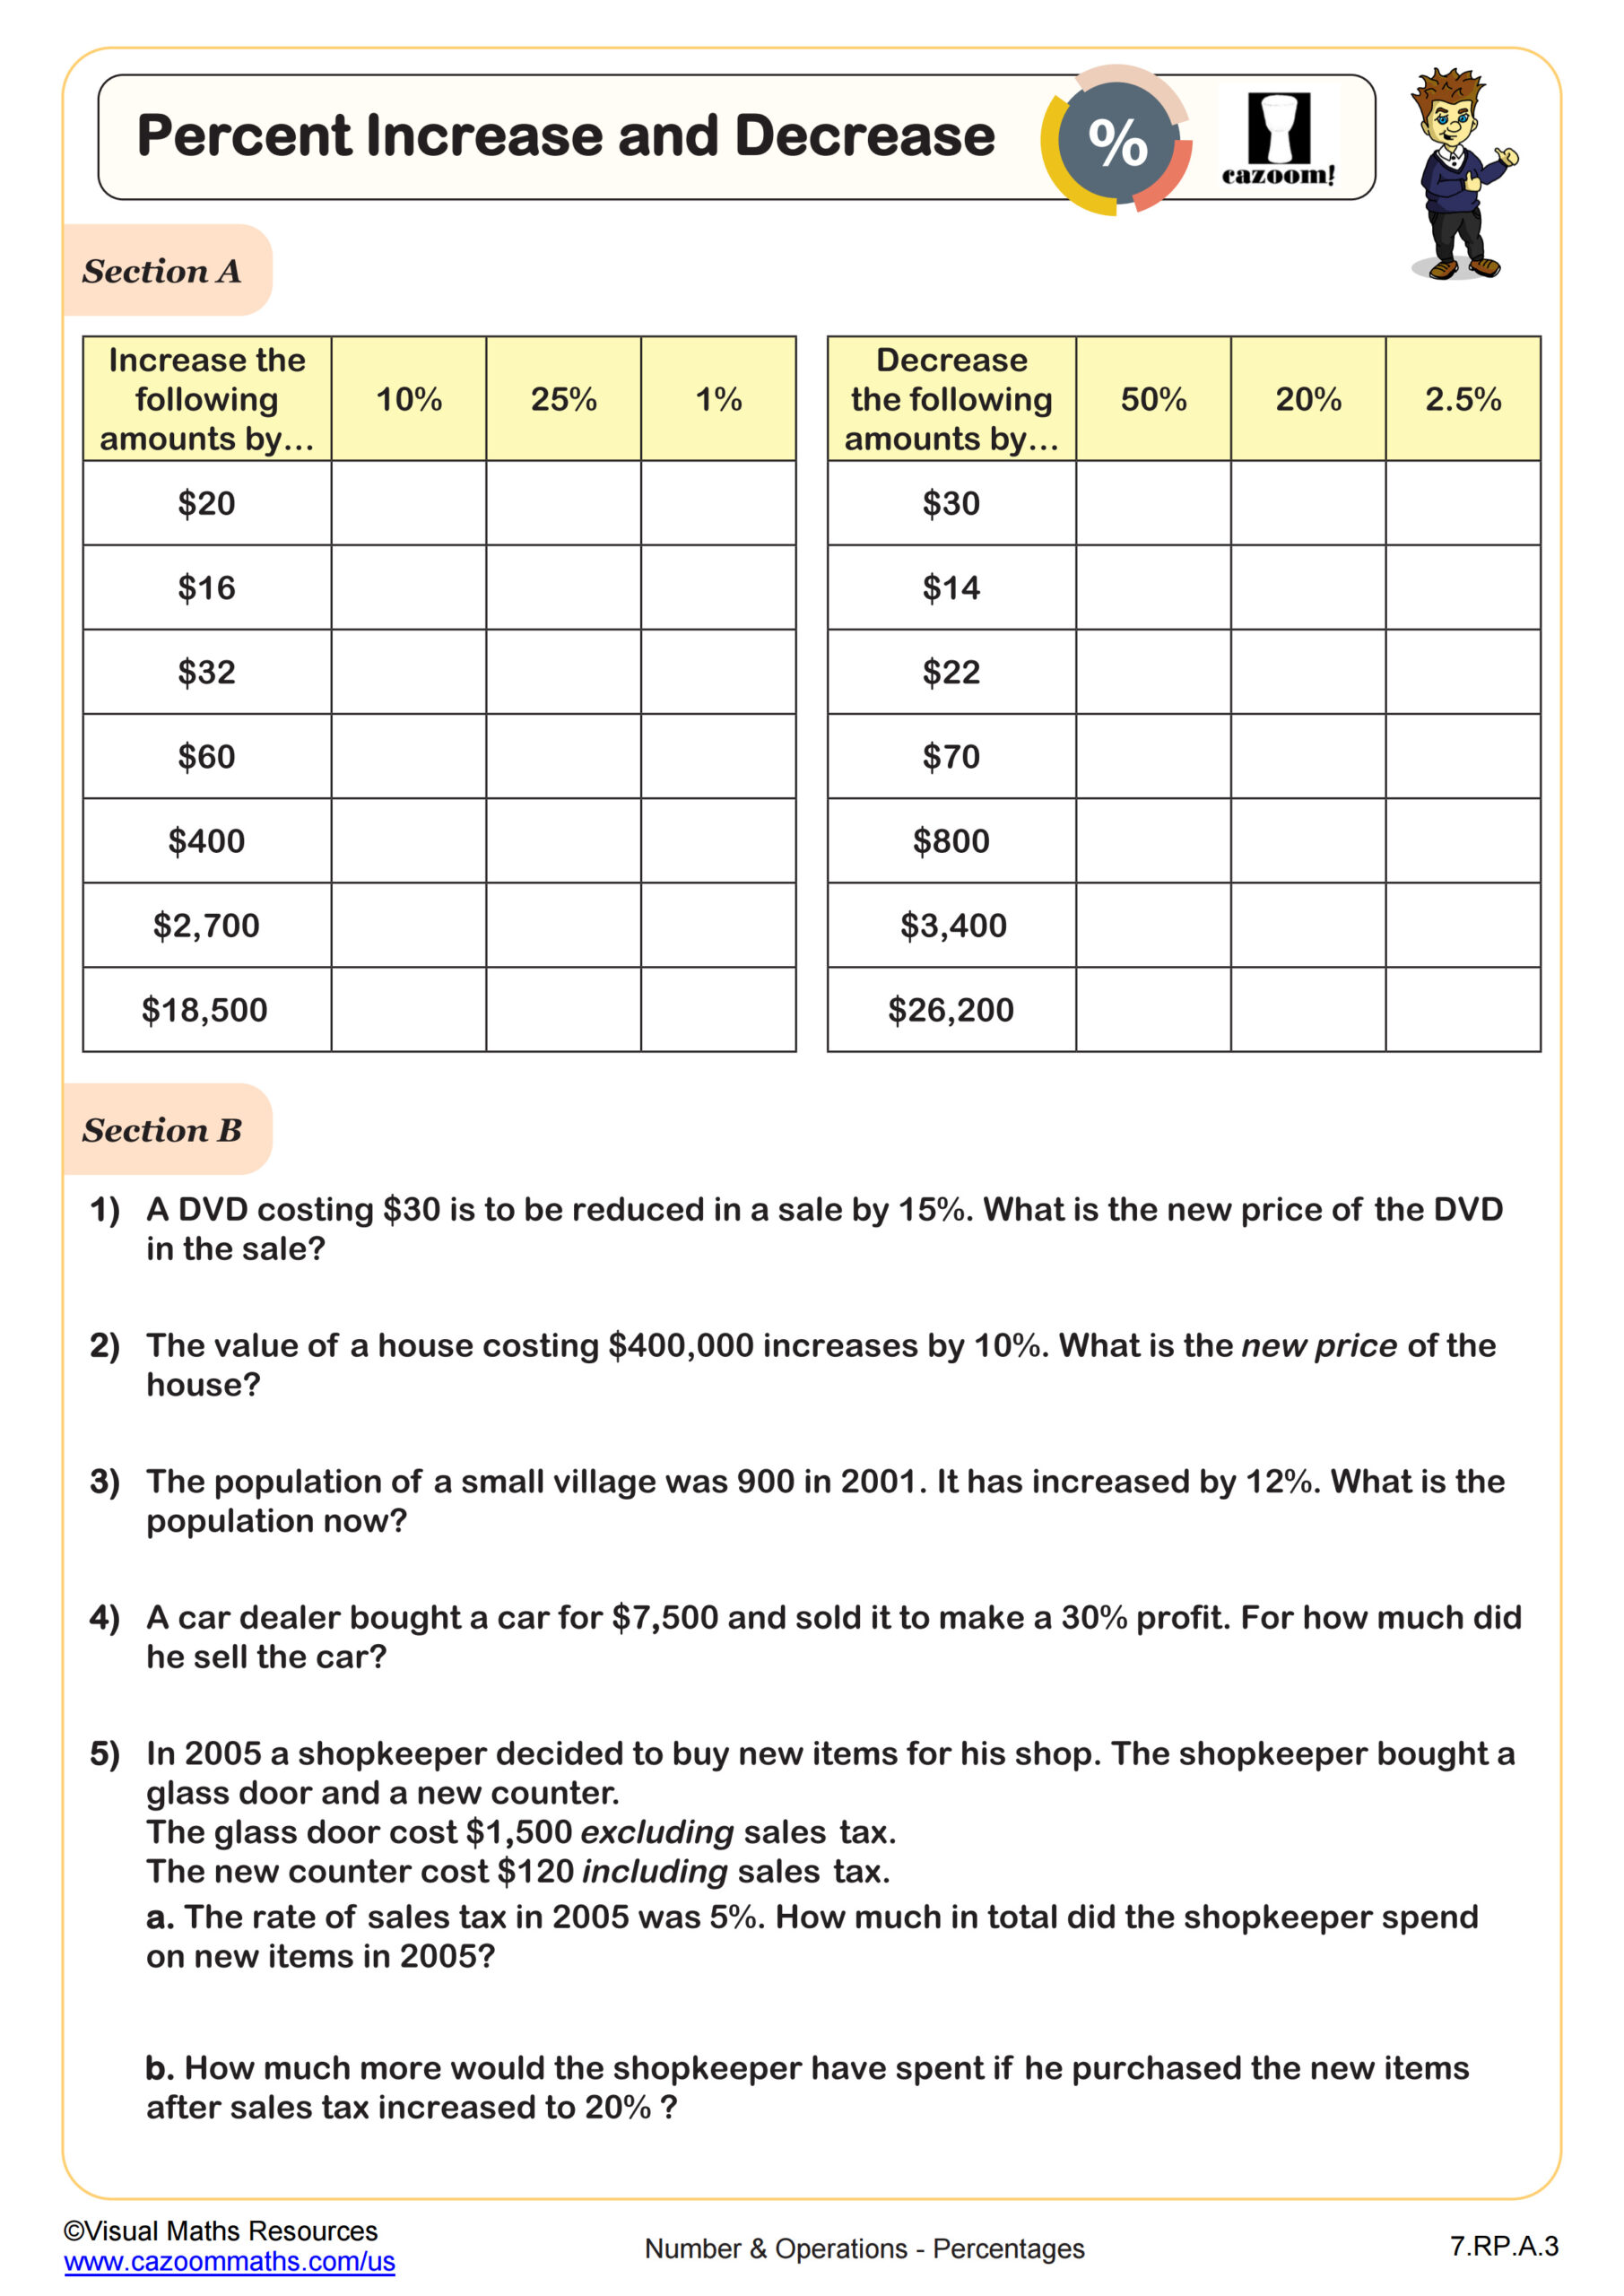
Percent Increase and Decrease
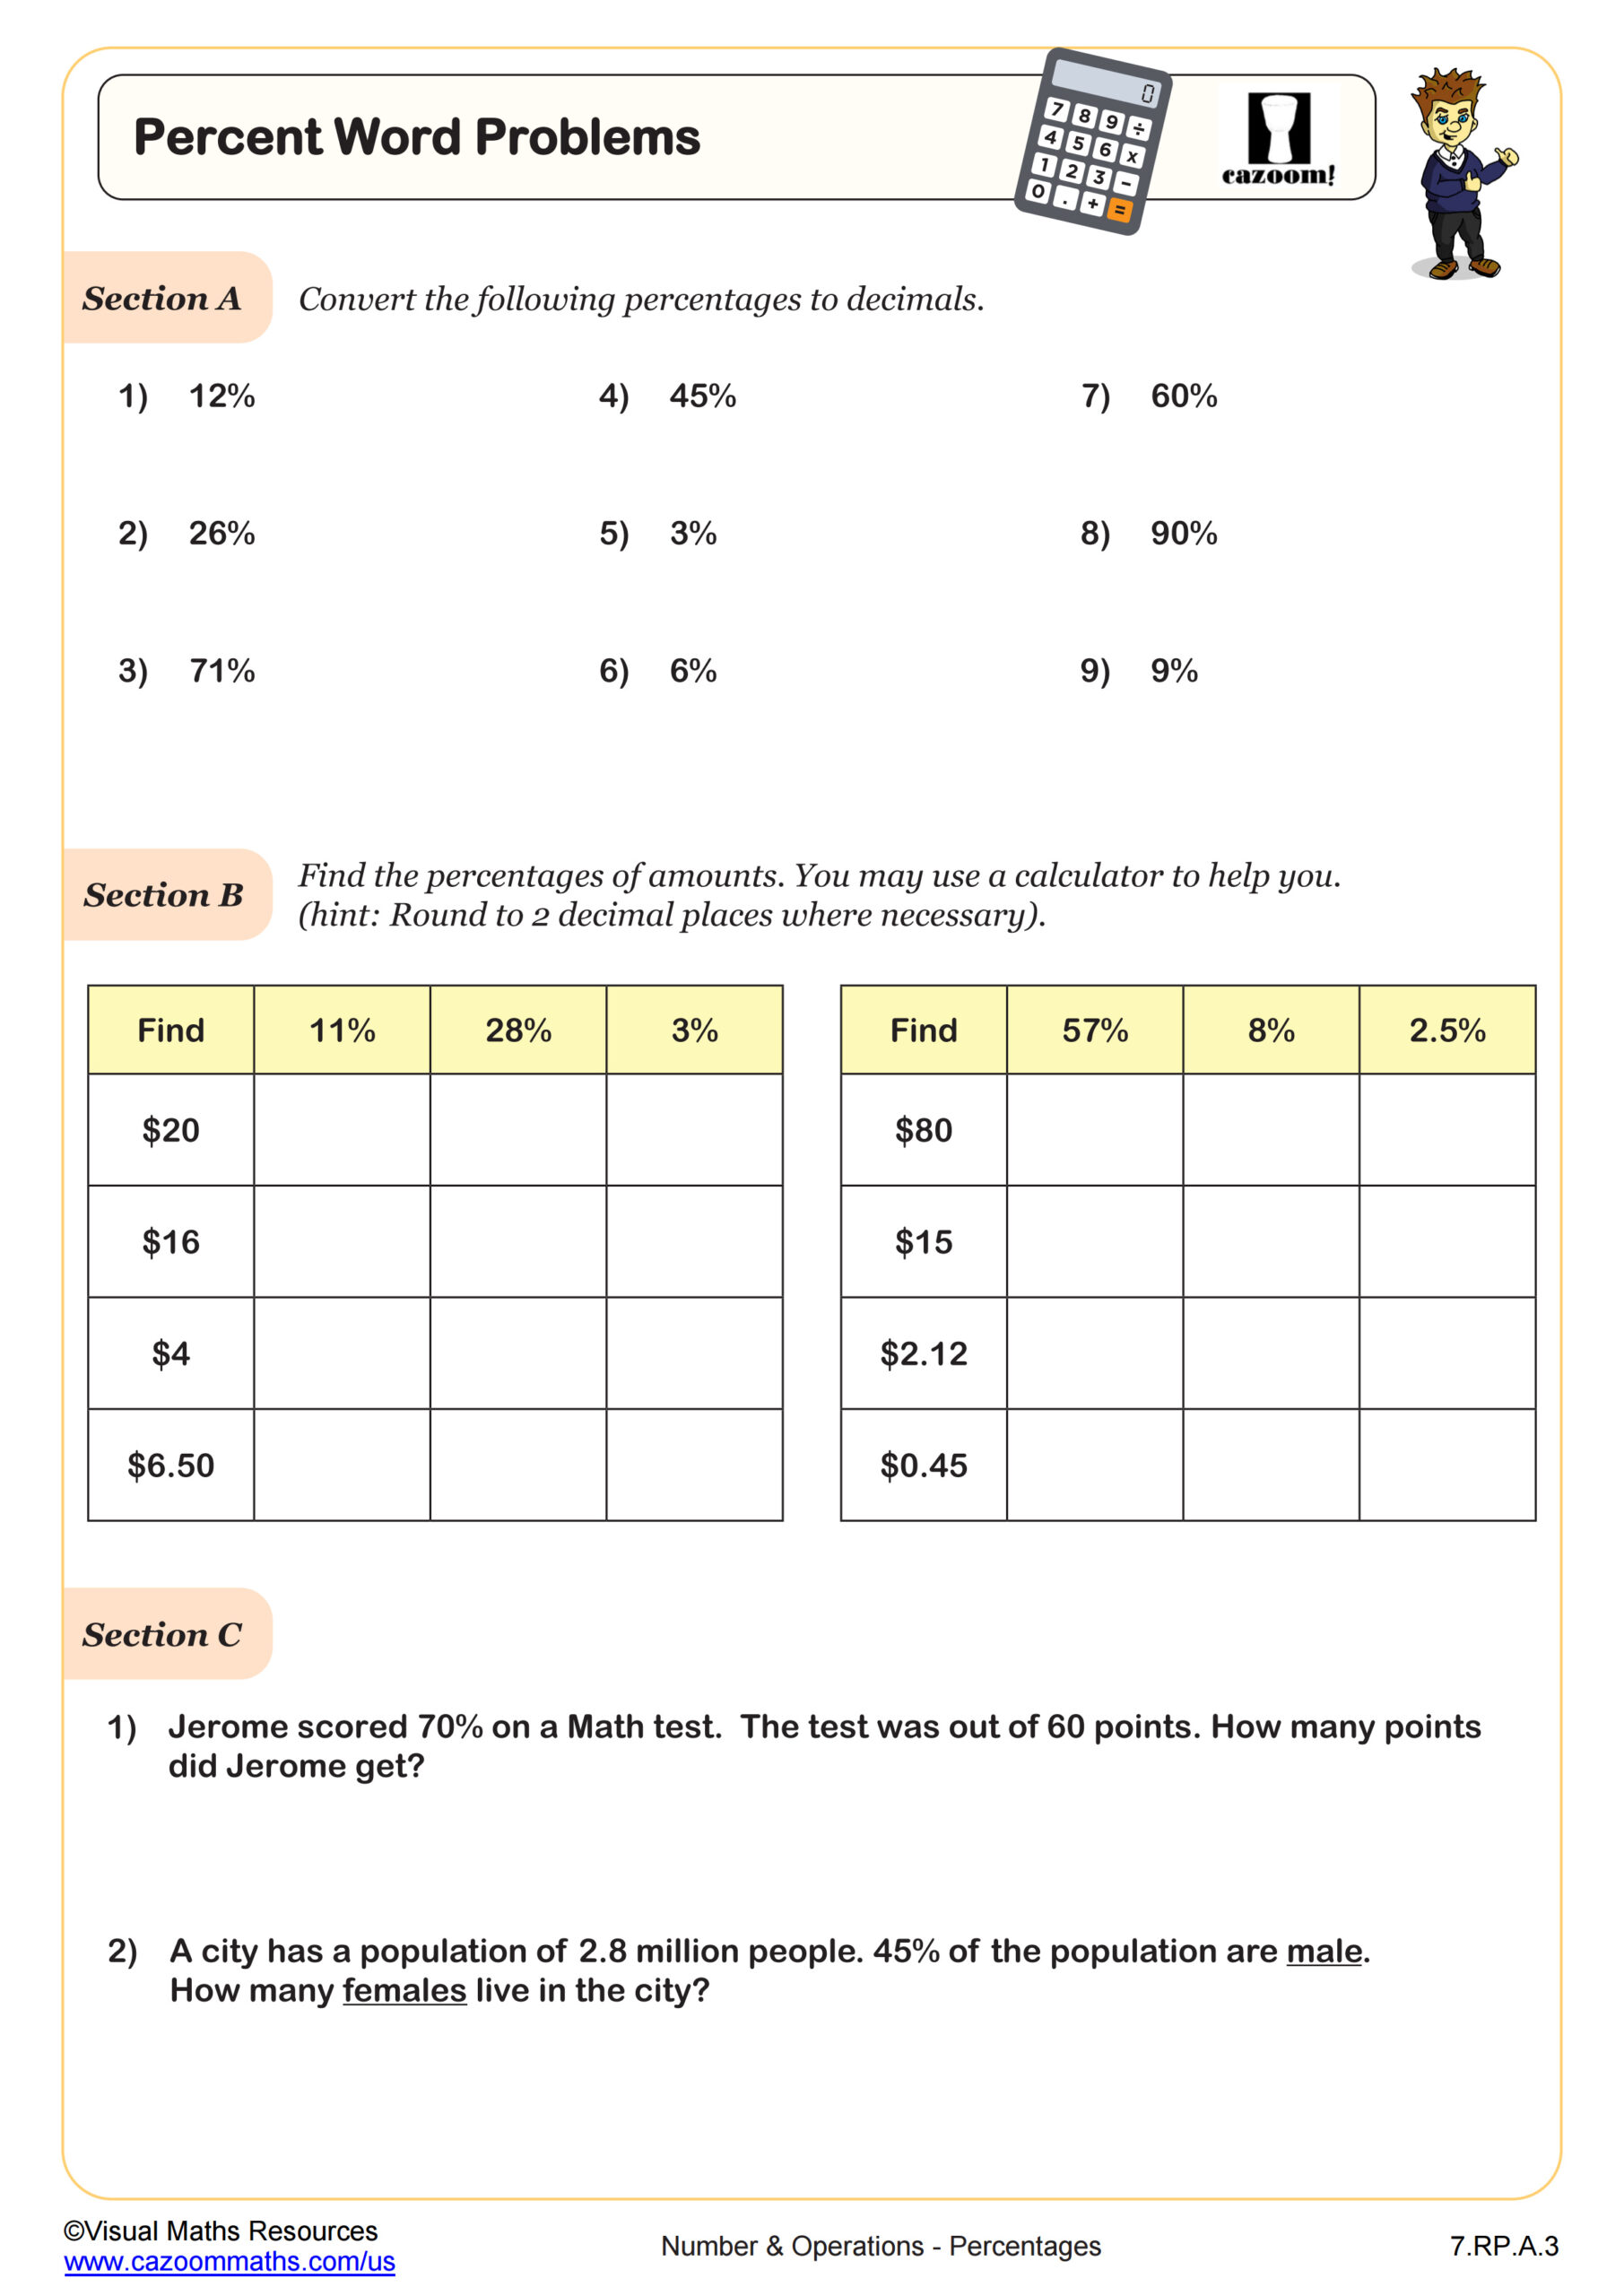
Percent Word Problems
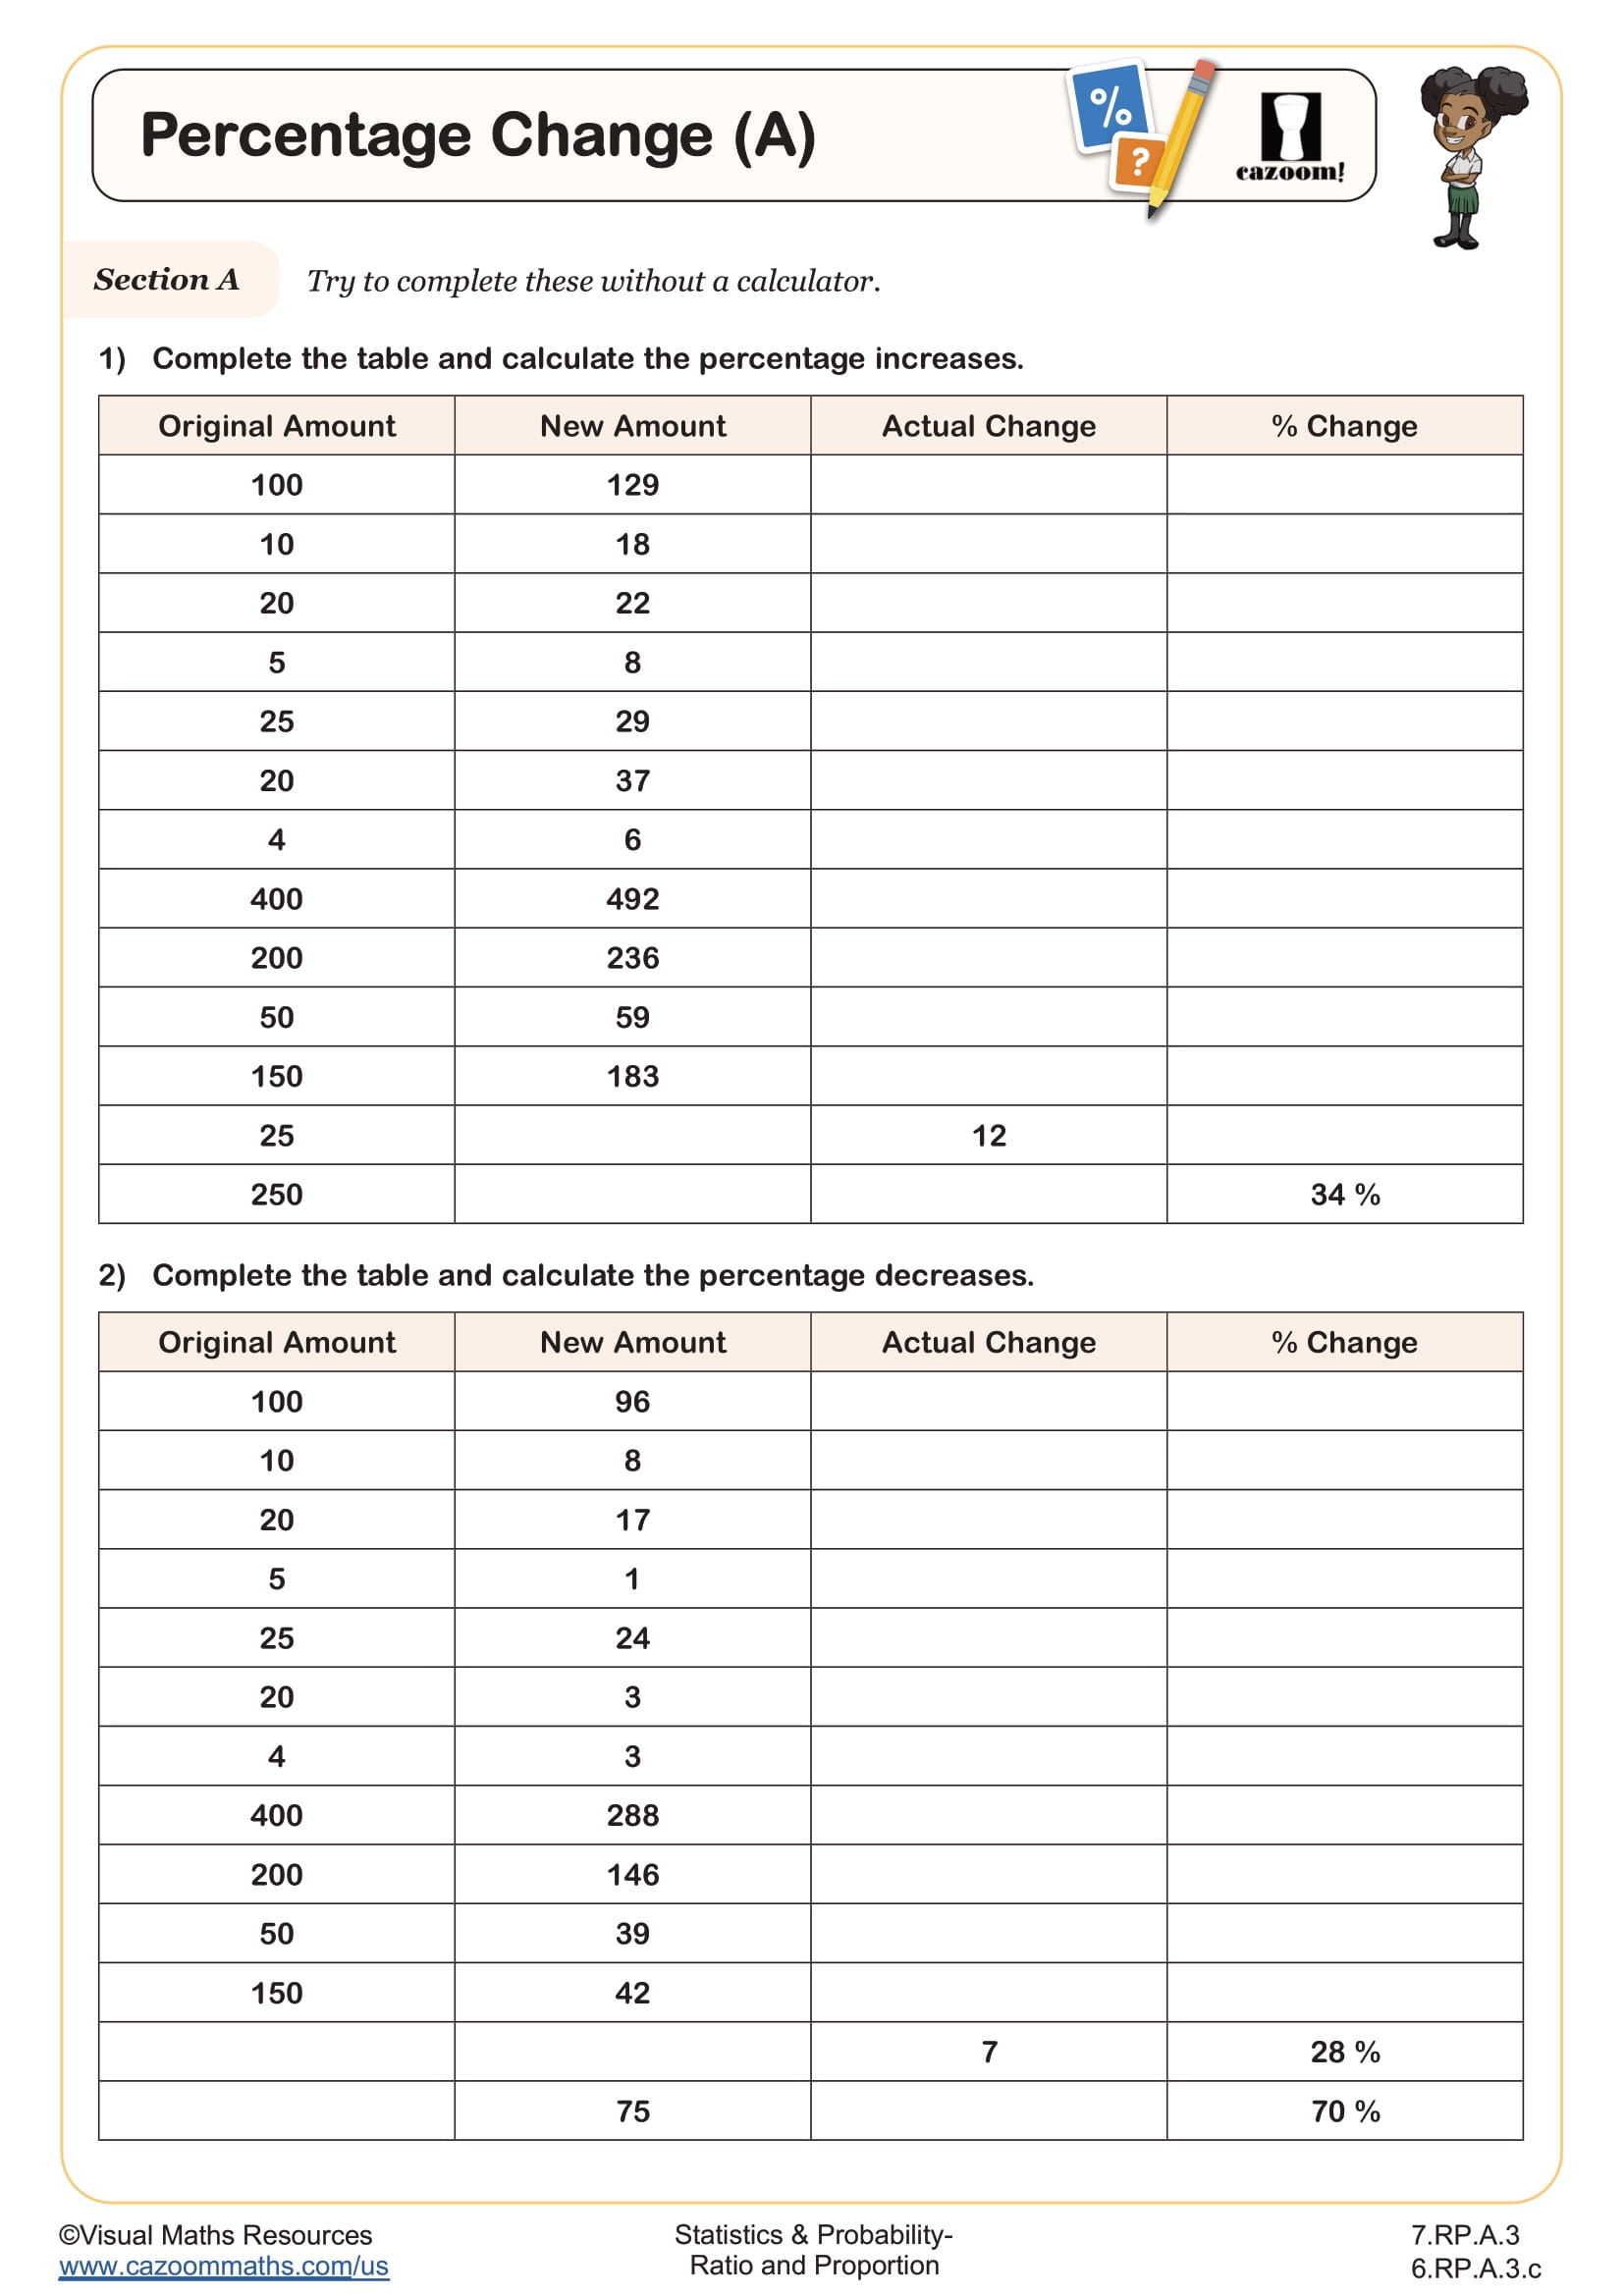
Percentage Change (A)
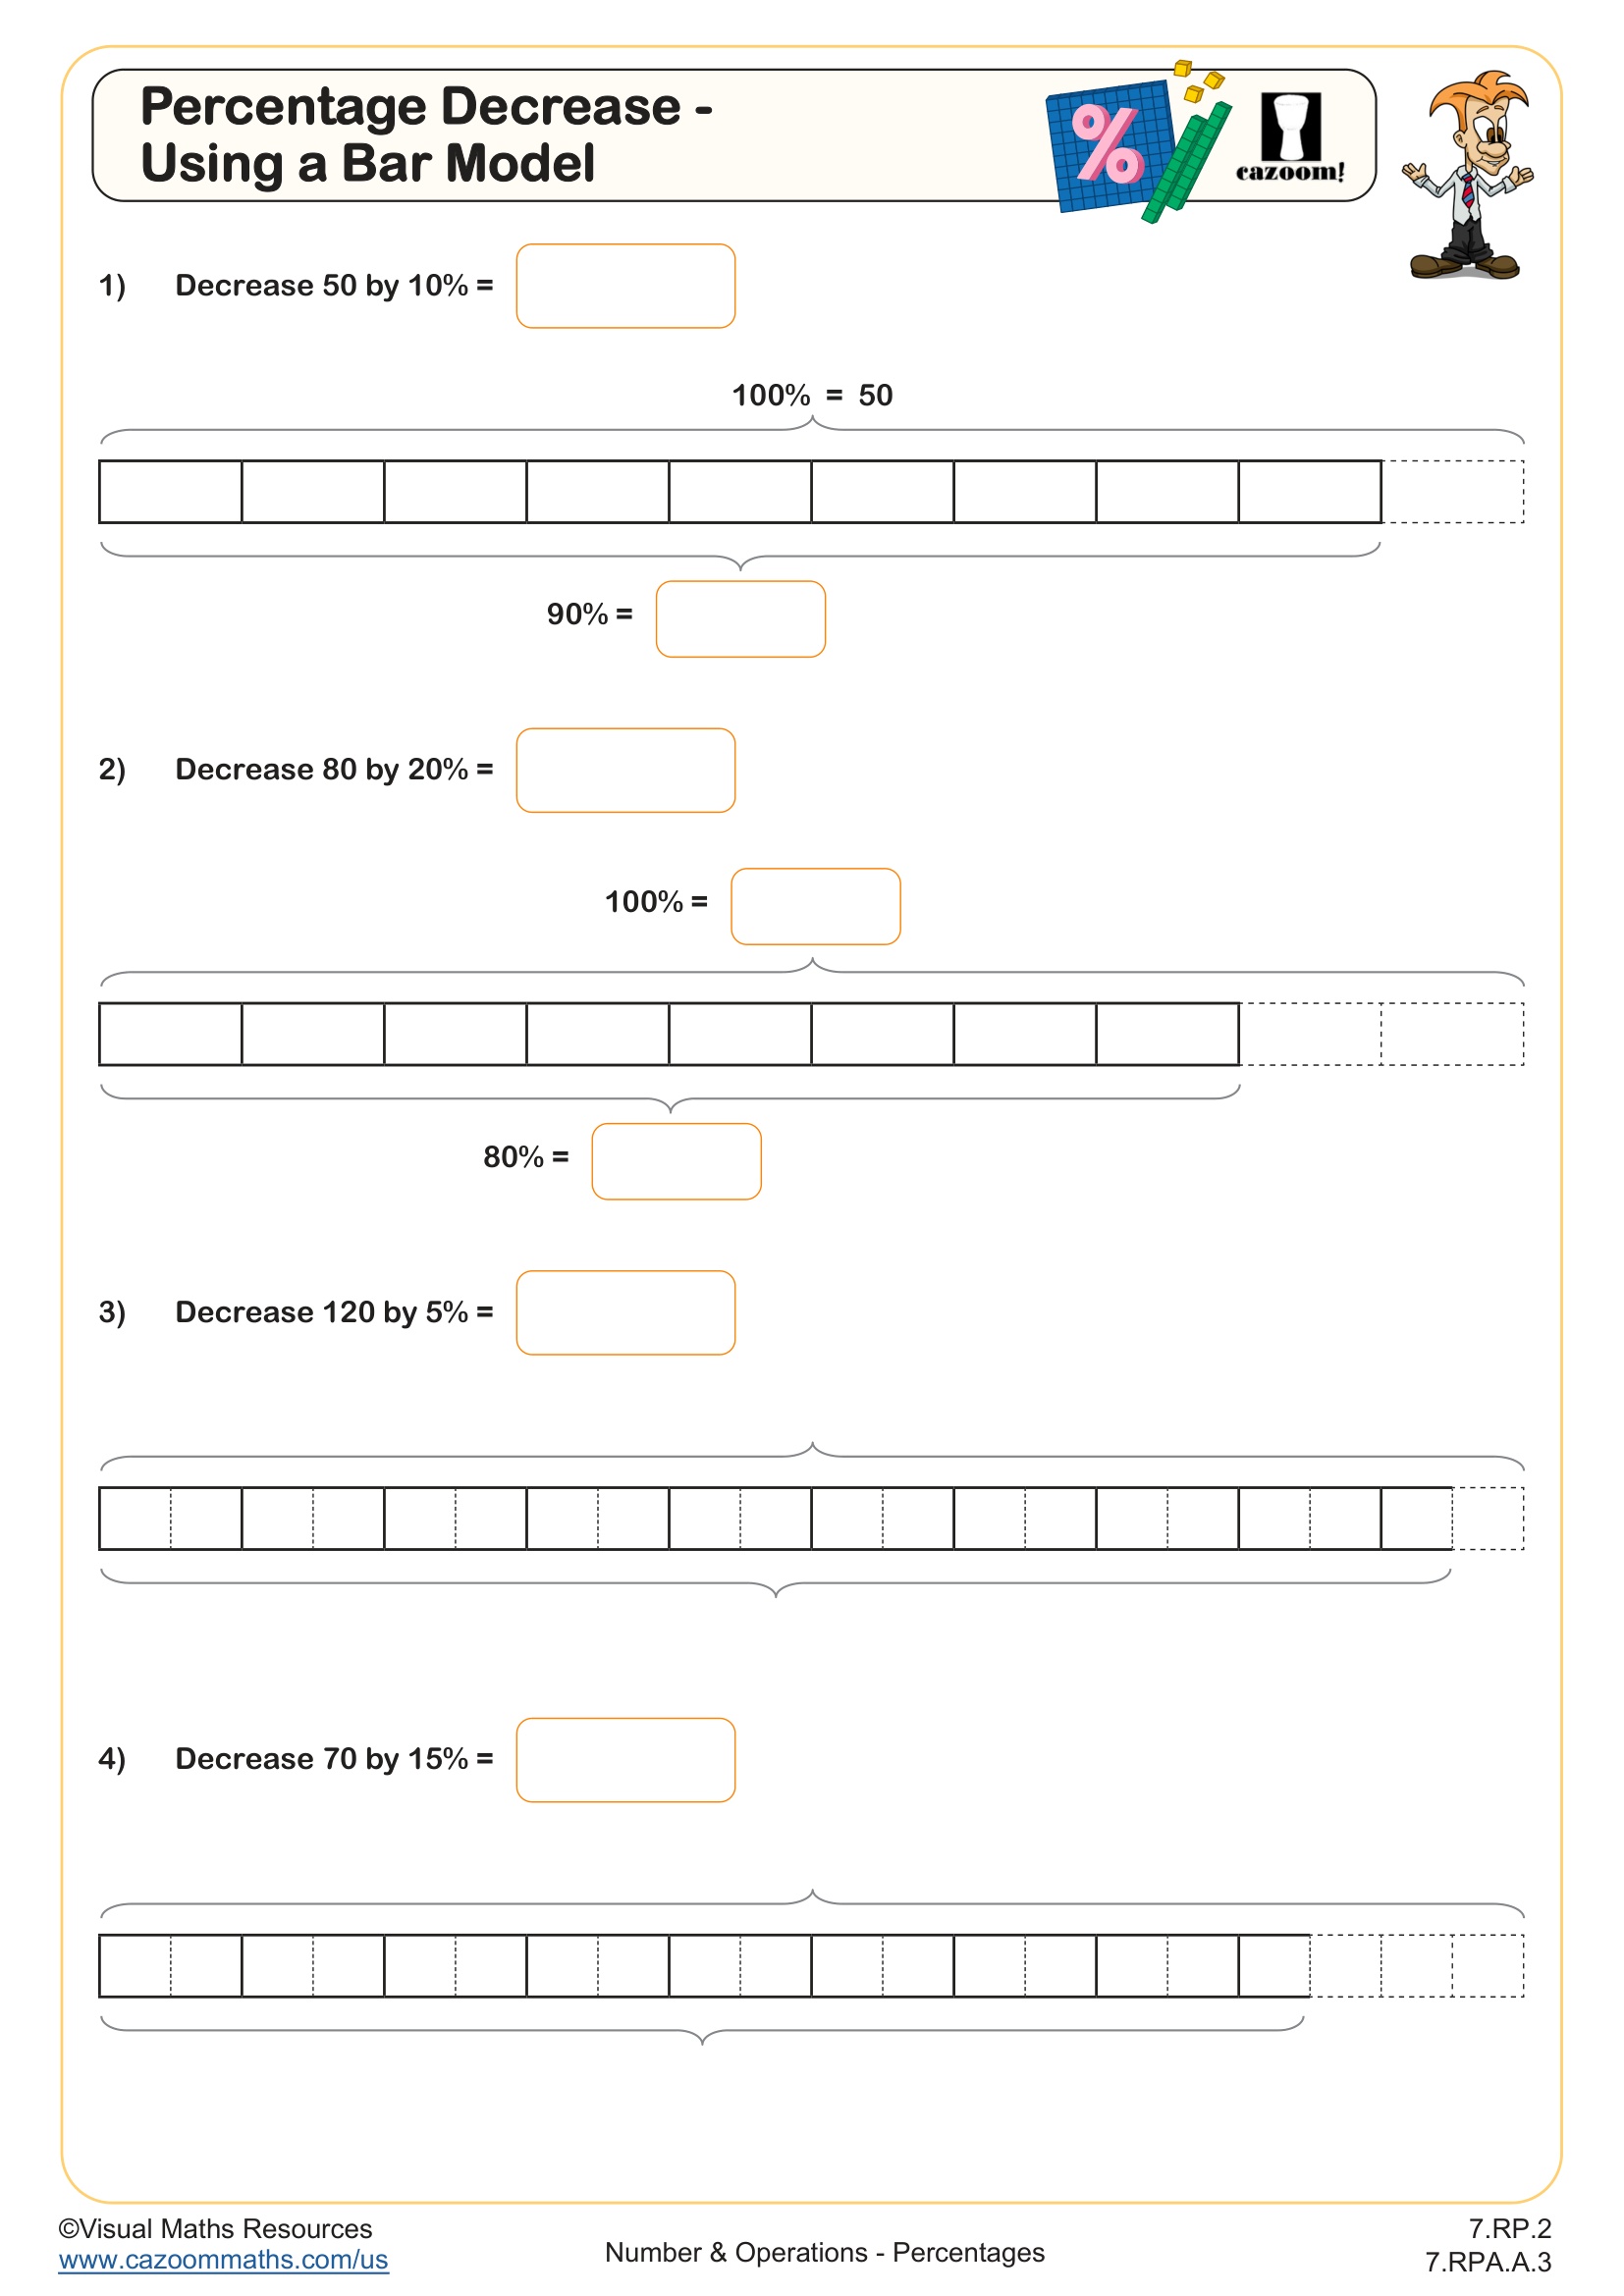
Percentage Decrease - Using a Bar Model
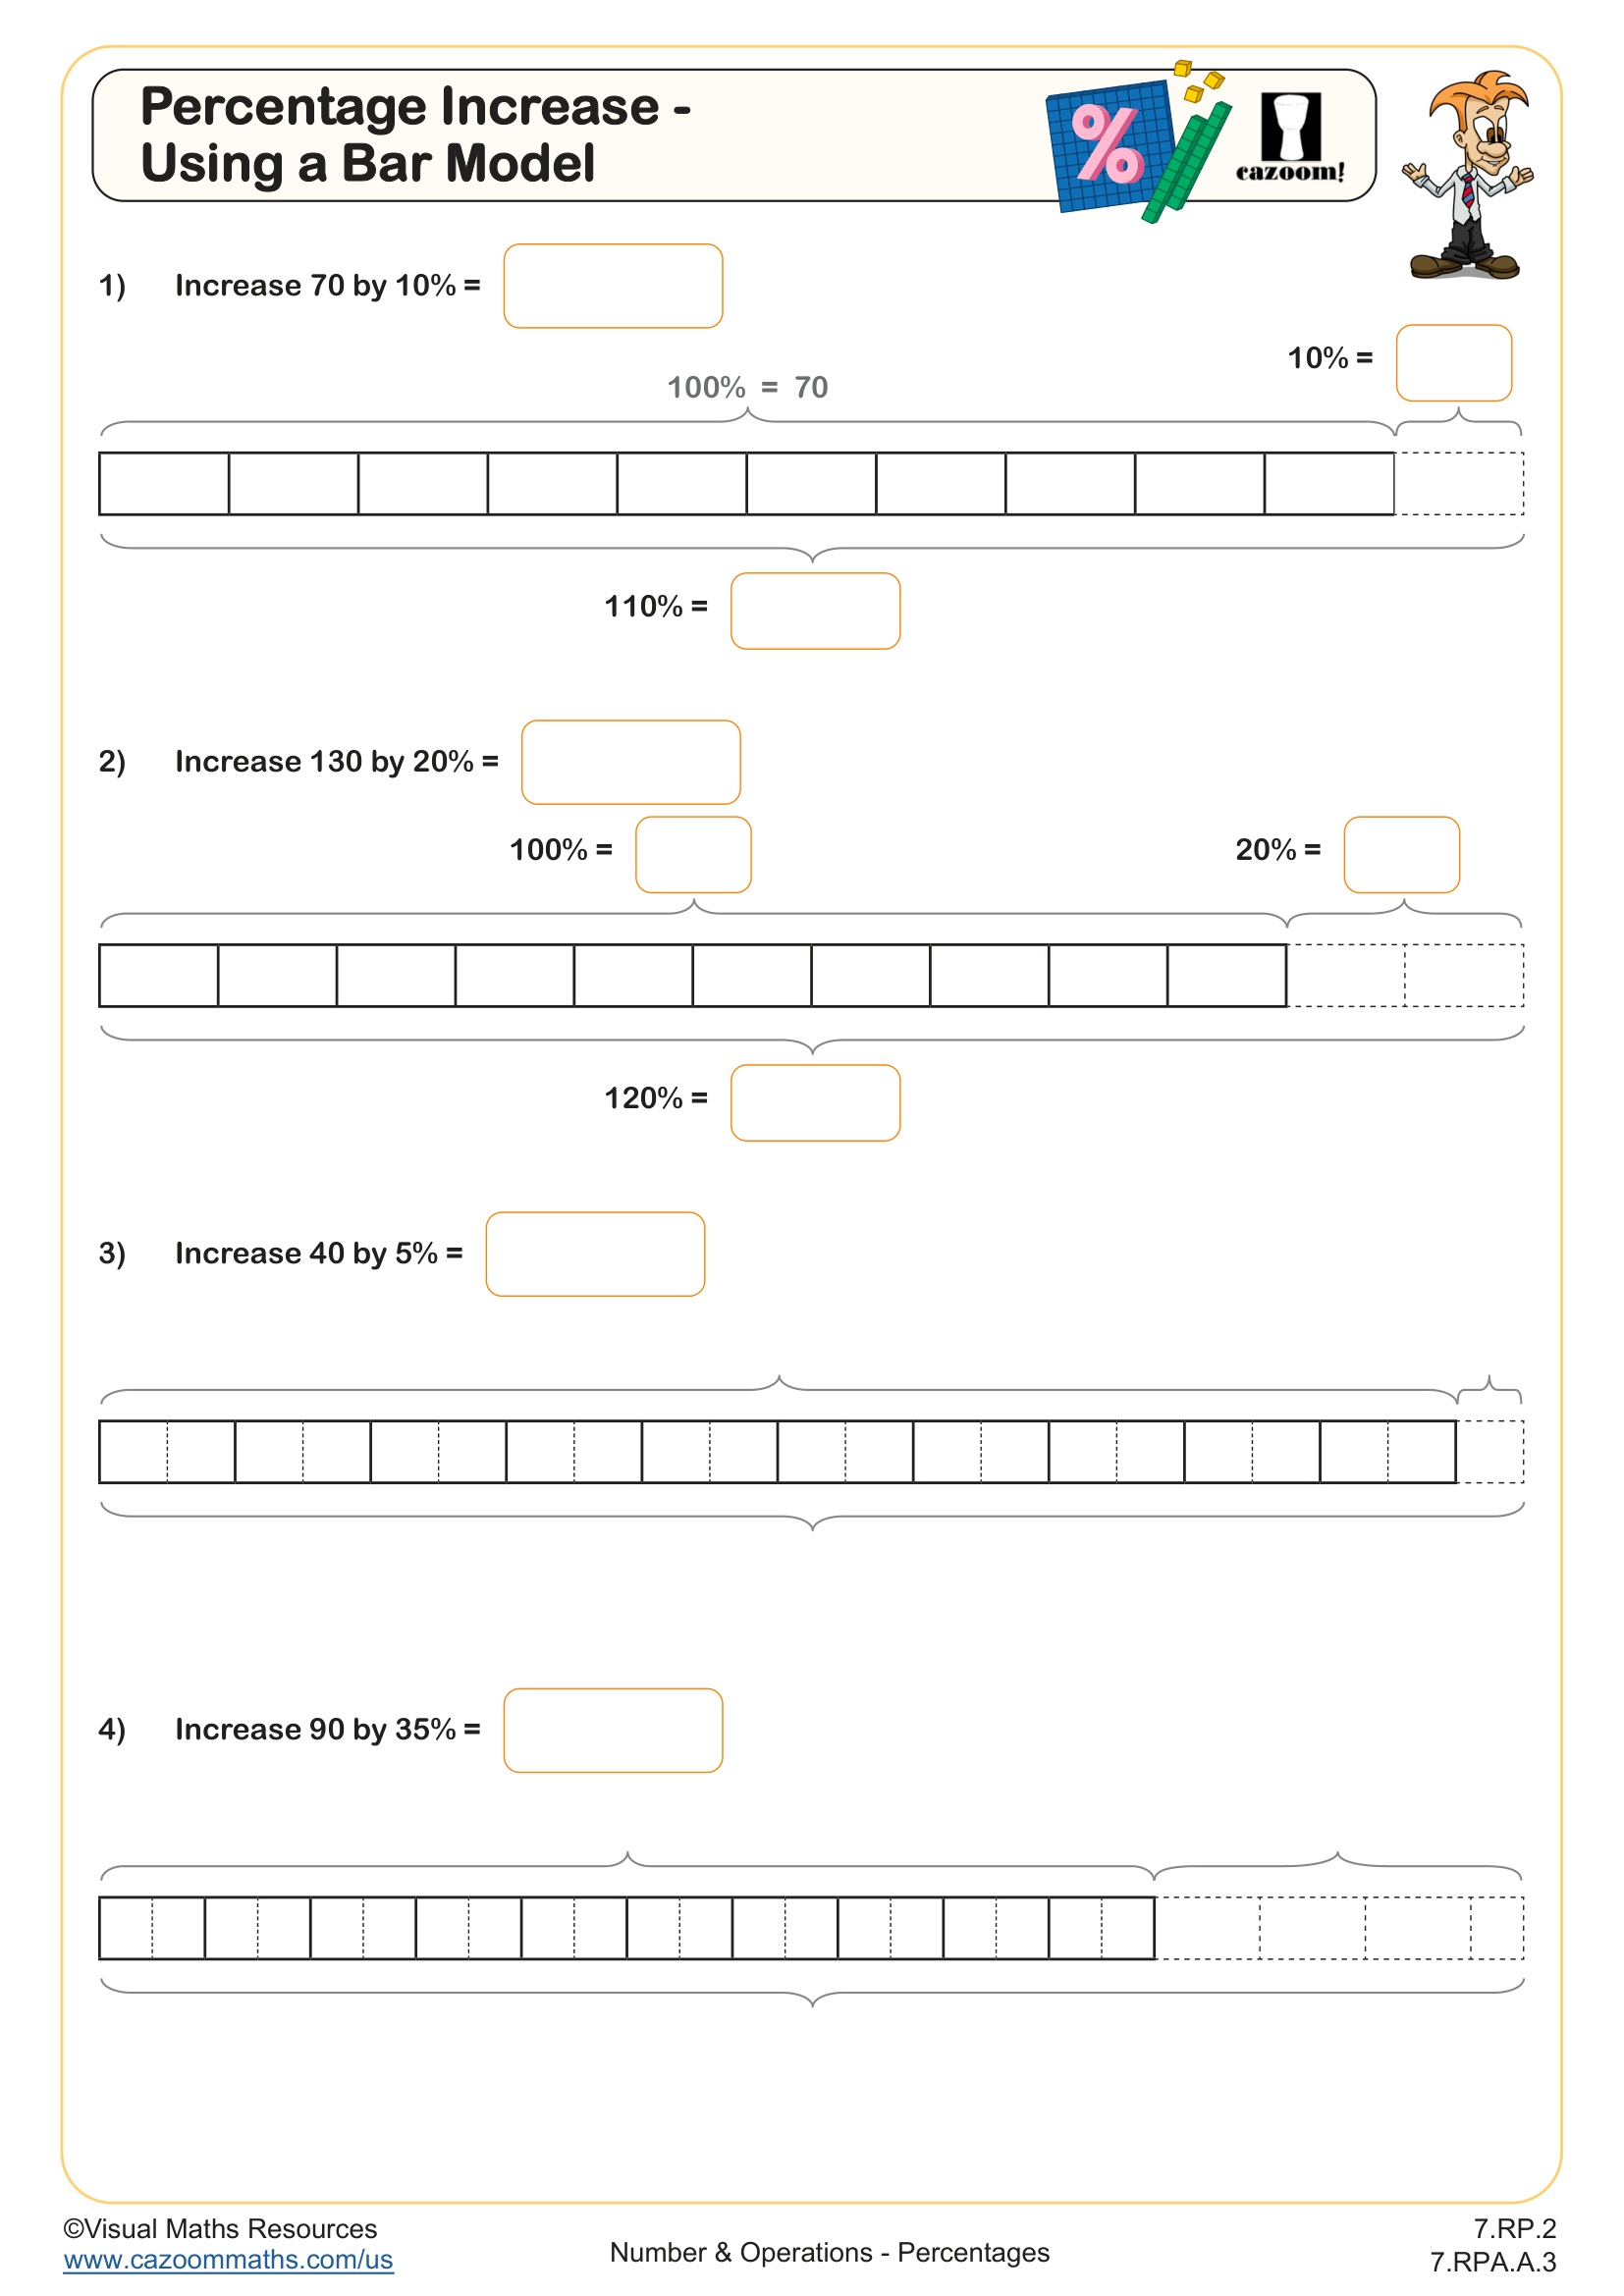
Percentage Increase - Using a Bar Model
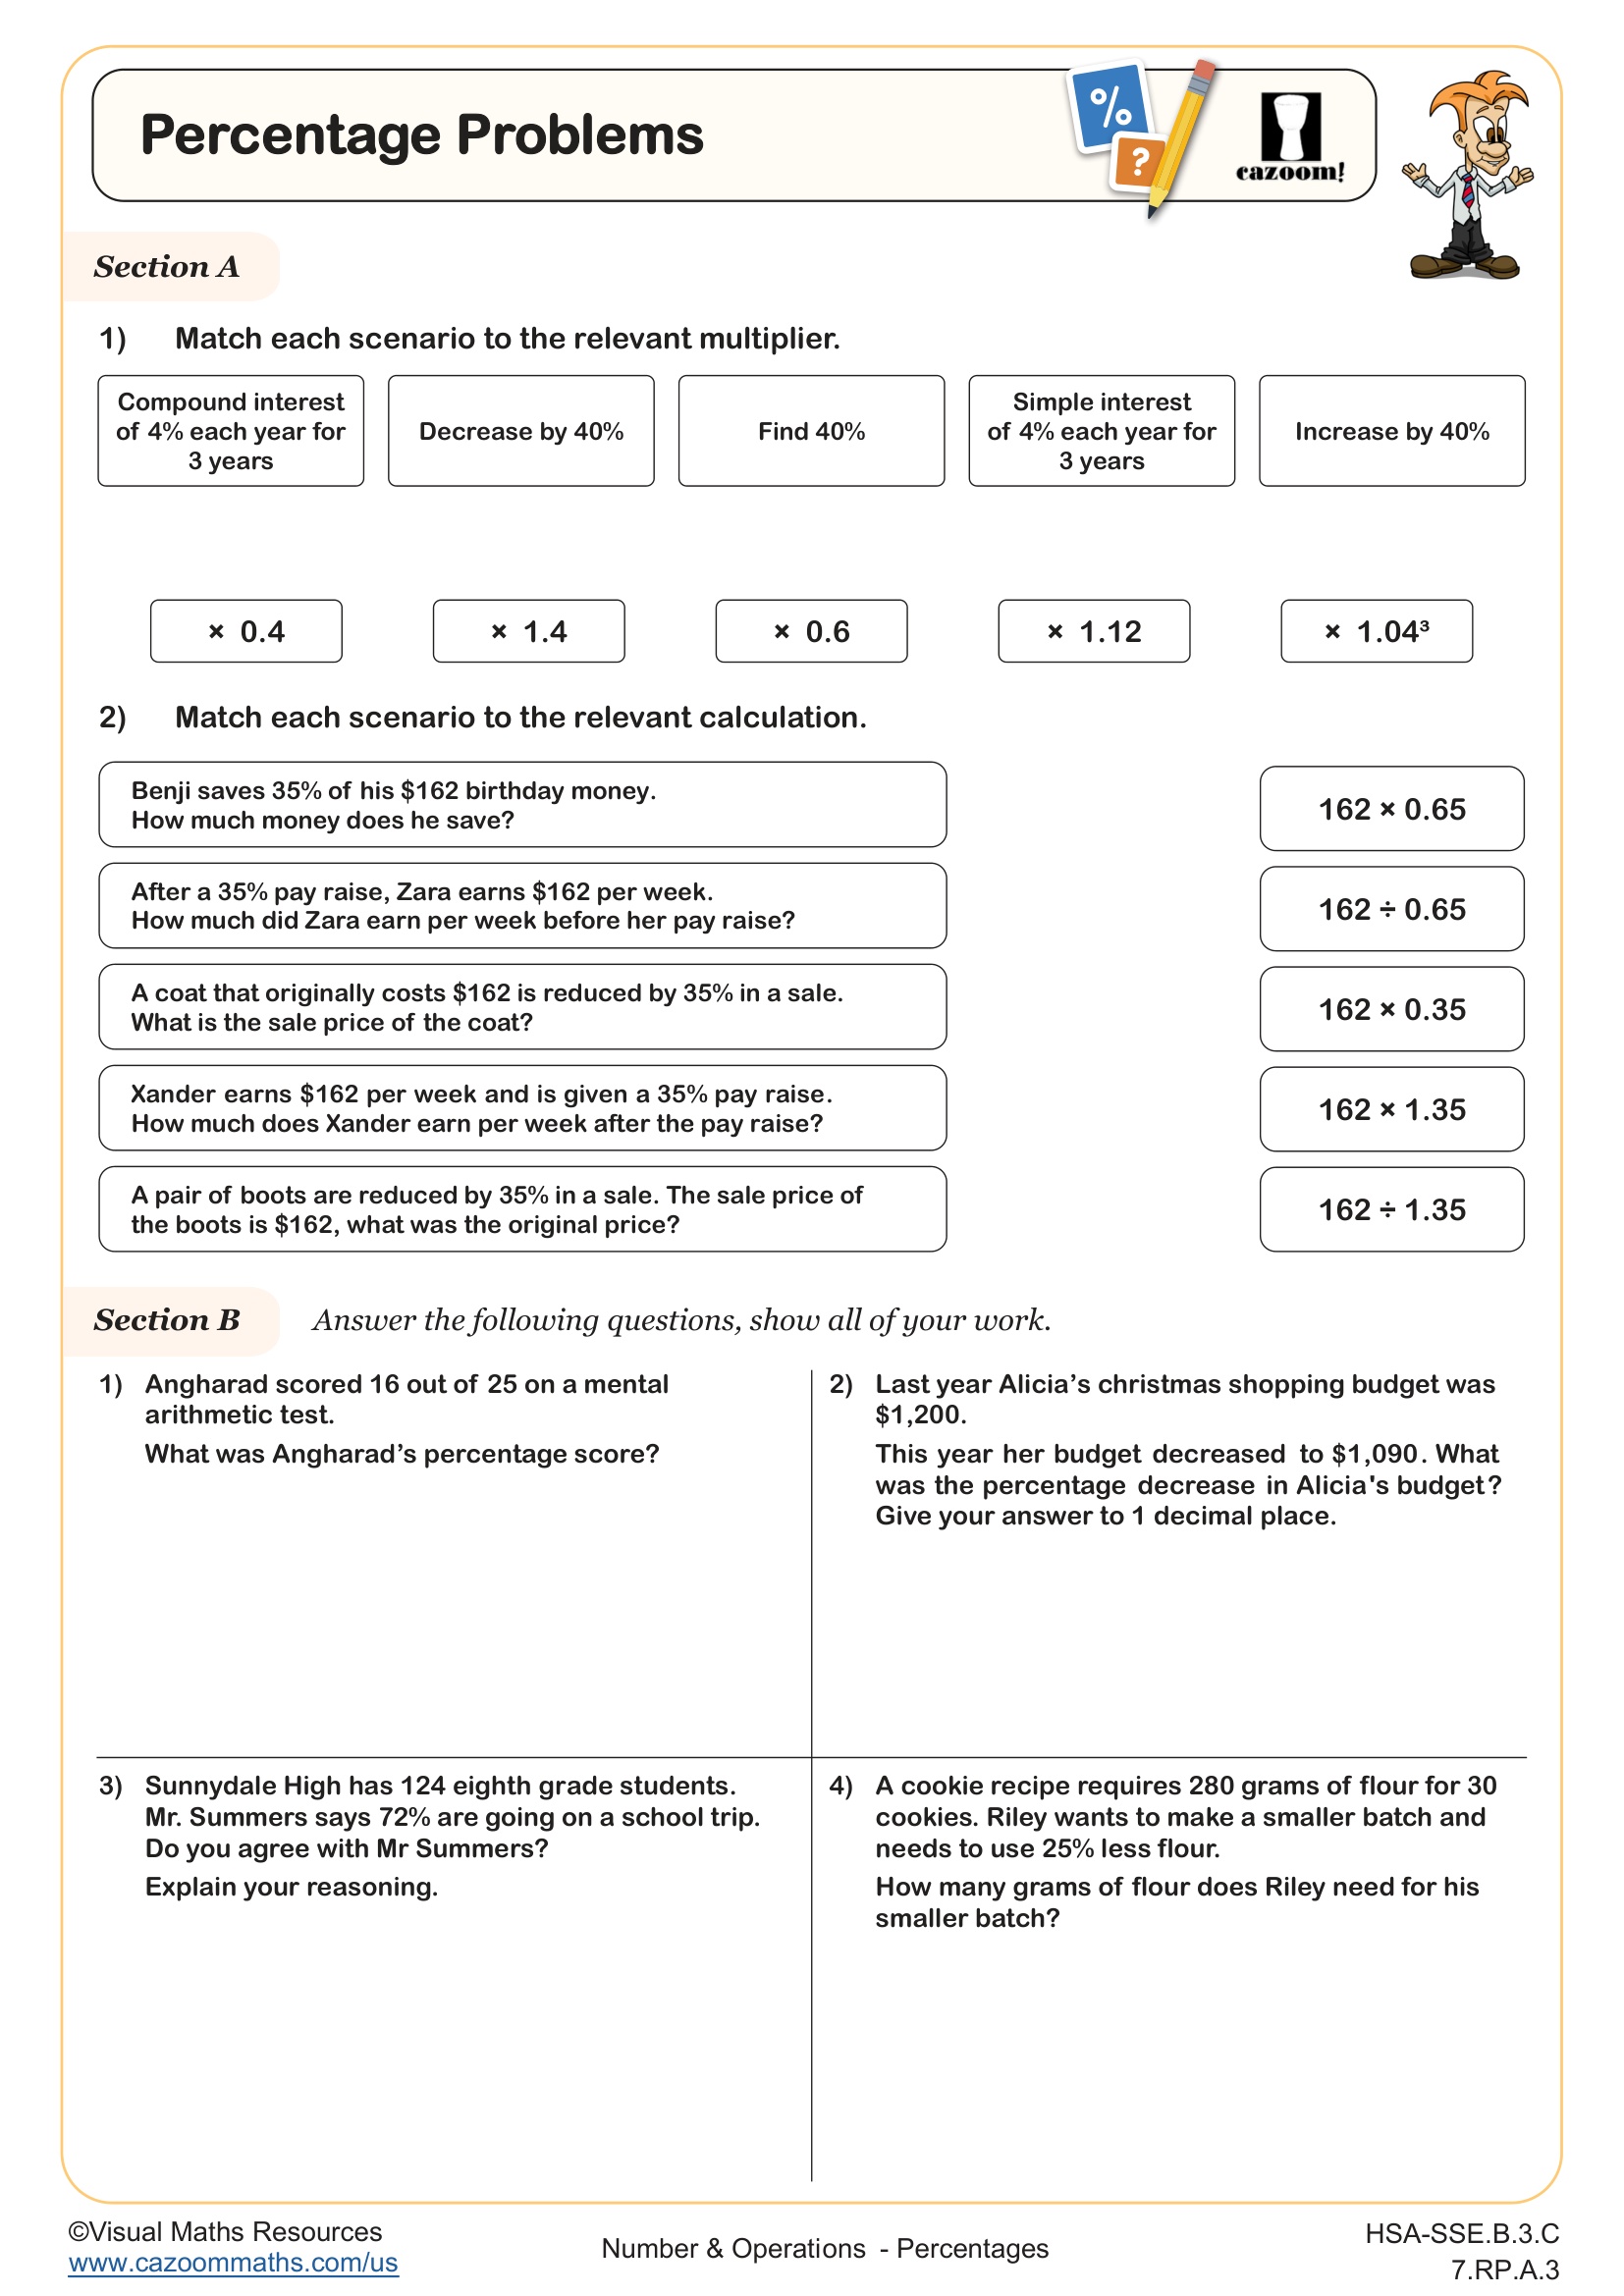
Percentage Problems
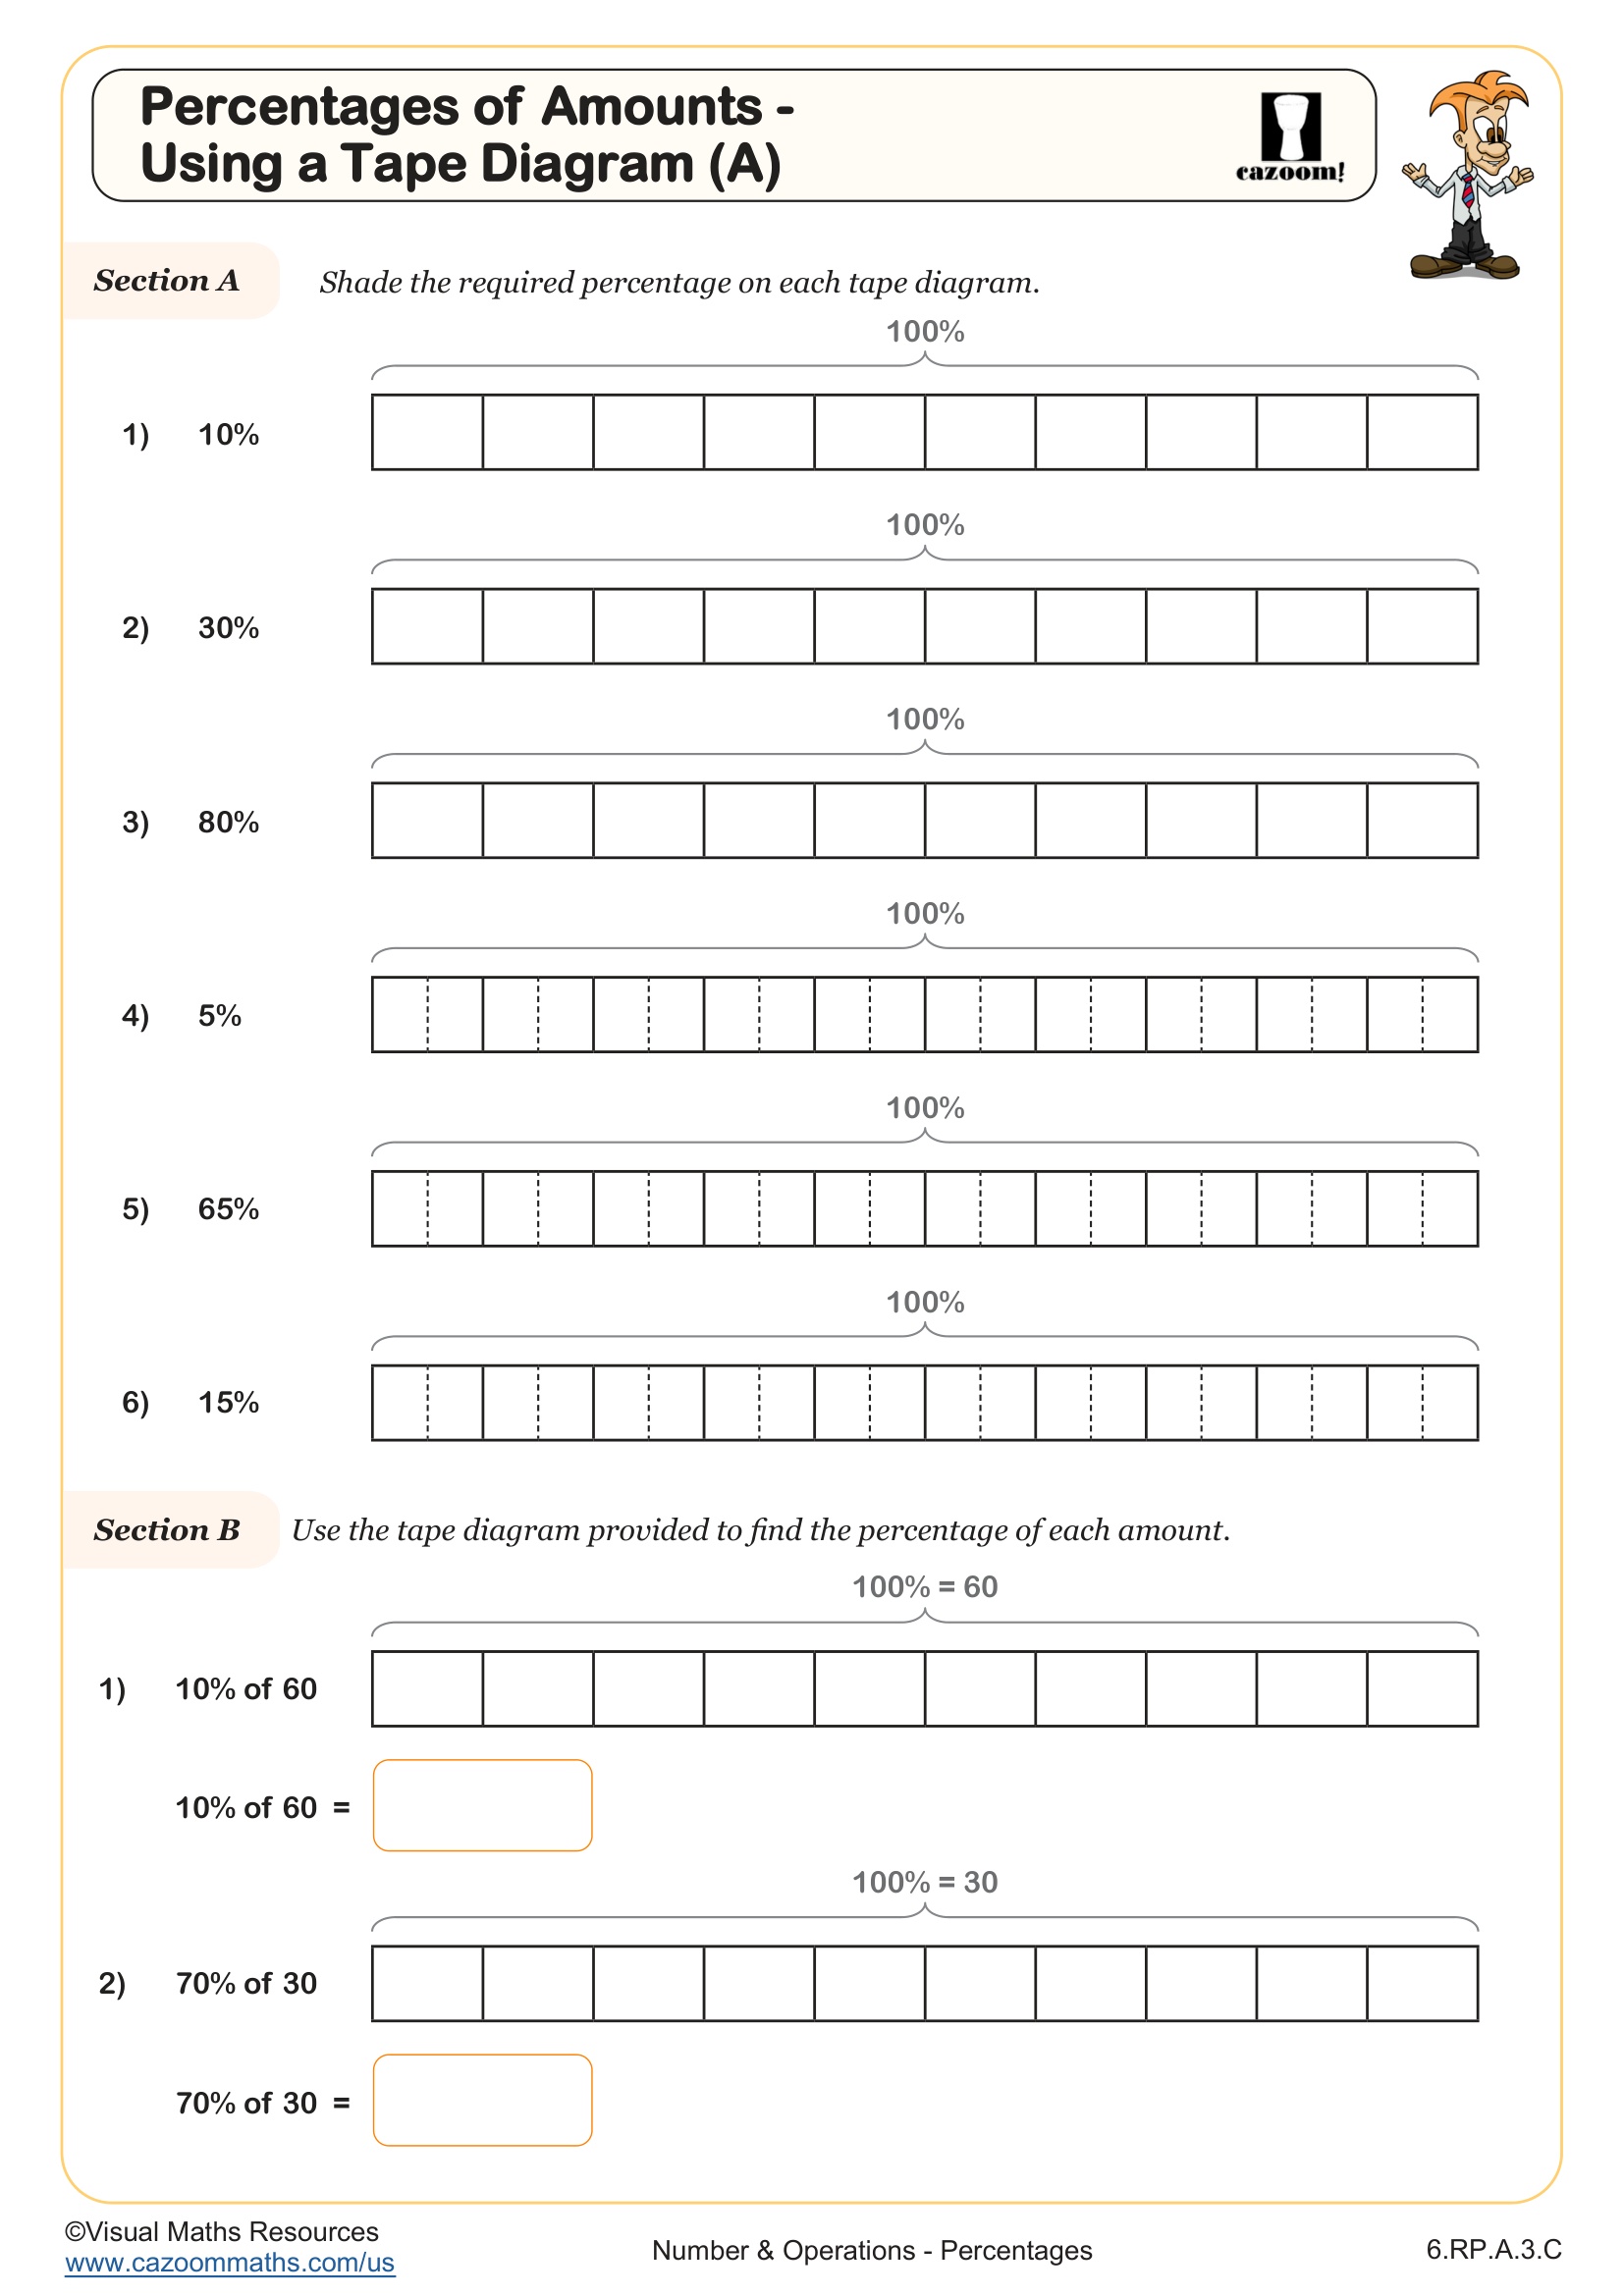
Percentages of Amounts - Using a Tape Diagram (A)
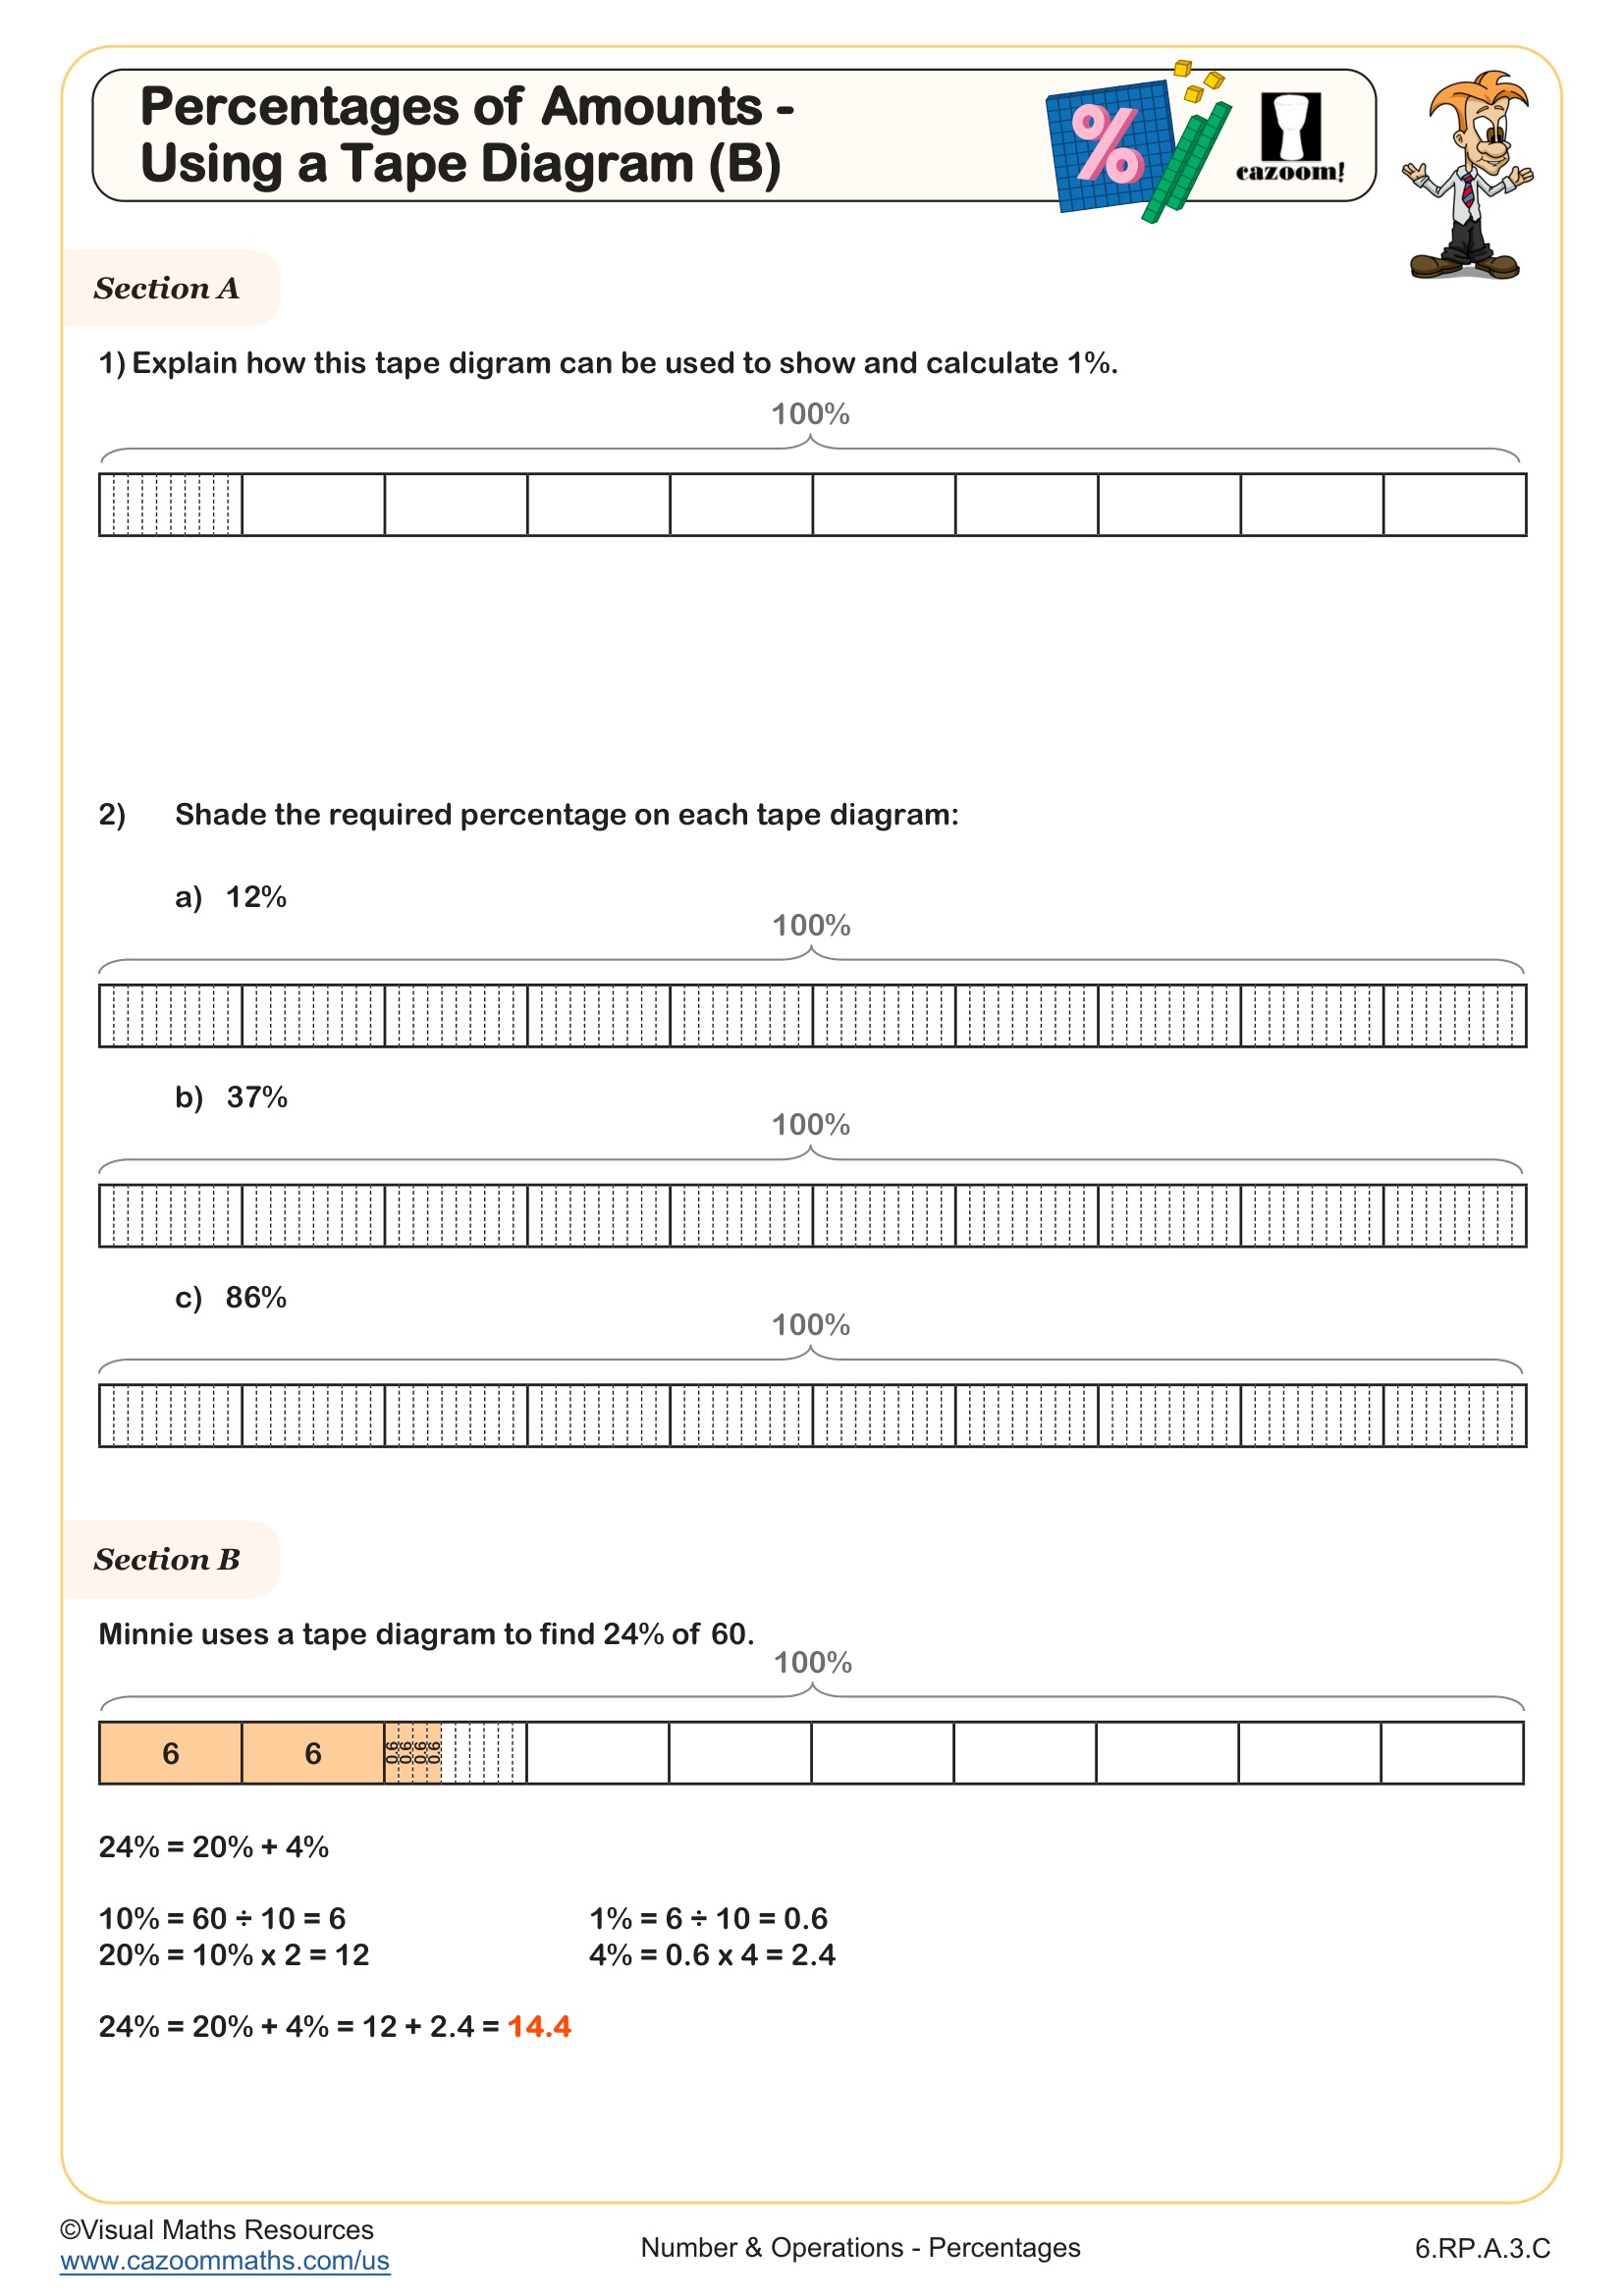
Percentages of Amounts - Using a Tape Diagram (B)
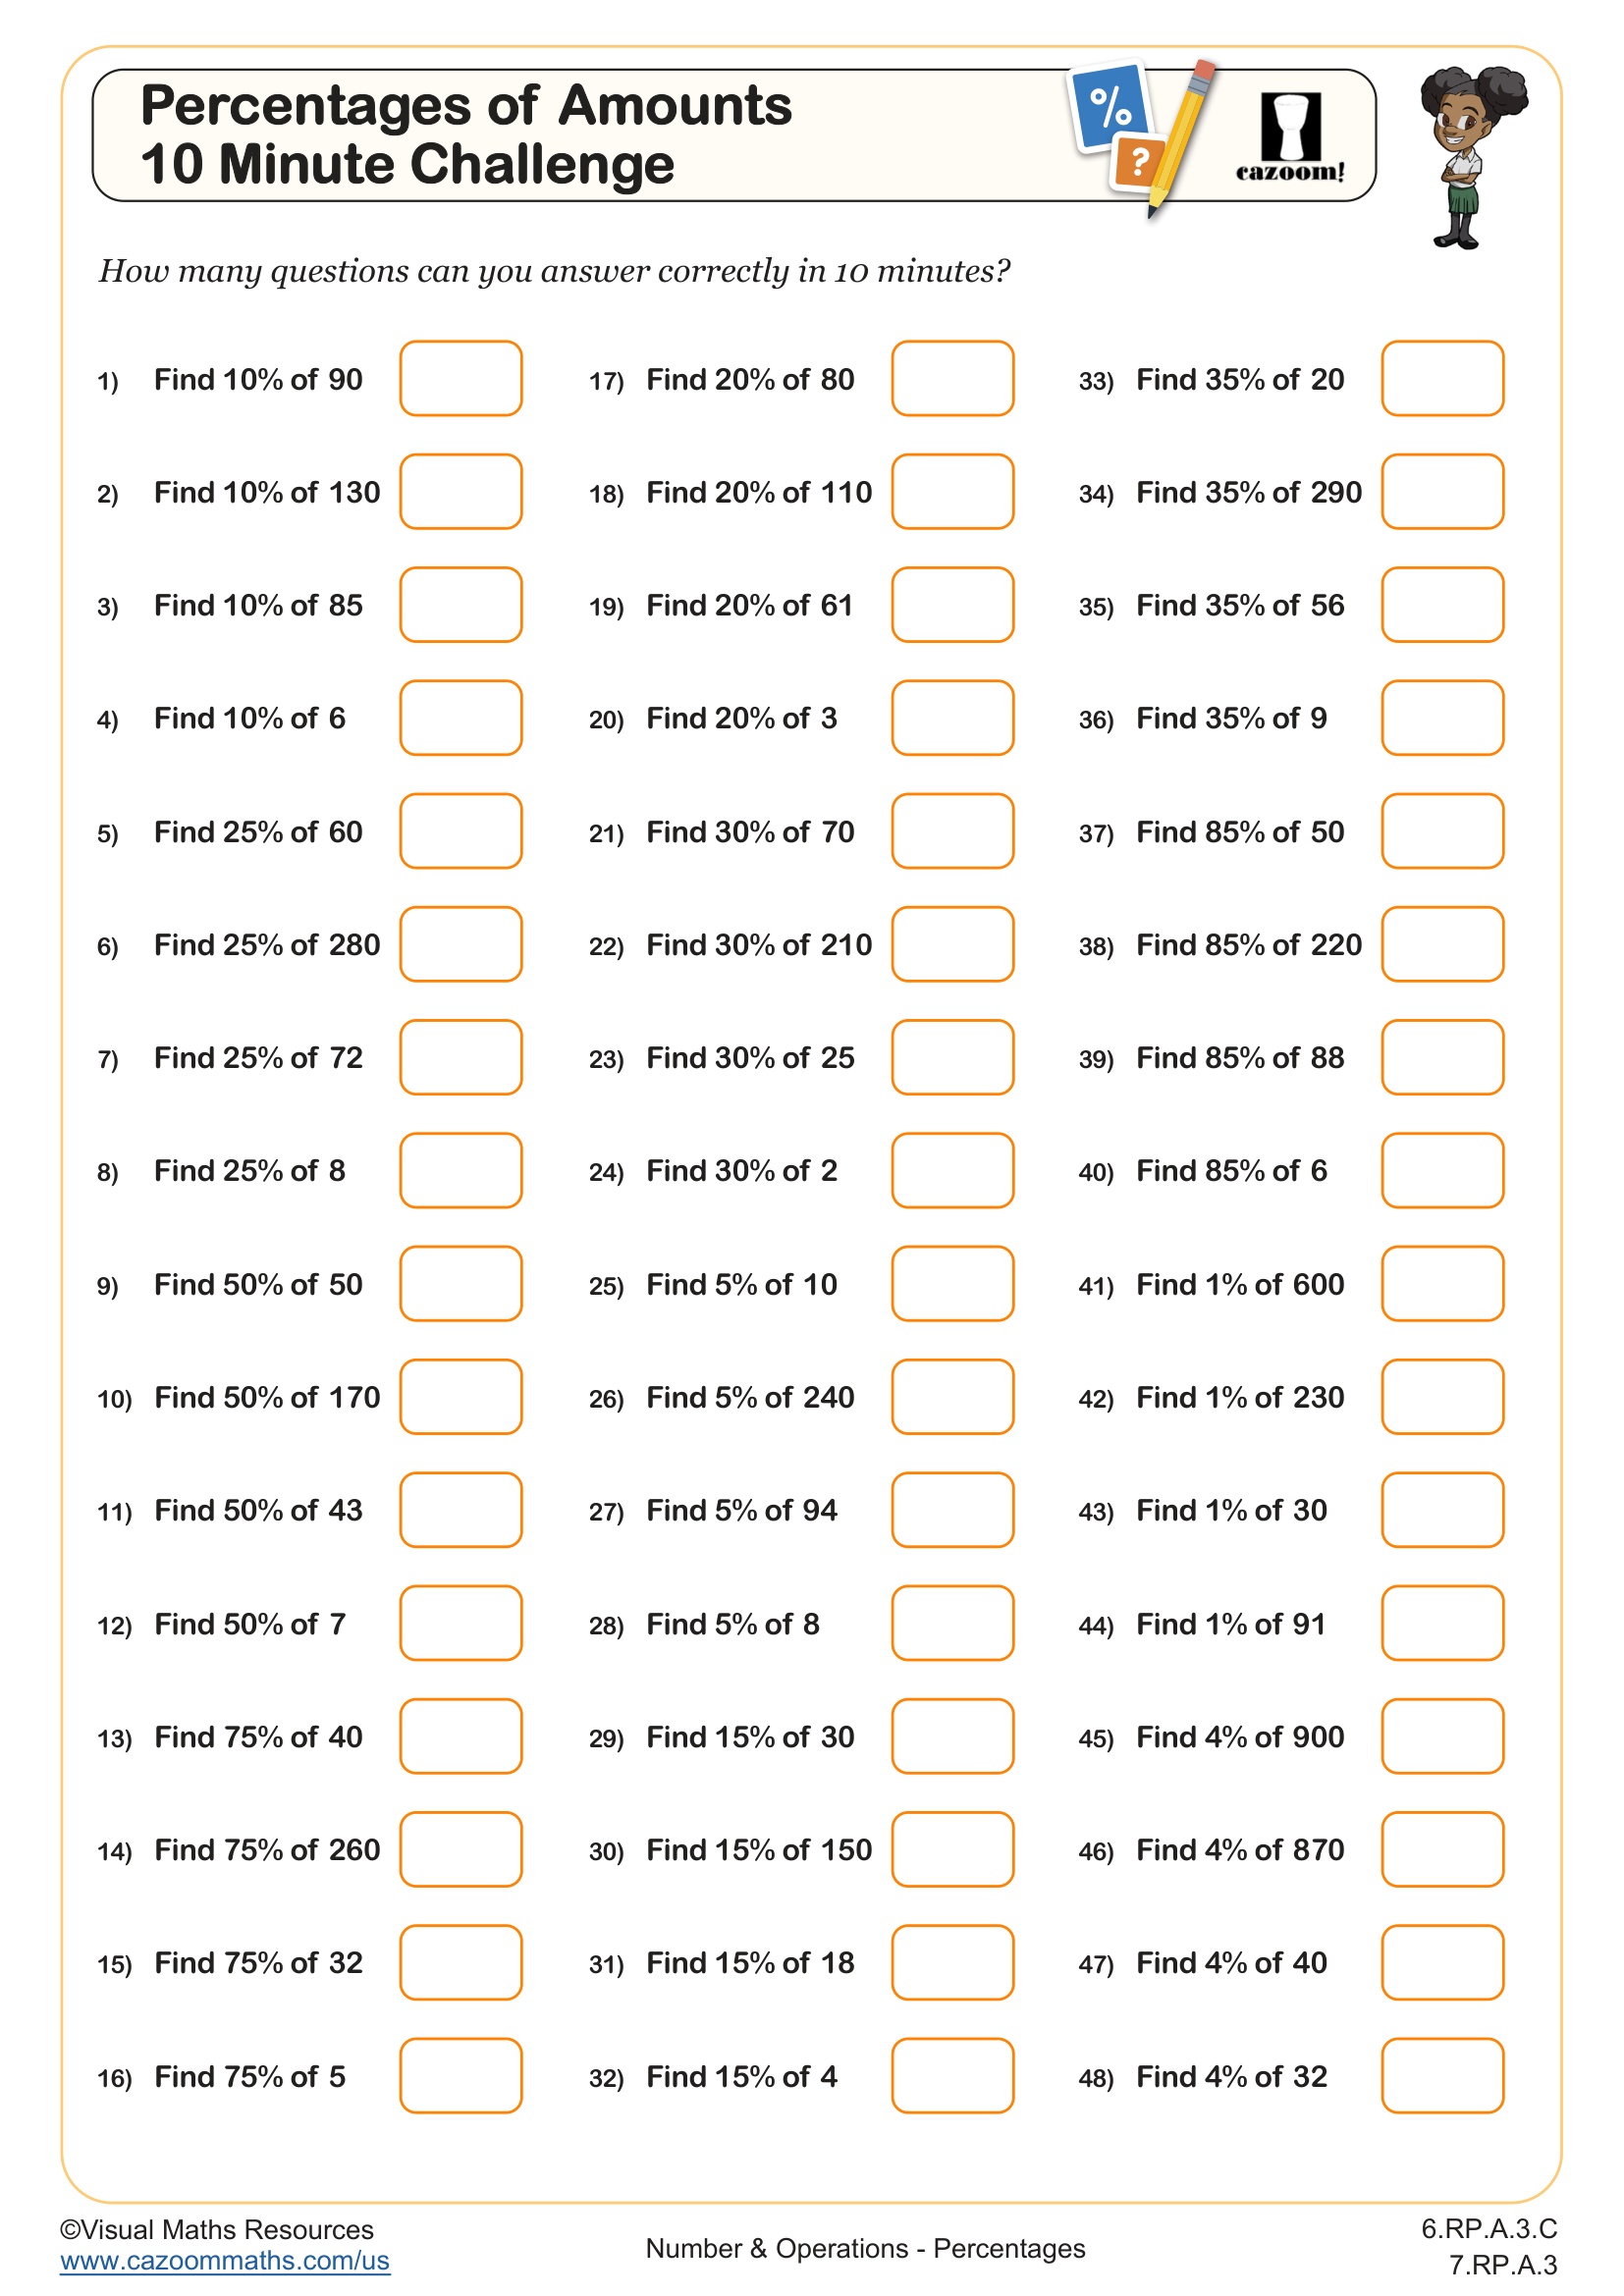
Percentages of Amounts 10 Minute Challenge
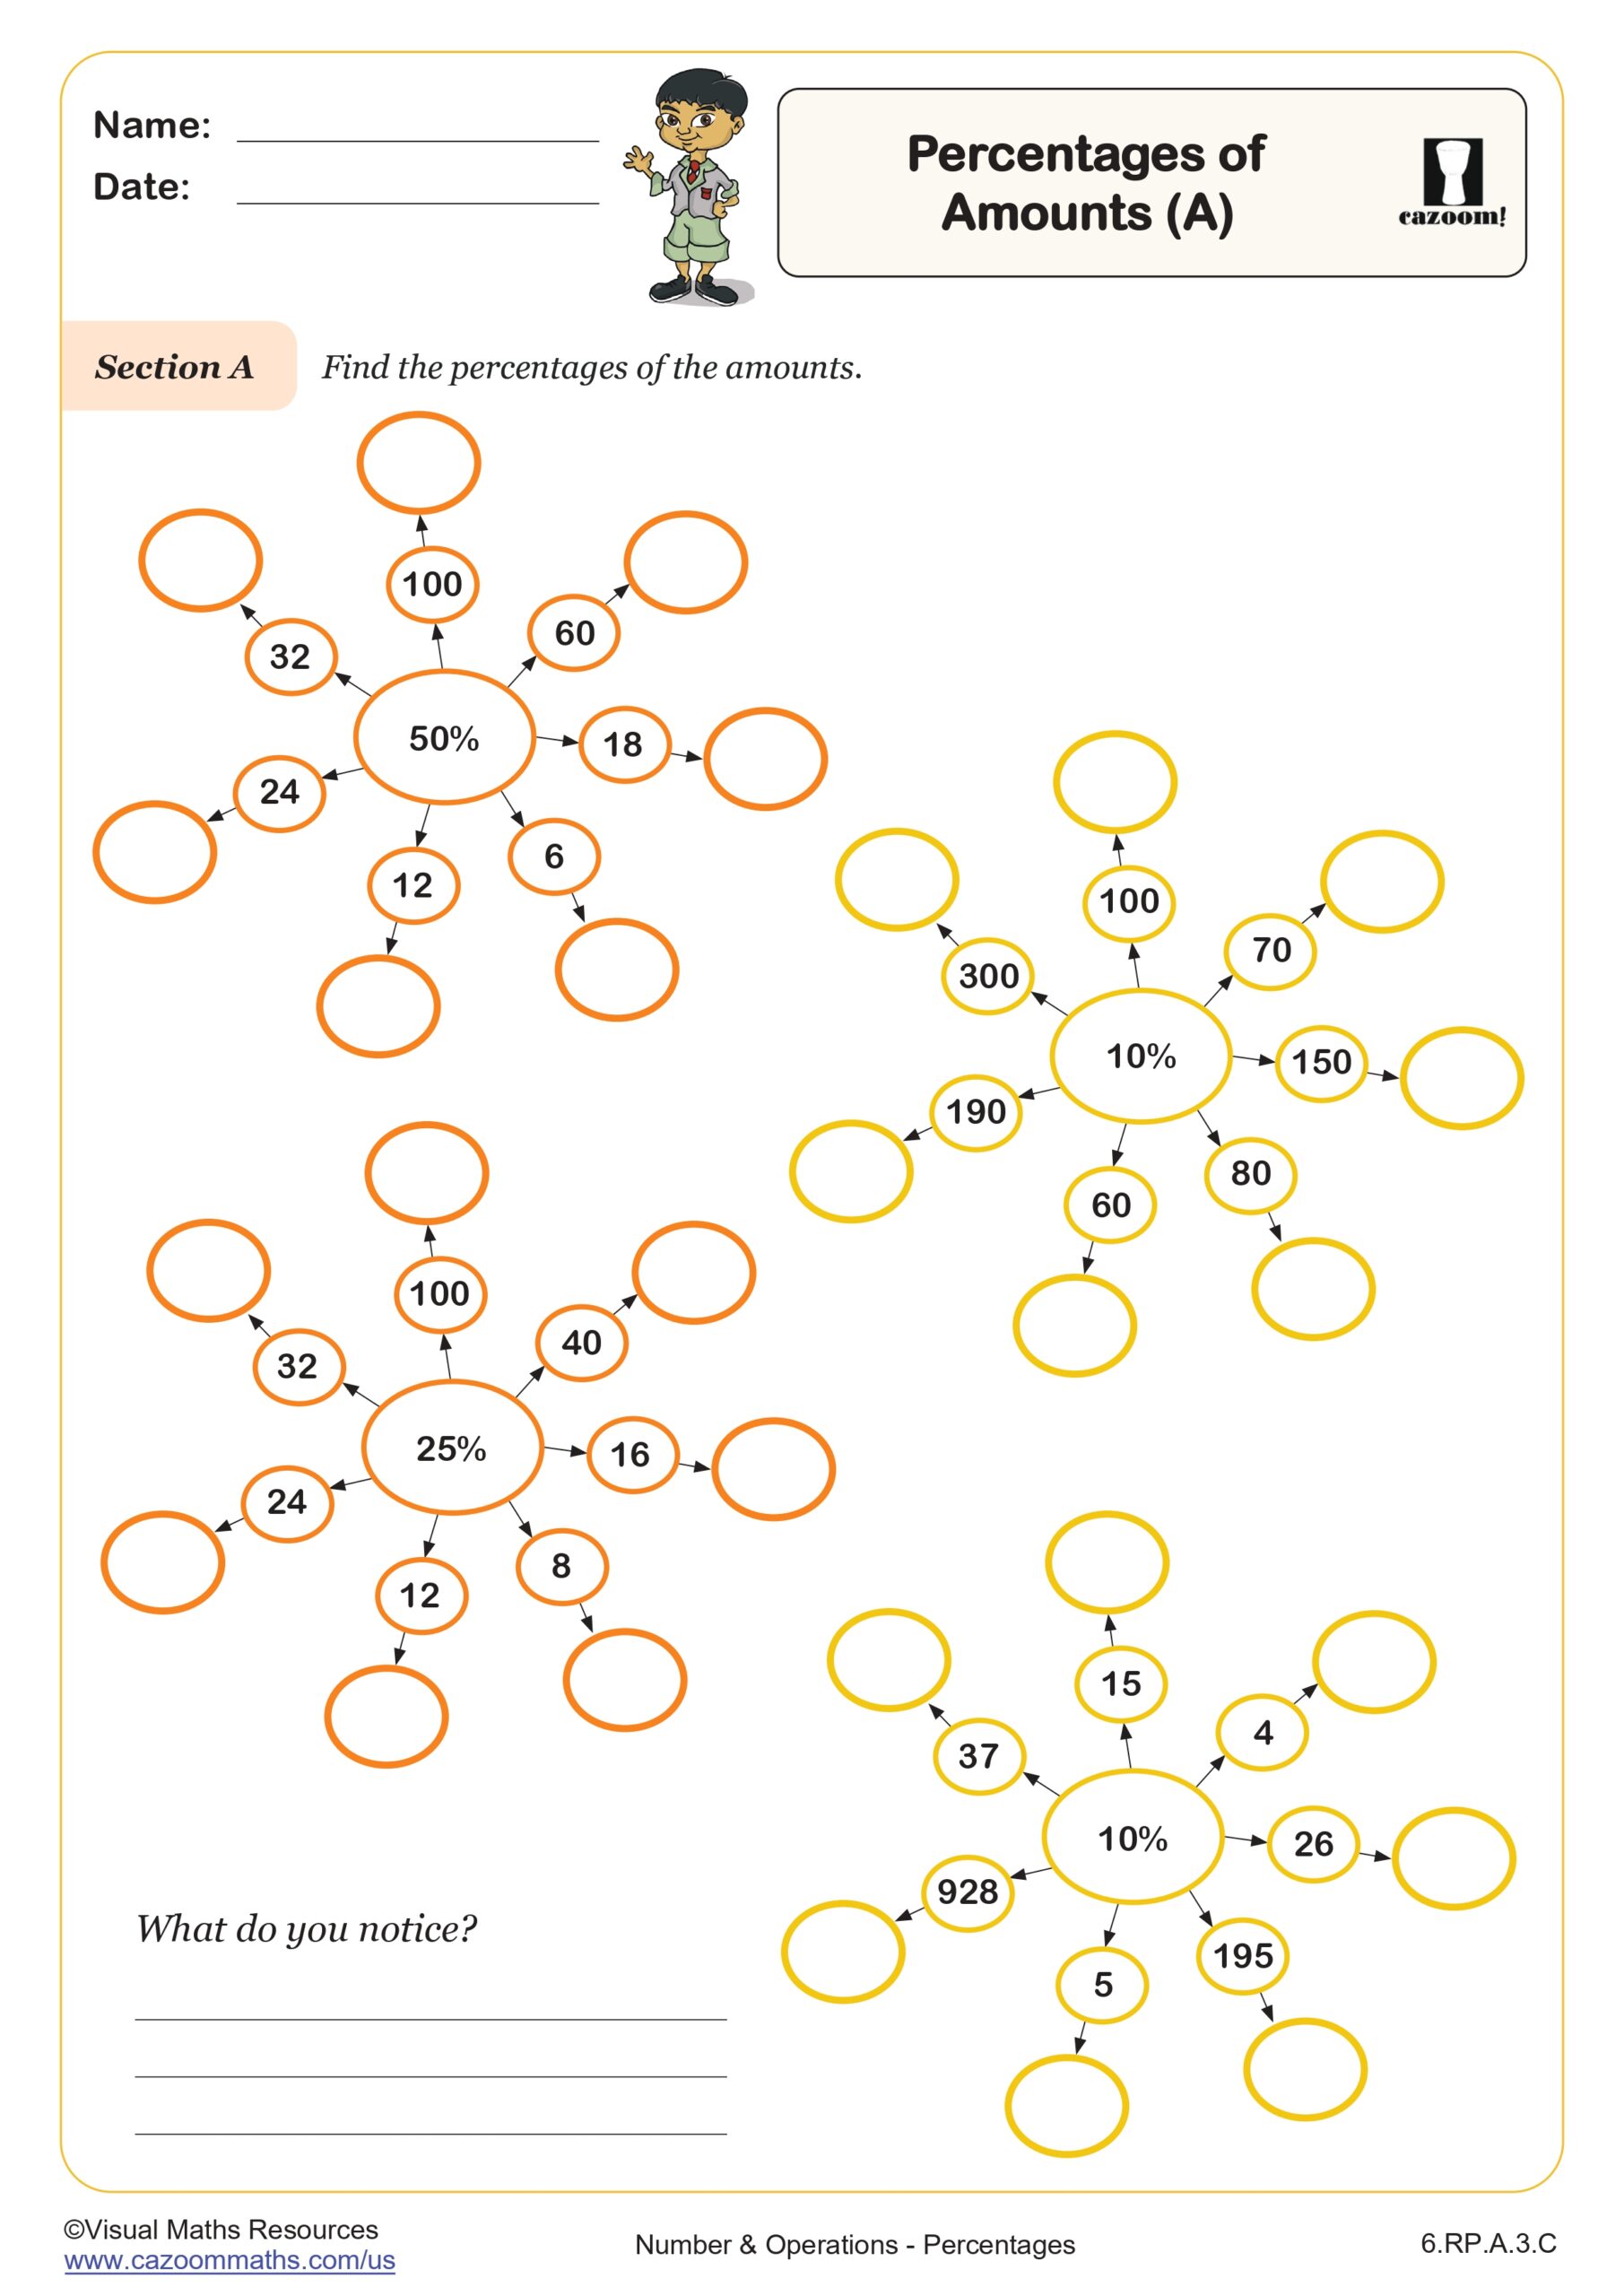
Percents of an Amount (A)
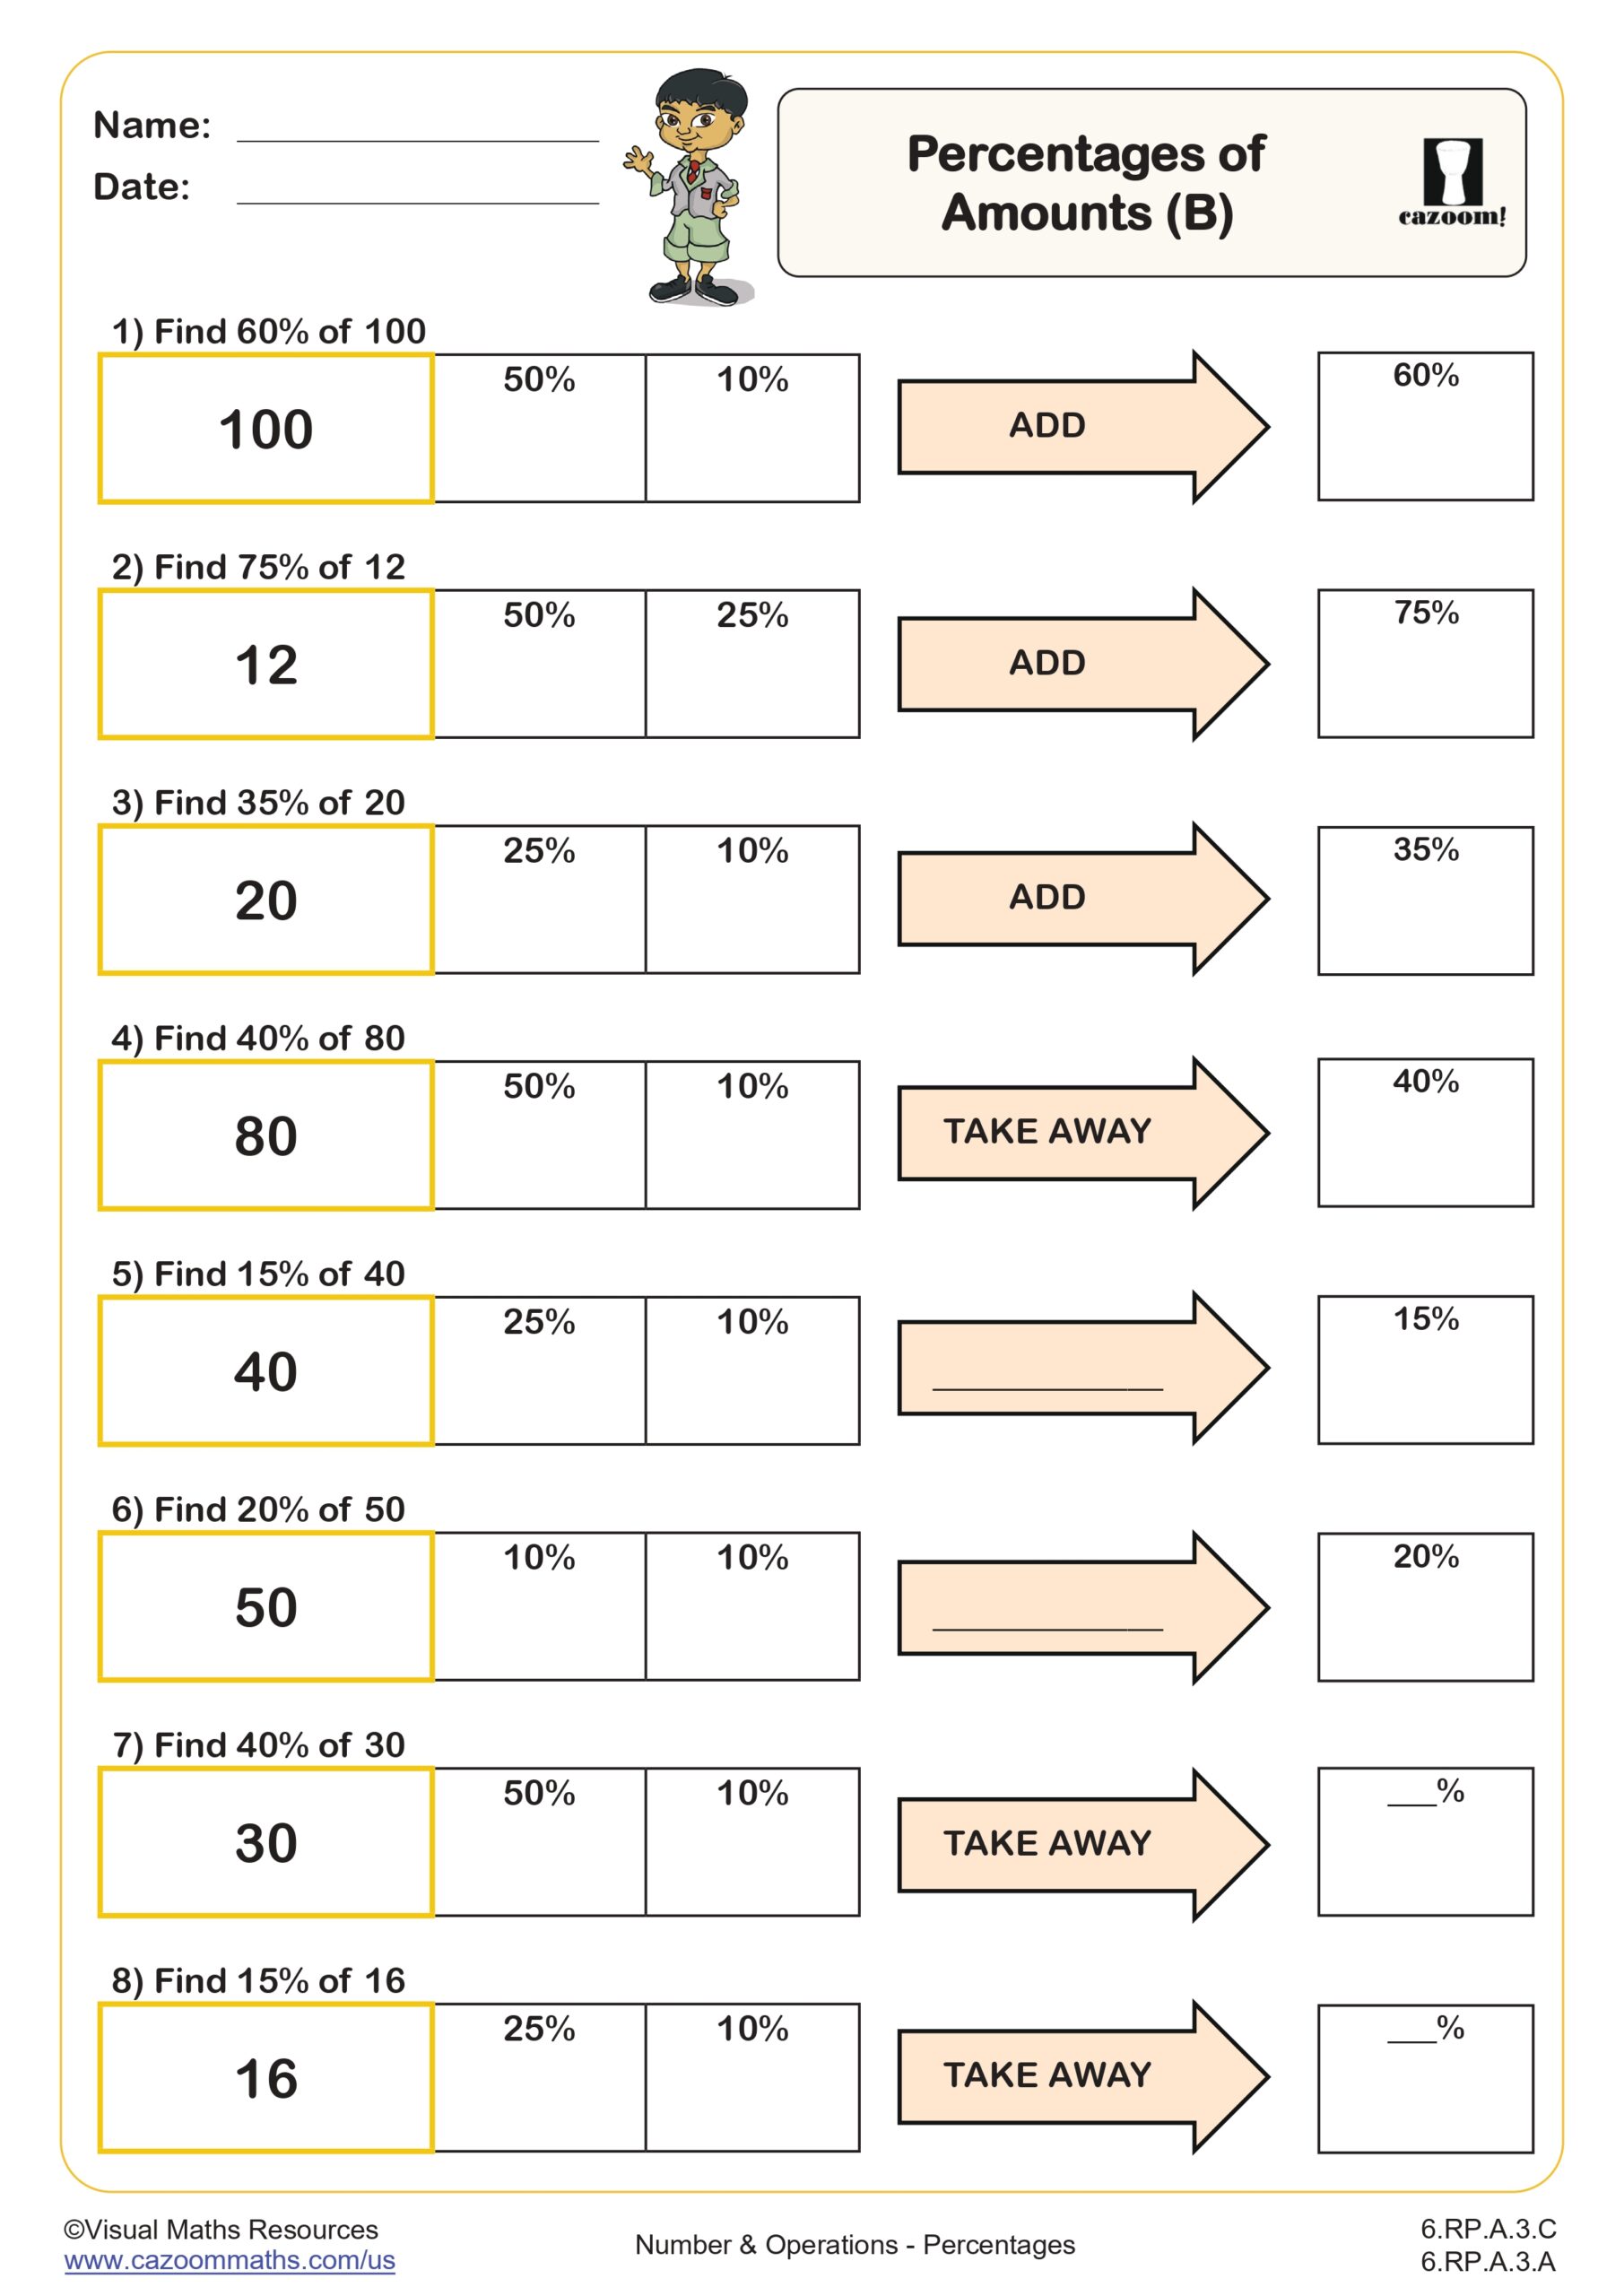
Percents of an Amount (B)
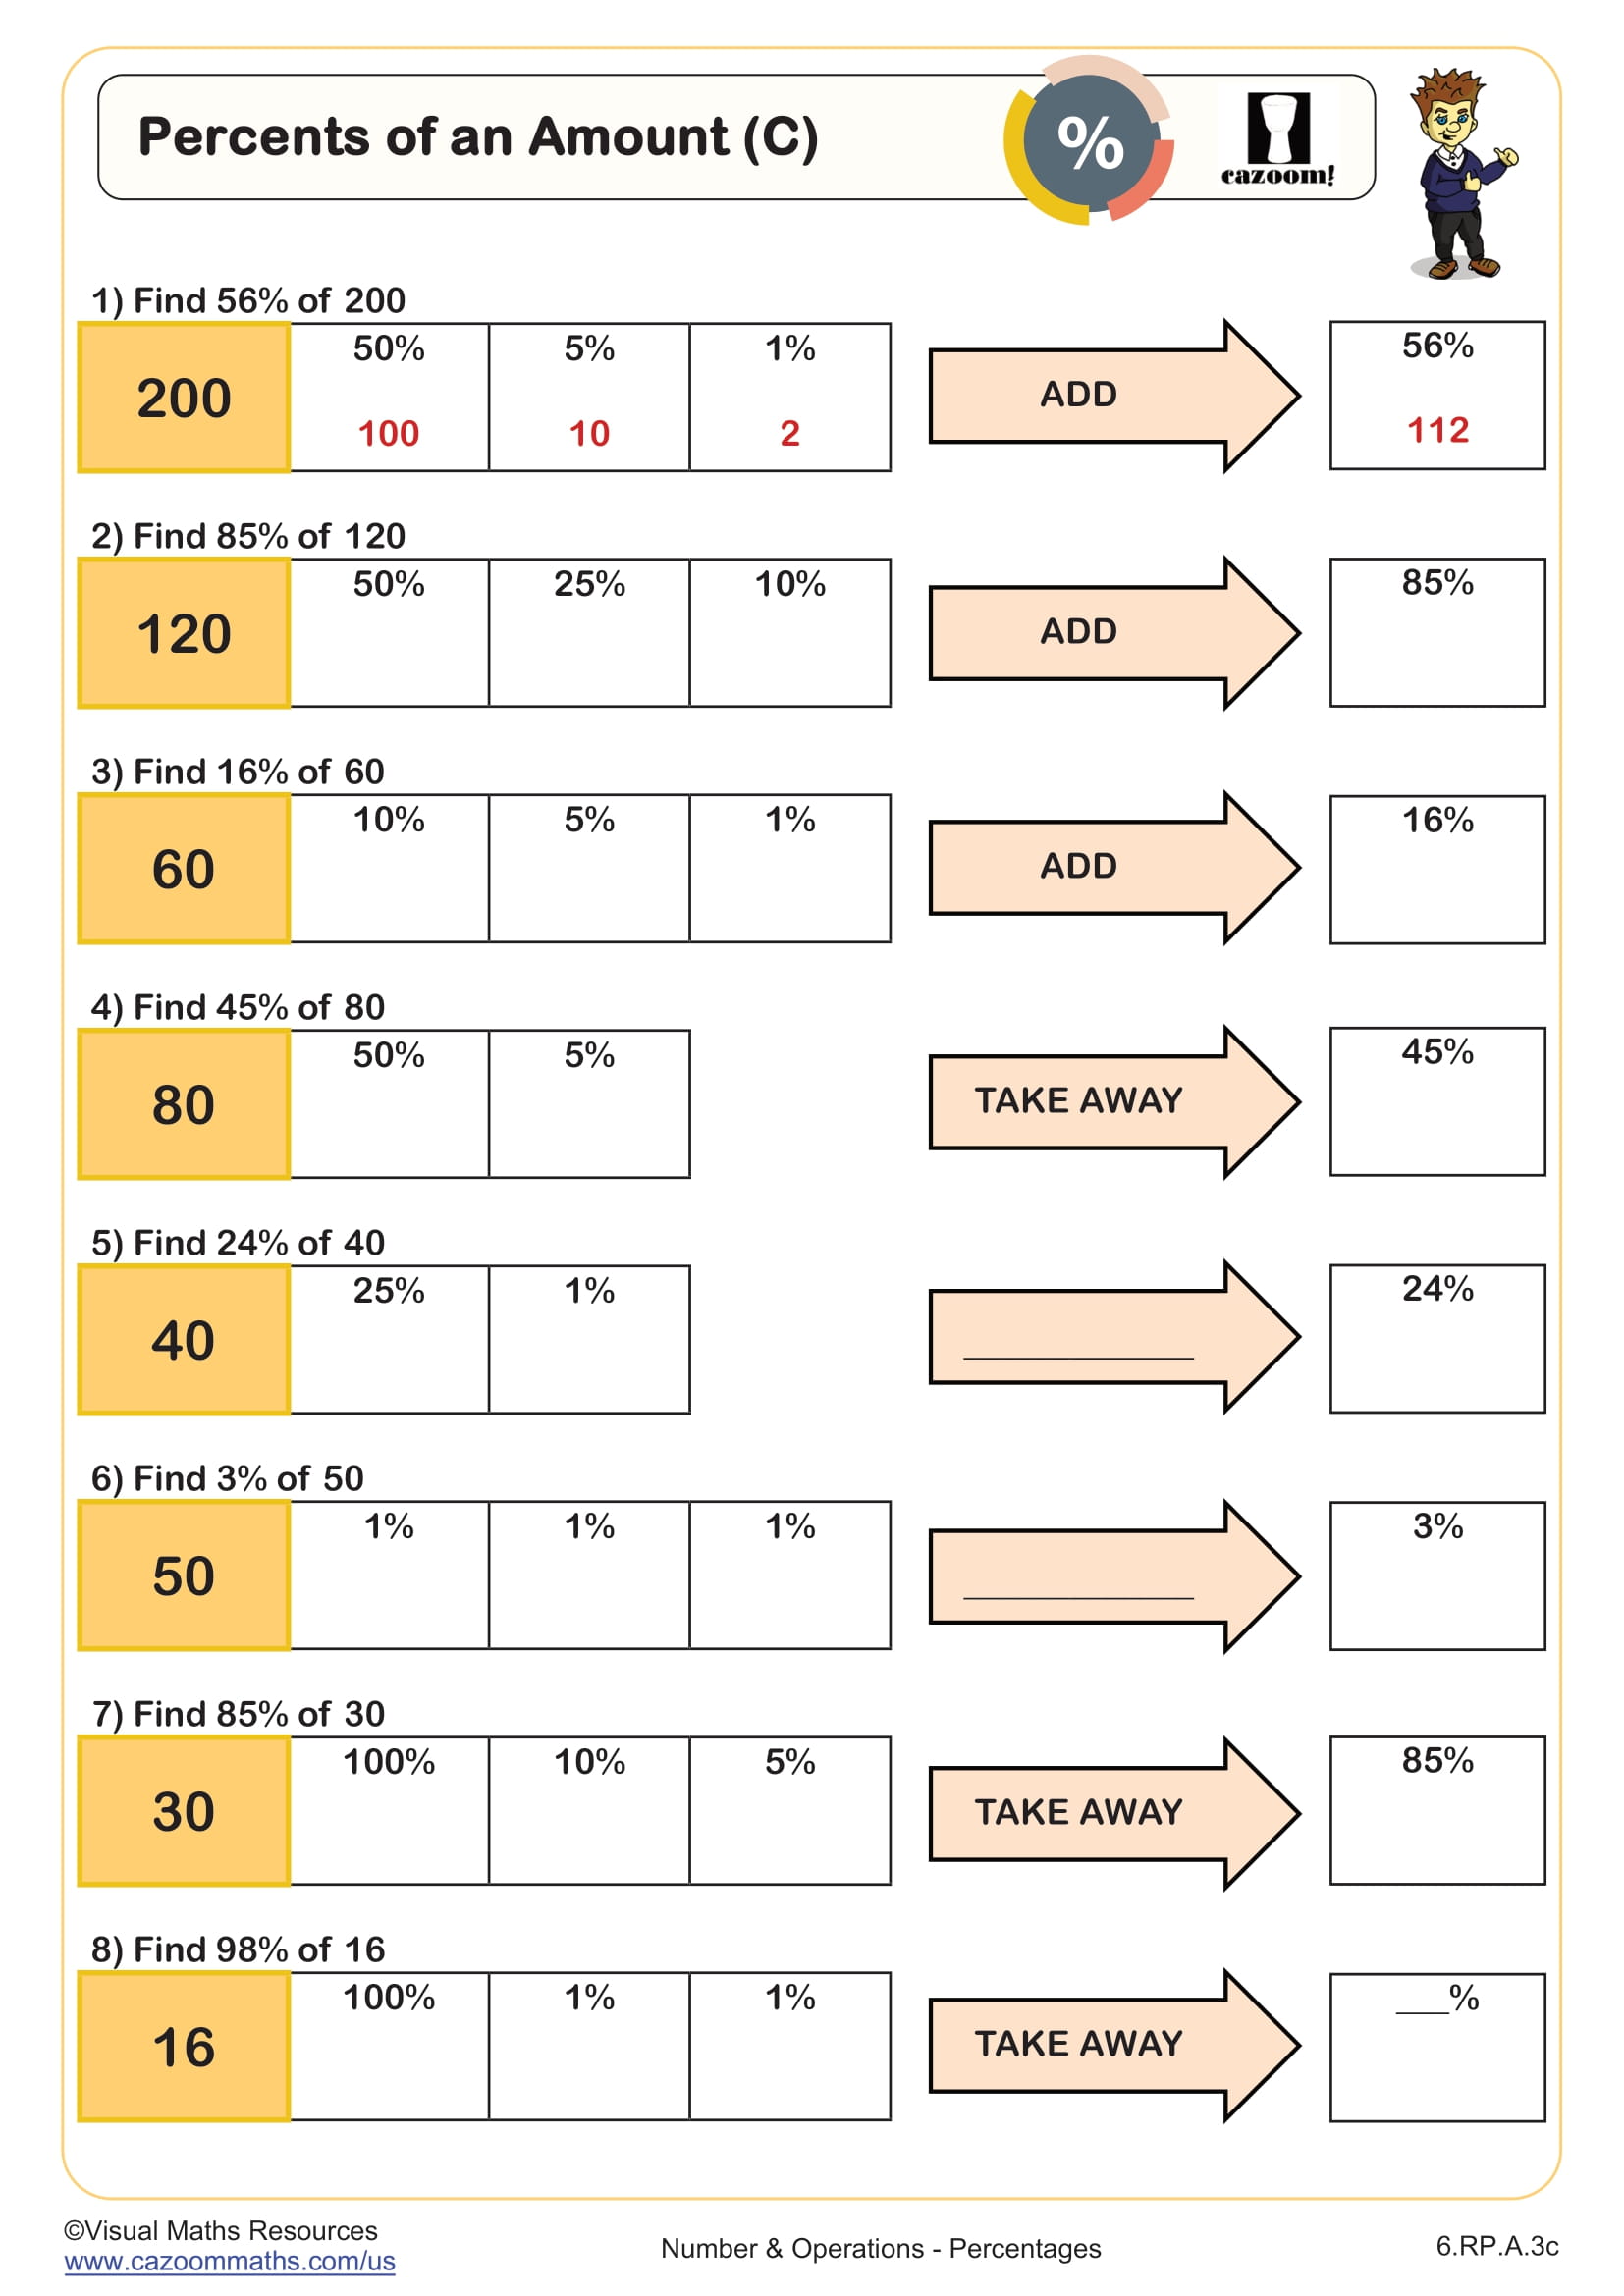
Percents of an Amount (C)
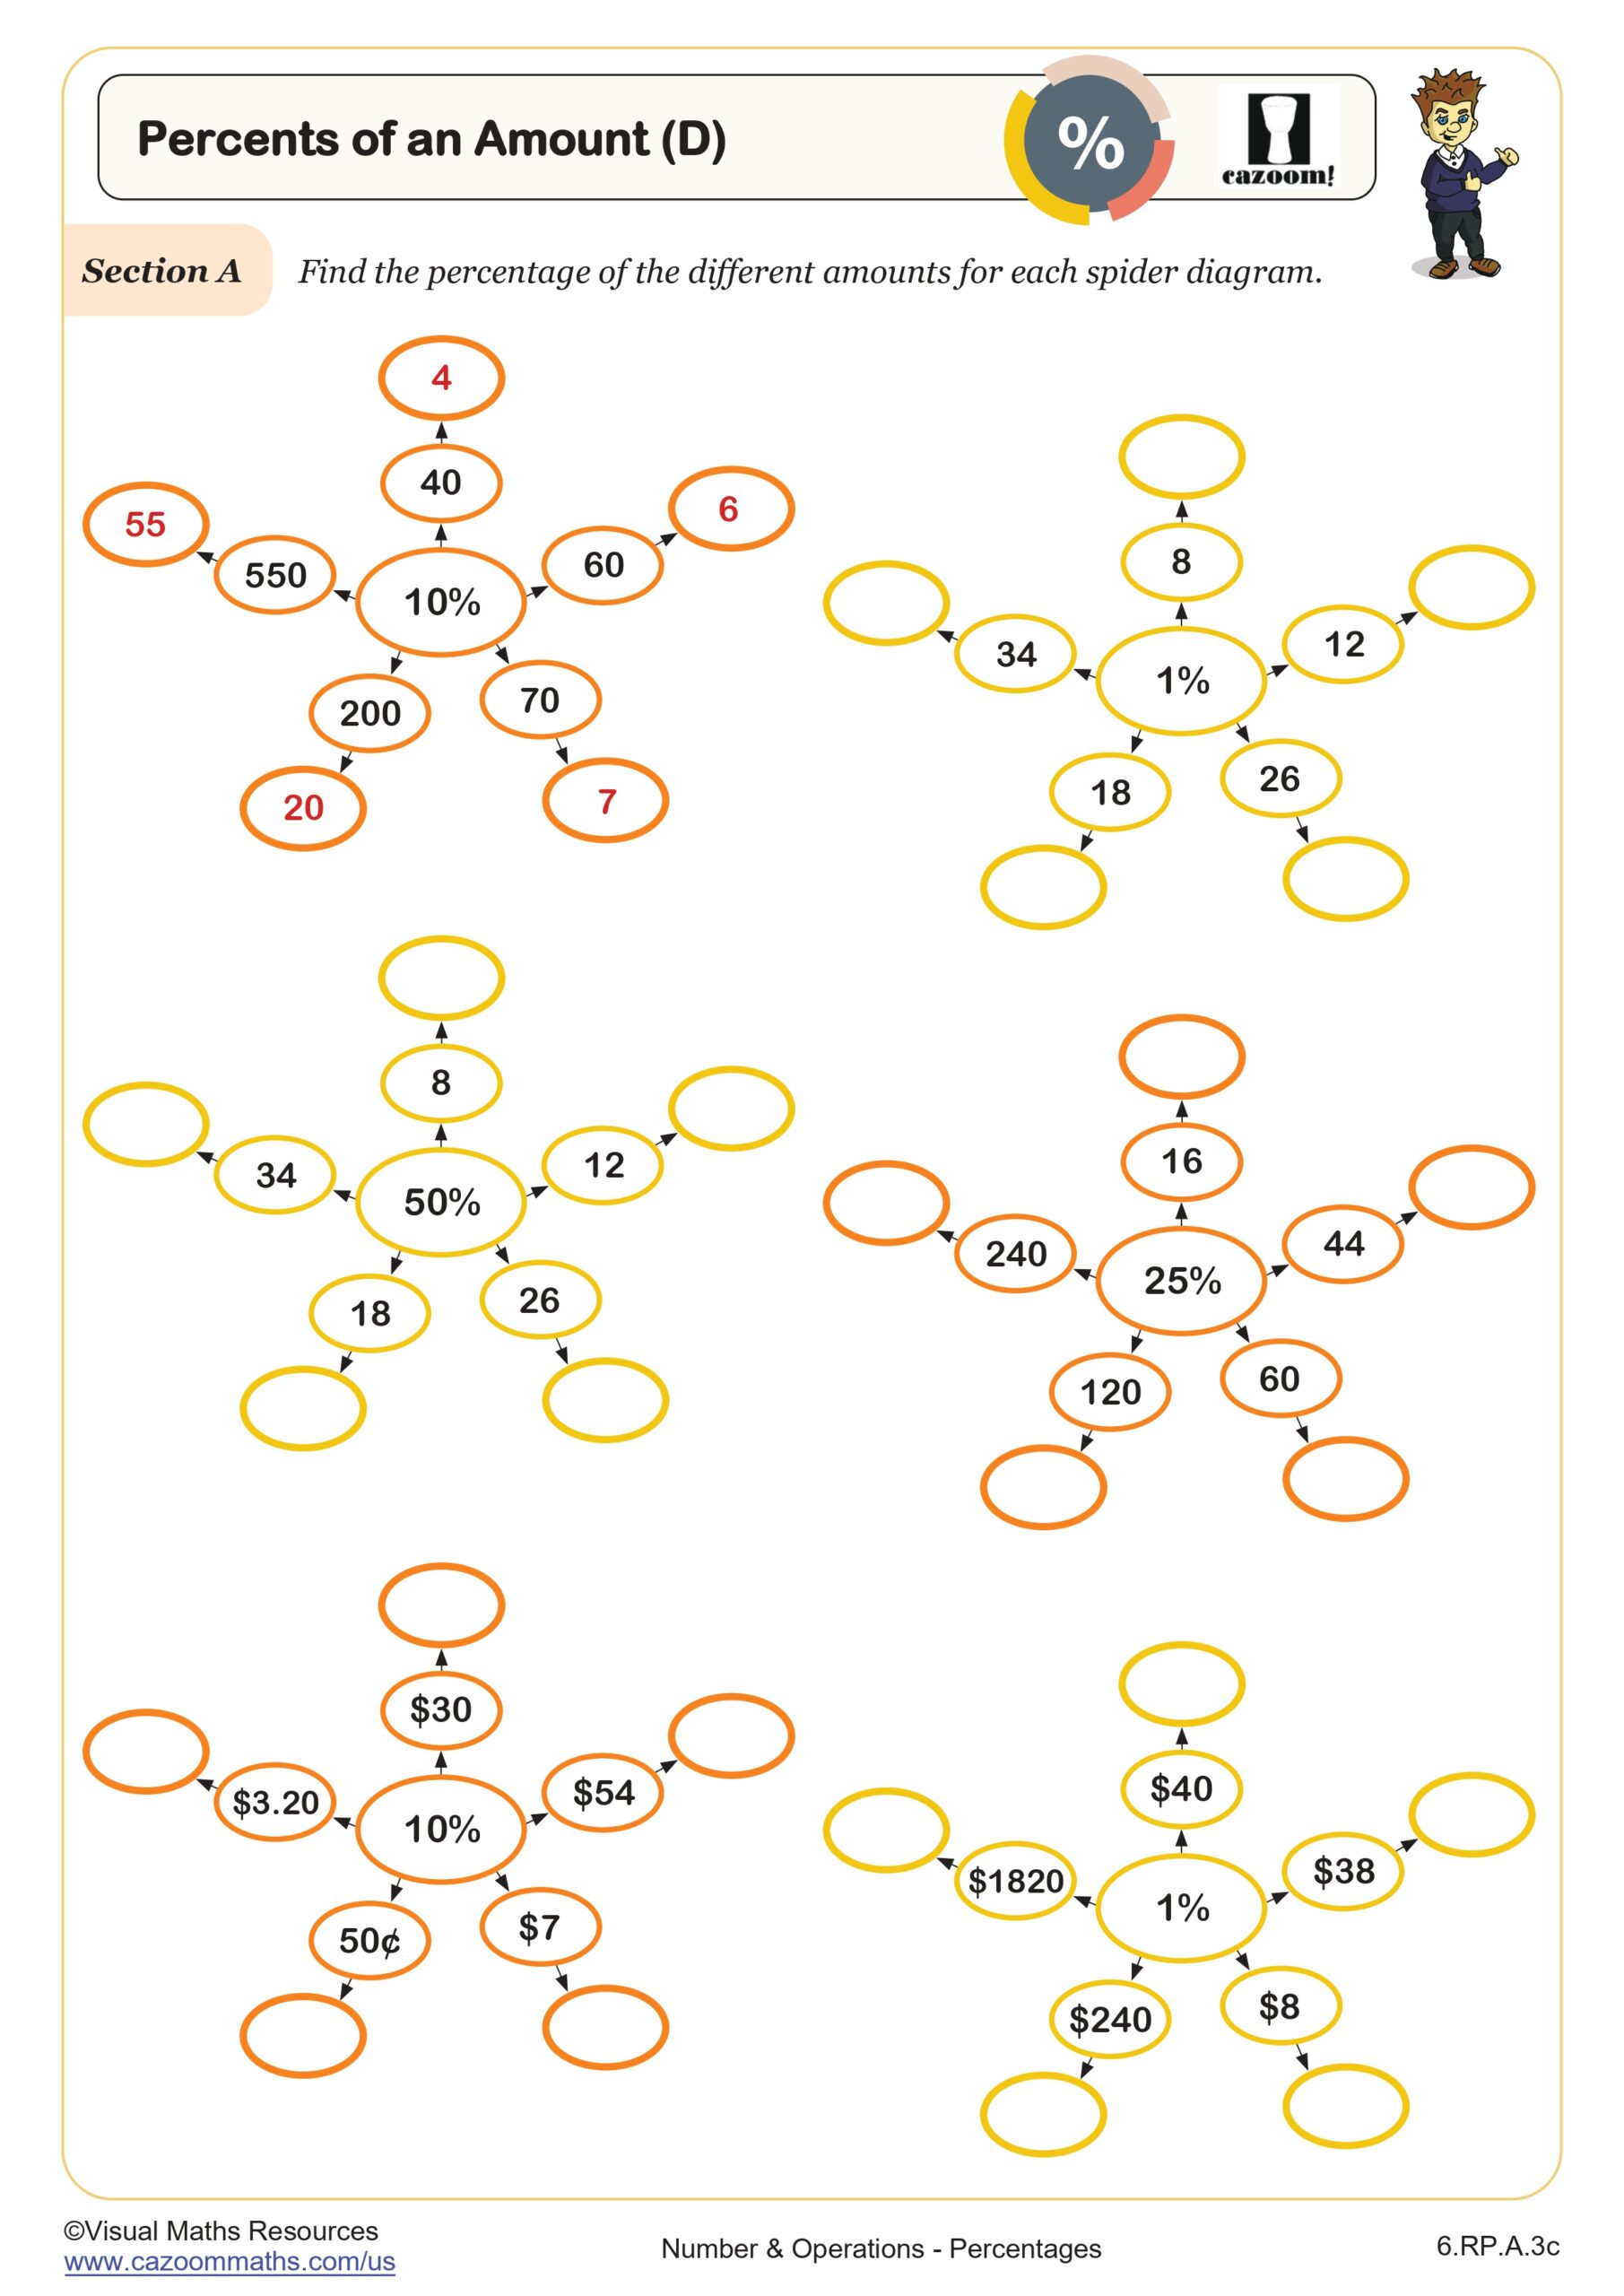
Percents of an Amount (D)
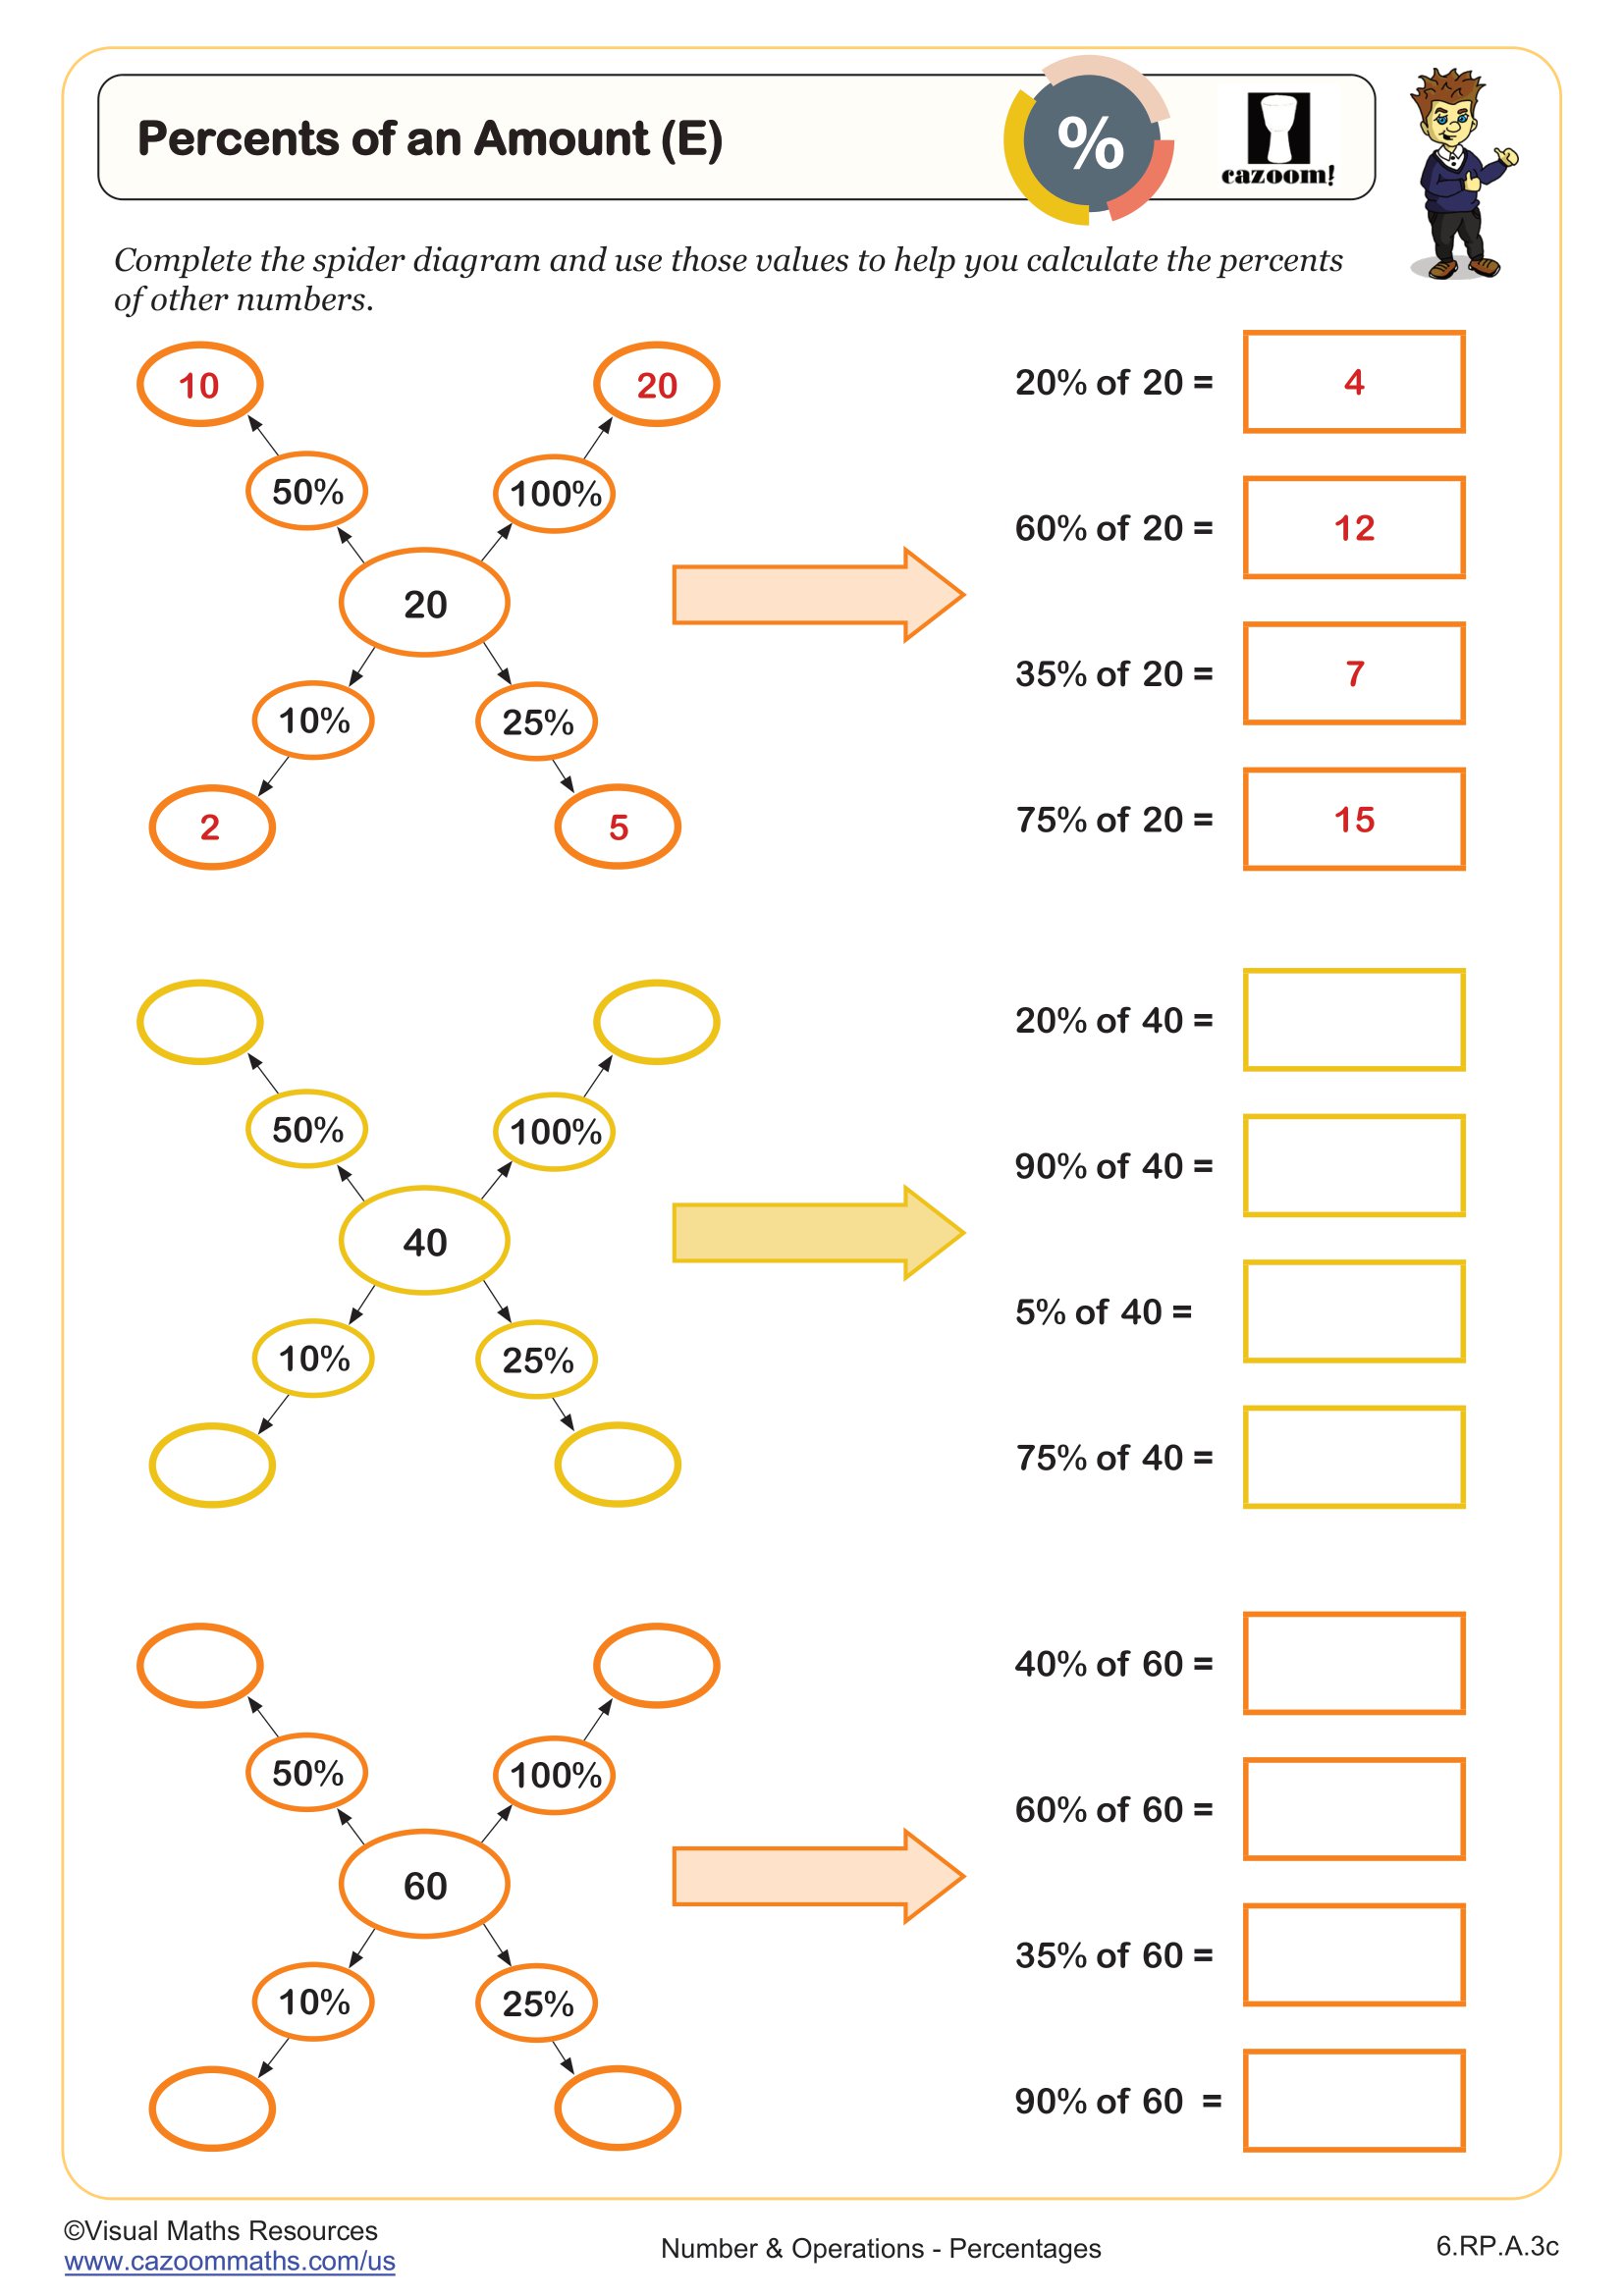
Percents of an Amount (E)
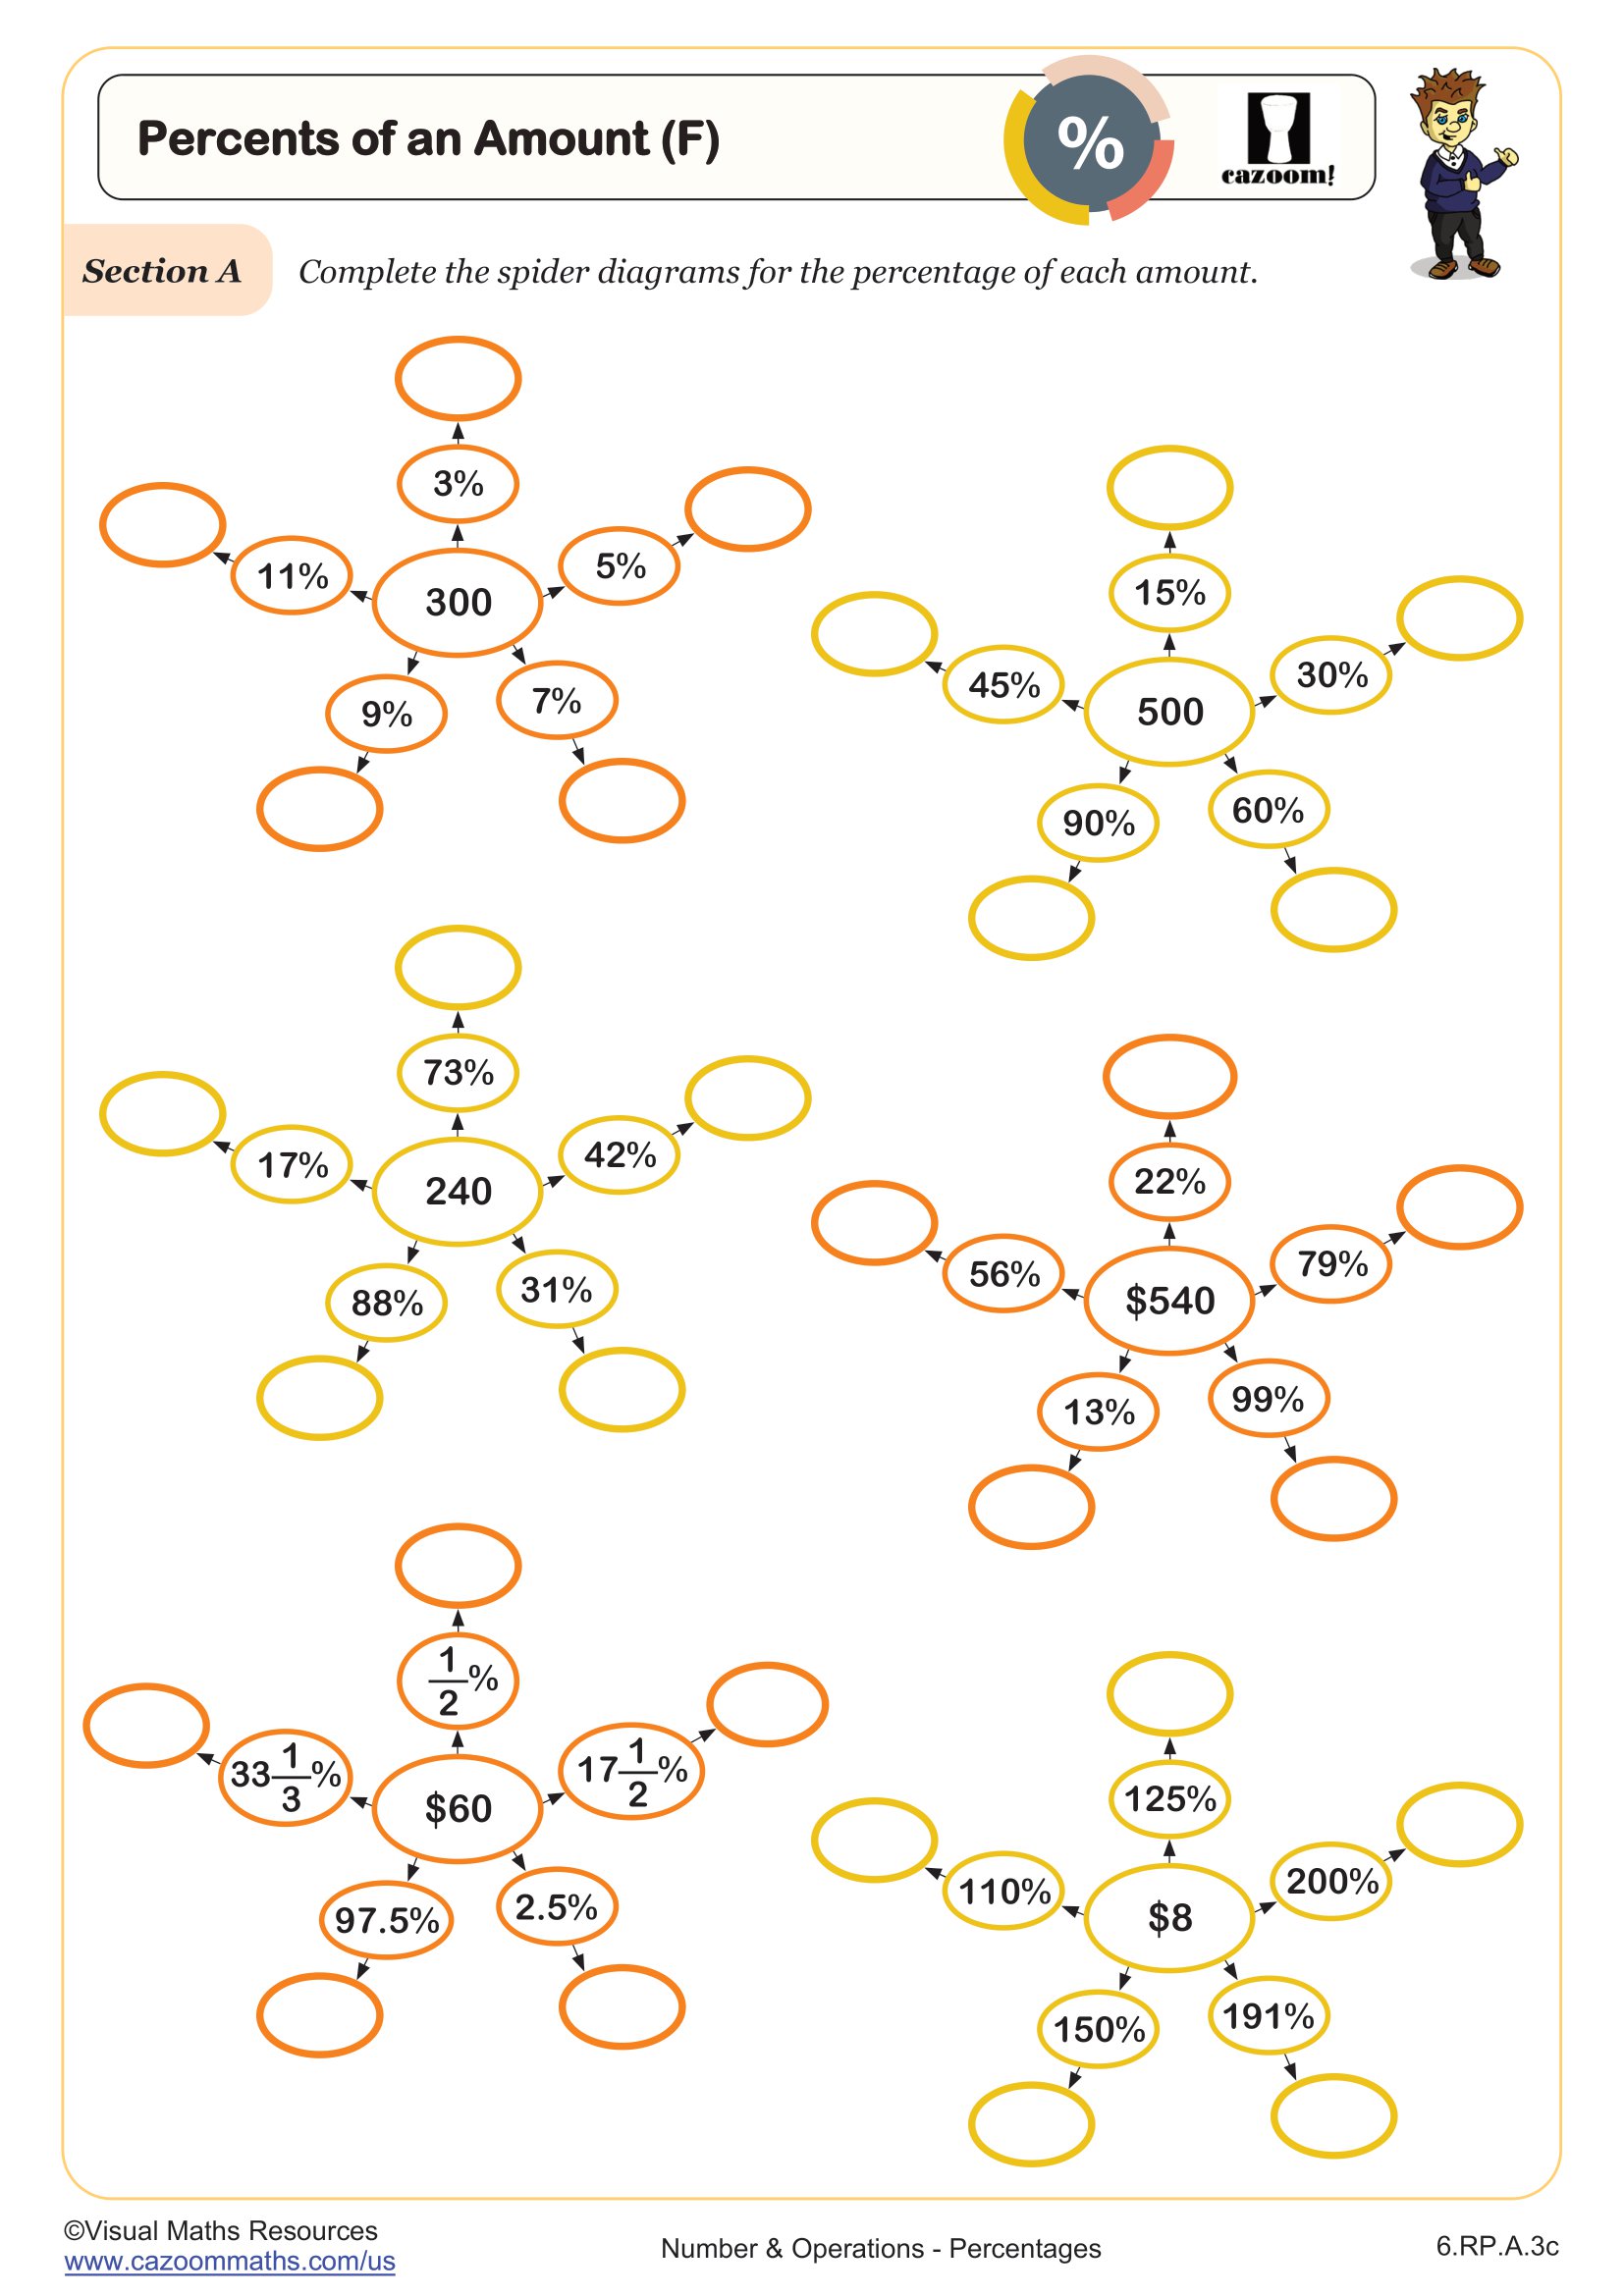
Percents of an Amount (F)
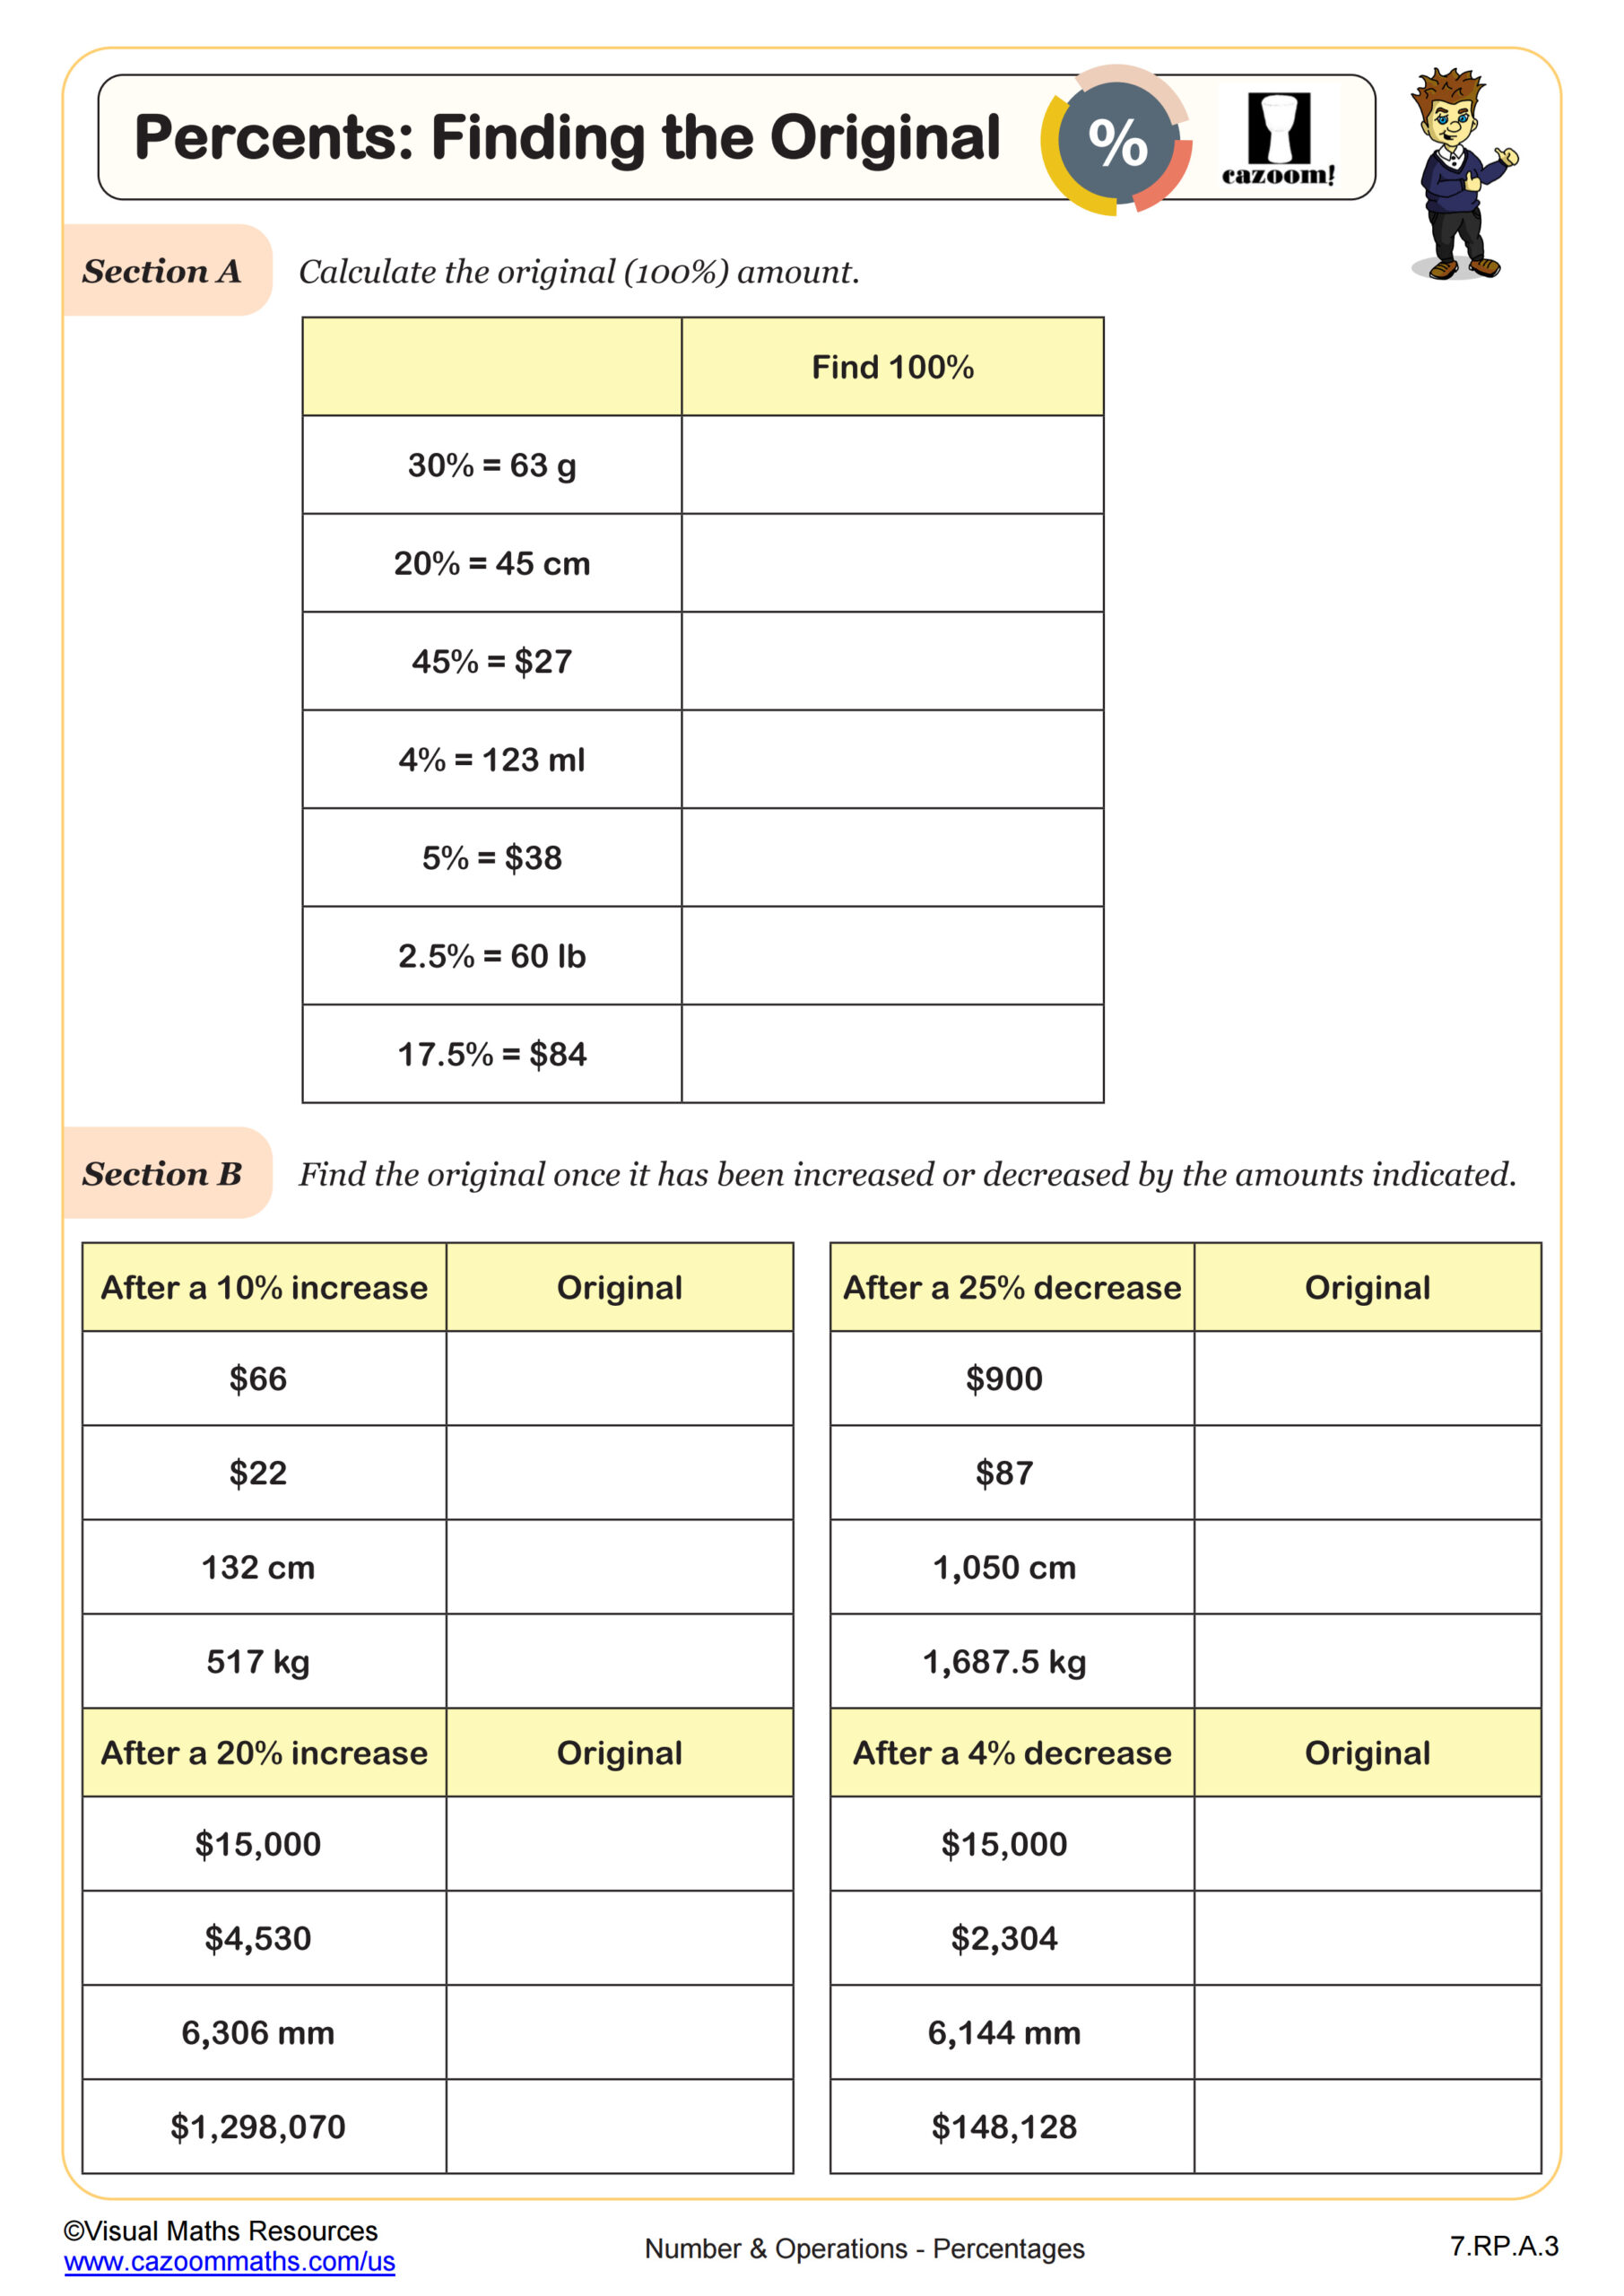
Percents: Finding the Original
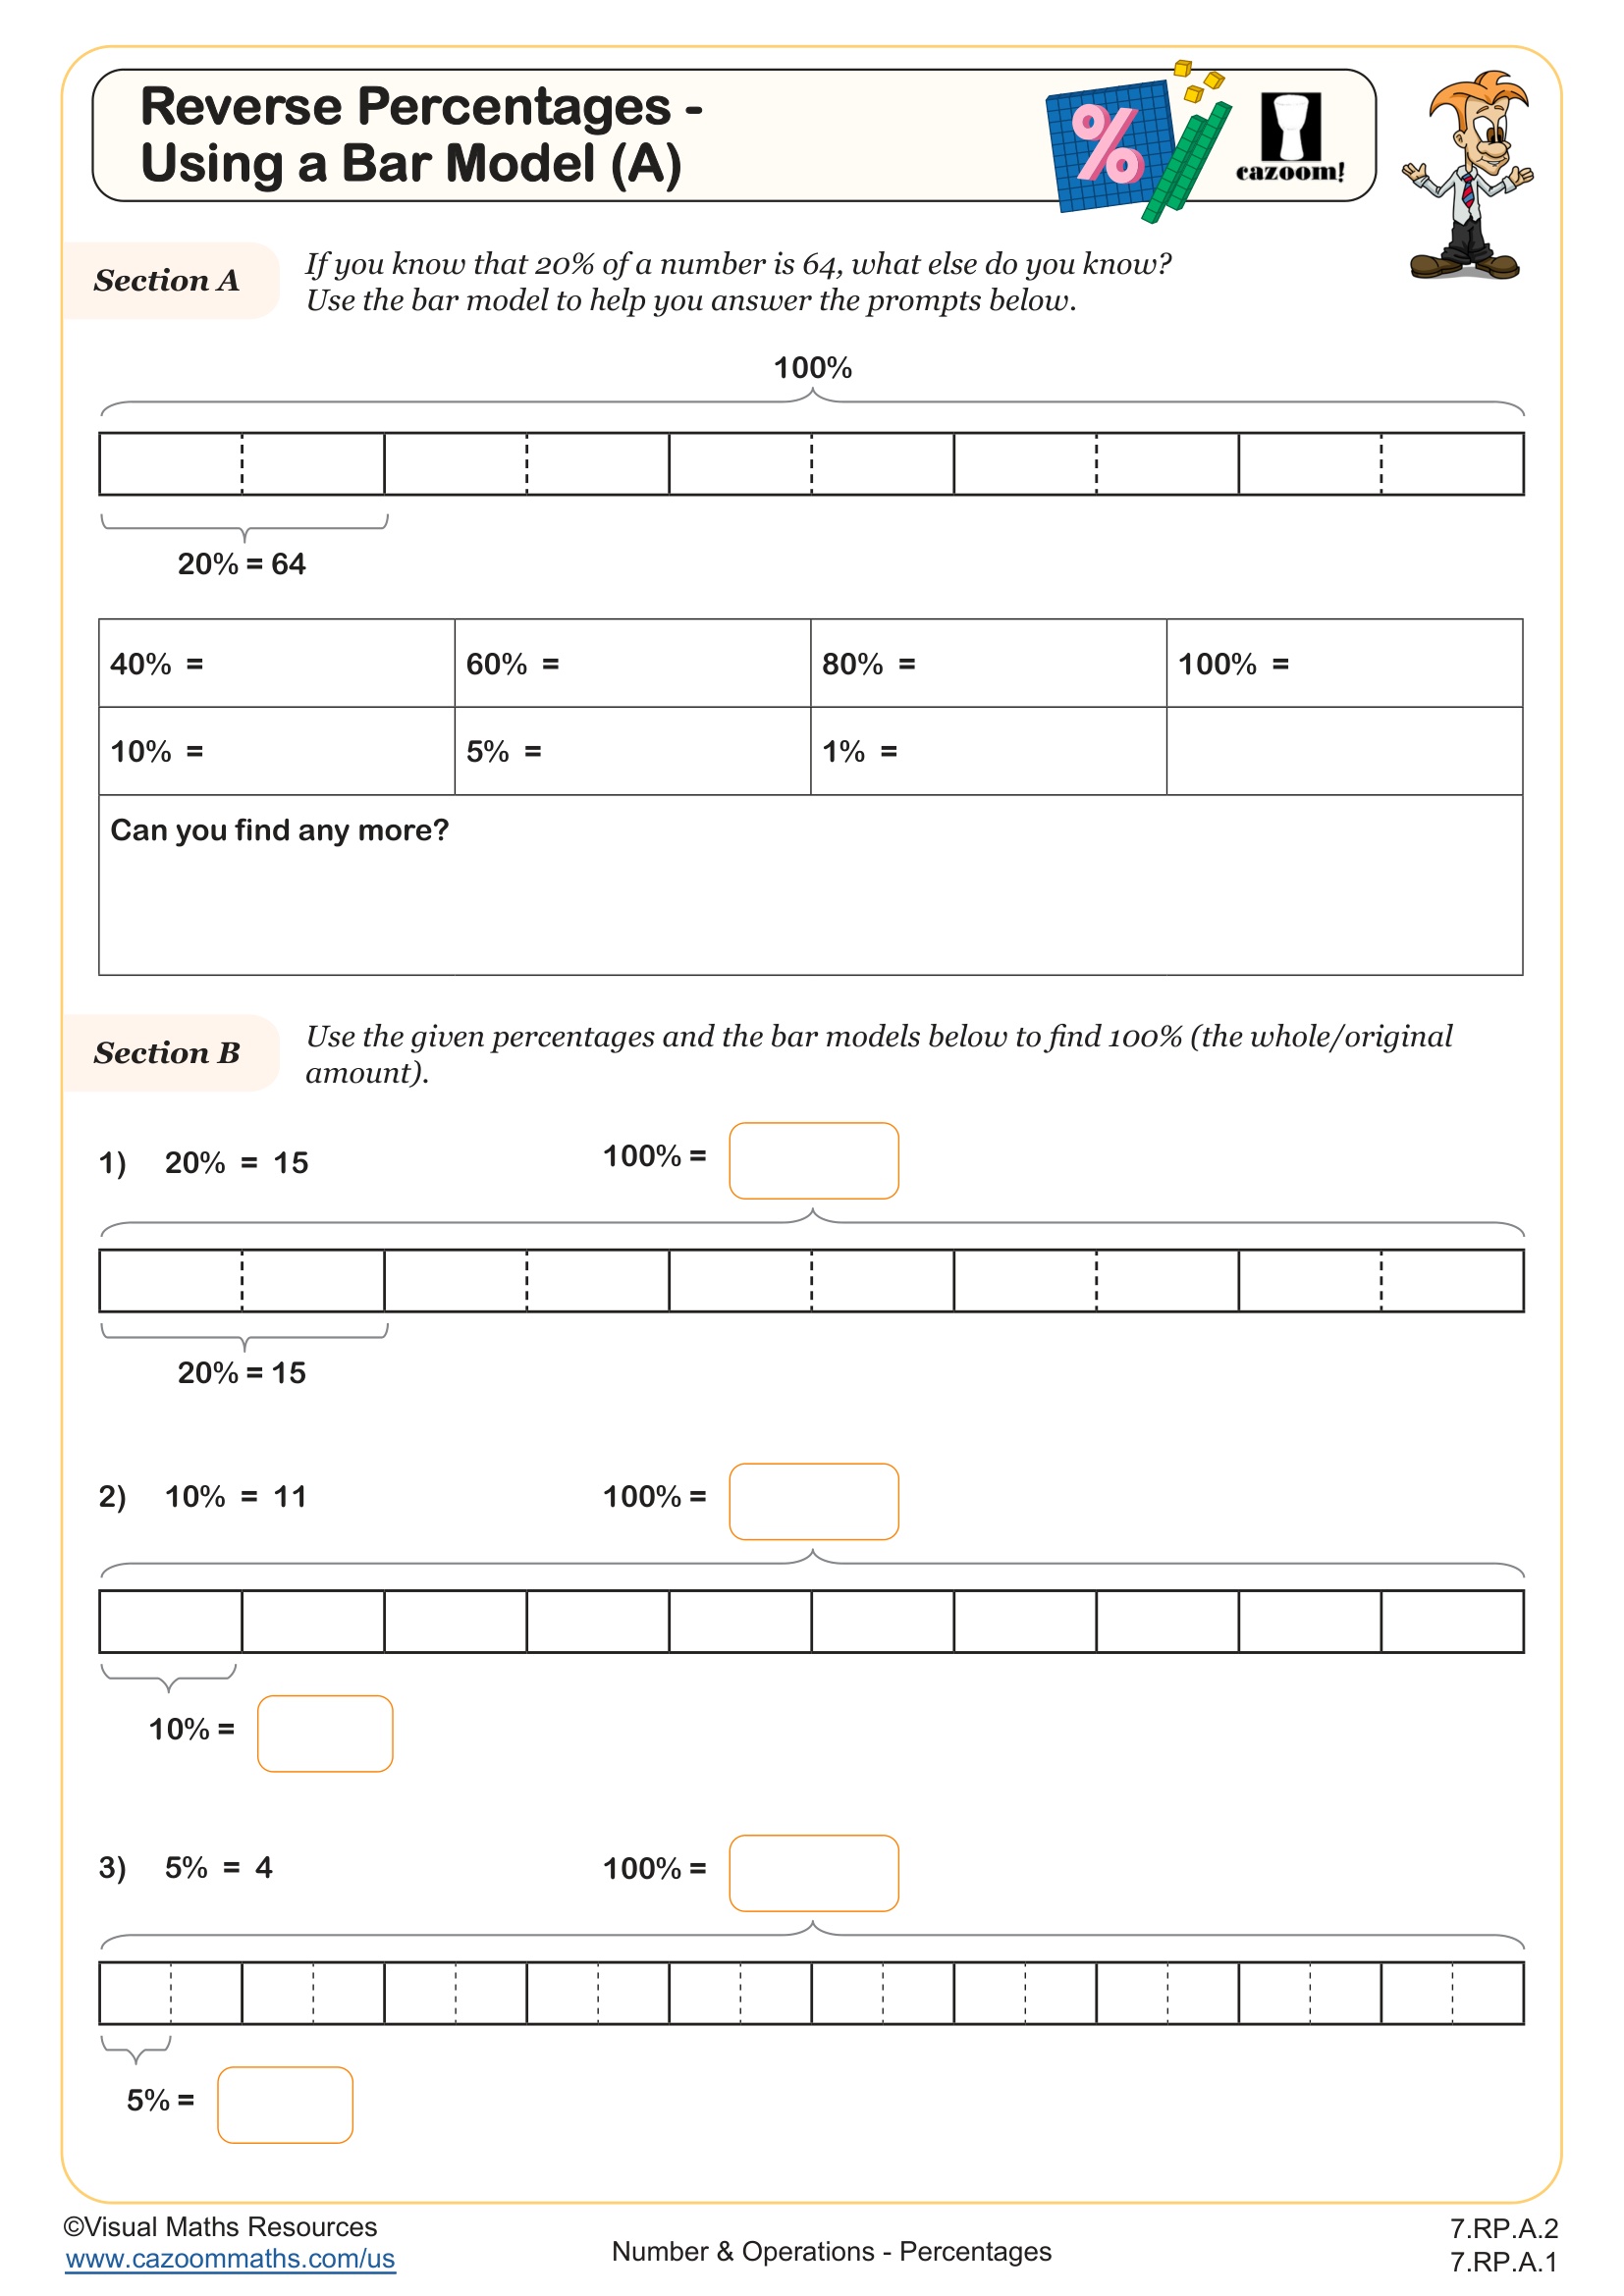
Reverse Percentages - Using a Bar Model (A)
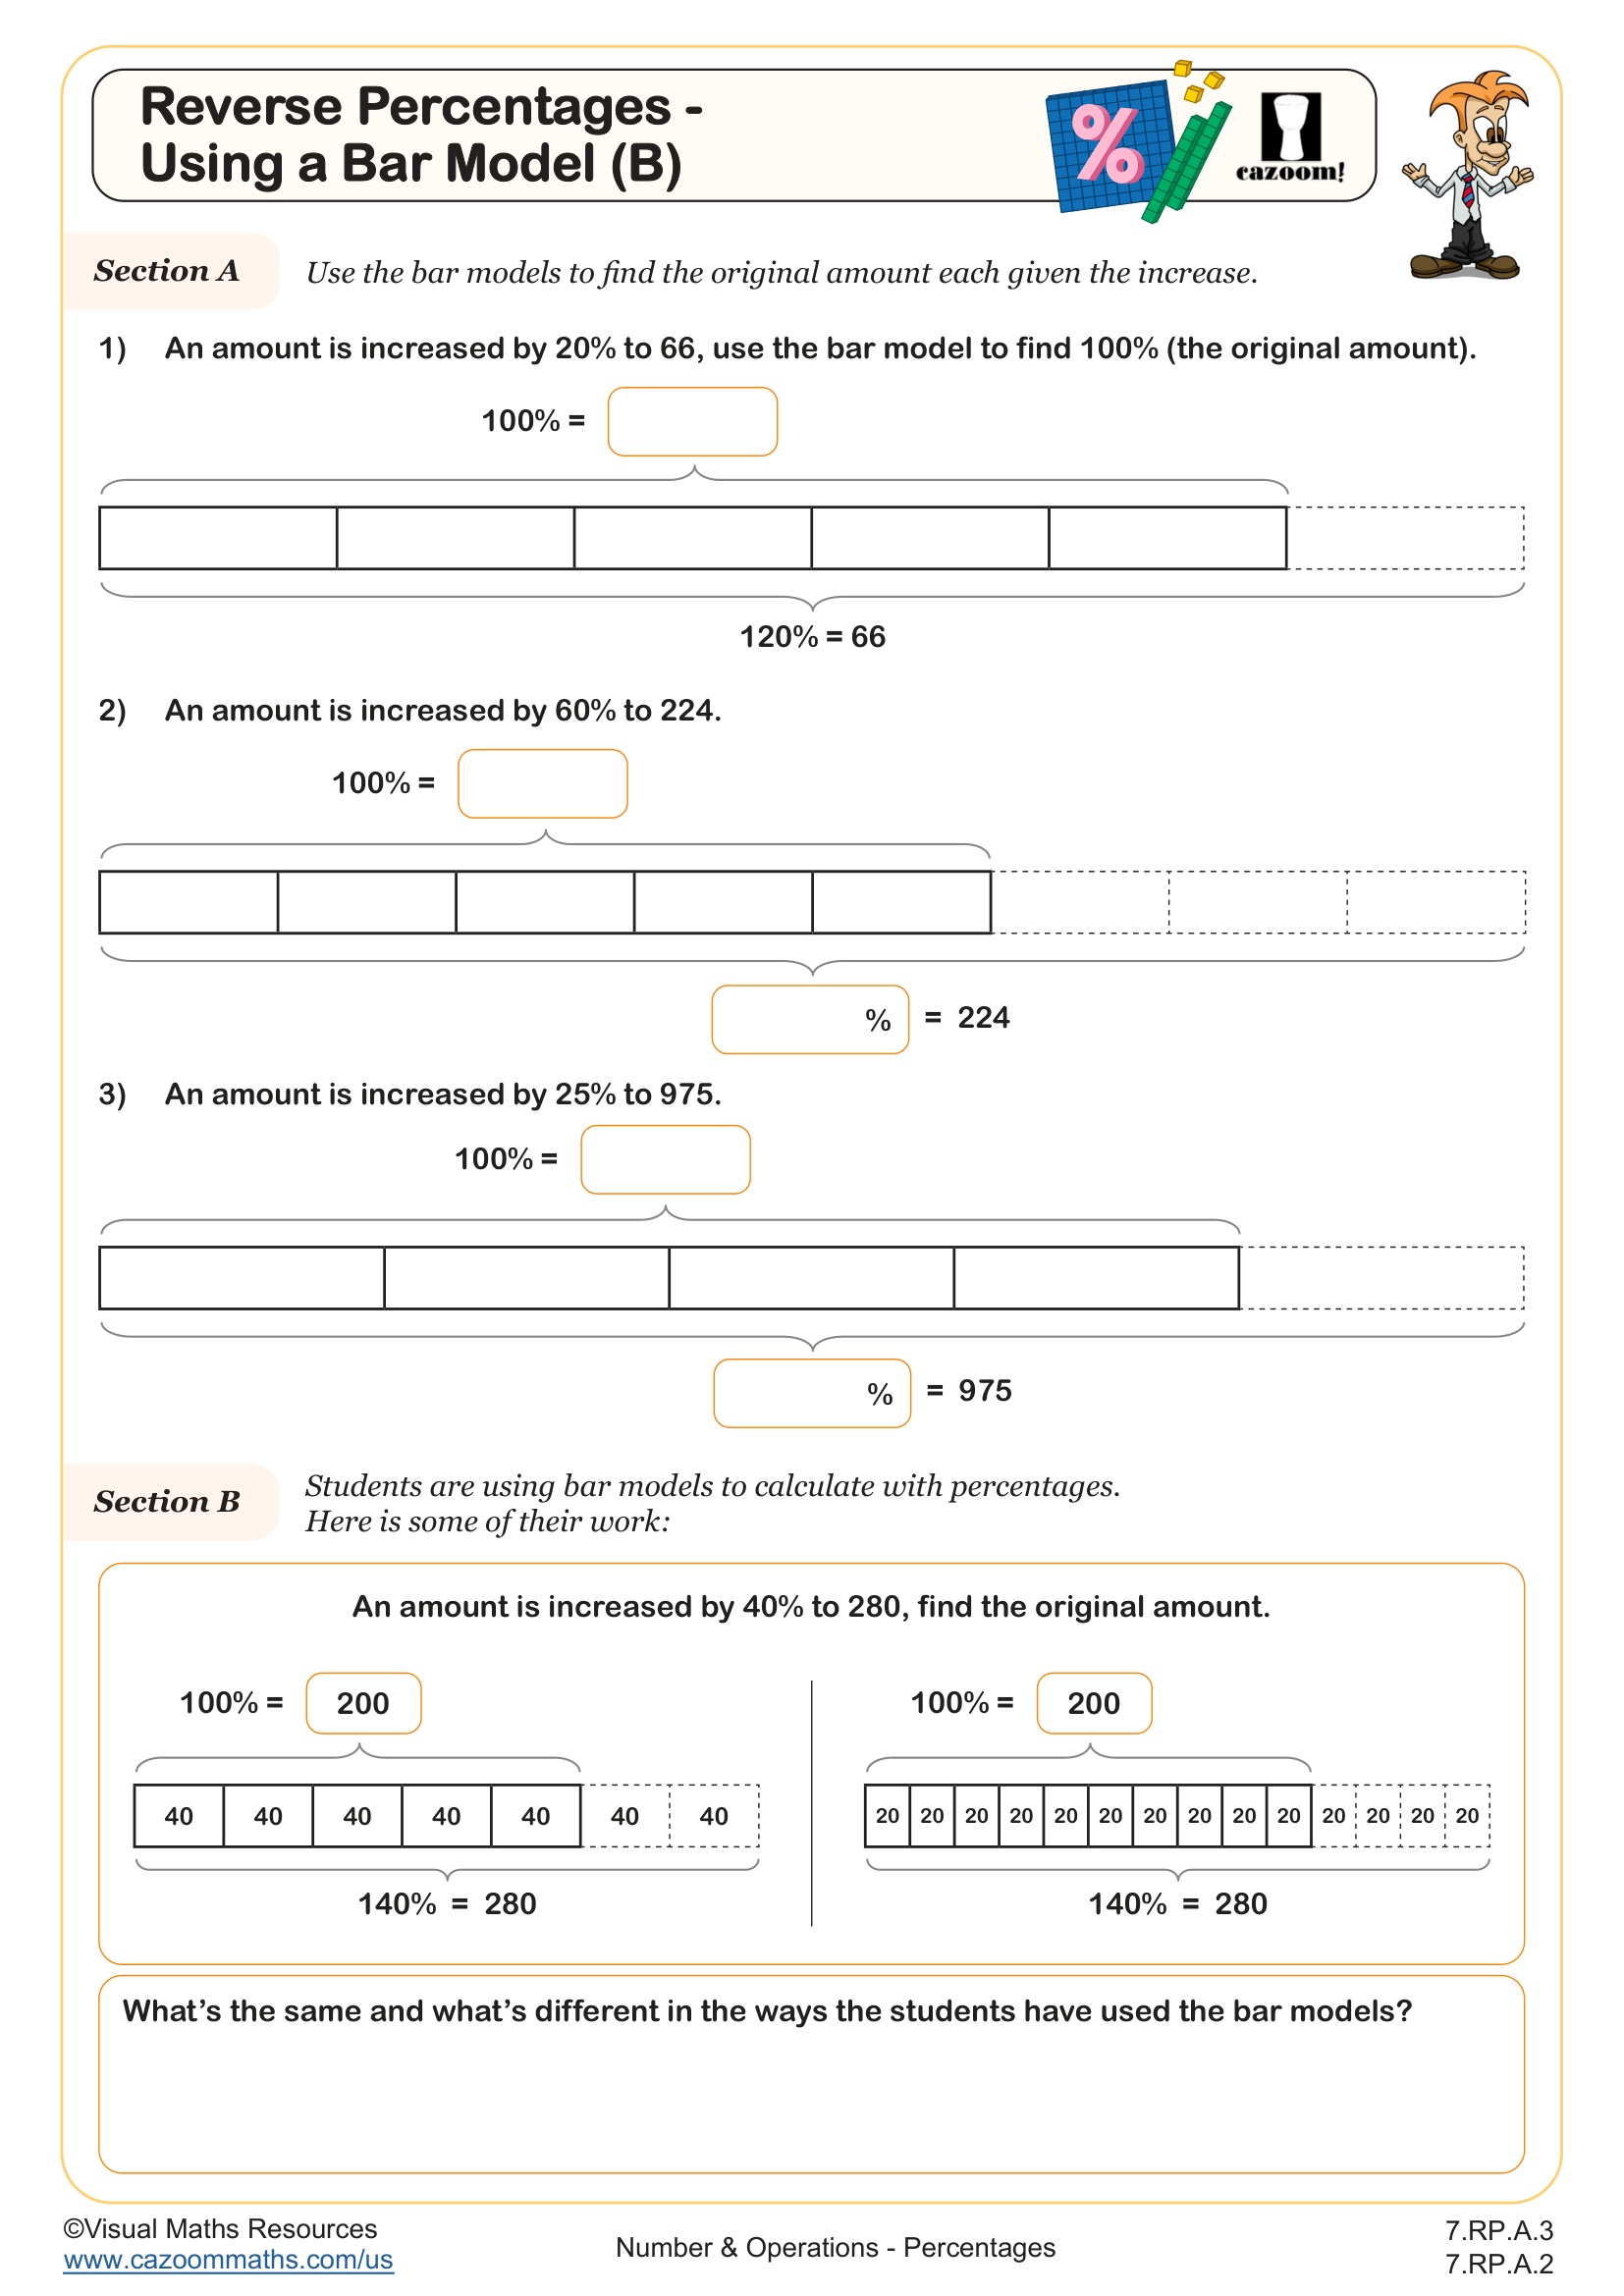
Reverse Percentages - Using a Bar Model (B)
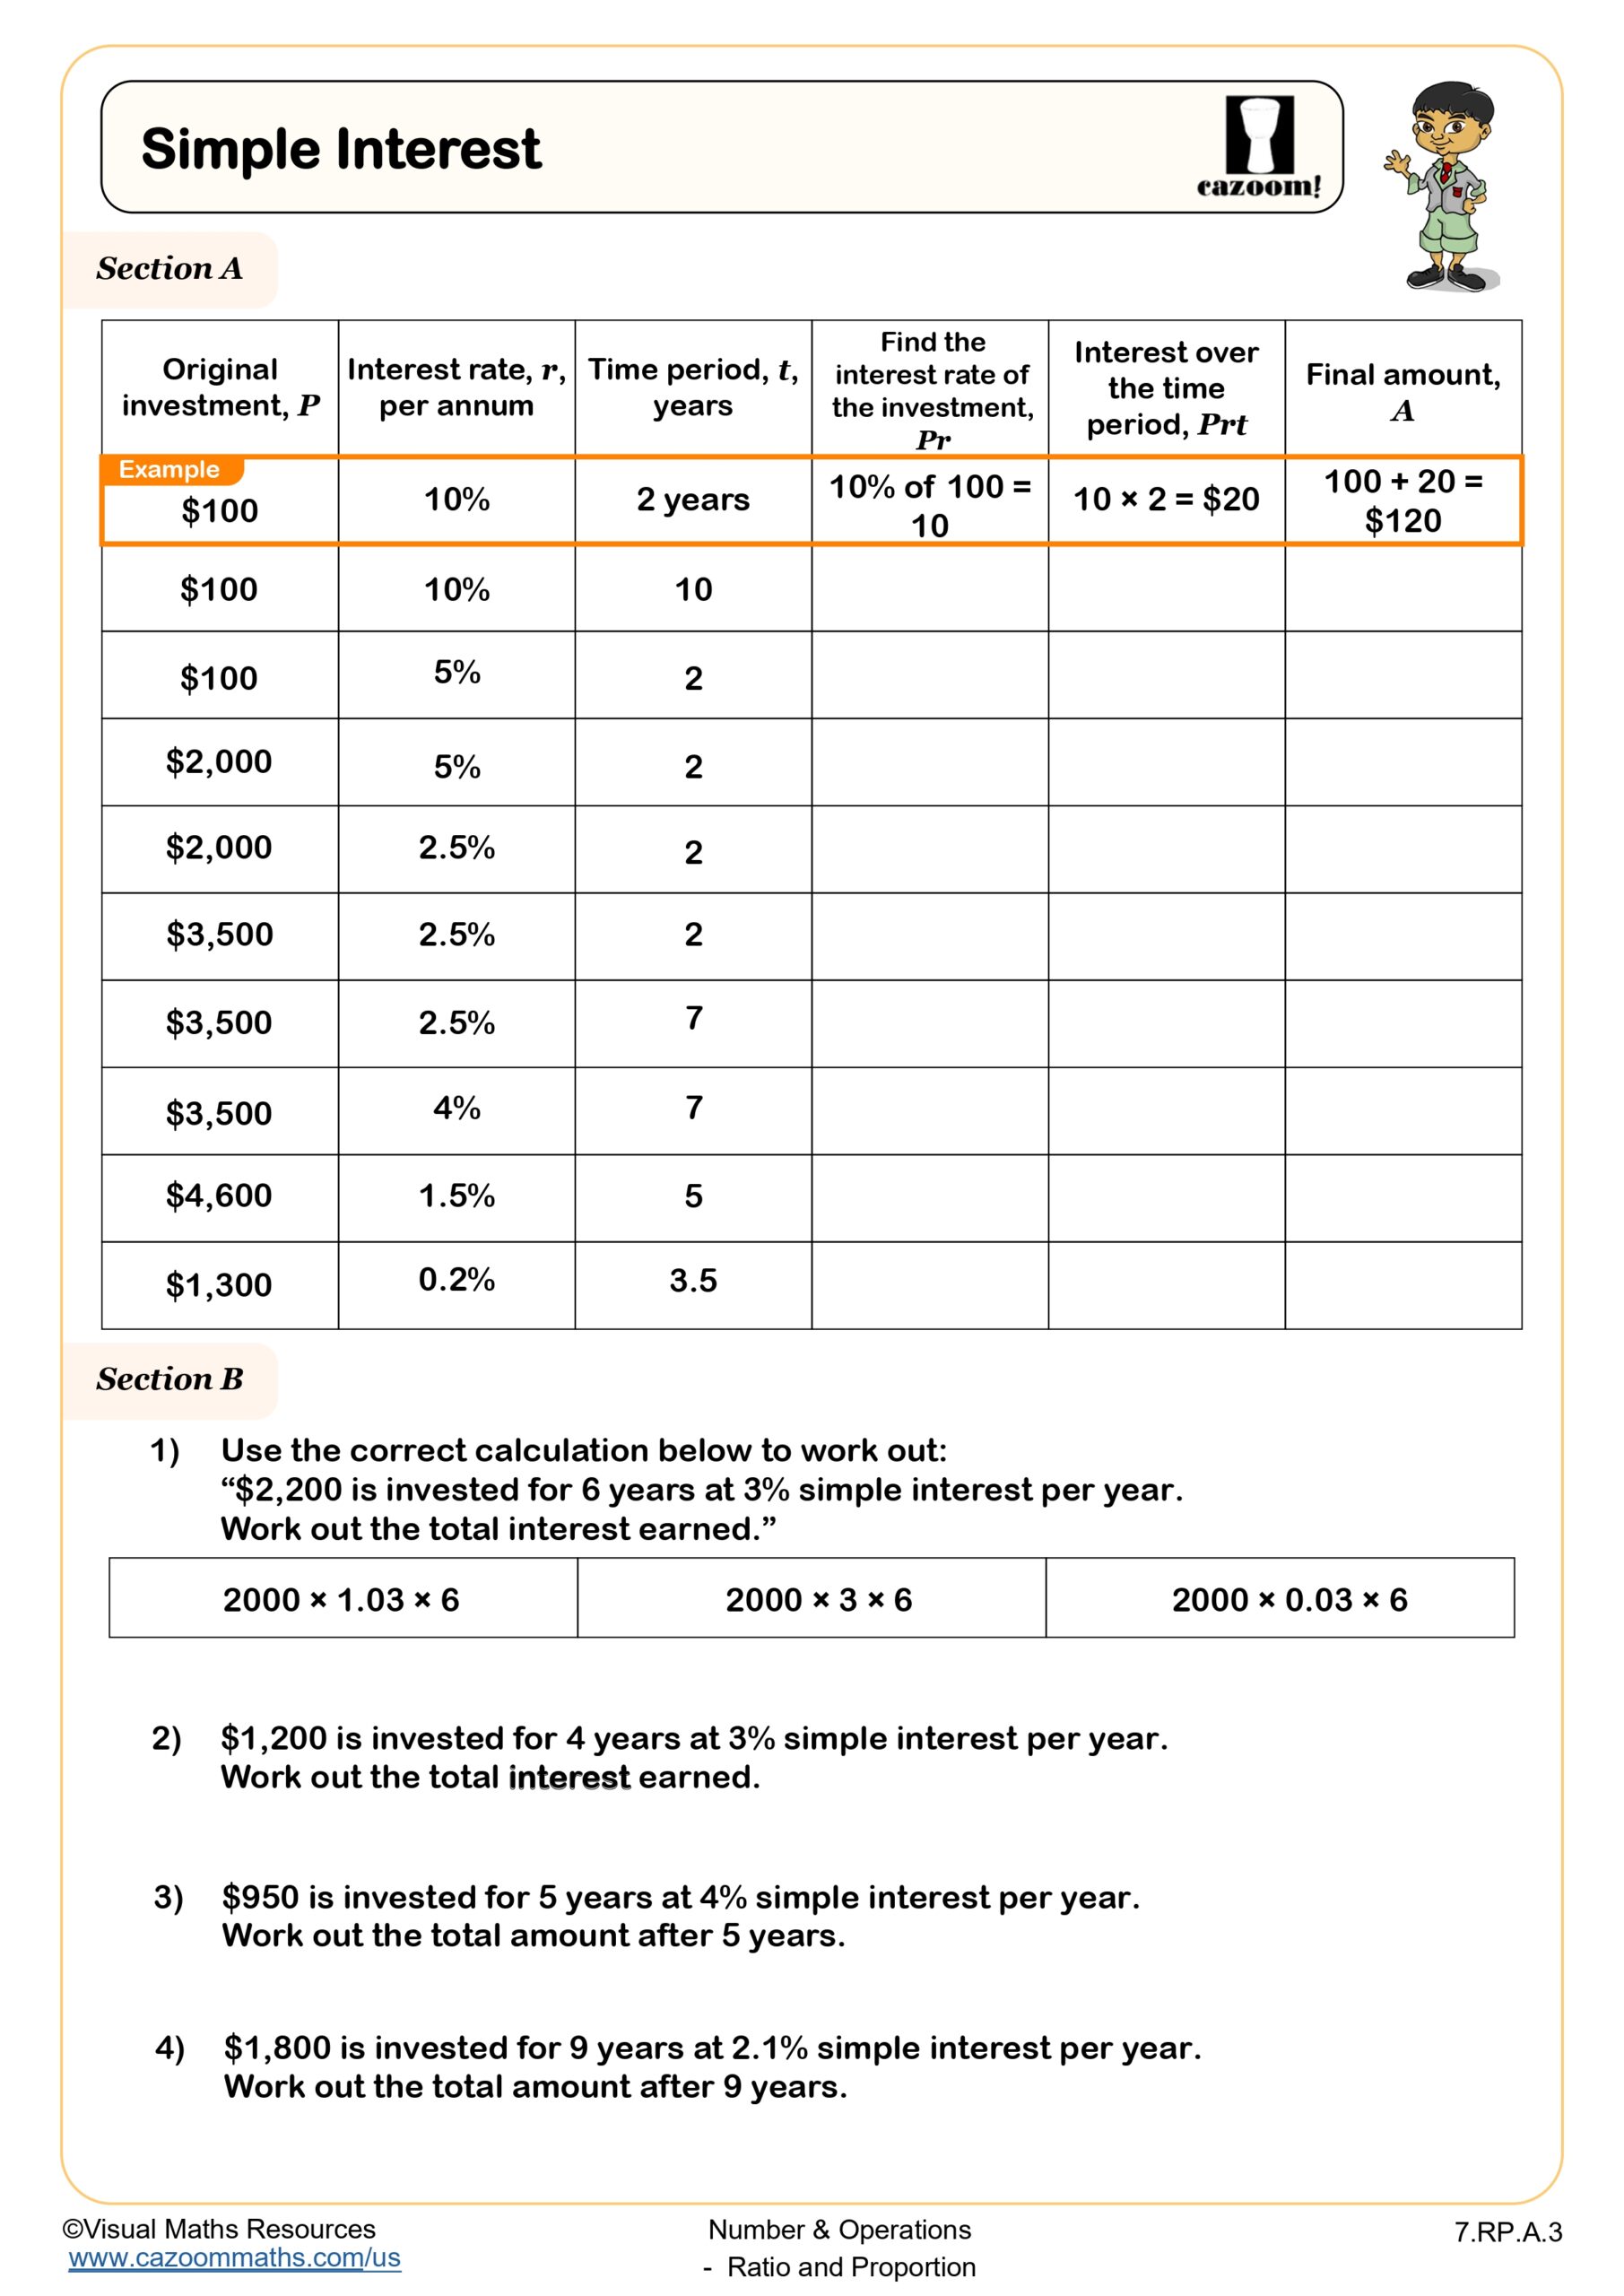
Simple Interest
All worksheets are created by the team of experienced teachers at Cazoom Math.
What makes a percent tape diagram worksheet effective for middle school students?
An effective percent tape diagram worksheet provides structured practice with visual models that clearly show the relationship between percentages, parts, and wholes. These worksheets align with Common Core standards 6.RP.3 and 7.RP.3, helping students understand ratios and proportional relationships through concrete representations.
Teachers notice that students often misidentify which quantity represents the whole when solving percent problems. Quality tape diagram worksheets address this by starting with clearly labeled examples where students identify the whole, then progress to problems where students must determine this themselves. The visual nature of tape diagrams helps students avoid the common error of treating the given percentage as the whole rather than recognizing it as a part of the total.
Which grade levels benefit most from tape diagram worksheet practice?
Tape diagram worksheets work exceptionally well for grades 6-8, with grade 7 being the sweet spot for intensive practice. At this level, students have developed proportional reasoning skills but still benefit from visual supports when tackling complex percentage problems. The method bridges concrete and abstract thinking effectively.
Sixth graders typically start with simple percent problems using tape diagrams, while eighth graders use them for more complex scenarios like percent increase and decrease. Teachers find that even advanced students benefit from tape diagram methods when encountering multi-step percentage problems or real-world applications like calculating tips, discounts, or population changes in social studies contexts.
How do tape diagram percentages connect to real-world problem solving?
Tape diagram percentages excel at modeling real-world scenarios where students must identify what represents the whole versus the part. Common applications include calculating sales tax, determining population growth, analyzing survey data, and solving mixture problems that appear in chemistry and cooking contexts.
Teachers observe that students who master tape diagram percent methods transfer these skills effectively to algebra word problems. The visual organization helps students set up equations correctly because they can see the mathematical relationships before writing symbolic expressions. This connection proves valuable when students encounter similar structures in high school mathematics and science courses.
What strategies help teachers implement tape diagram percent worksheets successfully?
Successful implementation starts with modeling the tape diagram process explicitly, showing students how to identify the whole, mark equal parts, and label known information before solving. Teachers should demonstrate common problem types using consistent color coding and labeling conventions that students can replicate independently.
Many teachers find success using a gradual release approach: start with completed diagrams where students only calculate missing values, then move to partially completed diagrams, and finally progress to blank templates. Providing sentence frames helps students articulate their reasoning, such as 'The whole represents...' or 'I know that ___ percent equals ___ units, so...' This structured approach builds both procedural fluency and conceptual understanding.