Middle School Real Life Graphs Worksheets
All worksheets are created by the team of experienced teachers at Cazoom Math.
Why These Printable PDFs Middle School Real-Life Graphs Activities Make Exam Prep Easier
Students apply coordinate plotting and ratio skills from earlier grades to graphs that model physical events. They learn to connect visual features—such as slope, horizontal sections, and direction changes—to real-life situations like acceleration, rest periods, or return trips. This link between shape and meaning strengthens spatial reasoning and prepares them for function notation and calculus concepts.
Consistent practice helps students recognize graph patterns instantly and choose appropriate representations for different scenarios. They extract precise information from curves and line segments, then translate numerical data into accurate plots. These abilities become essential in high school science and economics, where modeling systems and testing predictions rely on fluent graph interpretation.
Complete Topic List: What Cazoom Math High School Real Life Graphs Materials Include
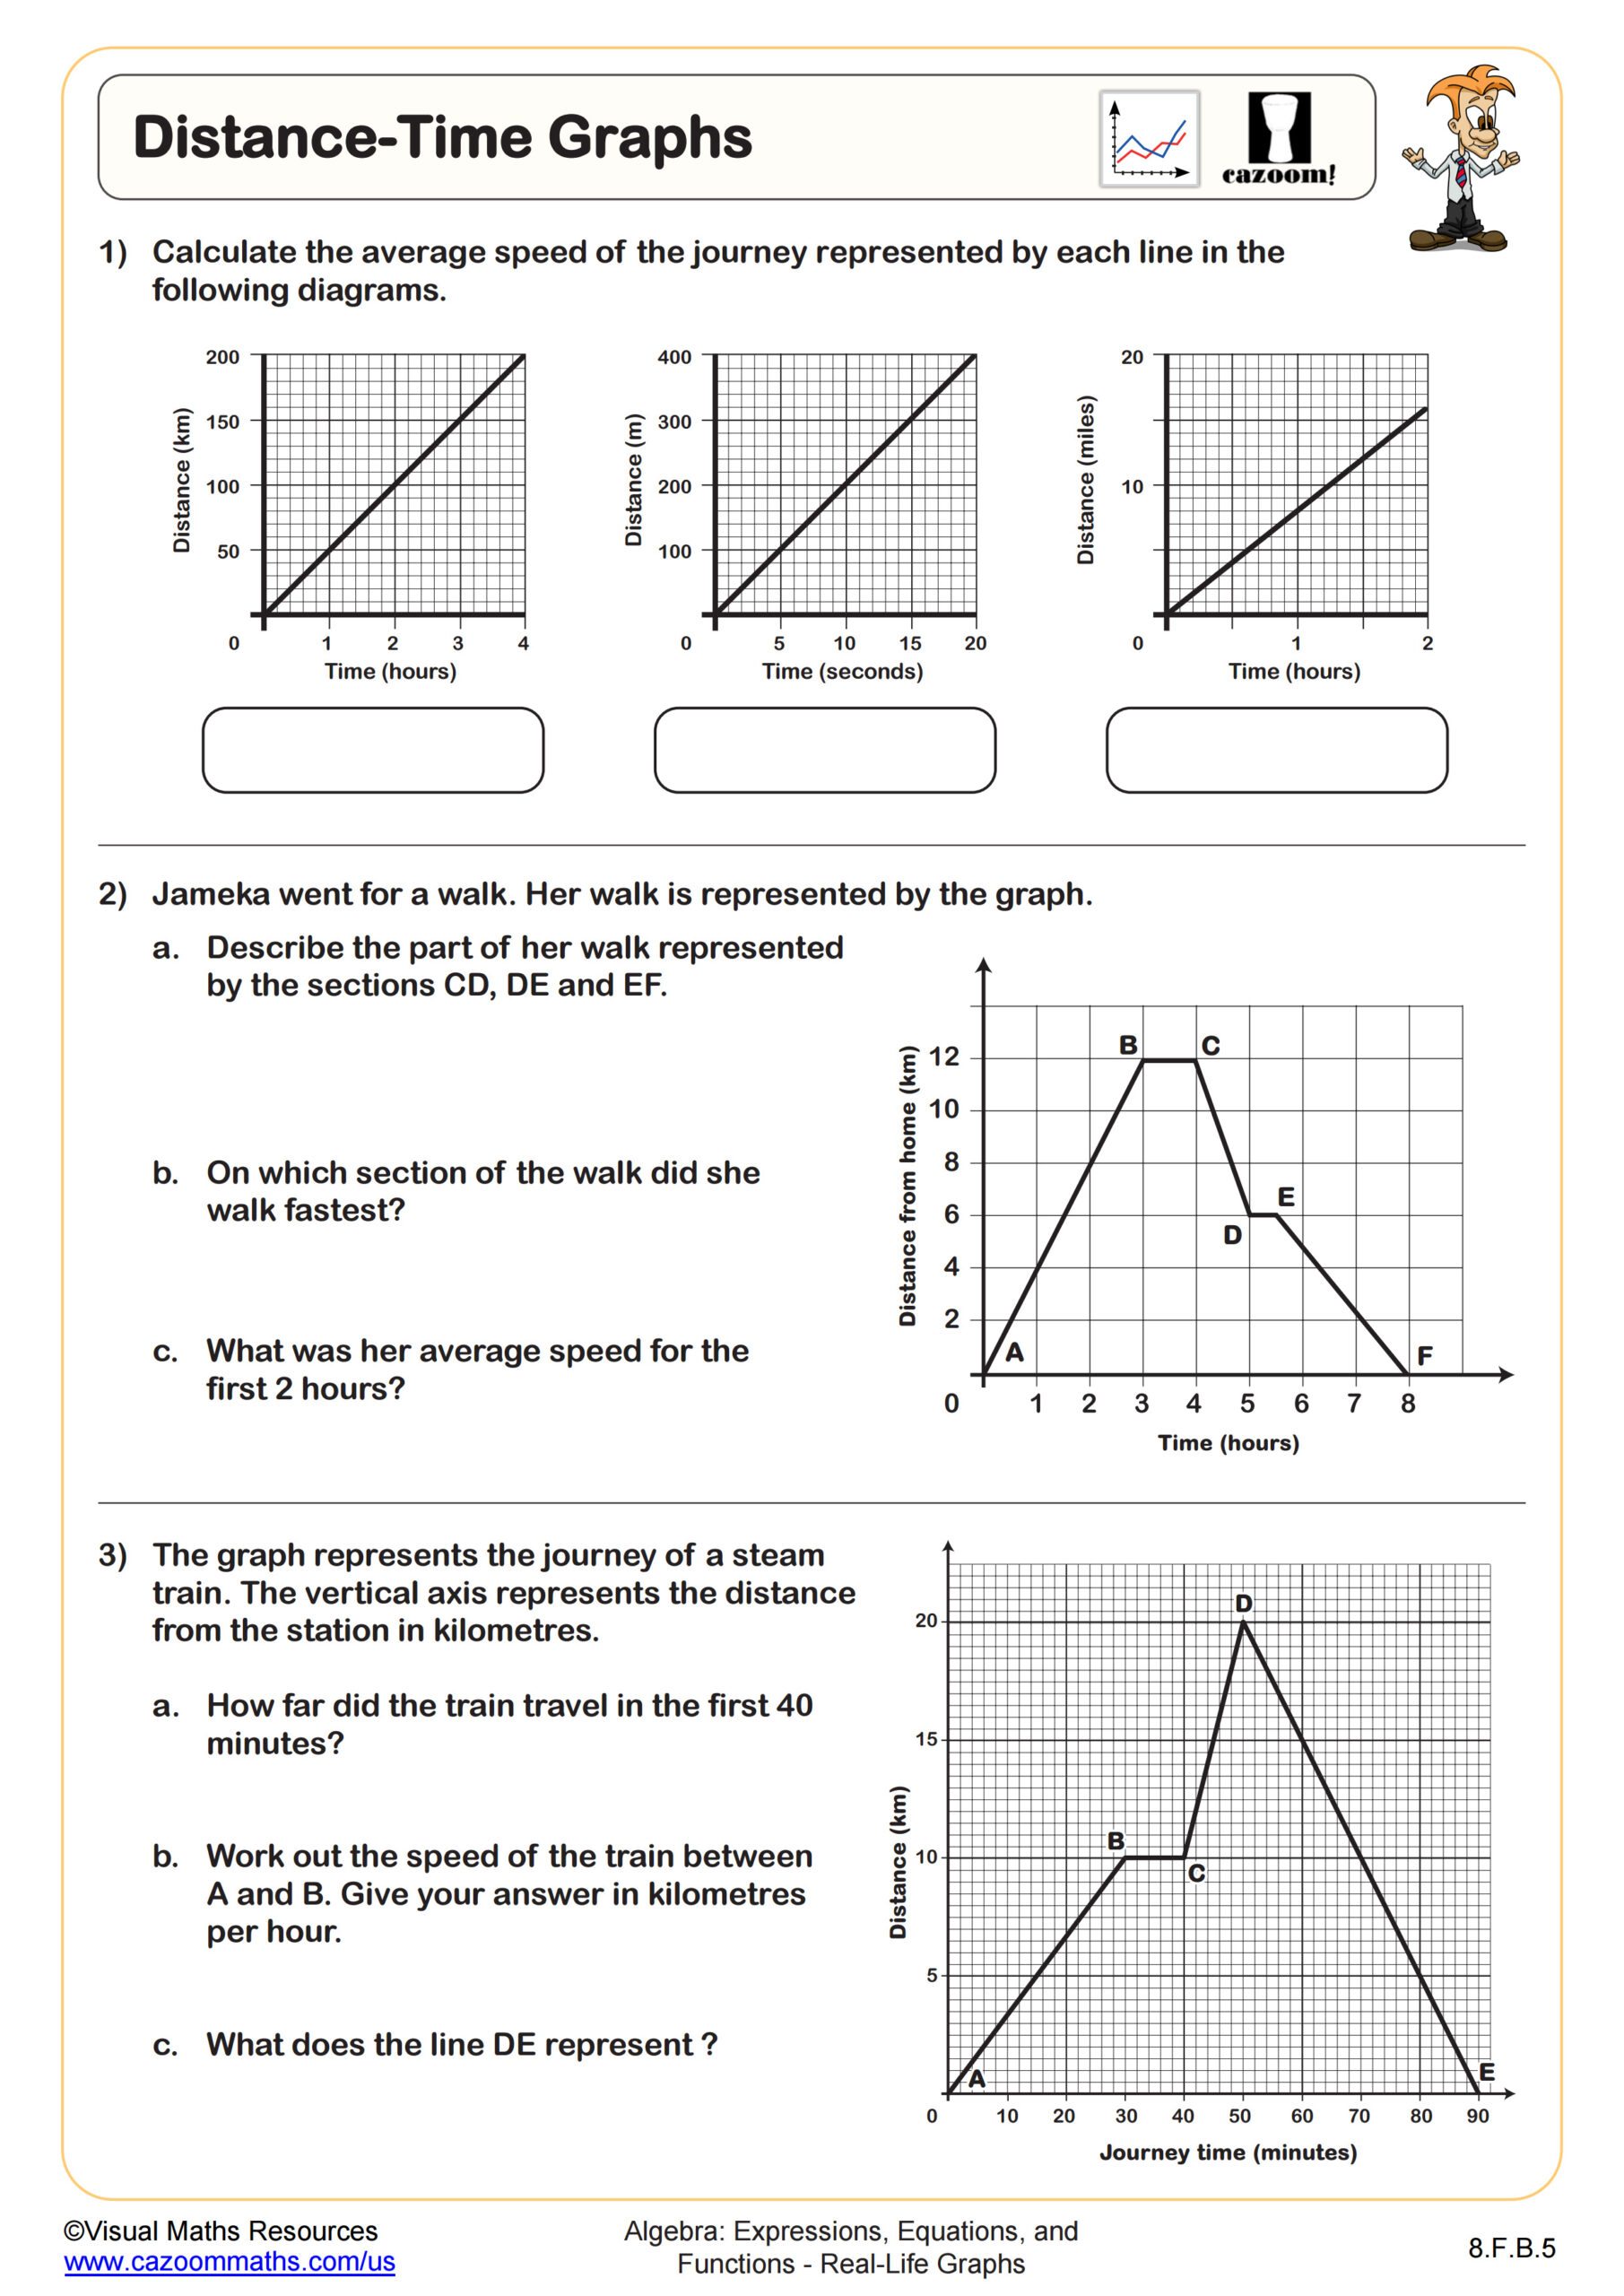
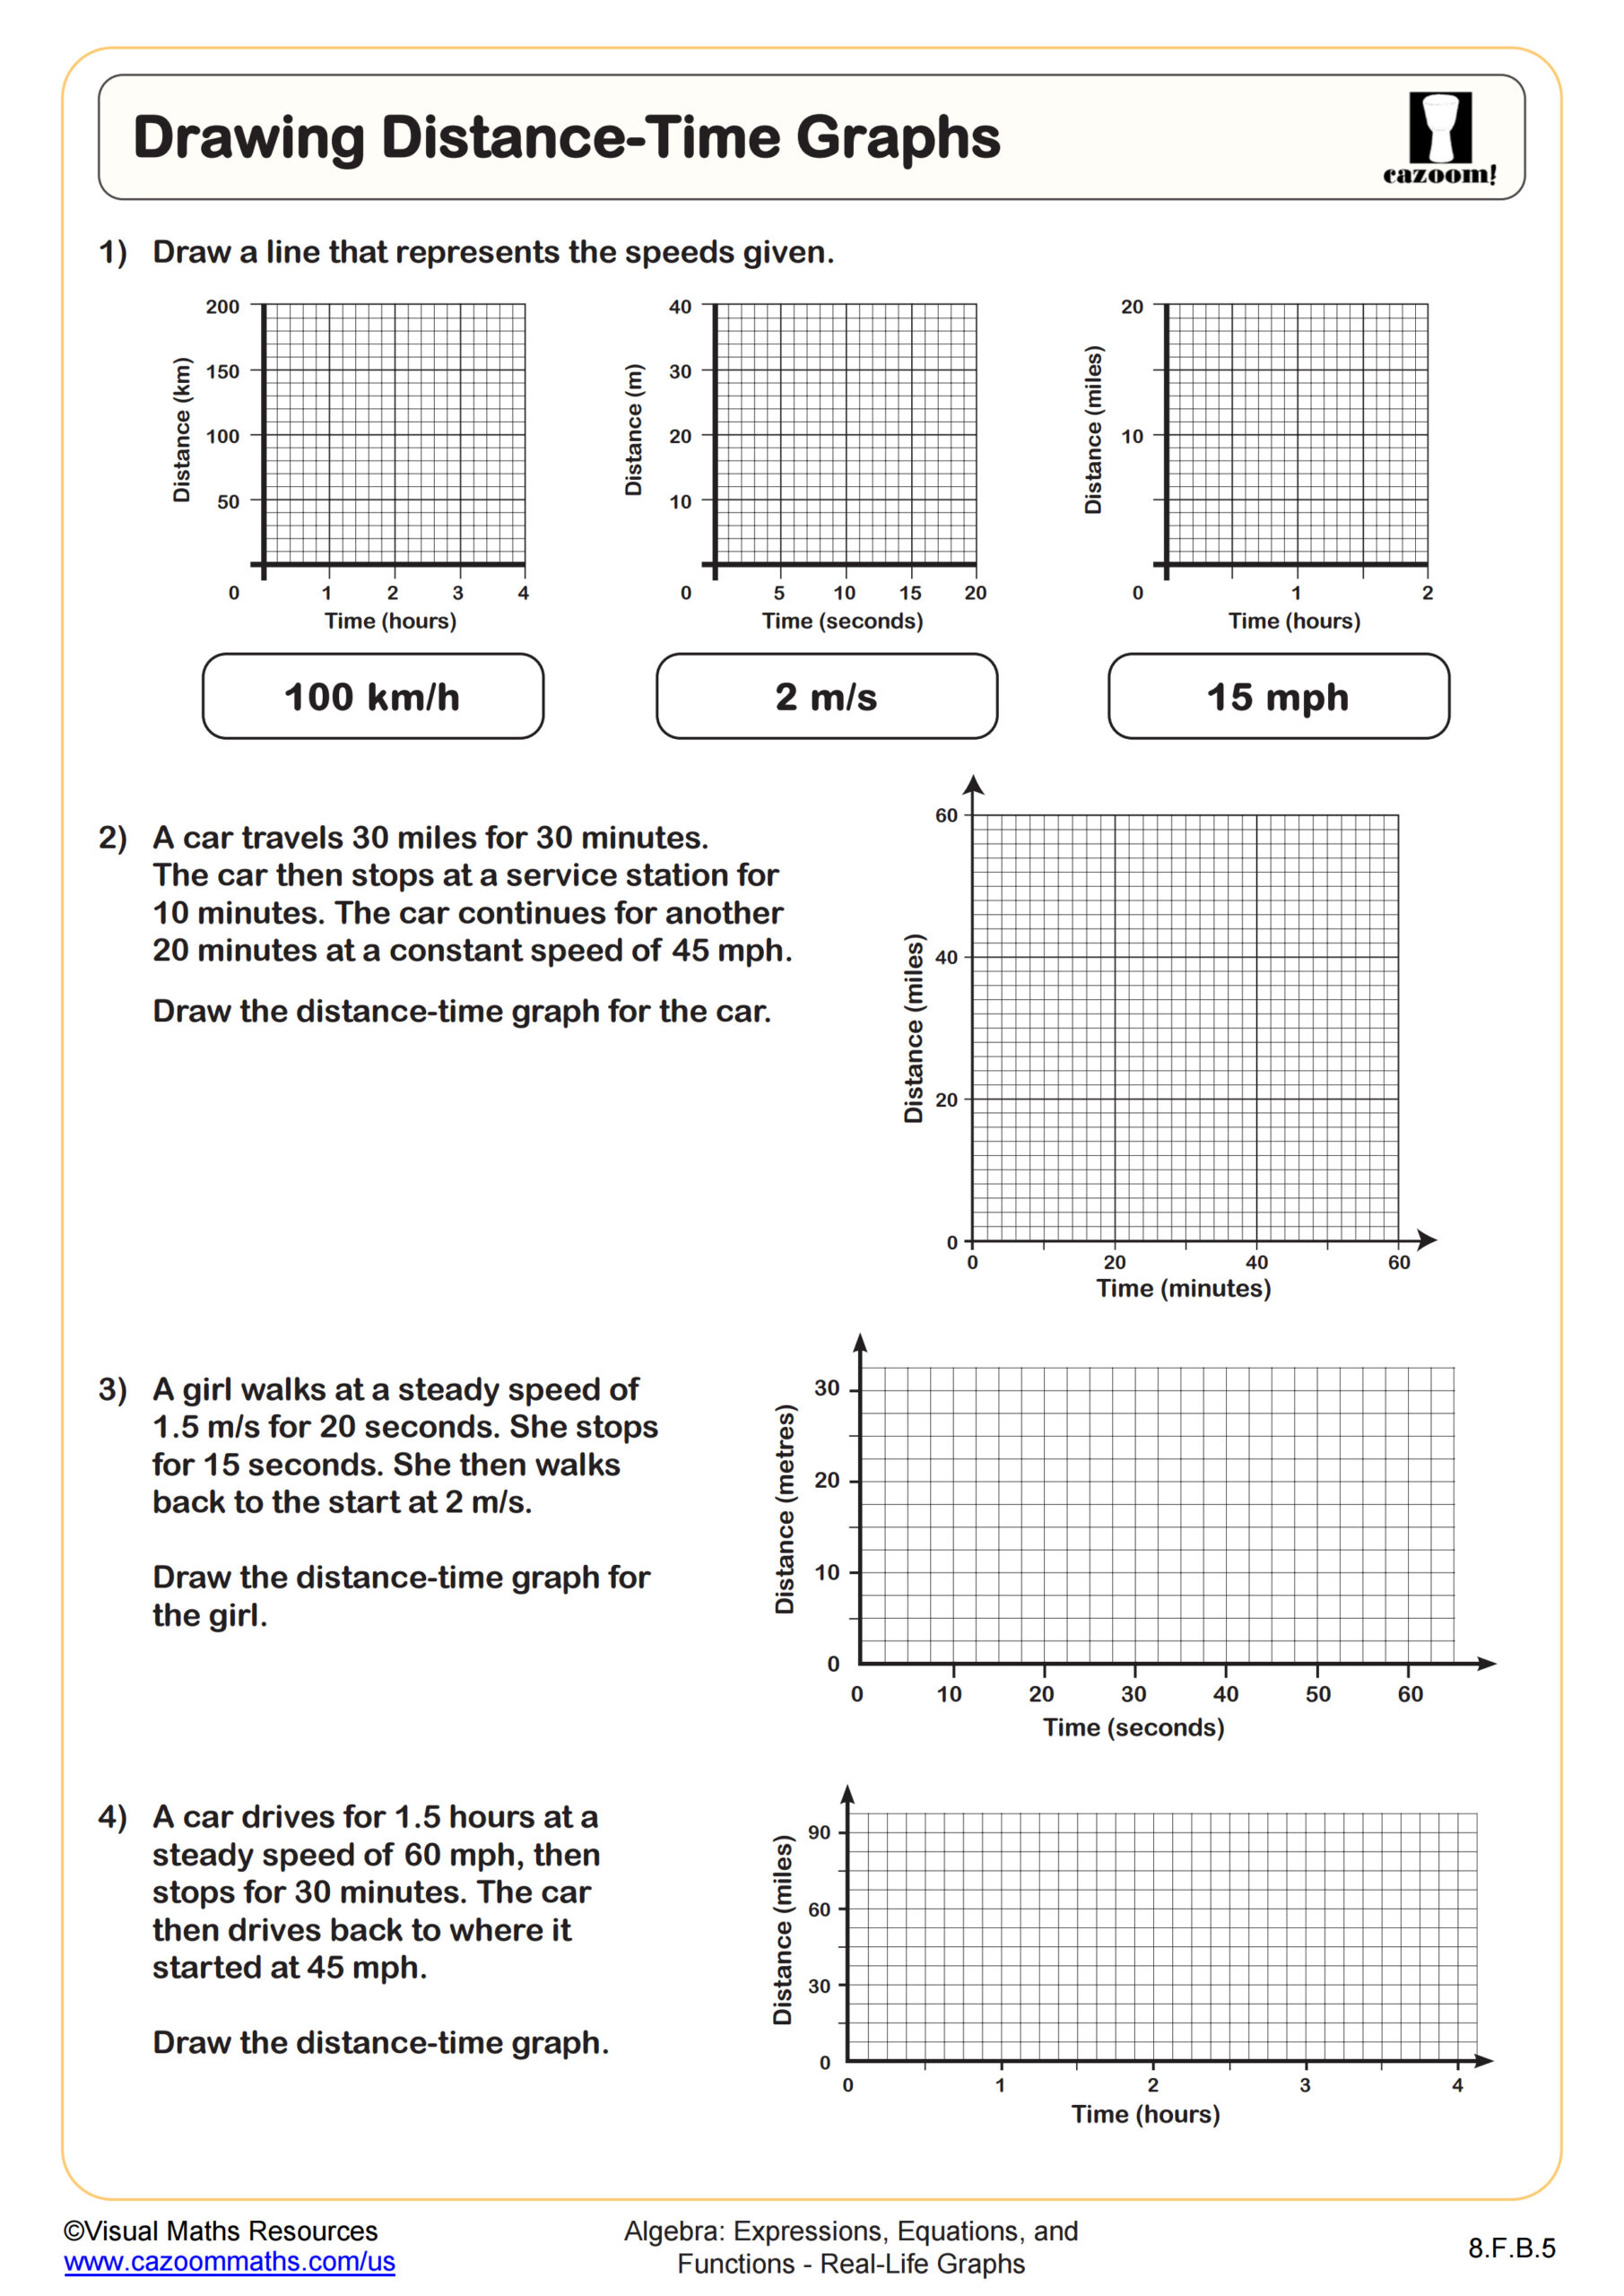
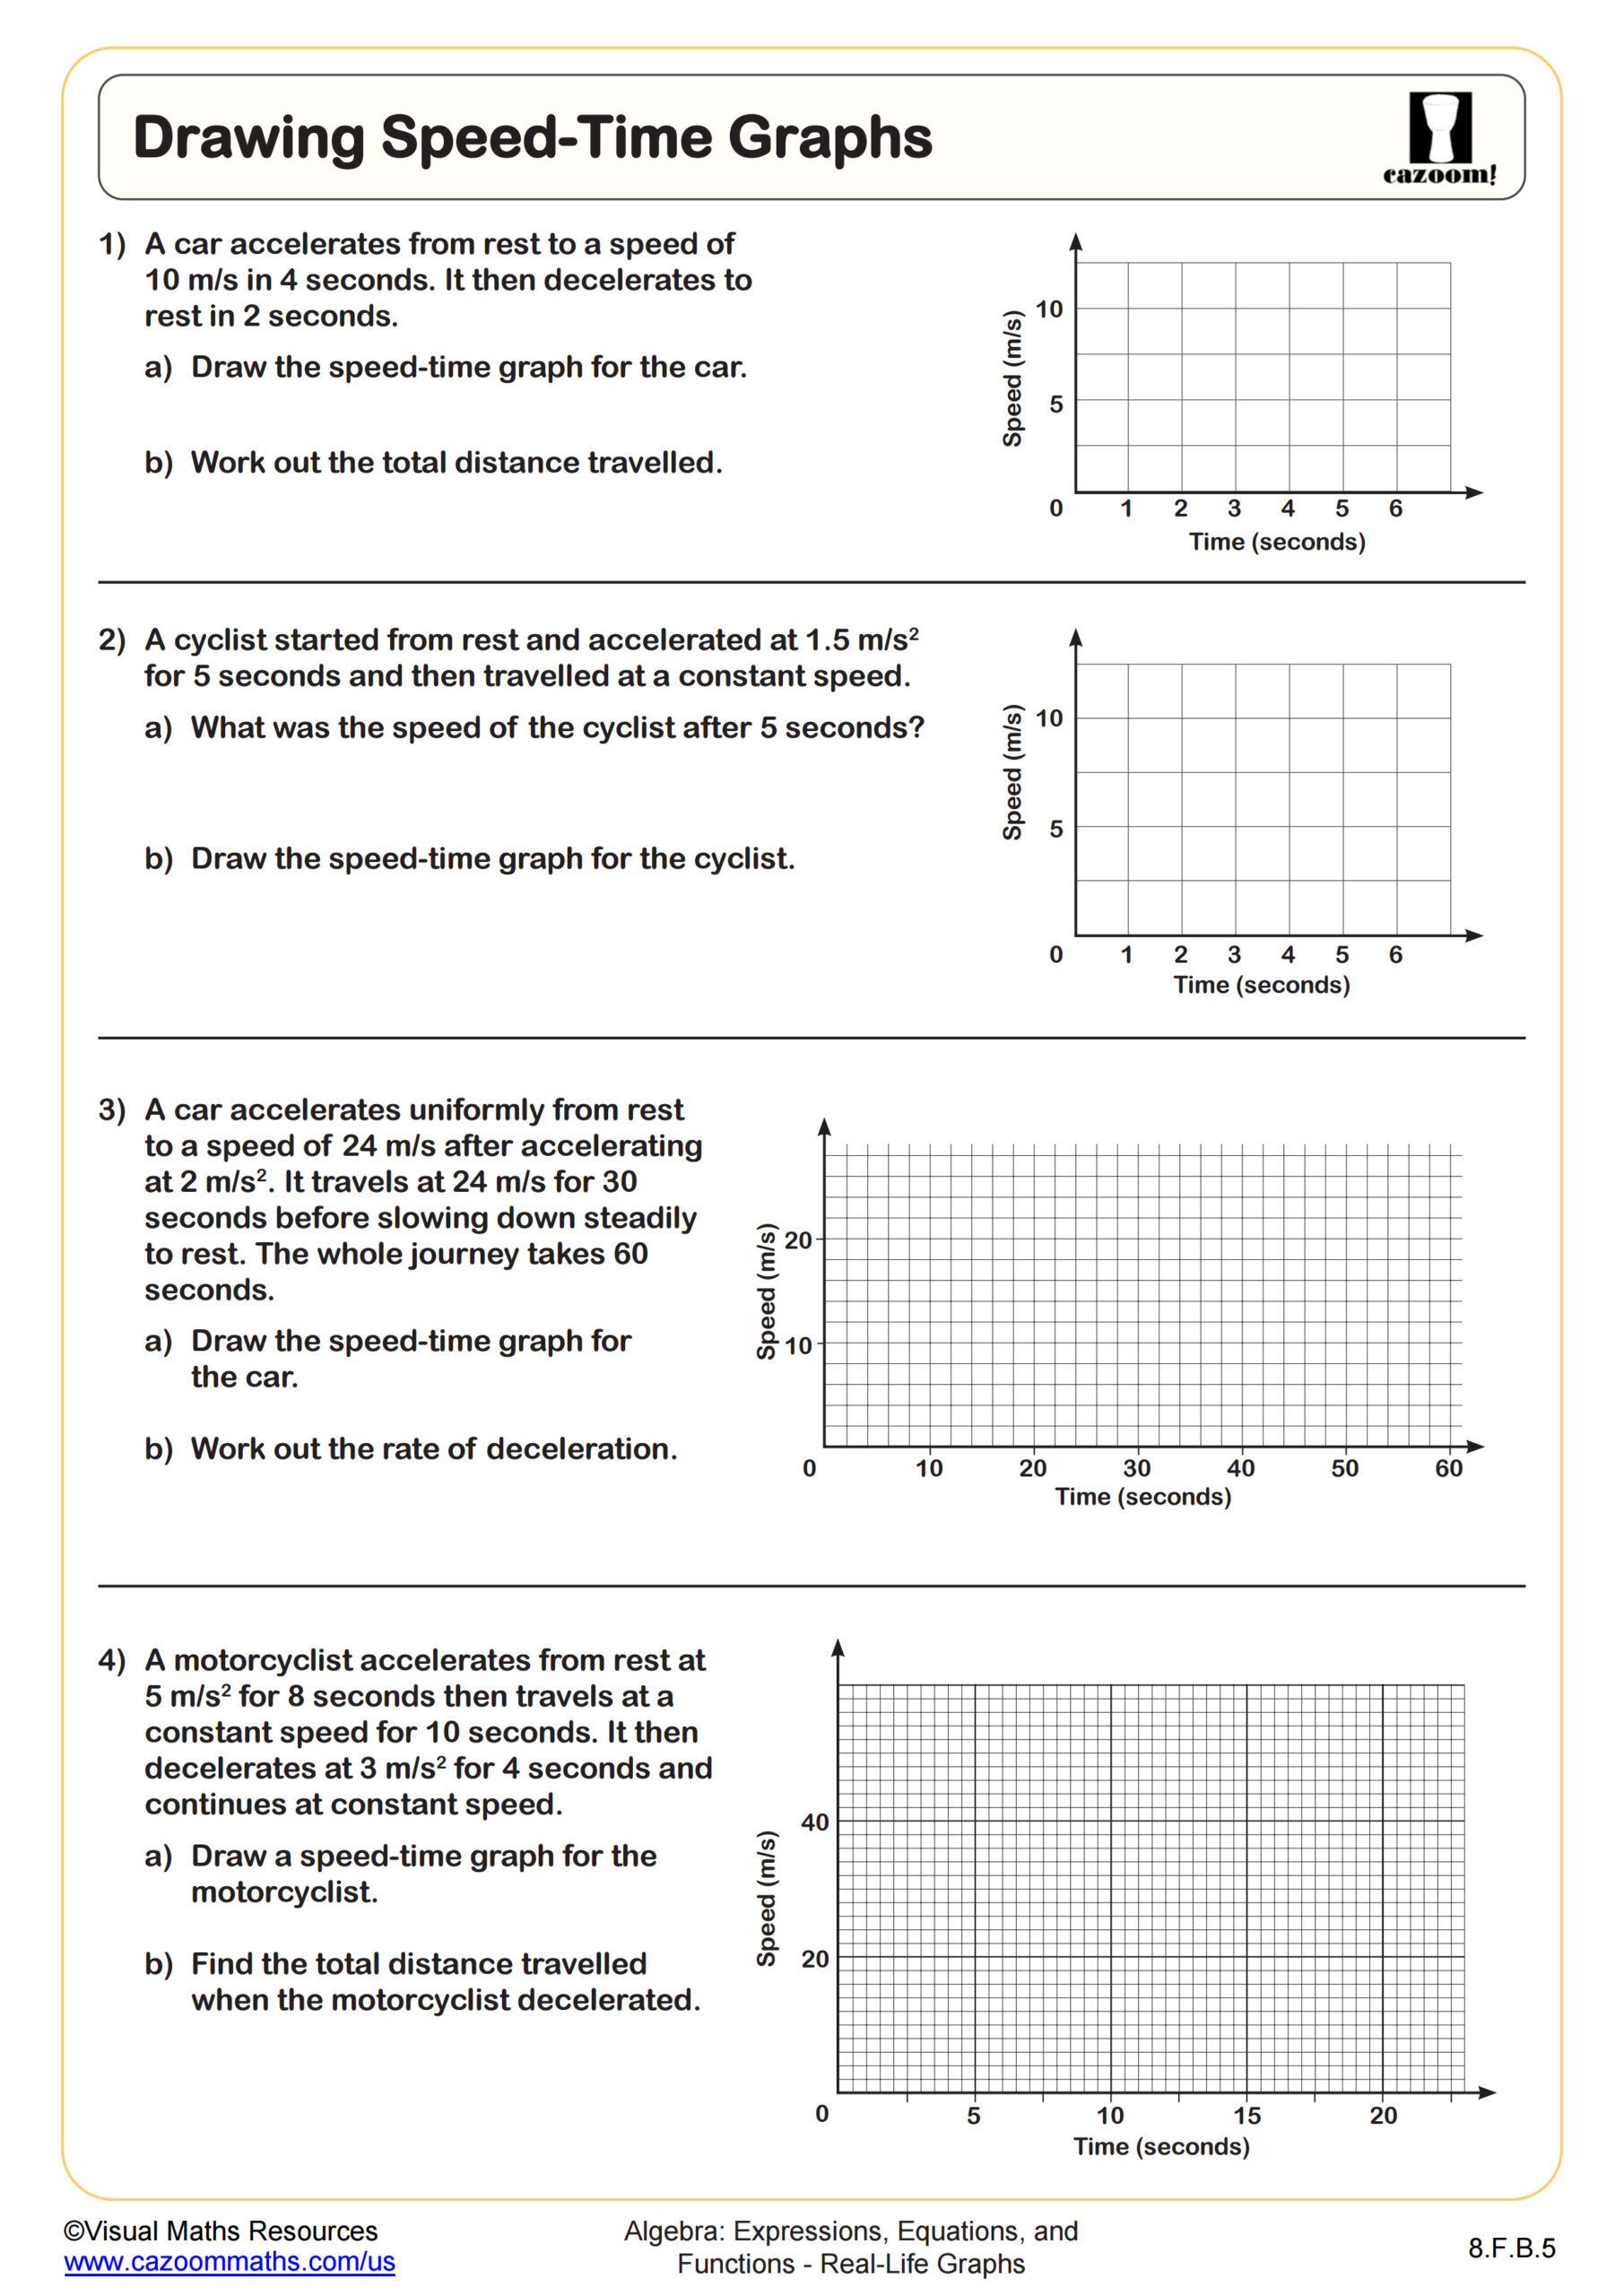
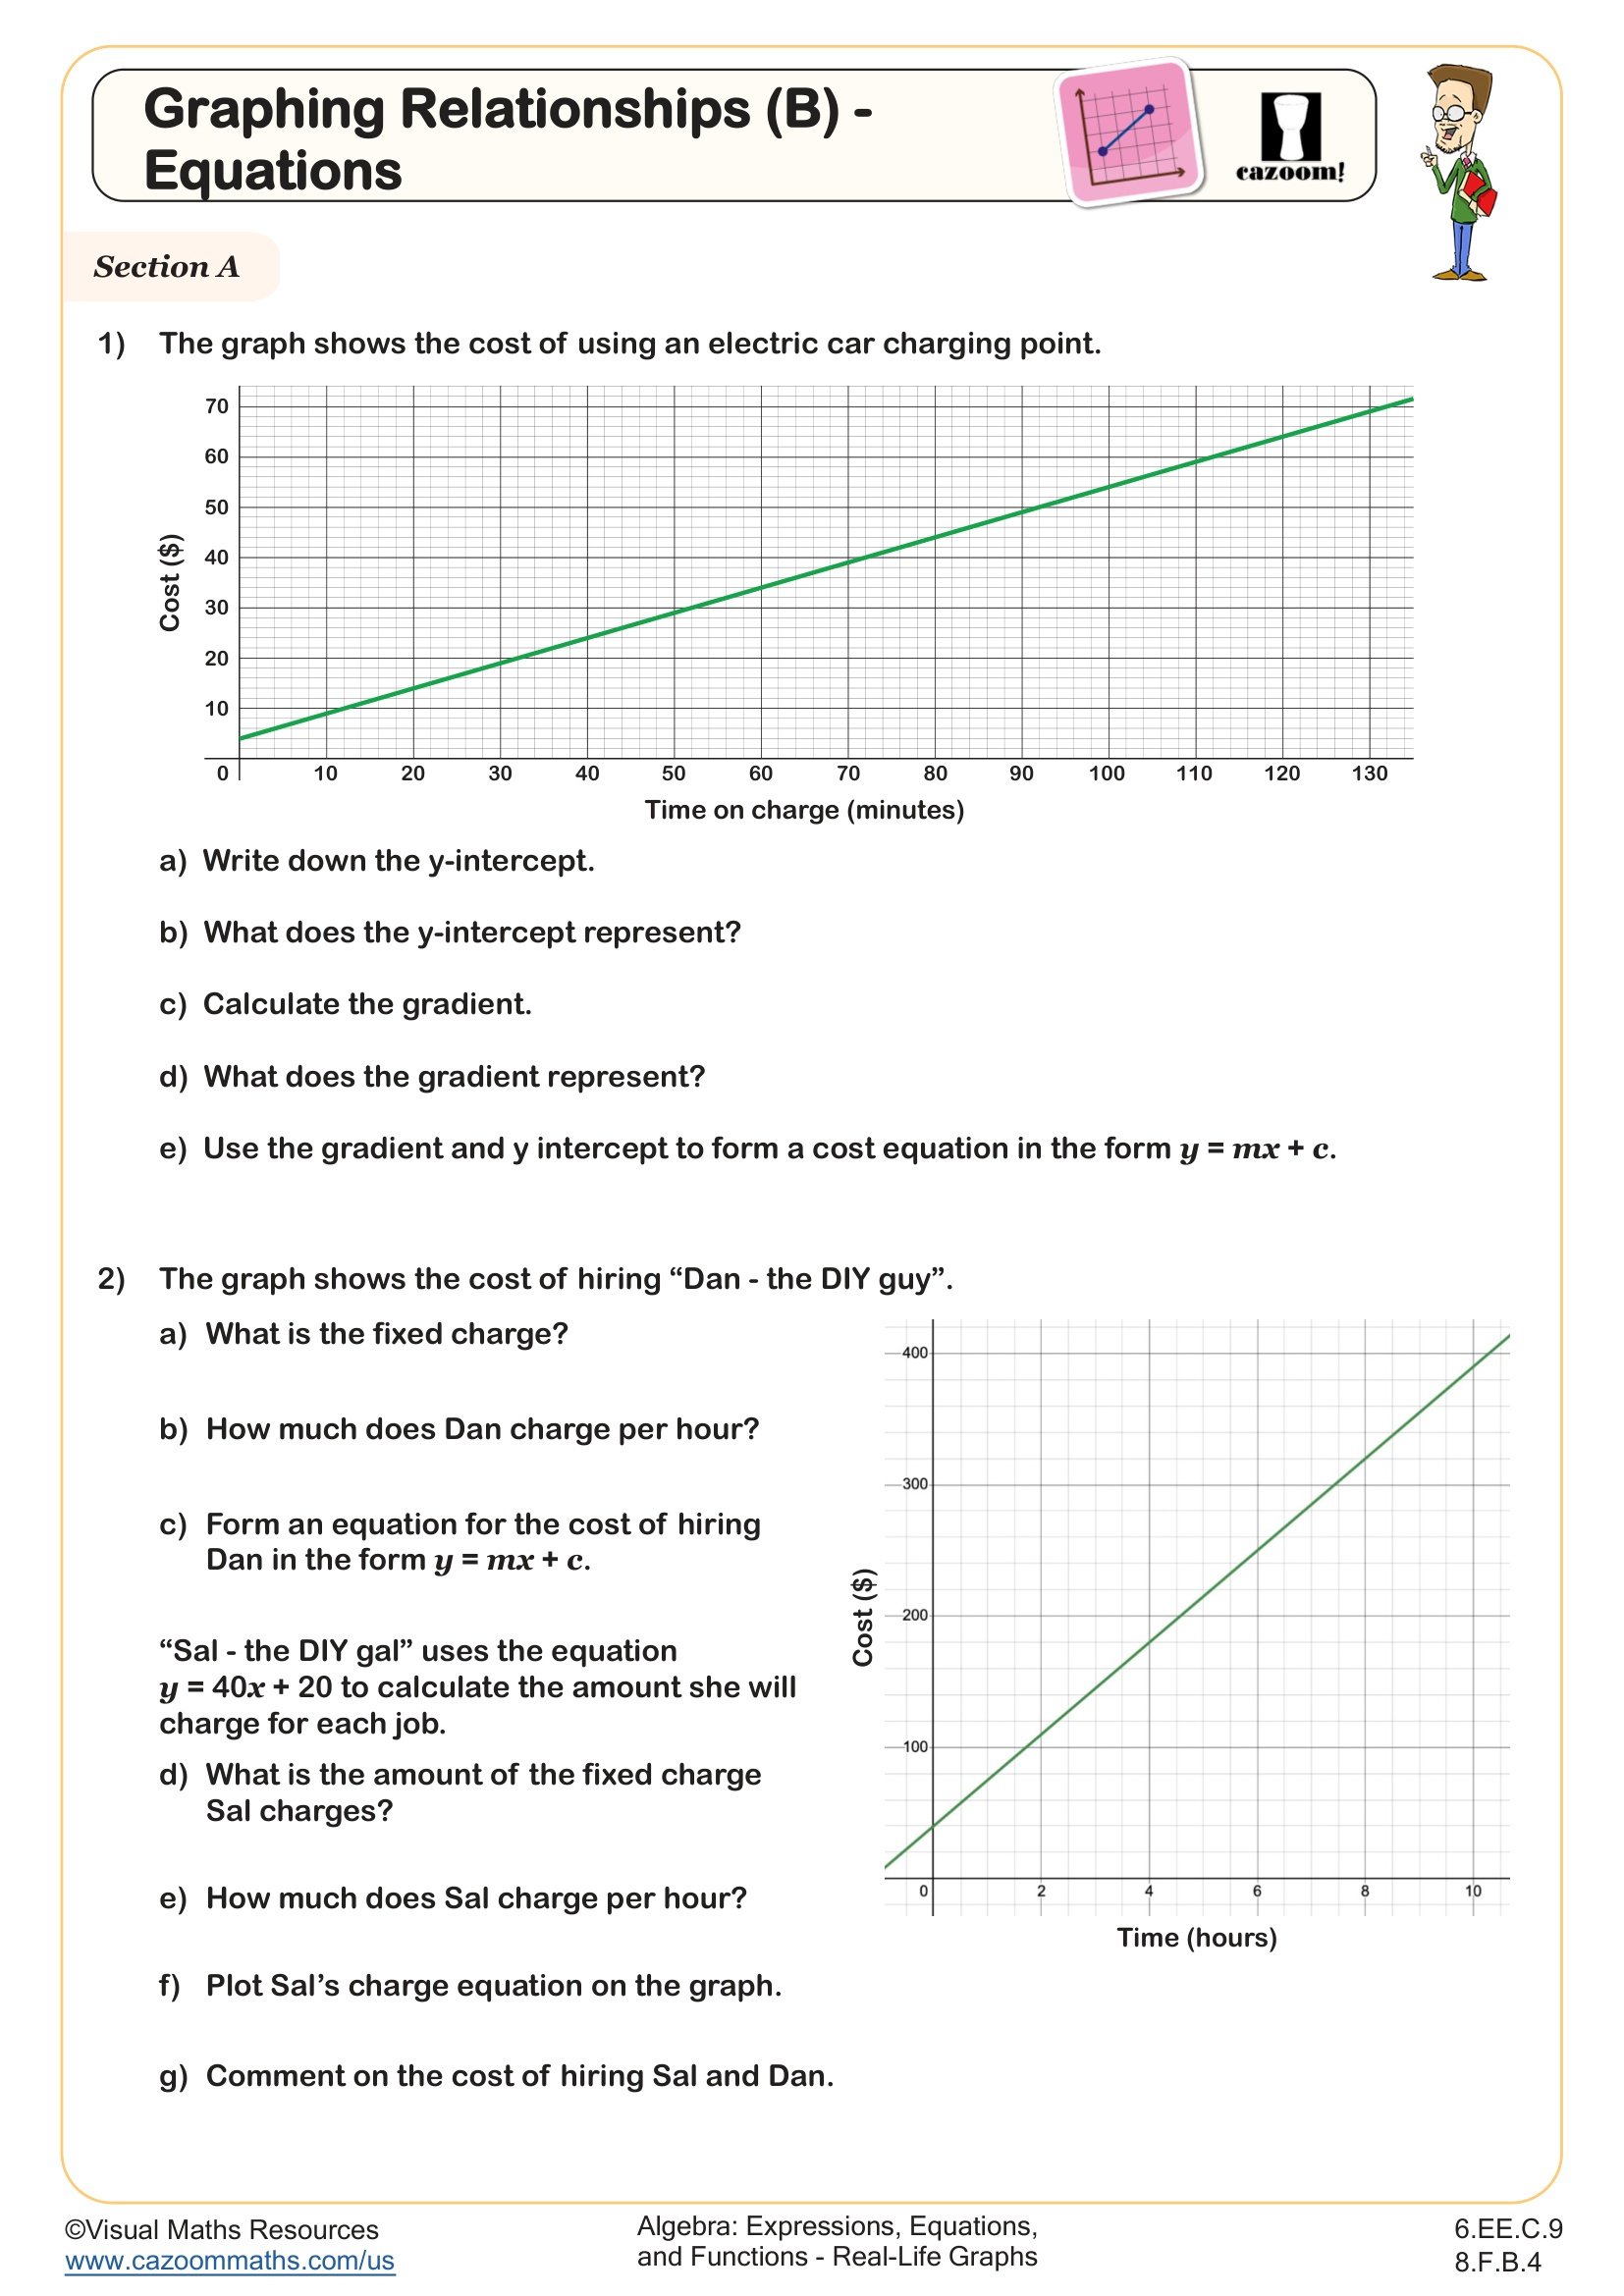
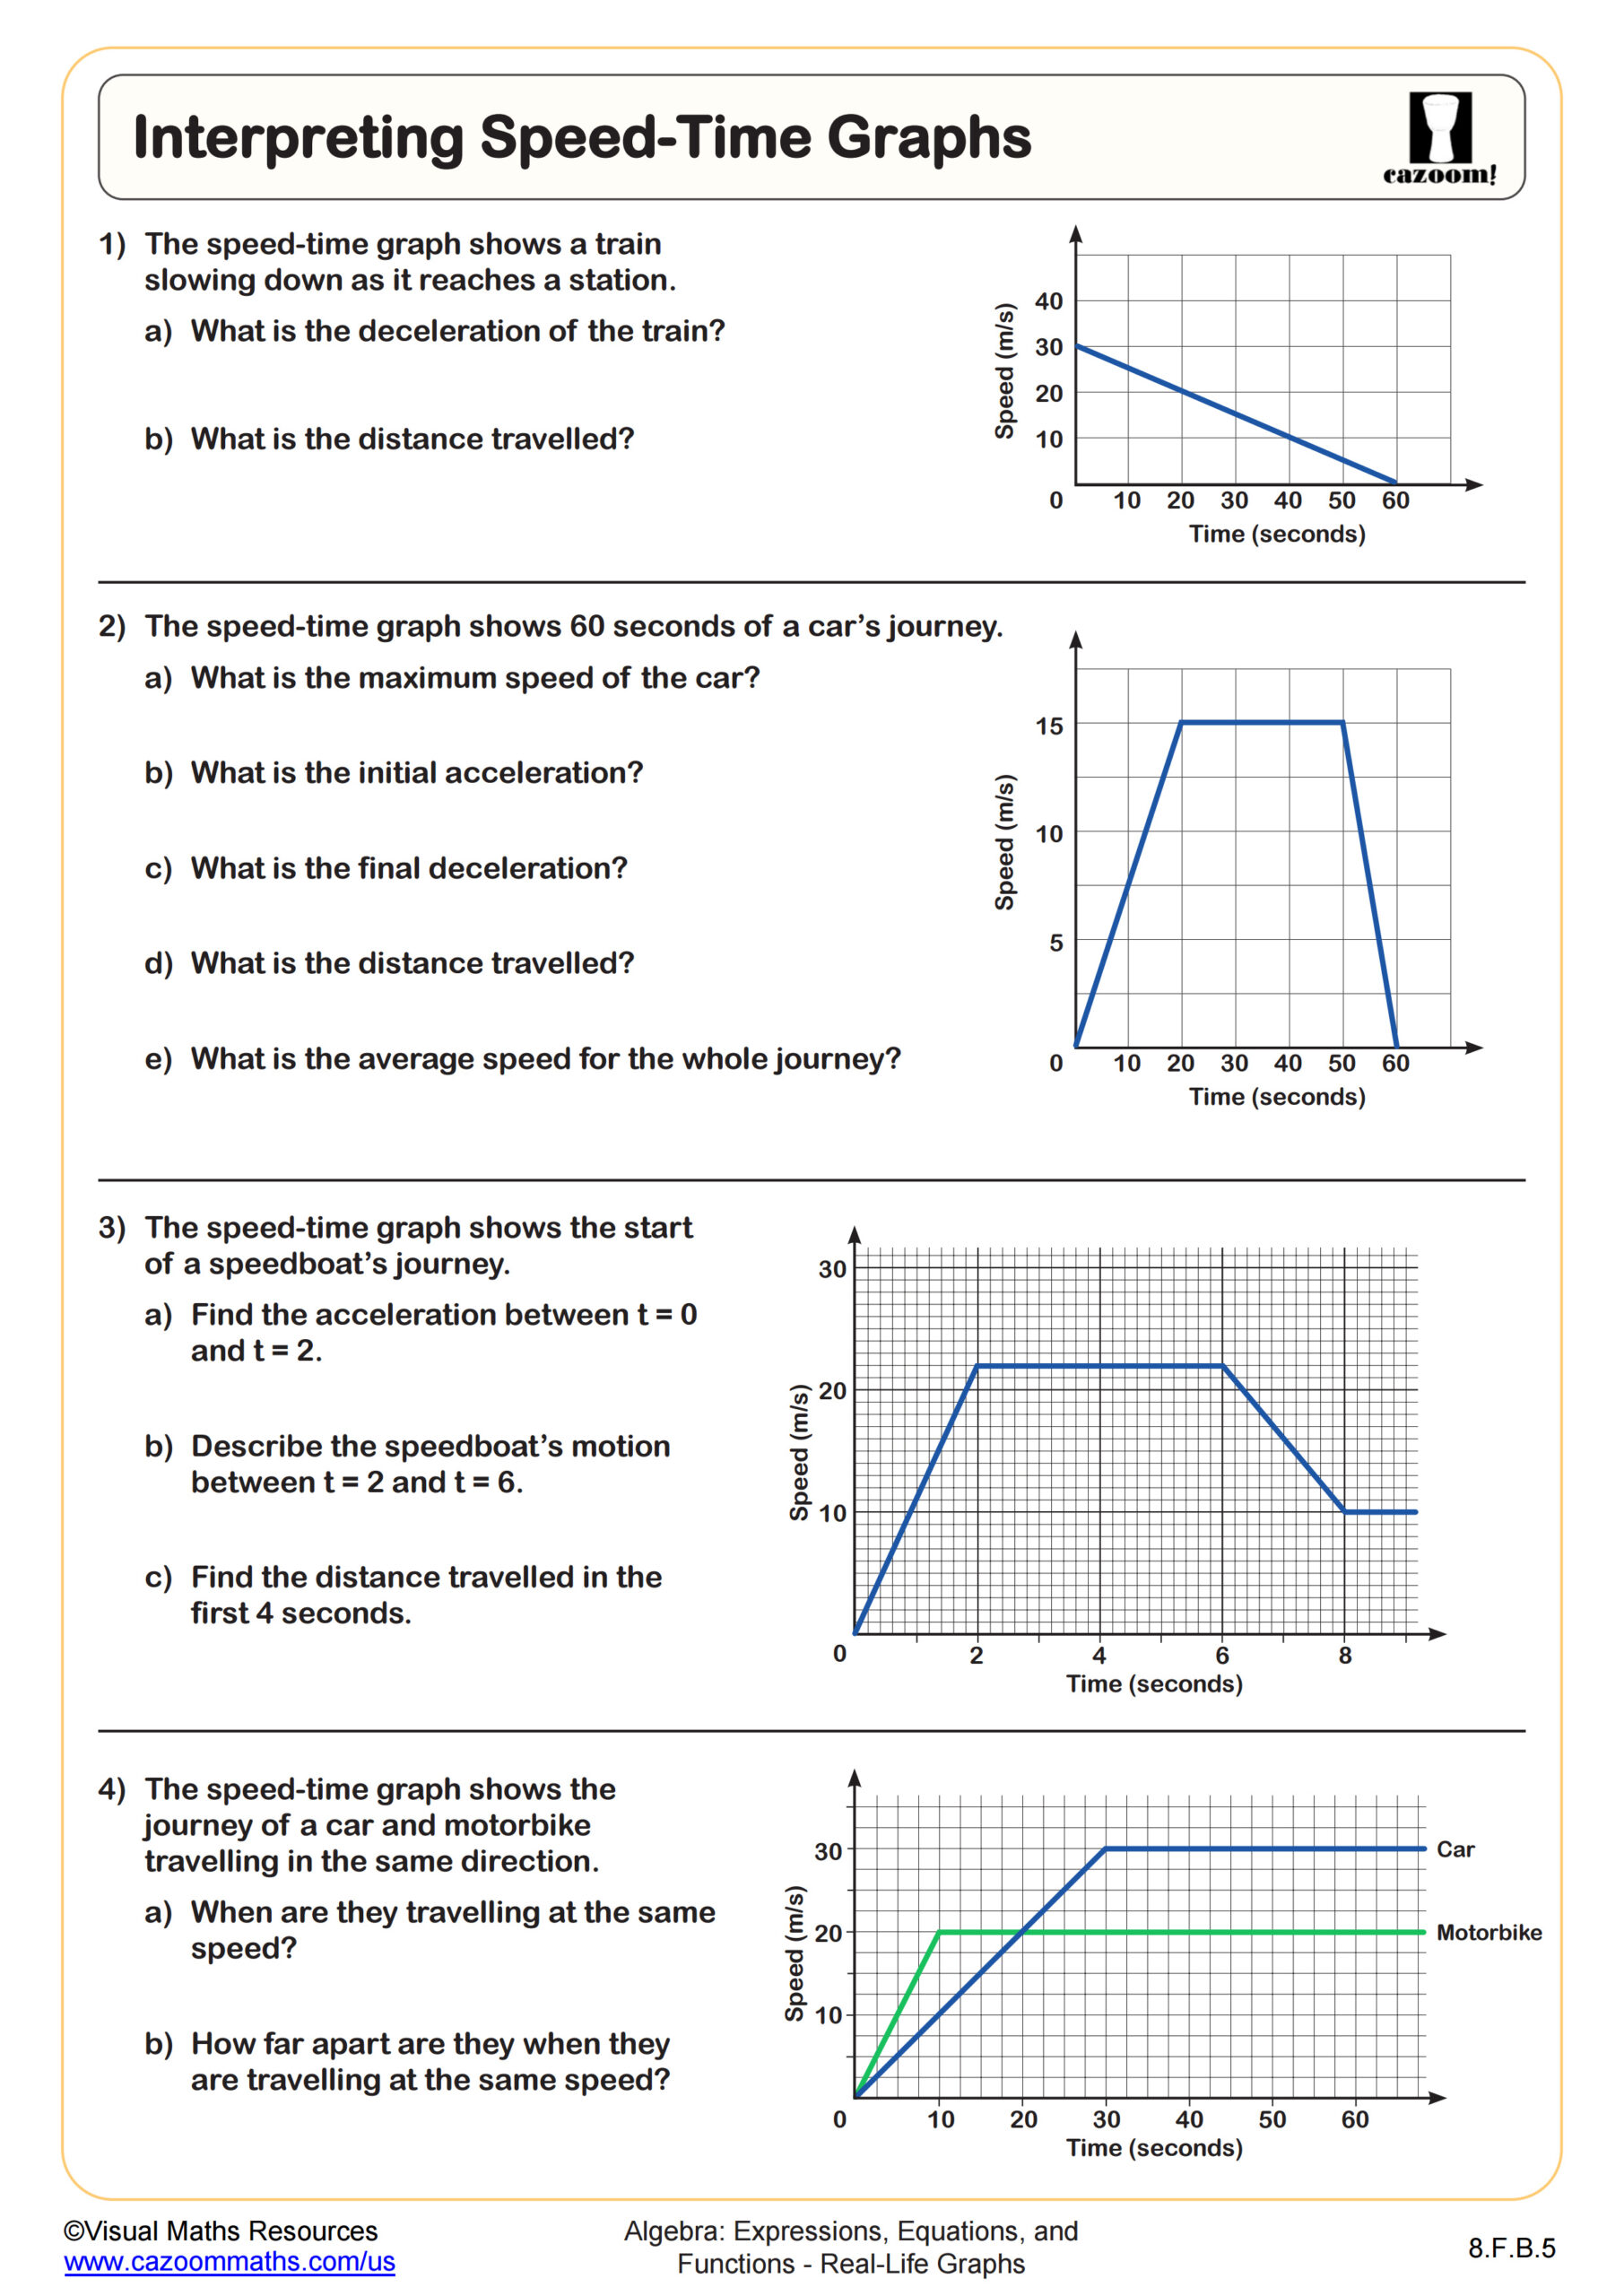
These worksheets help students transition from interpreting real-world motion to representing it graphically and algebraically. Learners read, construct, and analyze graphs showing constant speed, acceleration, and rest periods. Step-by-step answer keys clarify the relationship between distance, speed, and time, reinforcing key problem-solving skills.
Improve Both Confidence and Accuracy With These Middle School Algebra Resources
The sheets contain pre-made problems that range from basic to challenging levels, so you can provide individualized learning without needing to create different materials. Students who require assistance work on reading and labeling tasks, but students with better abilities work on multi-step routes and equation development for the same subject. The scaffolding system within the range saves teachers time for planning because it includes built-in support for students with different learning abilities.
The answer keys demonstrate the solution process in addition to showing the final results, which helps students understand the correct approach to their mistakes. The worksheets function as teaching tools for whole-class instruction, individual work, and retrieval practice activities. The books work well for homework because parents can use the step-by-step solutions in the examples. The system allows students to check their work independently, which decreases your grading responsibilities so you can dedicate time to addressing shared student errors during class discussions.
Where These Graph Reading Skills Apply Beyond School
Real-life graphs help students understand how rates change and how trends and quantity relationships appear in various situations. The ability to identify actual events through graph shapes enables students to develop critical thinking skills, which they can apply to science lab work, budget planning, and analyzing news data.
•Compare travel times and speeds to plan routes.
•Read fitness app pace and distance.
•Analyse weather changes like temperature and rainfall.
•Track savings growth or monthly costs.