Middle School Real Life Graphs Worksheets
All worksheets are created by the team of experienced teachers at Cazoom Math.
What Are Real Life Graphs and Why Do Students Study Them?
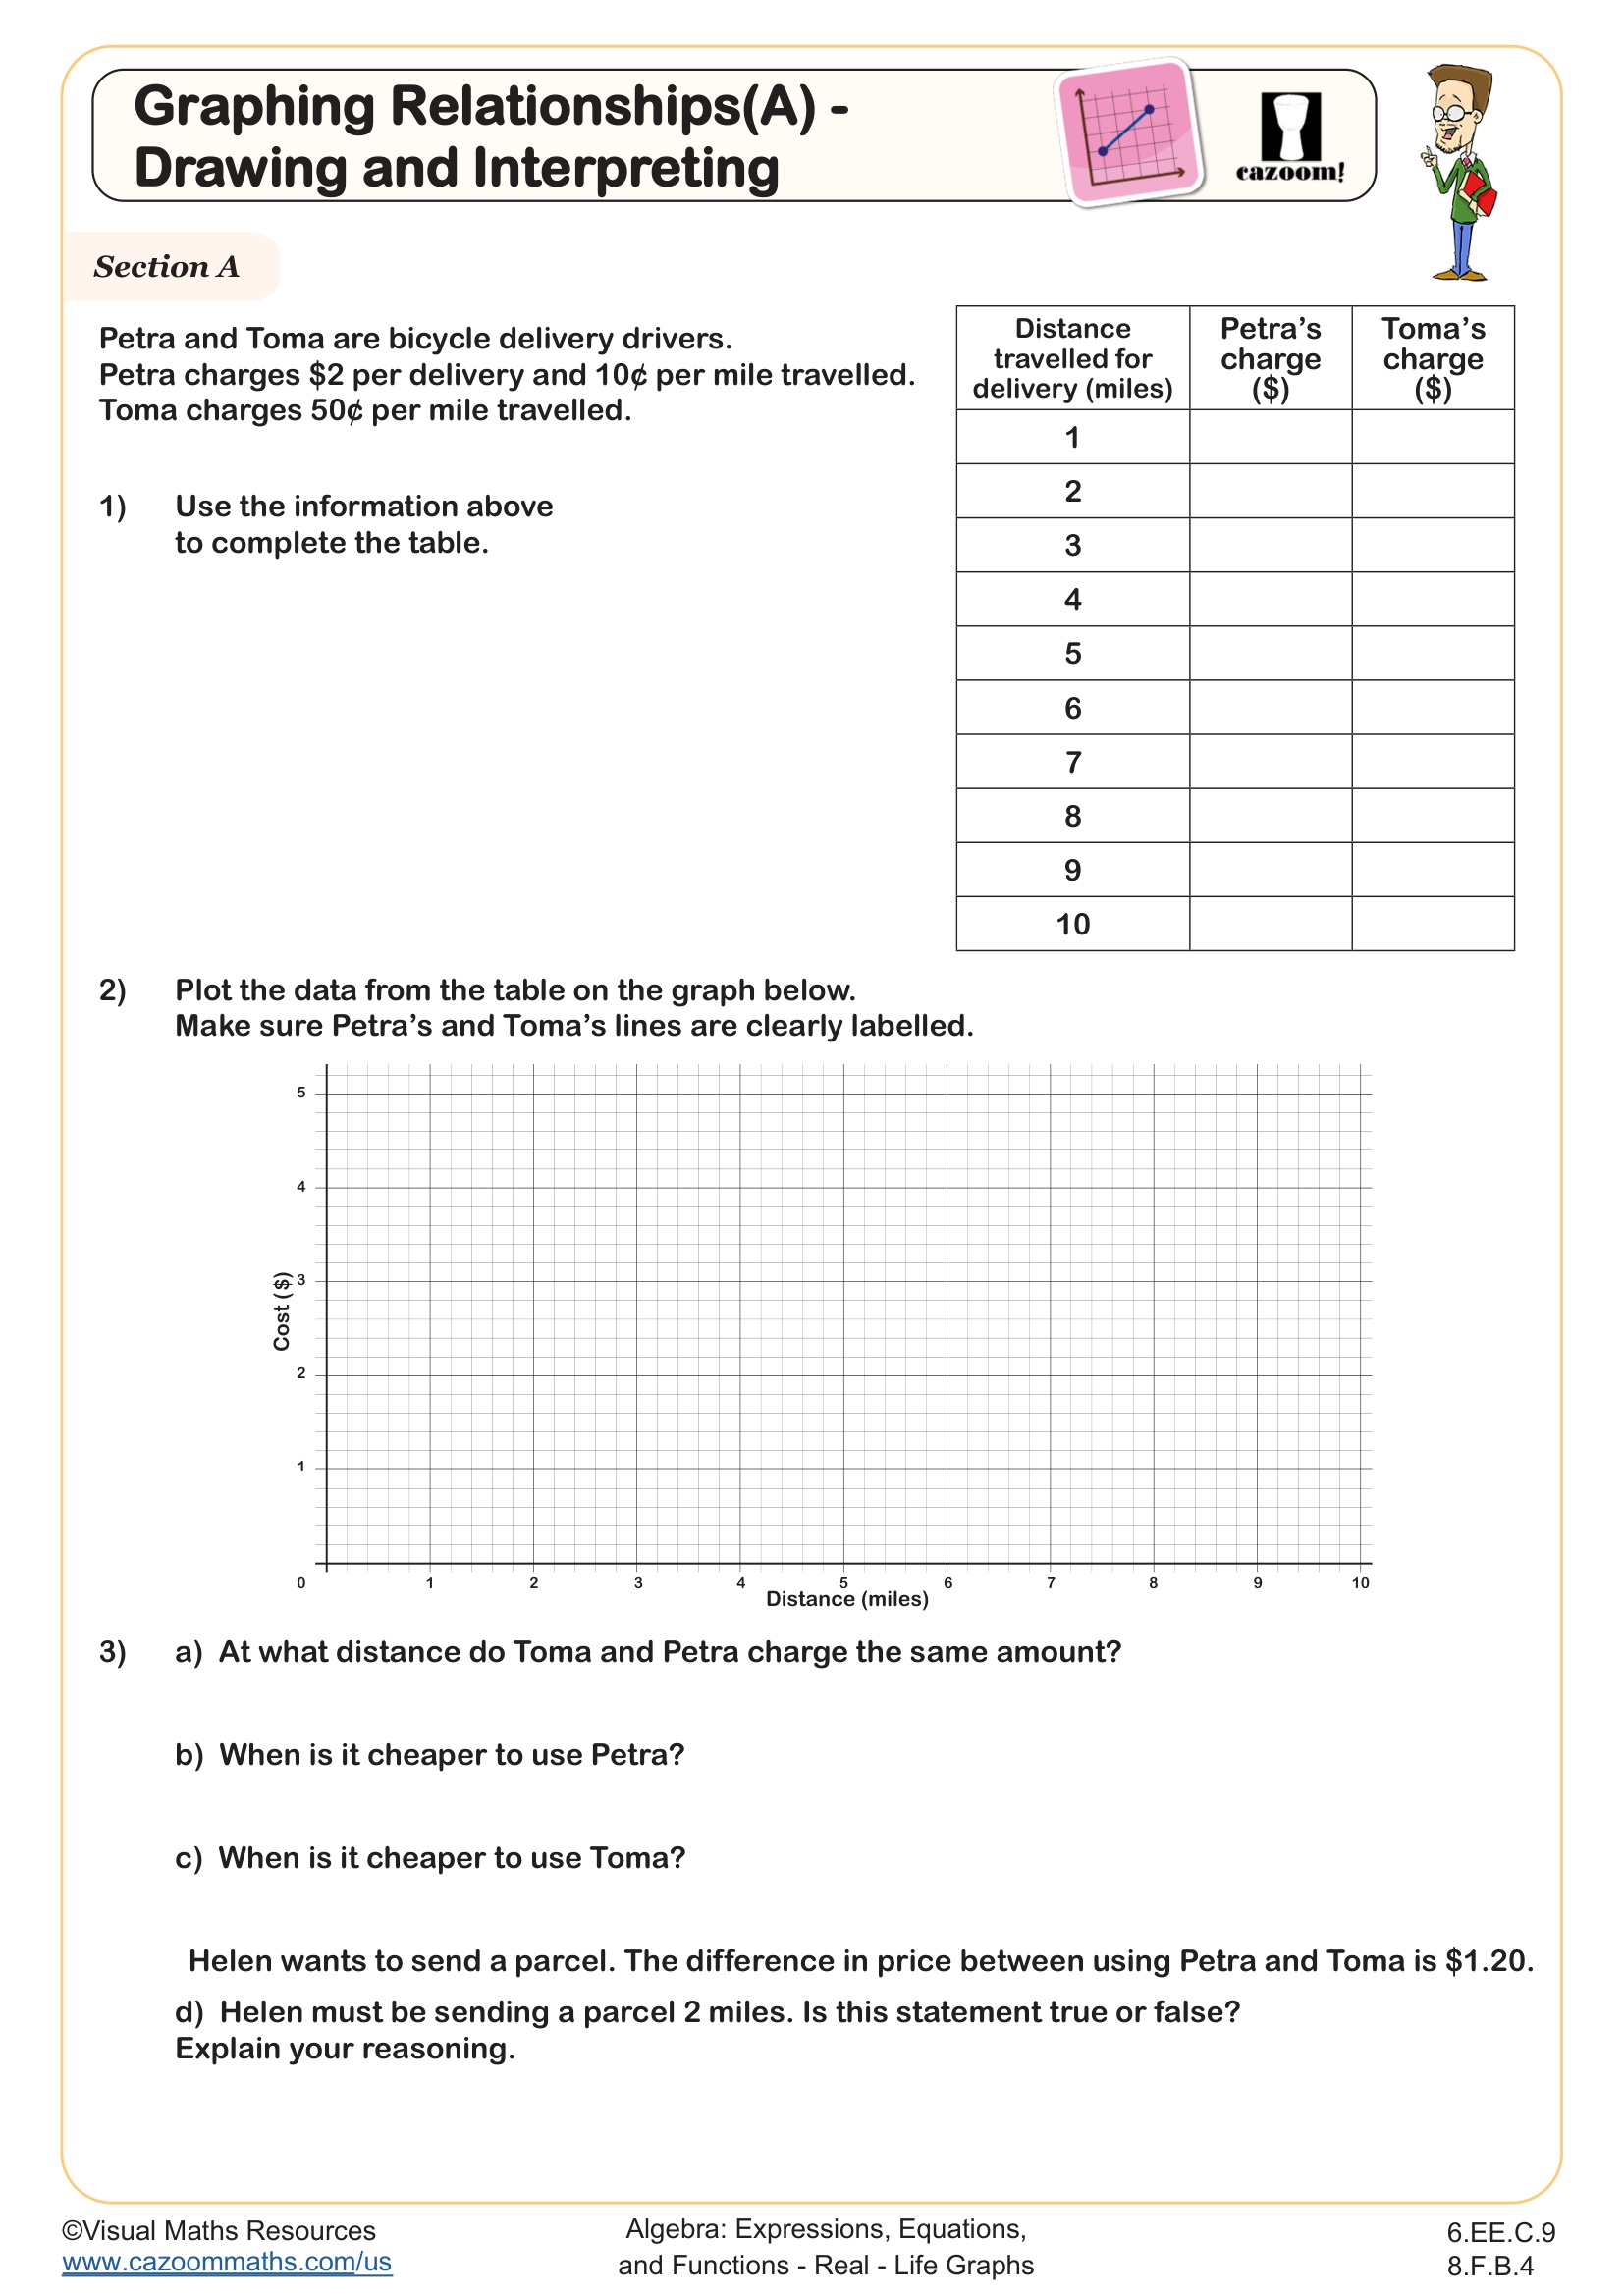
Real life graphs represent relationships between variables in everyday contexts, such as how water level changes as you fill a uniquely shaped vase, or how distance from home changes during a bike ride. Middle school students study these graphs to develop the analytical skills needed to translate between verbal descriptions, graphical representations, and mathematical relationships. This topic aligns with Common Core standards that emphasize interpreting functions in context and using graphs to model relationships.
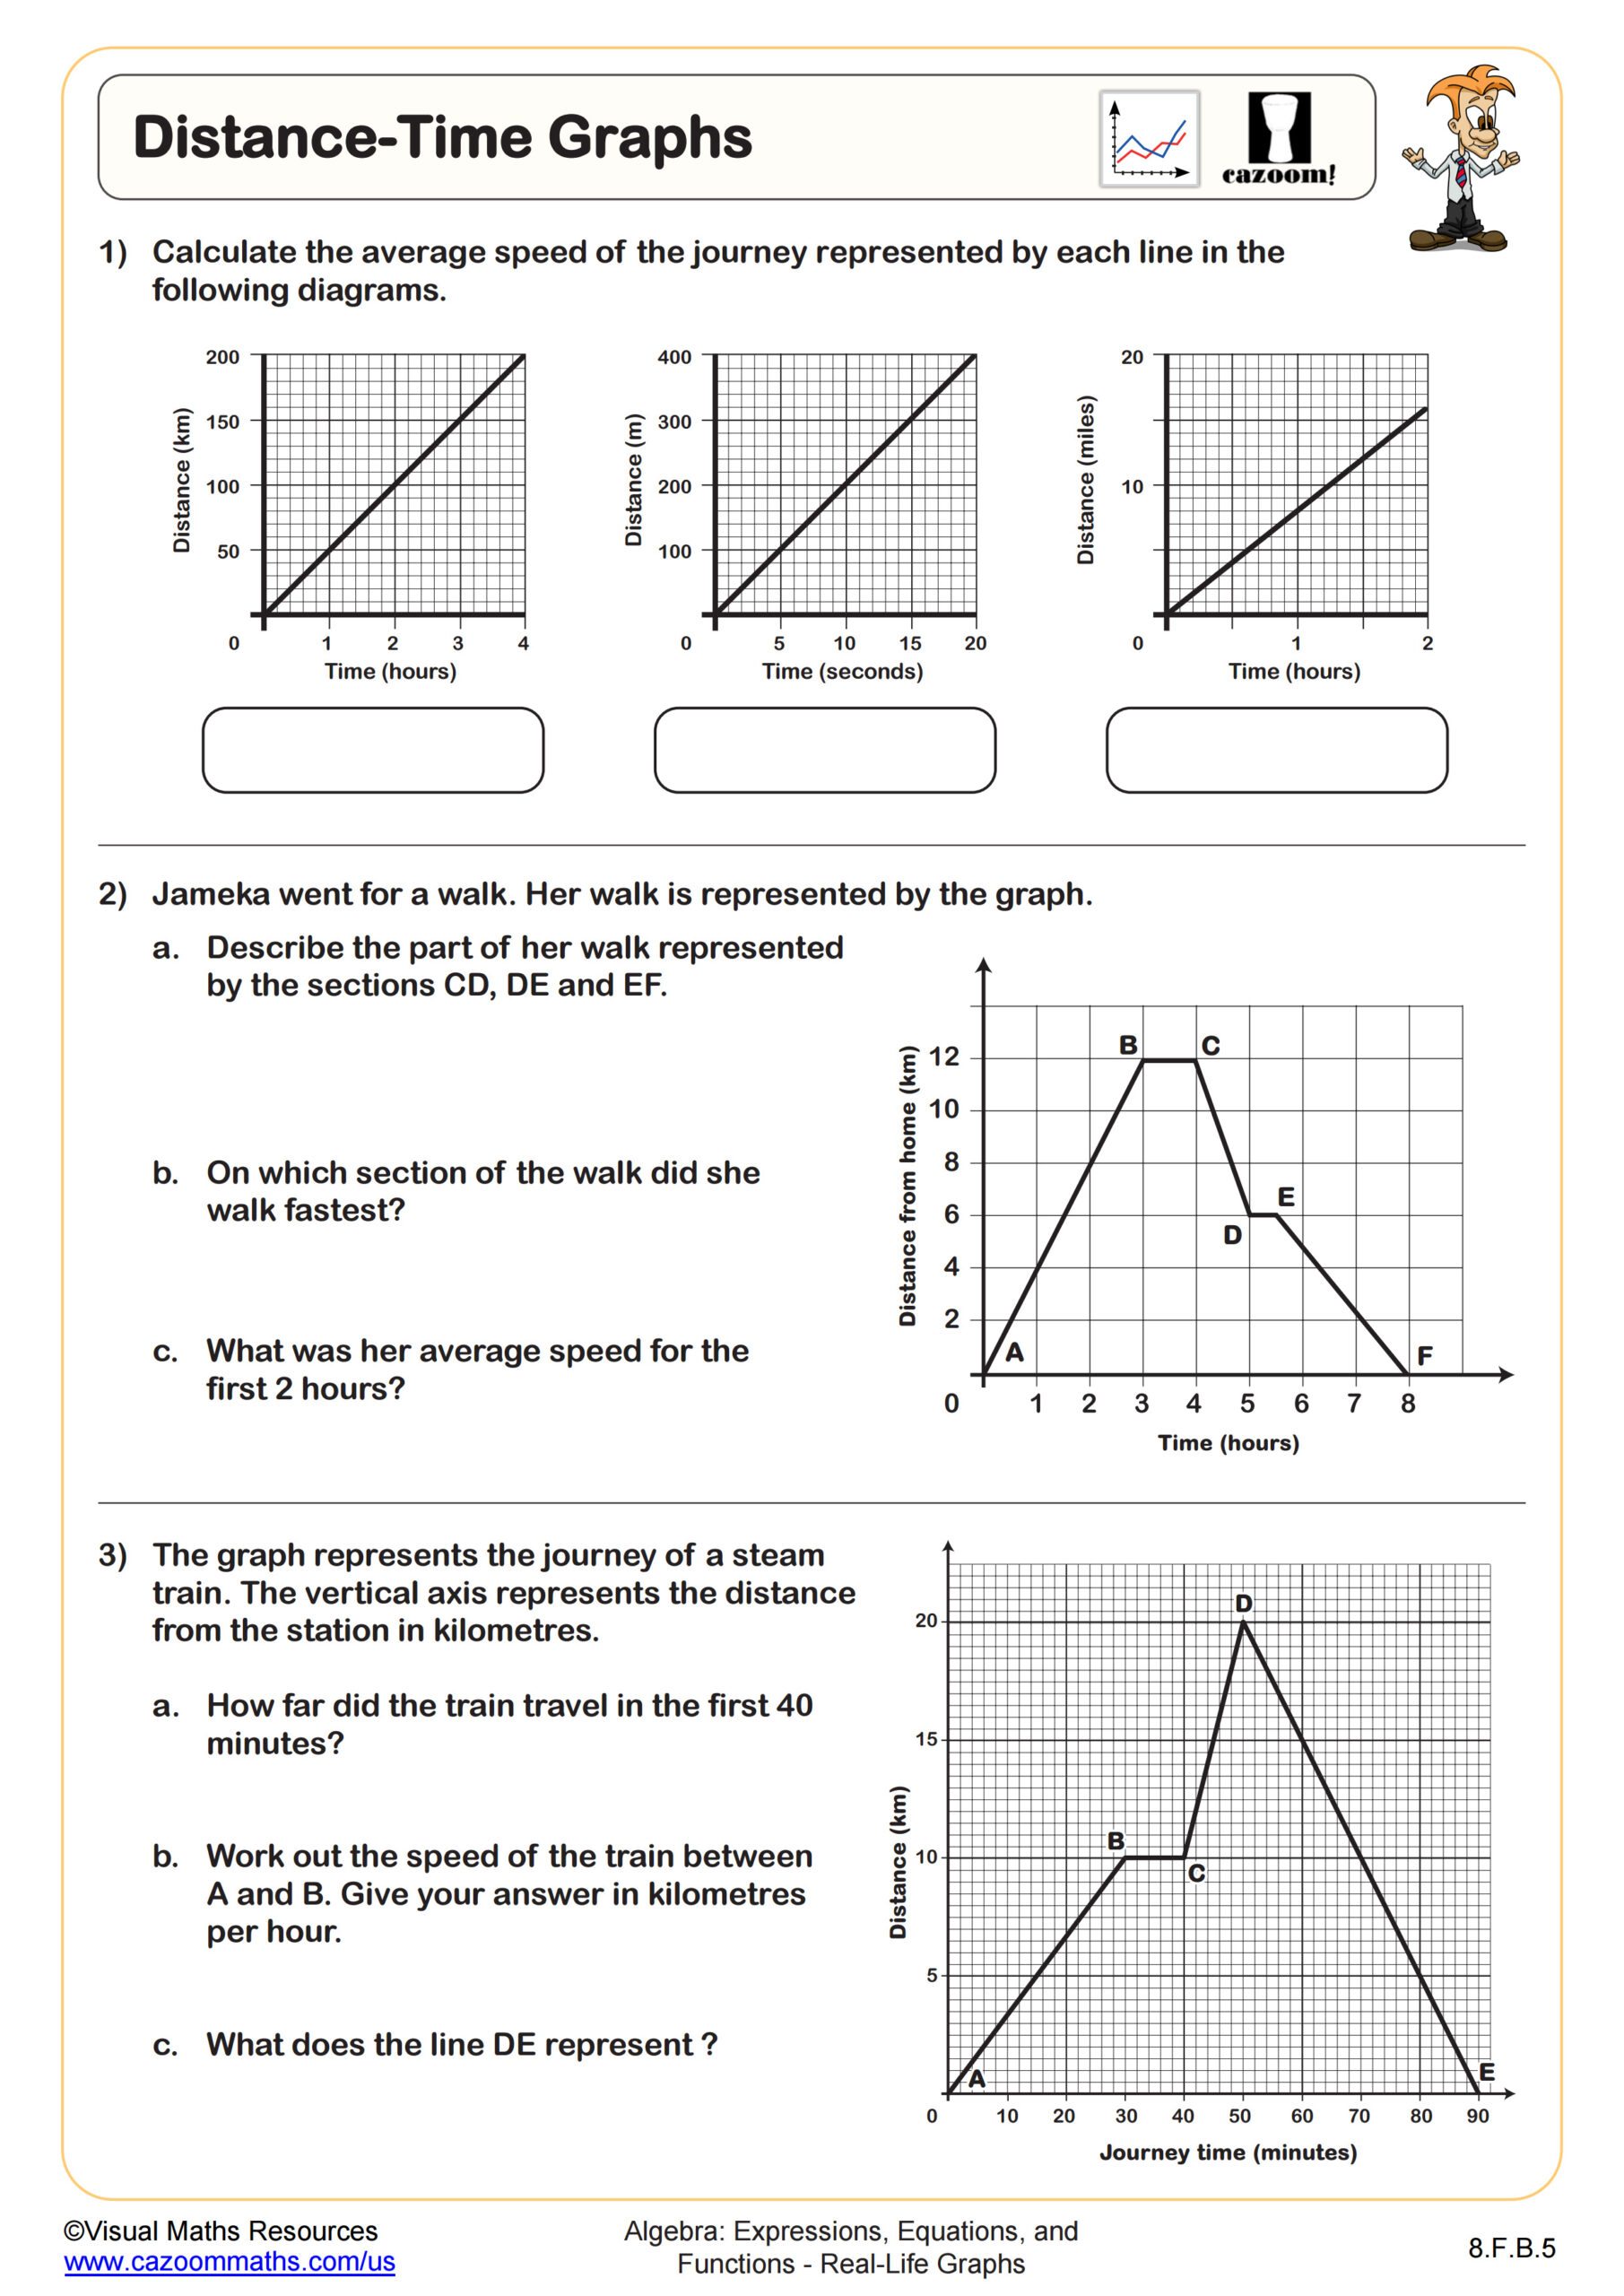
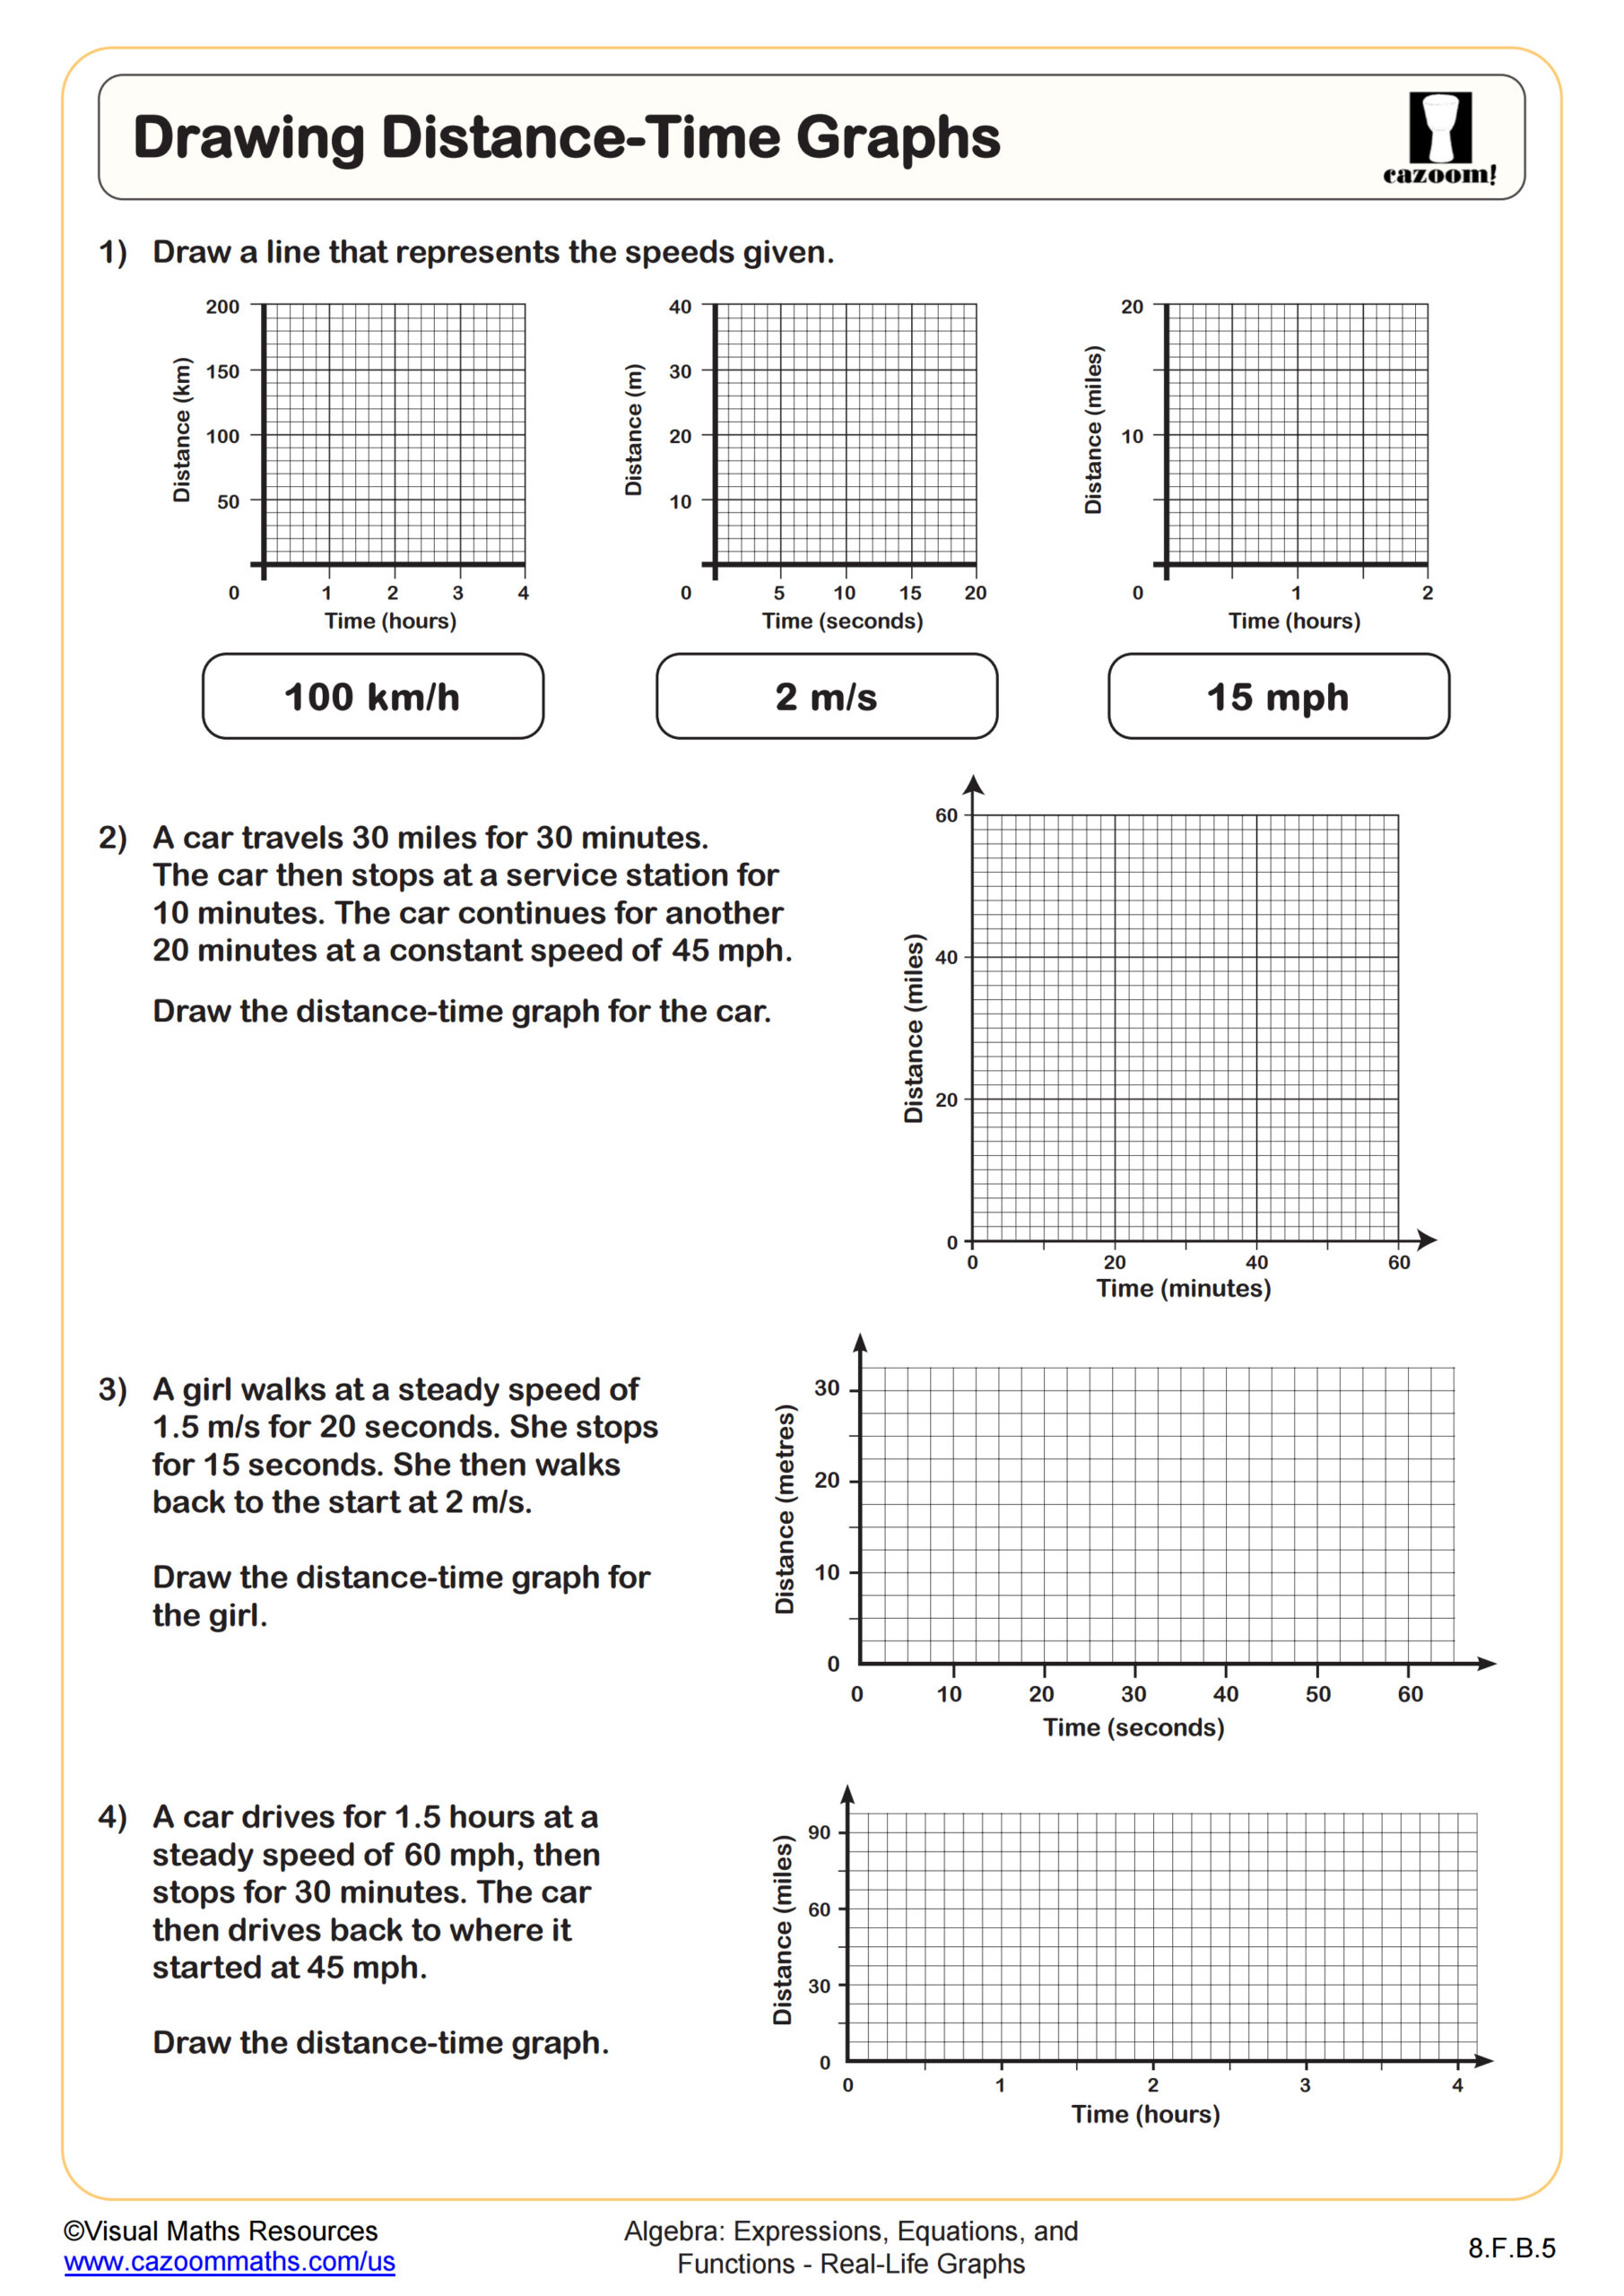
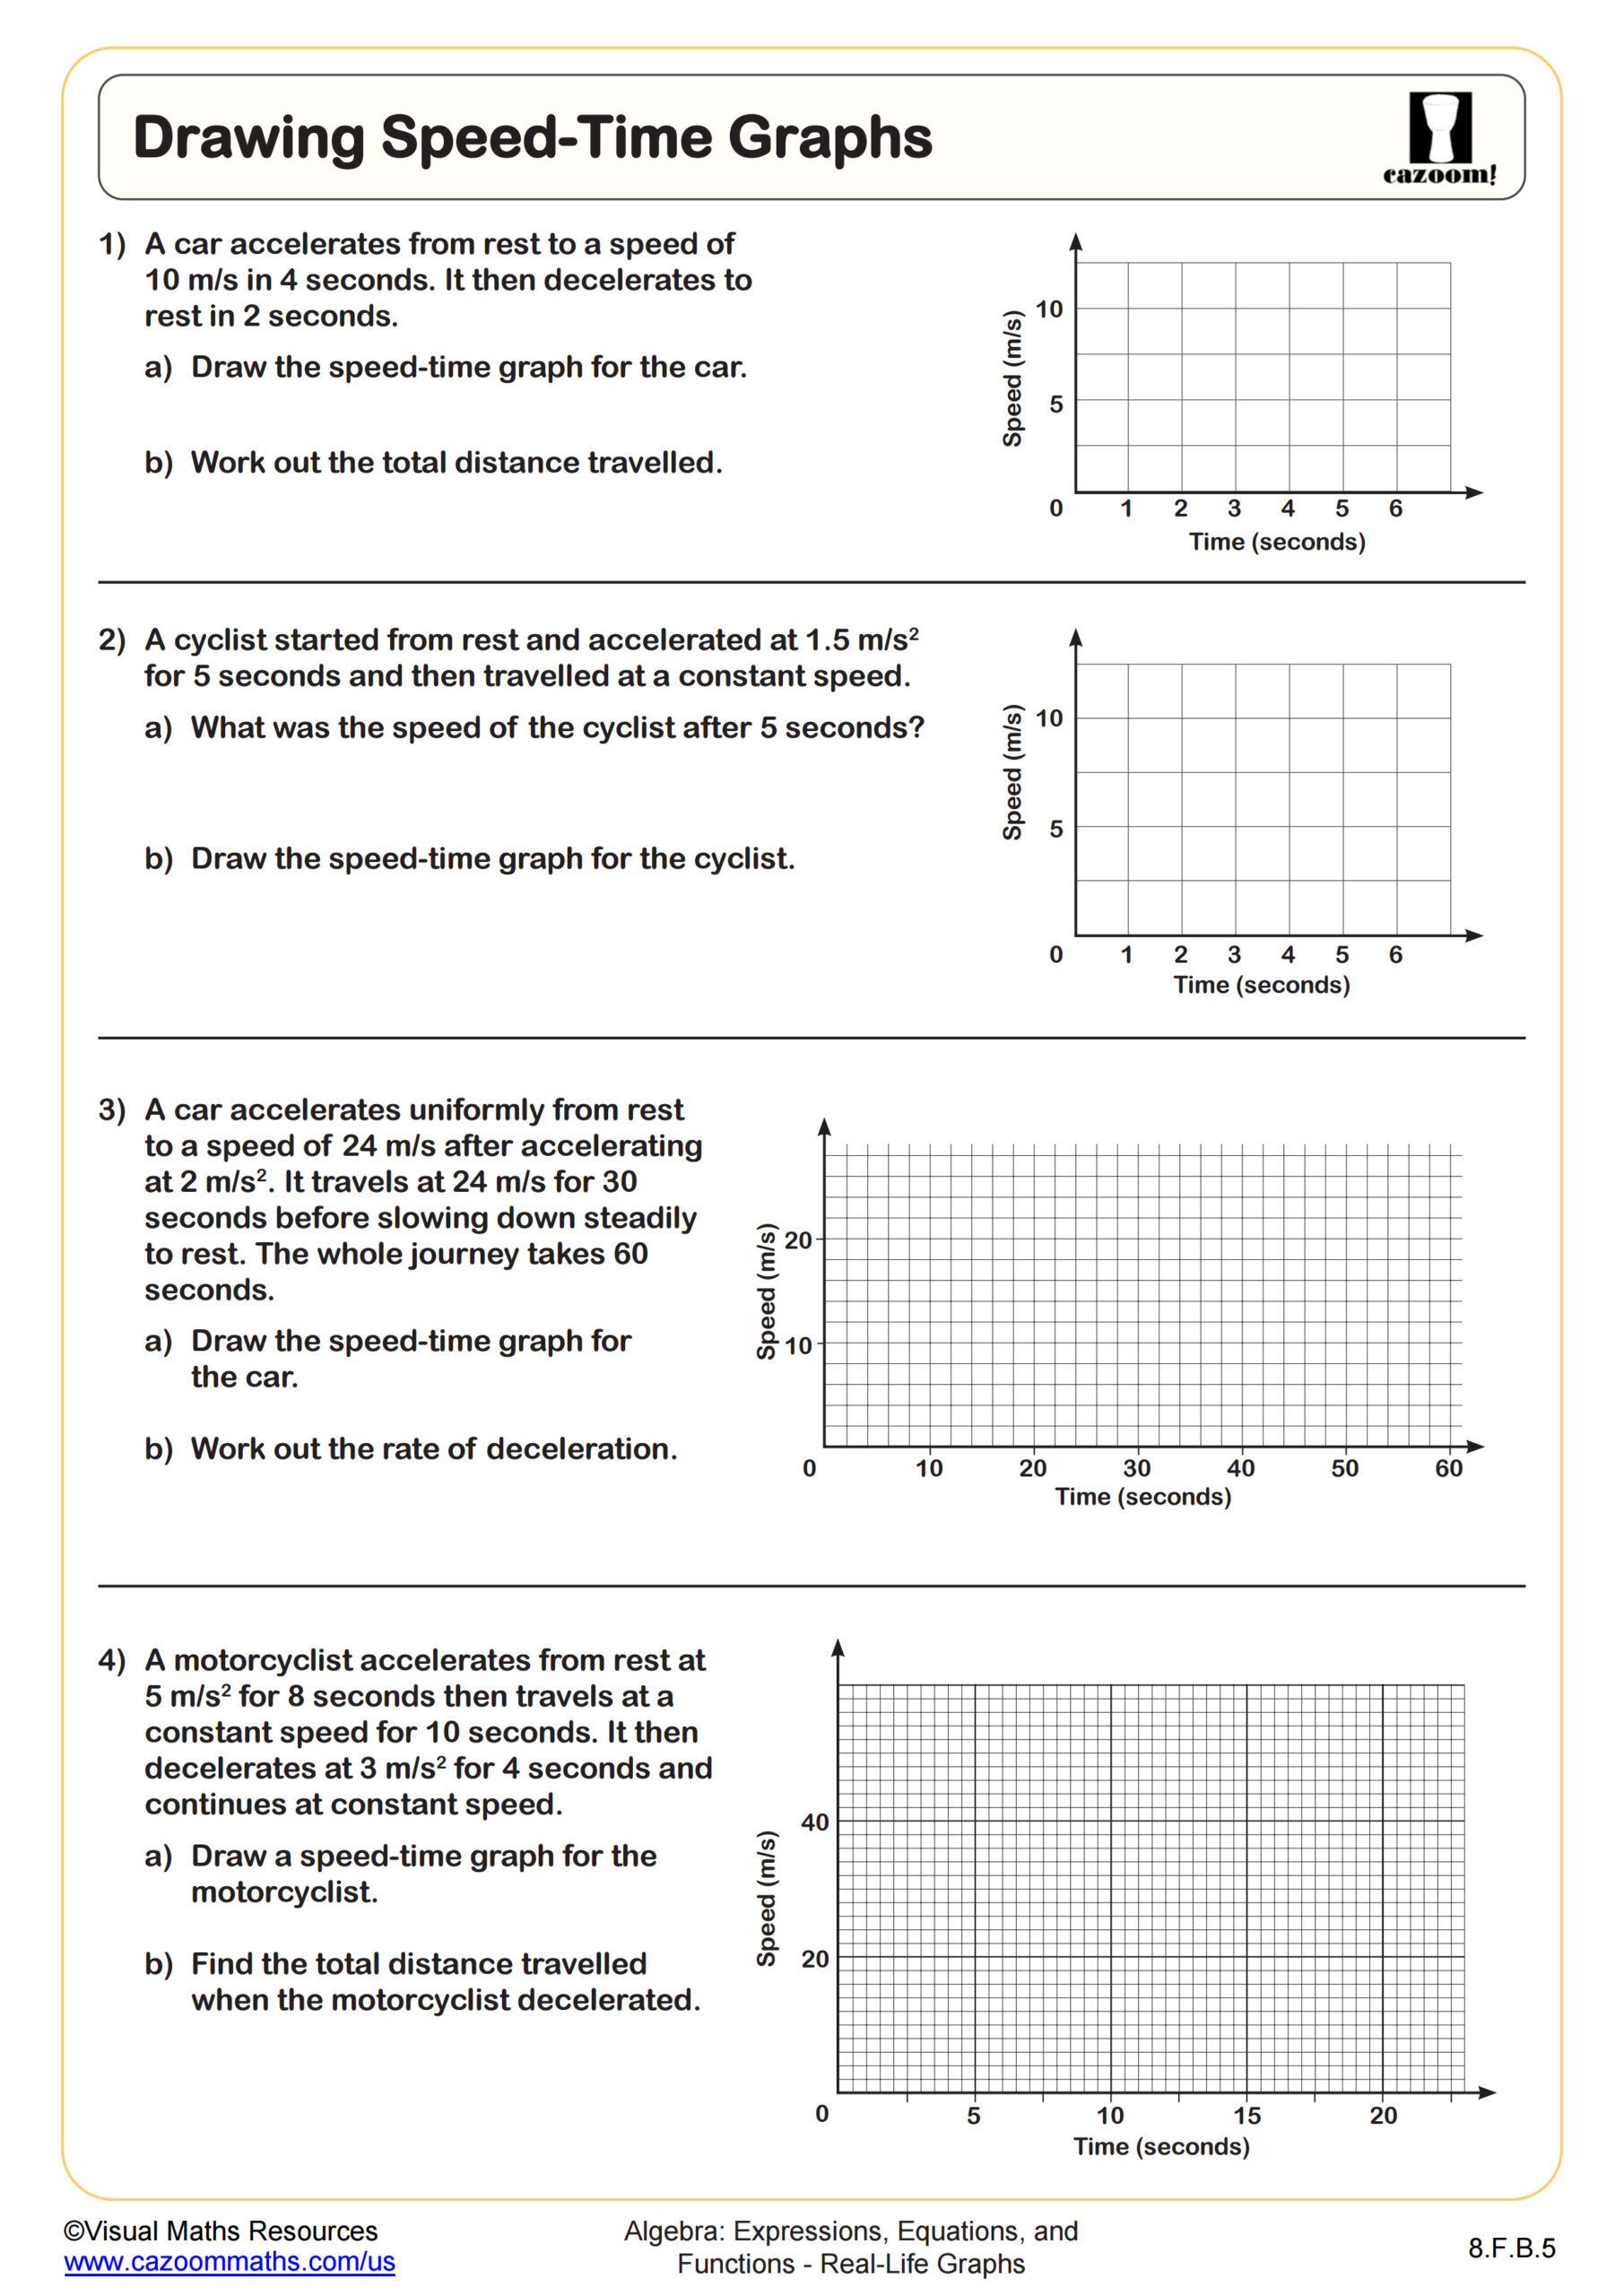
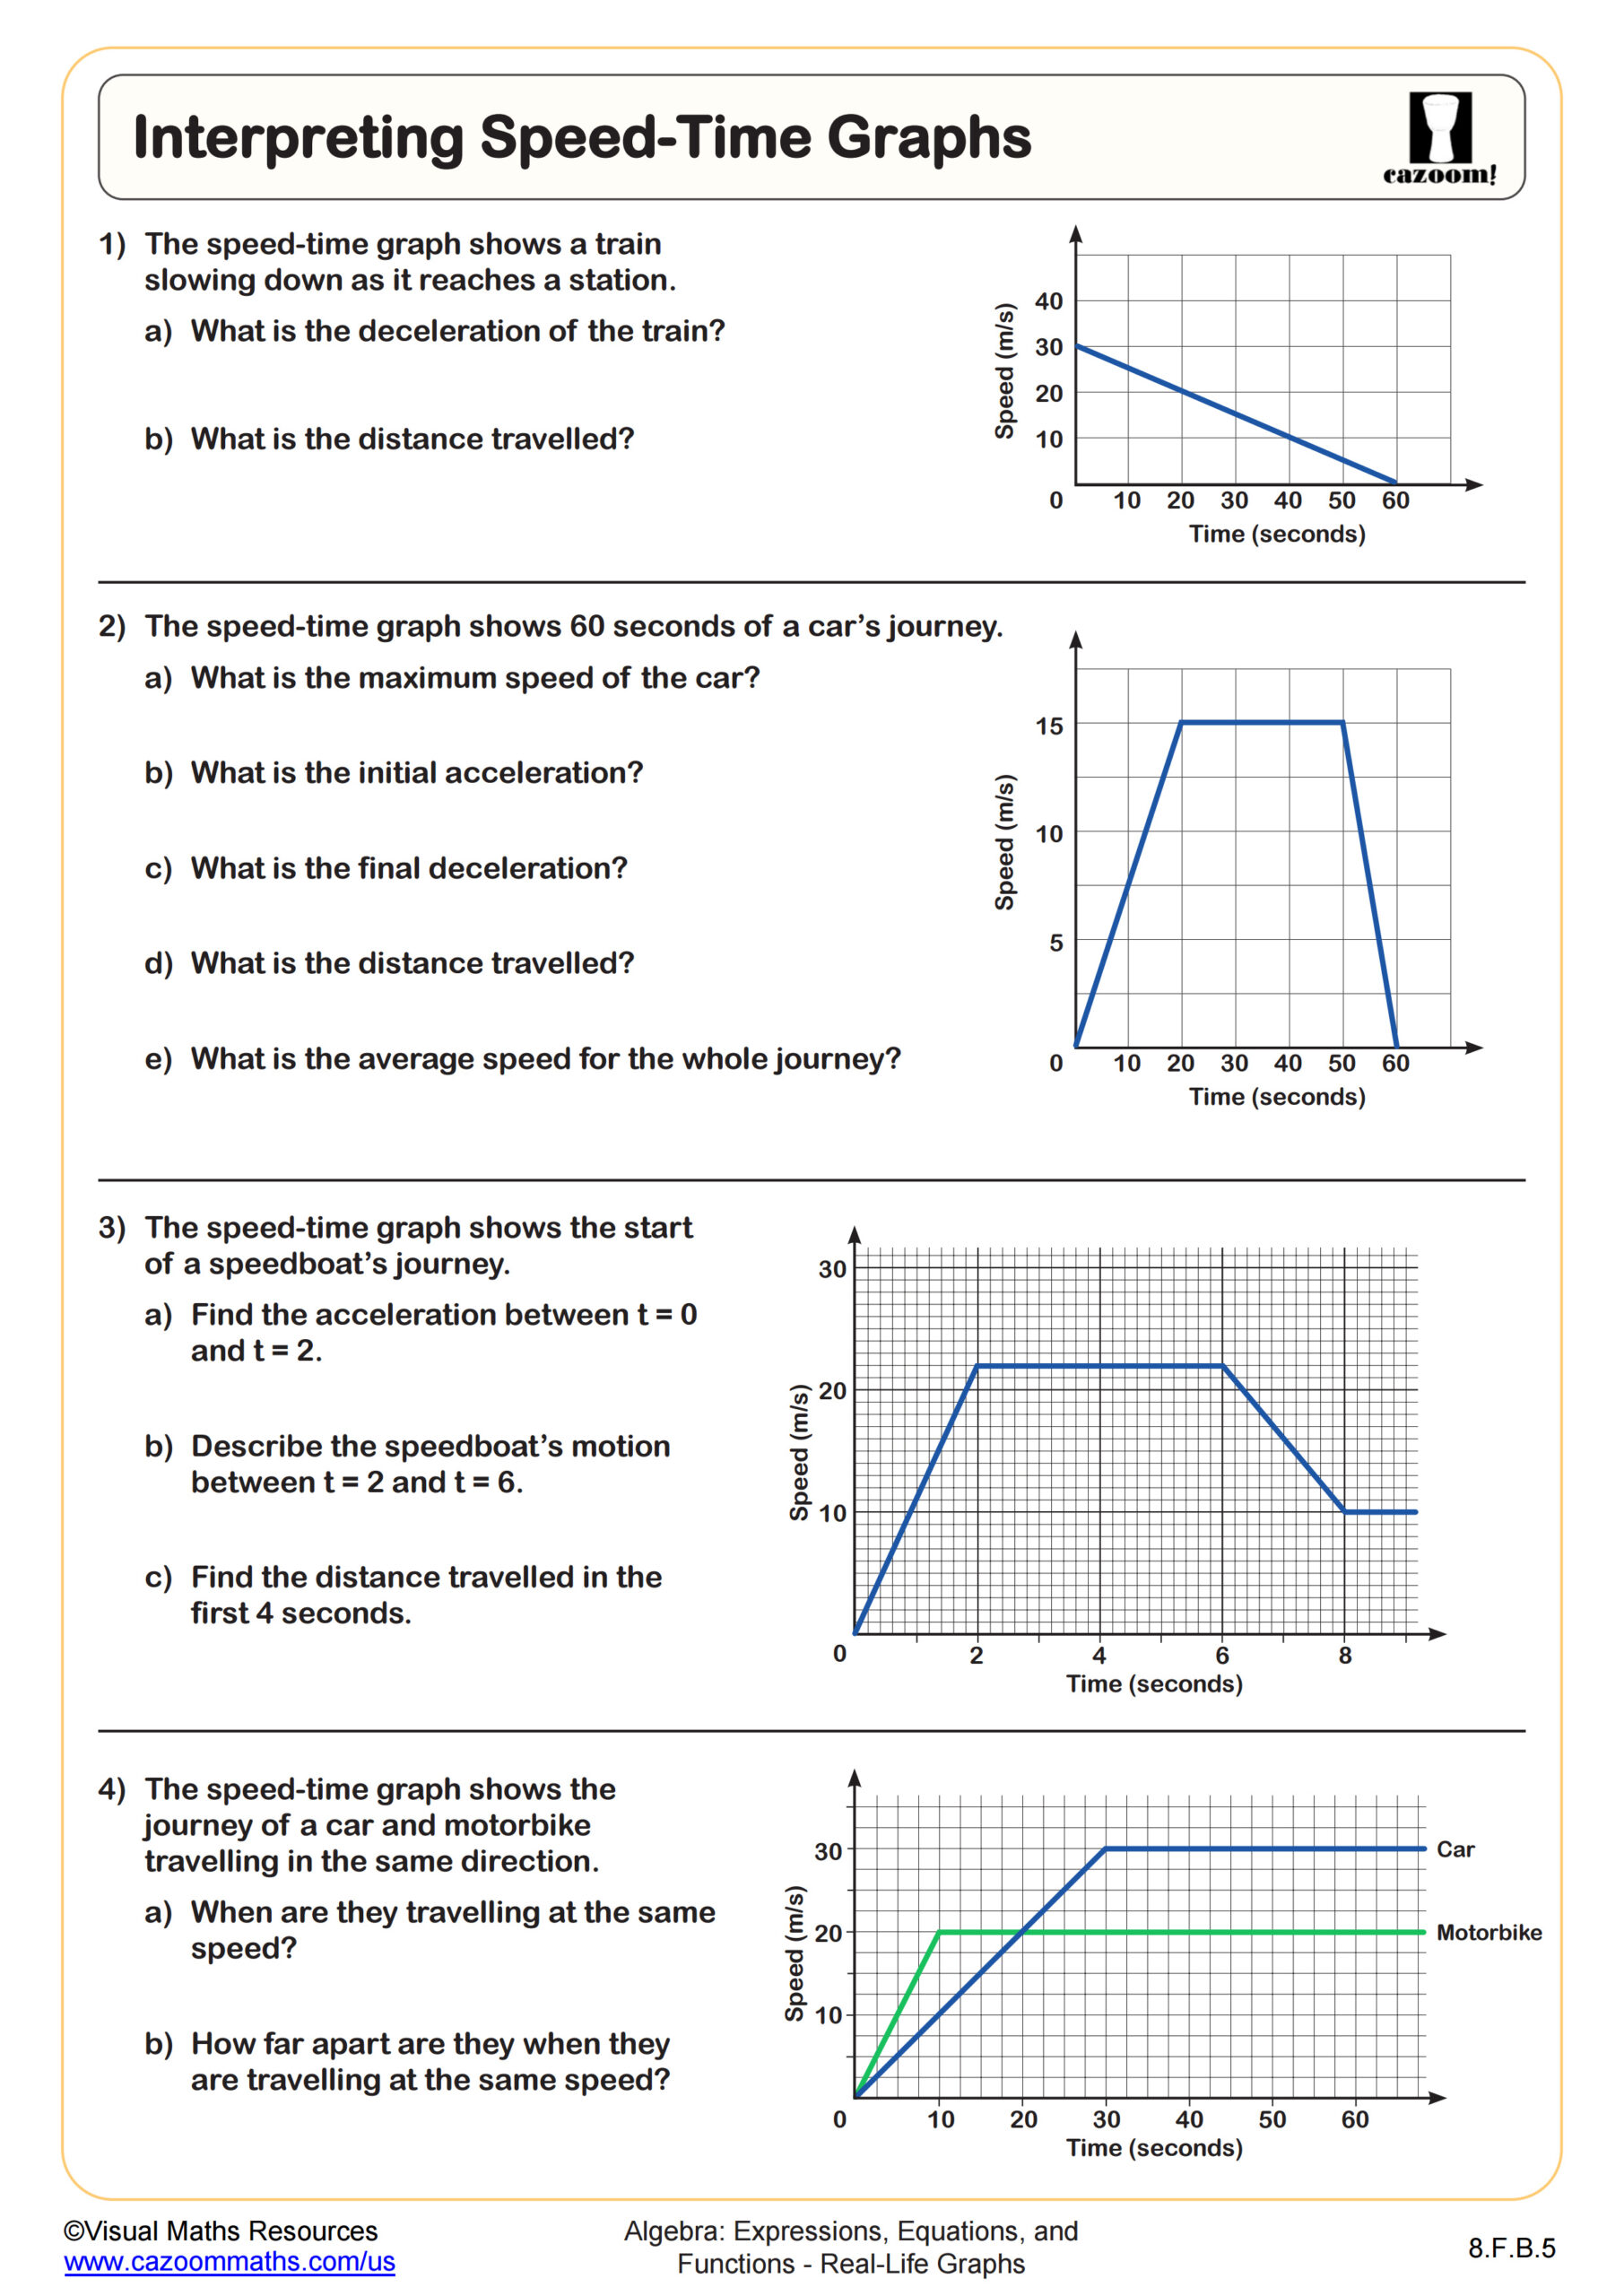
Students often lose points on standardized assessments when they confuse what the axes represent. For example, when analyzing a speed-time graph, many students mistakenly think a horizontal line means "not moving" rather than "moving at constant speed." Teachers find that having students physically act out scenarios while sketching corresponding graphs helps solidify the connection between real motion and graphical representation, reducing this persistent error pattern.
Which Grade Levels Use Real Life Graphs Worksheets?
These worksheets cover 6th grade, 7th grade, and 8th grade, spanning the complete middle school mathematics curriculum. At this stage, students transition from basic coordinate graphing to sophisticated interpretation of how graph features reveal information about real-world situations. The progression supports state standards that expect middle schoolers to analyze proportional relationships, linear functions, and non-linear patterns through multiple representations.
The complexity increases significantly across grade levels. Sixth graders typically work with straightforward scenarios like filling cylindrical containers or interpreting simple distance-time graphs. By eighth grade, students analyze piecewise functions, estimate areas under curves to find total quantities, and draw tangent lines to determine instantaneous rates of change. Teachers notice that students who master the foundational "matching graphs to stories" activities in sixth grade approach the more demanding calculus-preview concepts in eighth grade with considerably more confidence.
What Does Estimating Area Under a Graph Mean in Middle School?
Estimating area under a graph introduces students to the fundamental concept behind integration without formal calculus terminology. Students use geometric shapes like rectangles, triangles, or trapezoids to approximate the region between a curve and the horizontal axis. This technique helps them understand that the area represents accumulated quantity when the vertical axis shows a rate, building intuition for calculus concepts they'll encounter in high school.
This skill connects directly to STEM applications students encounter in science classes and real-world contexts. For instance, when a graph shows speed over time, the area underneath represents total distance traveled. Environmental scientists use this same principle to calculate total pollutant discharge from a factory by finding the area under a pollution-rate graph. Similarly, engineers estimate fuel consumption by analyzing the area under power-usage curves. Teachers find that presenting these authentic applications helps students recognize why approximation techniques matter beyond the math classroom.
How Do These Worksheets Support Effective Learning?
The worksheets scaffold learning by progressing from interpretation tasks to graph creation, then to more complex analysis involving tangent lines and function transformations. Each activity includes structured questions that guide students through identifying key graph features, explaining what these features mean in context, and justifying their reasoning. The included answer keys show complete solutions, allowing students to check not just final answers but also their reasoning process at each step.
Teachers use these worksheets flexibly depending on classroom needs. They work well as introductory activities when launching a functions unit, helping students visualize abstract concepts through concrete scenarios. Many teachers assign them for paired work, where one student describes a situation while their partner sketches the corresponding graph, then they compare with the answer key. The worksheets also serve effectively as targeted intervention for students who understand algebraic manipulation but struggle to connect equations with their graphical meaning, a gap that becomes particularly evident during review for state assessments.