Middle School Statistics Worksheets
All worksheets are created by the team of experienced teachers at Cazoom Math.
What statistics skills do middle school students need to master?
Middle school statistics covers data collection, organization, representation, and basic analysis. Students learn to create and interpret various graphical displays including tally charts, line graphs, and composite bar charts. They also work with set notation to describe data relationships and begin exploring statistical concepts like confidence intervals, which prepare them for high school probability and statistics courses.
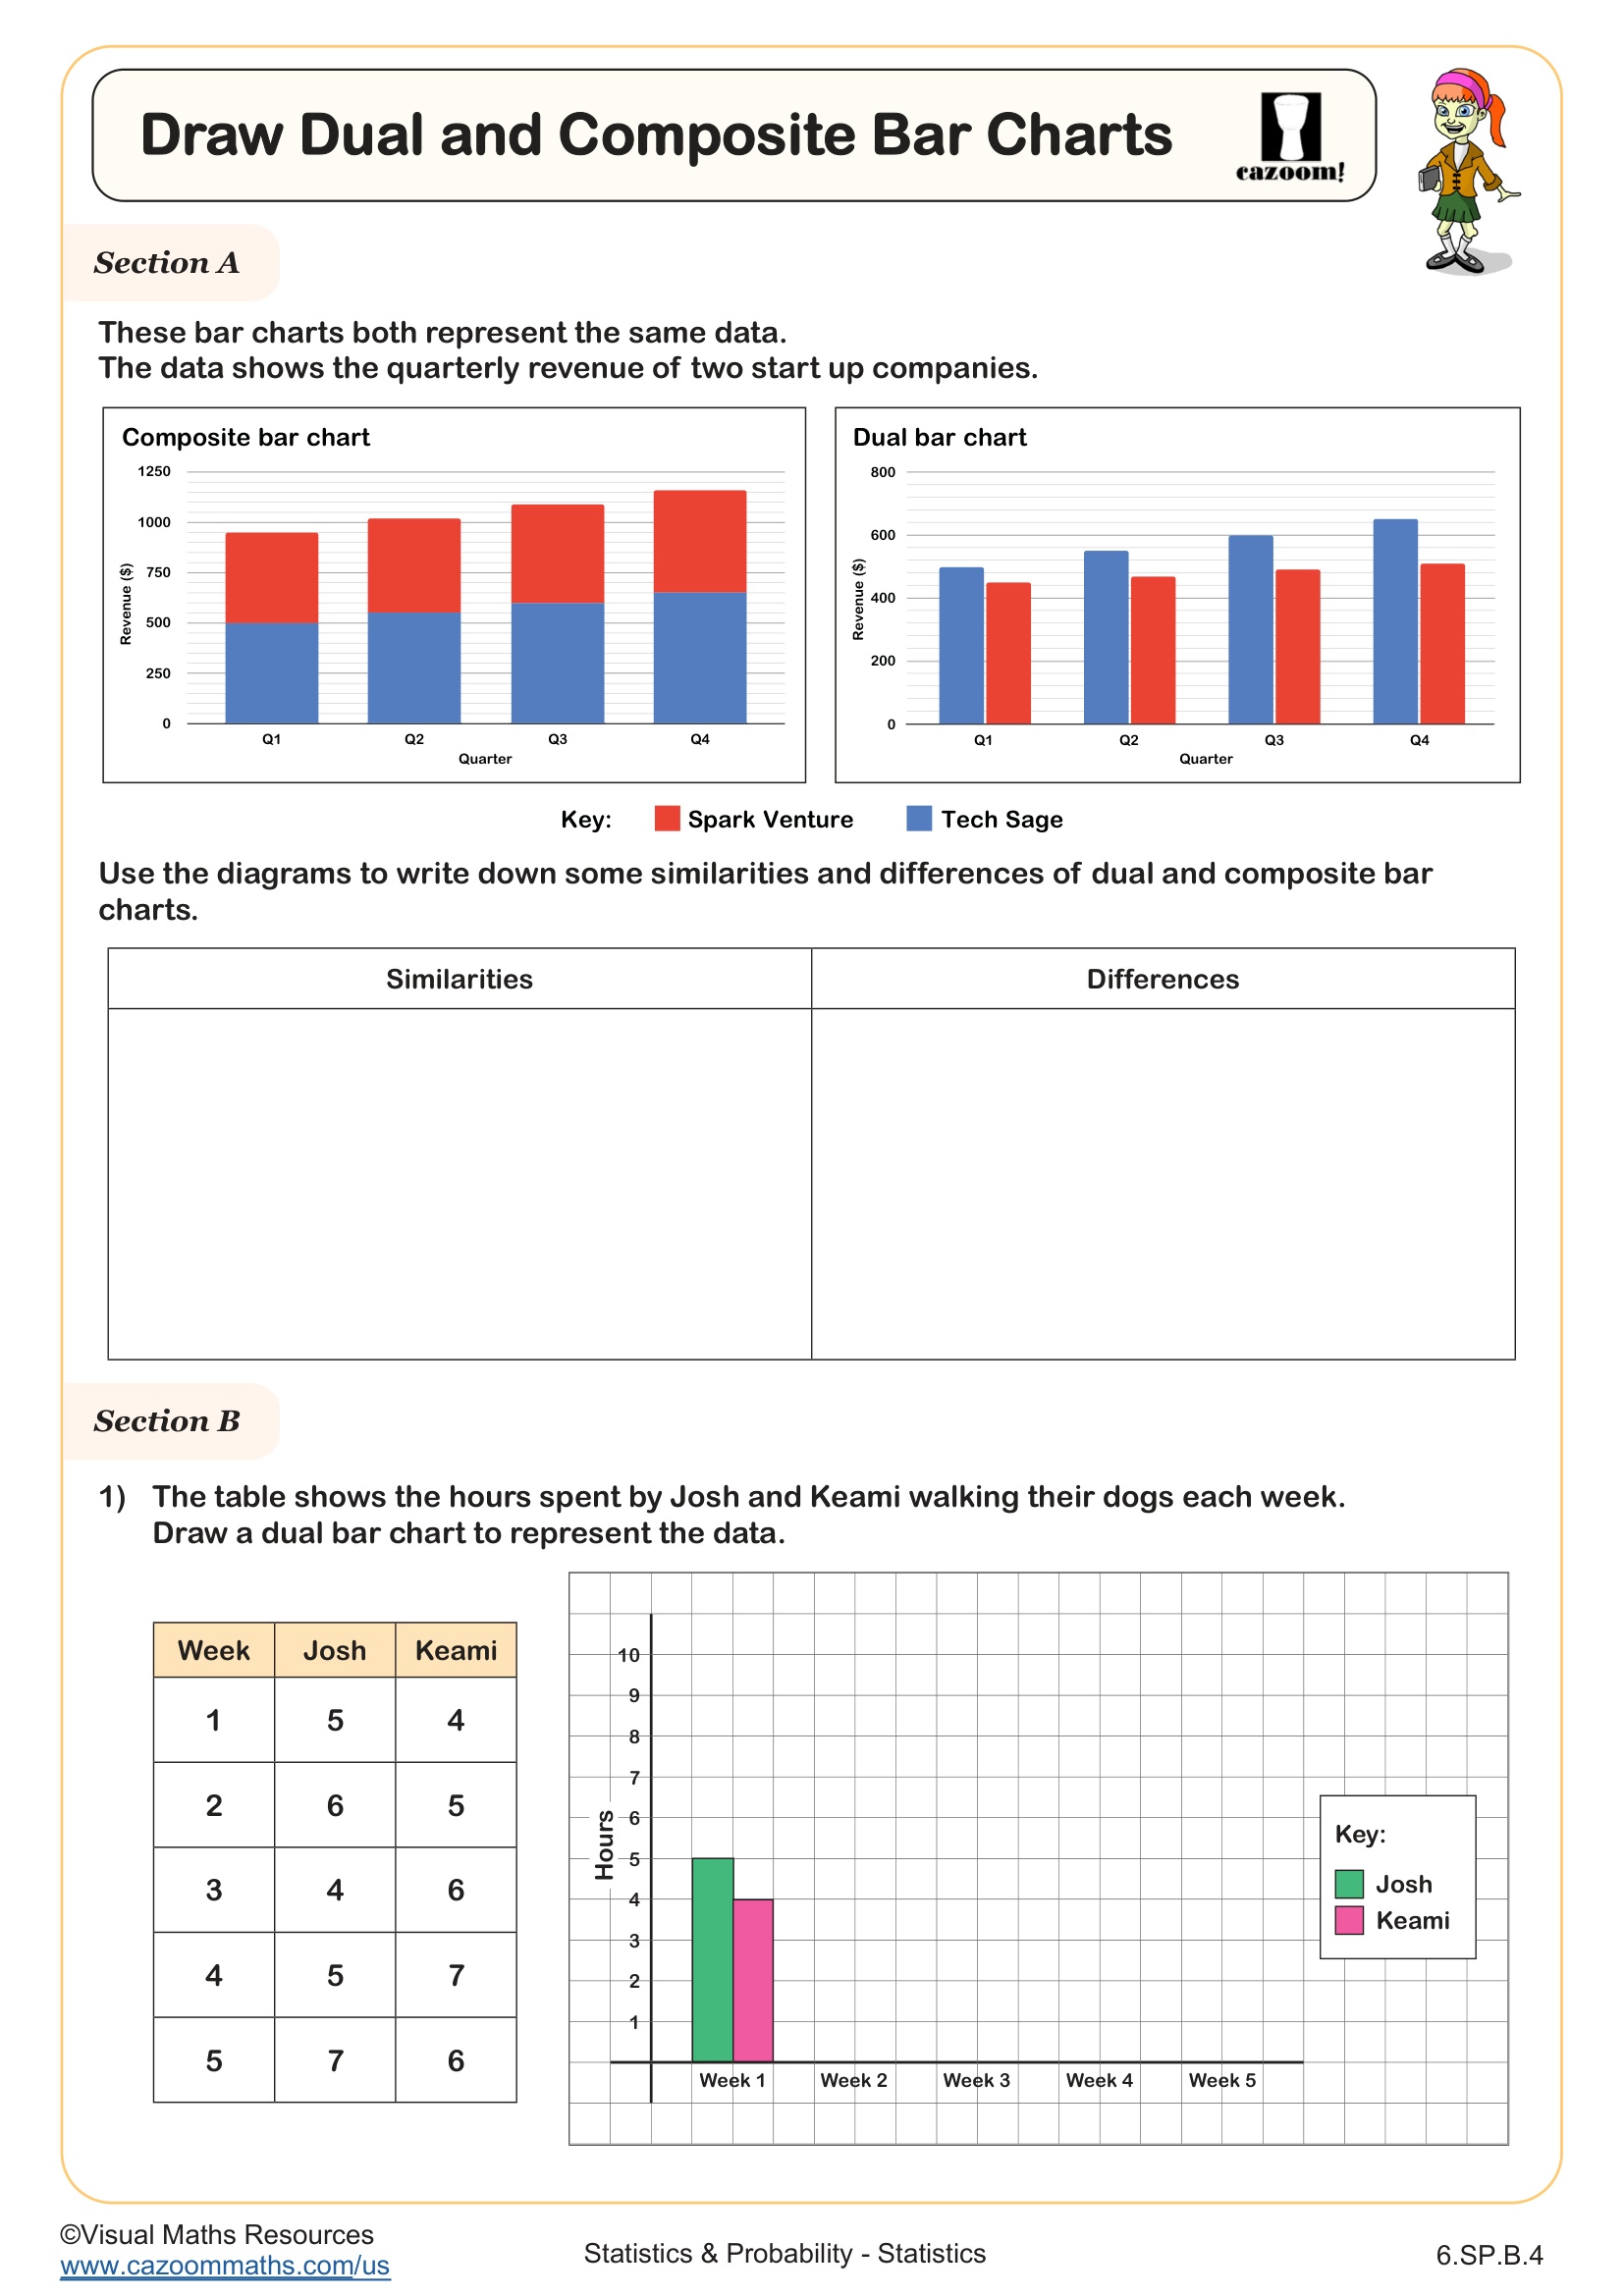
A common error occurs when students confuse composite bar charts with dual bar charts. Teachers often see students stack bars that should be side-by-side, or place side-by-side bars that represent cumulative data. Understanding when each chart type is appropriate requires practice comparing different datasets and recognizing whether the data categories are independent or related.
Which grade levels use these statistics worksheets?
These worksheets support middle school students in 6th grade, 7th grade, and 8th grade. The collection aligns with the data analysis and statistics standards that appear throughout middle school mathematics, where students transition from basic data displays to more nuanced statistical thinking. This progression builds the foundation for high school statistics and AP Statistics courses.
The difficulty increases notably across grade levels. Sixth graders typically focus on creating accurate tally charts and basic line graphs, while seventh graders work with comparing datasets using dual bar charts. By eighth grade, students tackle more abstract concepts like set notation and begin exploring confidence intervals with proper rounding conventions, which requires integrating multiple mathematical skills simultaneously.
How do students learn to read and create dual bar charts?
Dual bar charts display two related datasets side-by-side for easy comparison, with each category showing two bars in different colors. Students must understand how to set up appropriate scales, choose consistent bar widths, and create clear legends that distinguish between the datasets. The key skill involves selecting appropriate intervals for the vertical axis that accommodate both datasets without distorting the visual comparison.
Dual bar charts appear frequently in real-world STEM contexts, particularly when scientists compare experimental results across different conditions or time periods. Climate researchers use them to compare temperature data from different decades, medical researchers display treatment outcomes across patient groups, and economists track consumer spending patterns across demographics. Students who master dual bar charts develop critical skills for interpreting the comparative data they encounter in science classes and standardized assessments.
How can teachers use these statistics worksheets effectively?
The worksheets progress from basic data organization to complex visualization and analysis, allowing teachers to match activities to student readiness levels. The included answer keys let students check their own graphical displays, which is particularly valuable for statistics since multiple correct approaches may exist for organizing the same dataset. This immediate feedback helps students recognize whether their data interpretation makes logical sense.
Many teachers use these worksheets during math workshop rotations, pairing students to compare their graphs and discuss differences in their visual representations. They also work well for intervention groups where students need additional practice with specific chart types before tackling word problems or multistep data analysis tasks. The worksheets provide structured homework assignments that parents can support at home since the answer keys allow for verification without requiring advanced statistical knowledge.