Middle School Stem-and-Leaf Diagrams Worksheets
All worksheets are created by the team of experienced teachers at Cazoom Math.
How Our Middle School Stem and Leaf Diagrams Worksheets Accelerate Statistical Understanding
Students begin middle school with their existing knowledge of basic tallying and bar graph skills. The stem-and-leaf diagram extends this foundation by showing individual values while displaying the distribution shape. Students learn to obtain multiple insights from one representation through this dual perspective. The organized structure enables users to find medians, modes, and ranges through the table while maintaining access to the original data.
The diagrams require regular practice to help students develop their ability to recognize patterns and analyze information. Students learn to compare data sets side by side and identify unusual values quickly. The skills establish a strong base, which enables students to learn advanced statistical methods, including box plots and histograms, during their high school years.
Classroom-Ready Measurement and Data Topics for Lessons, Homework, and Revision
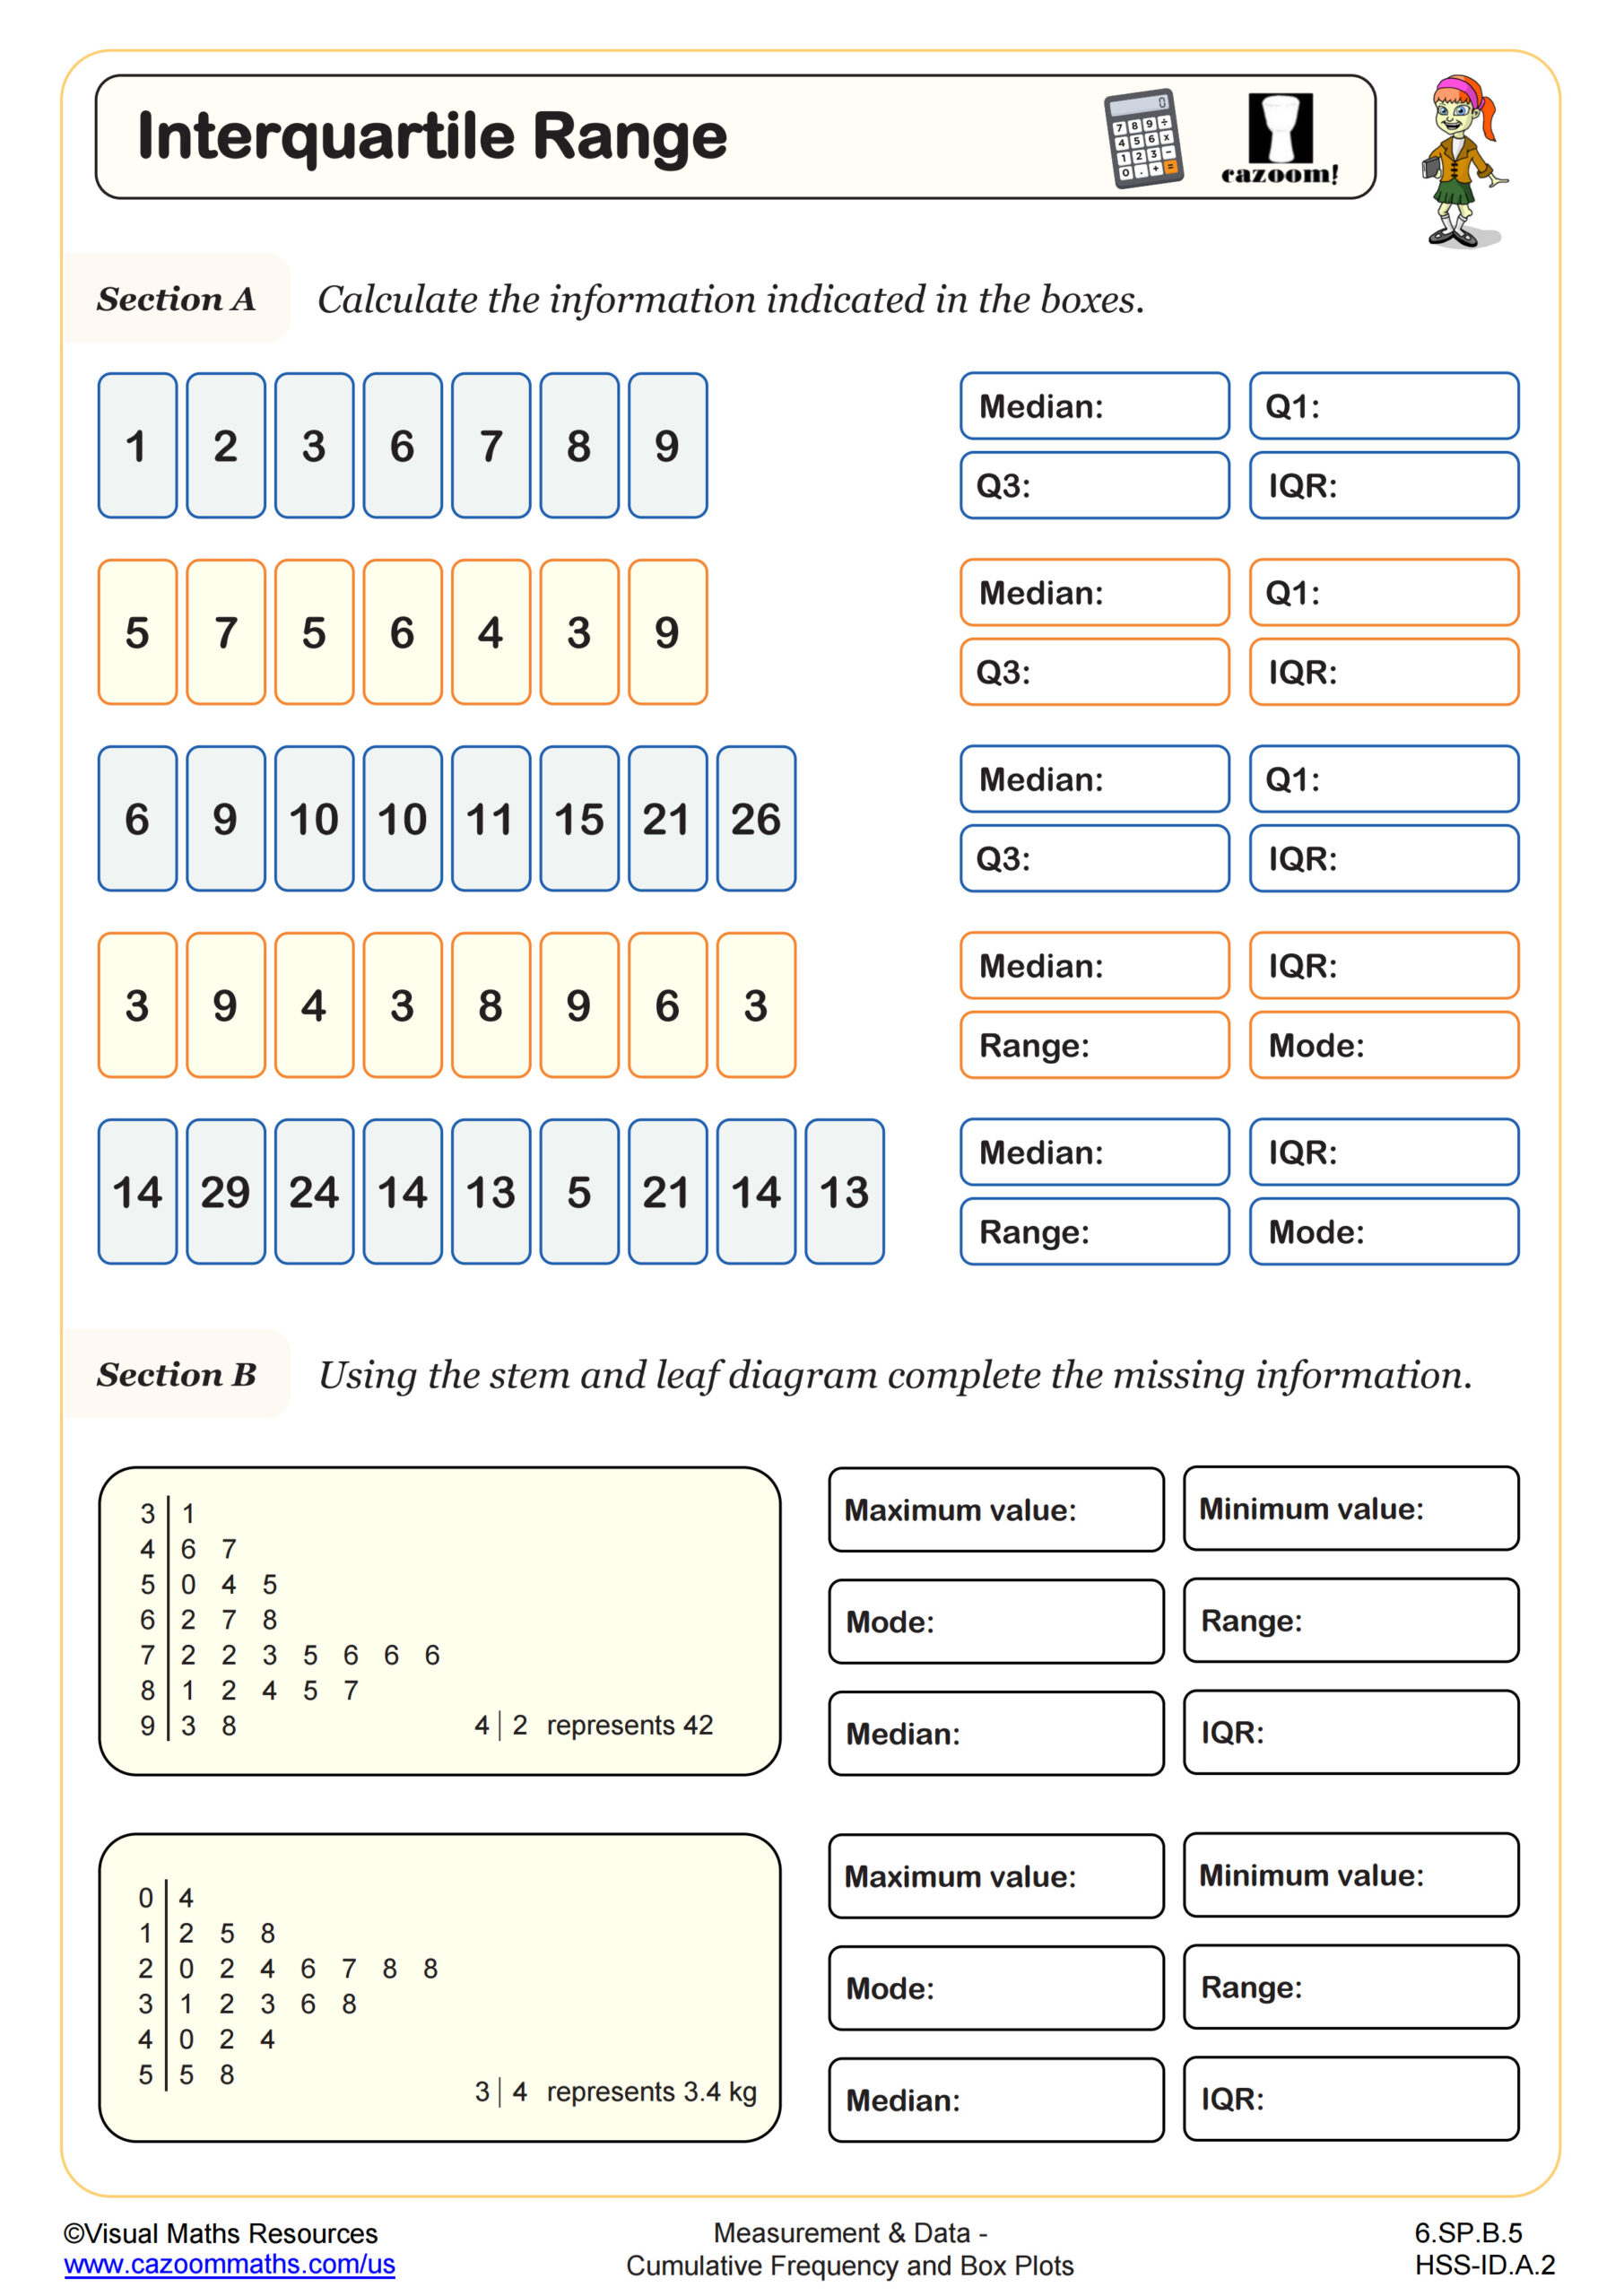
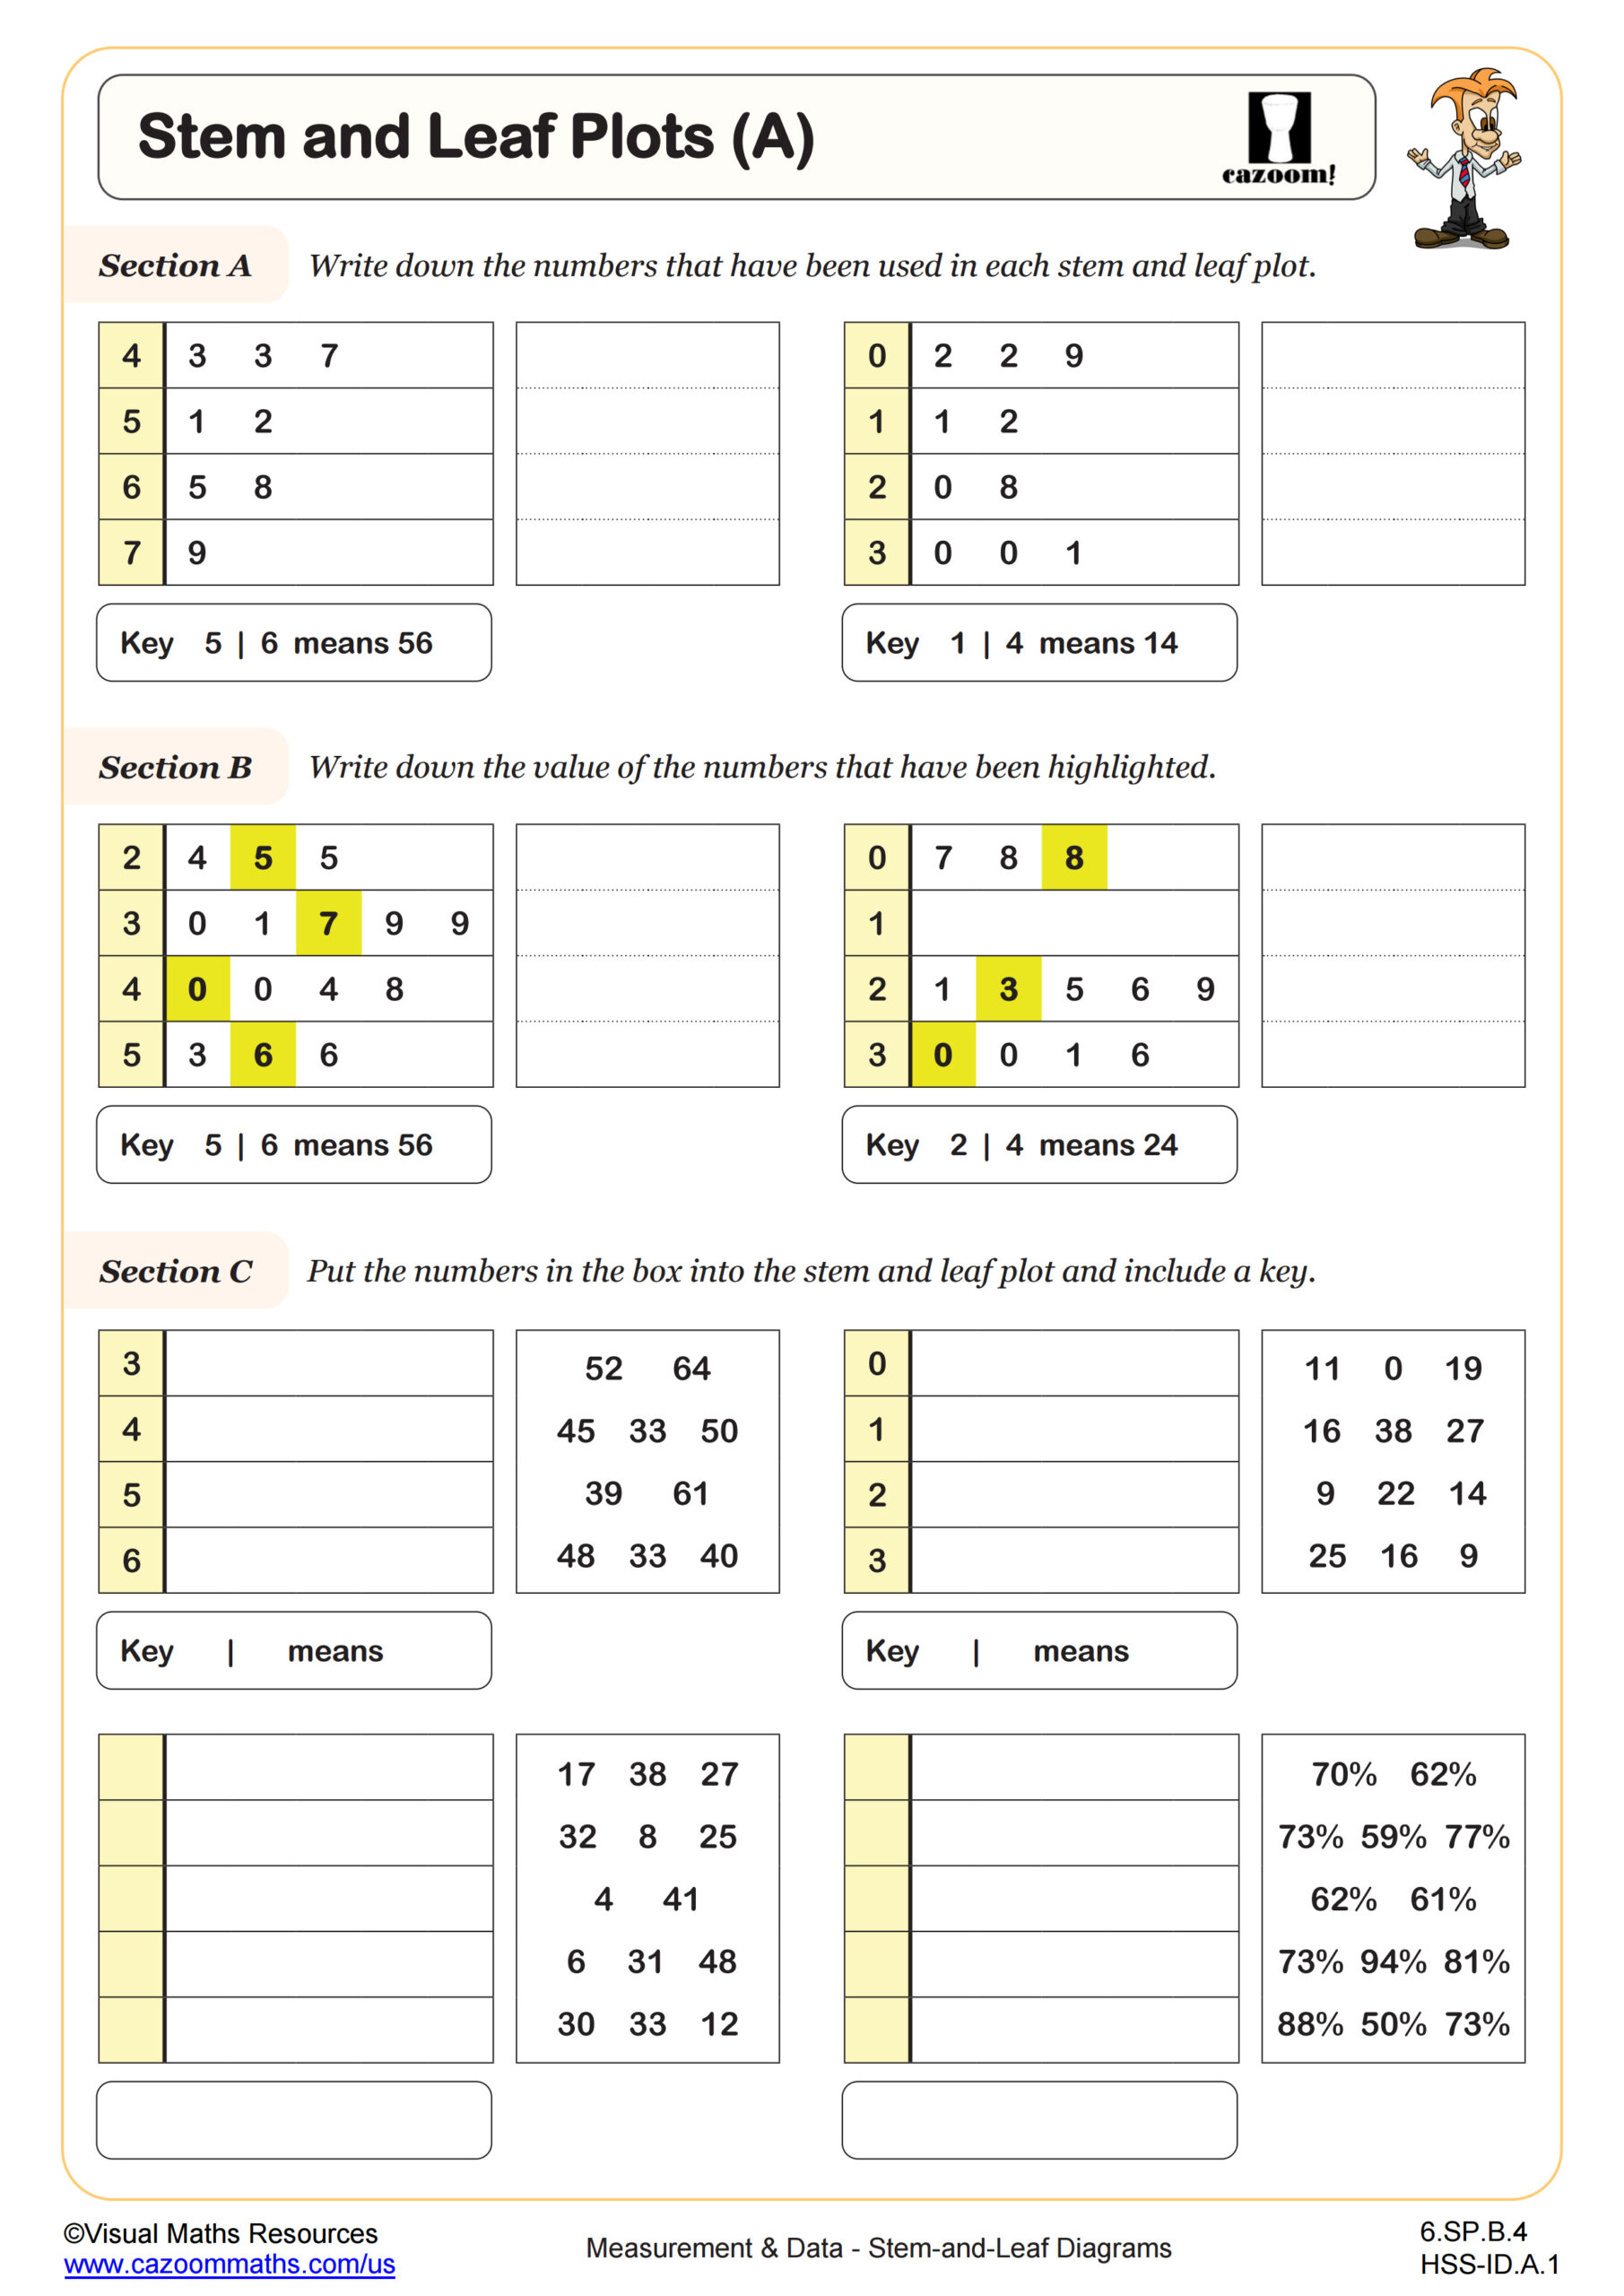
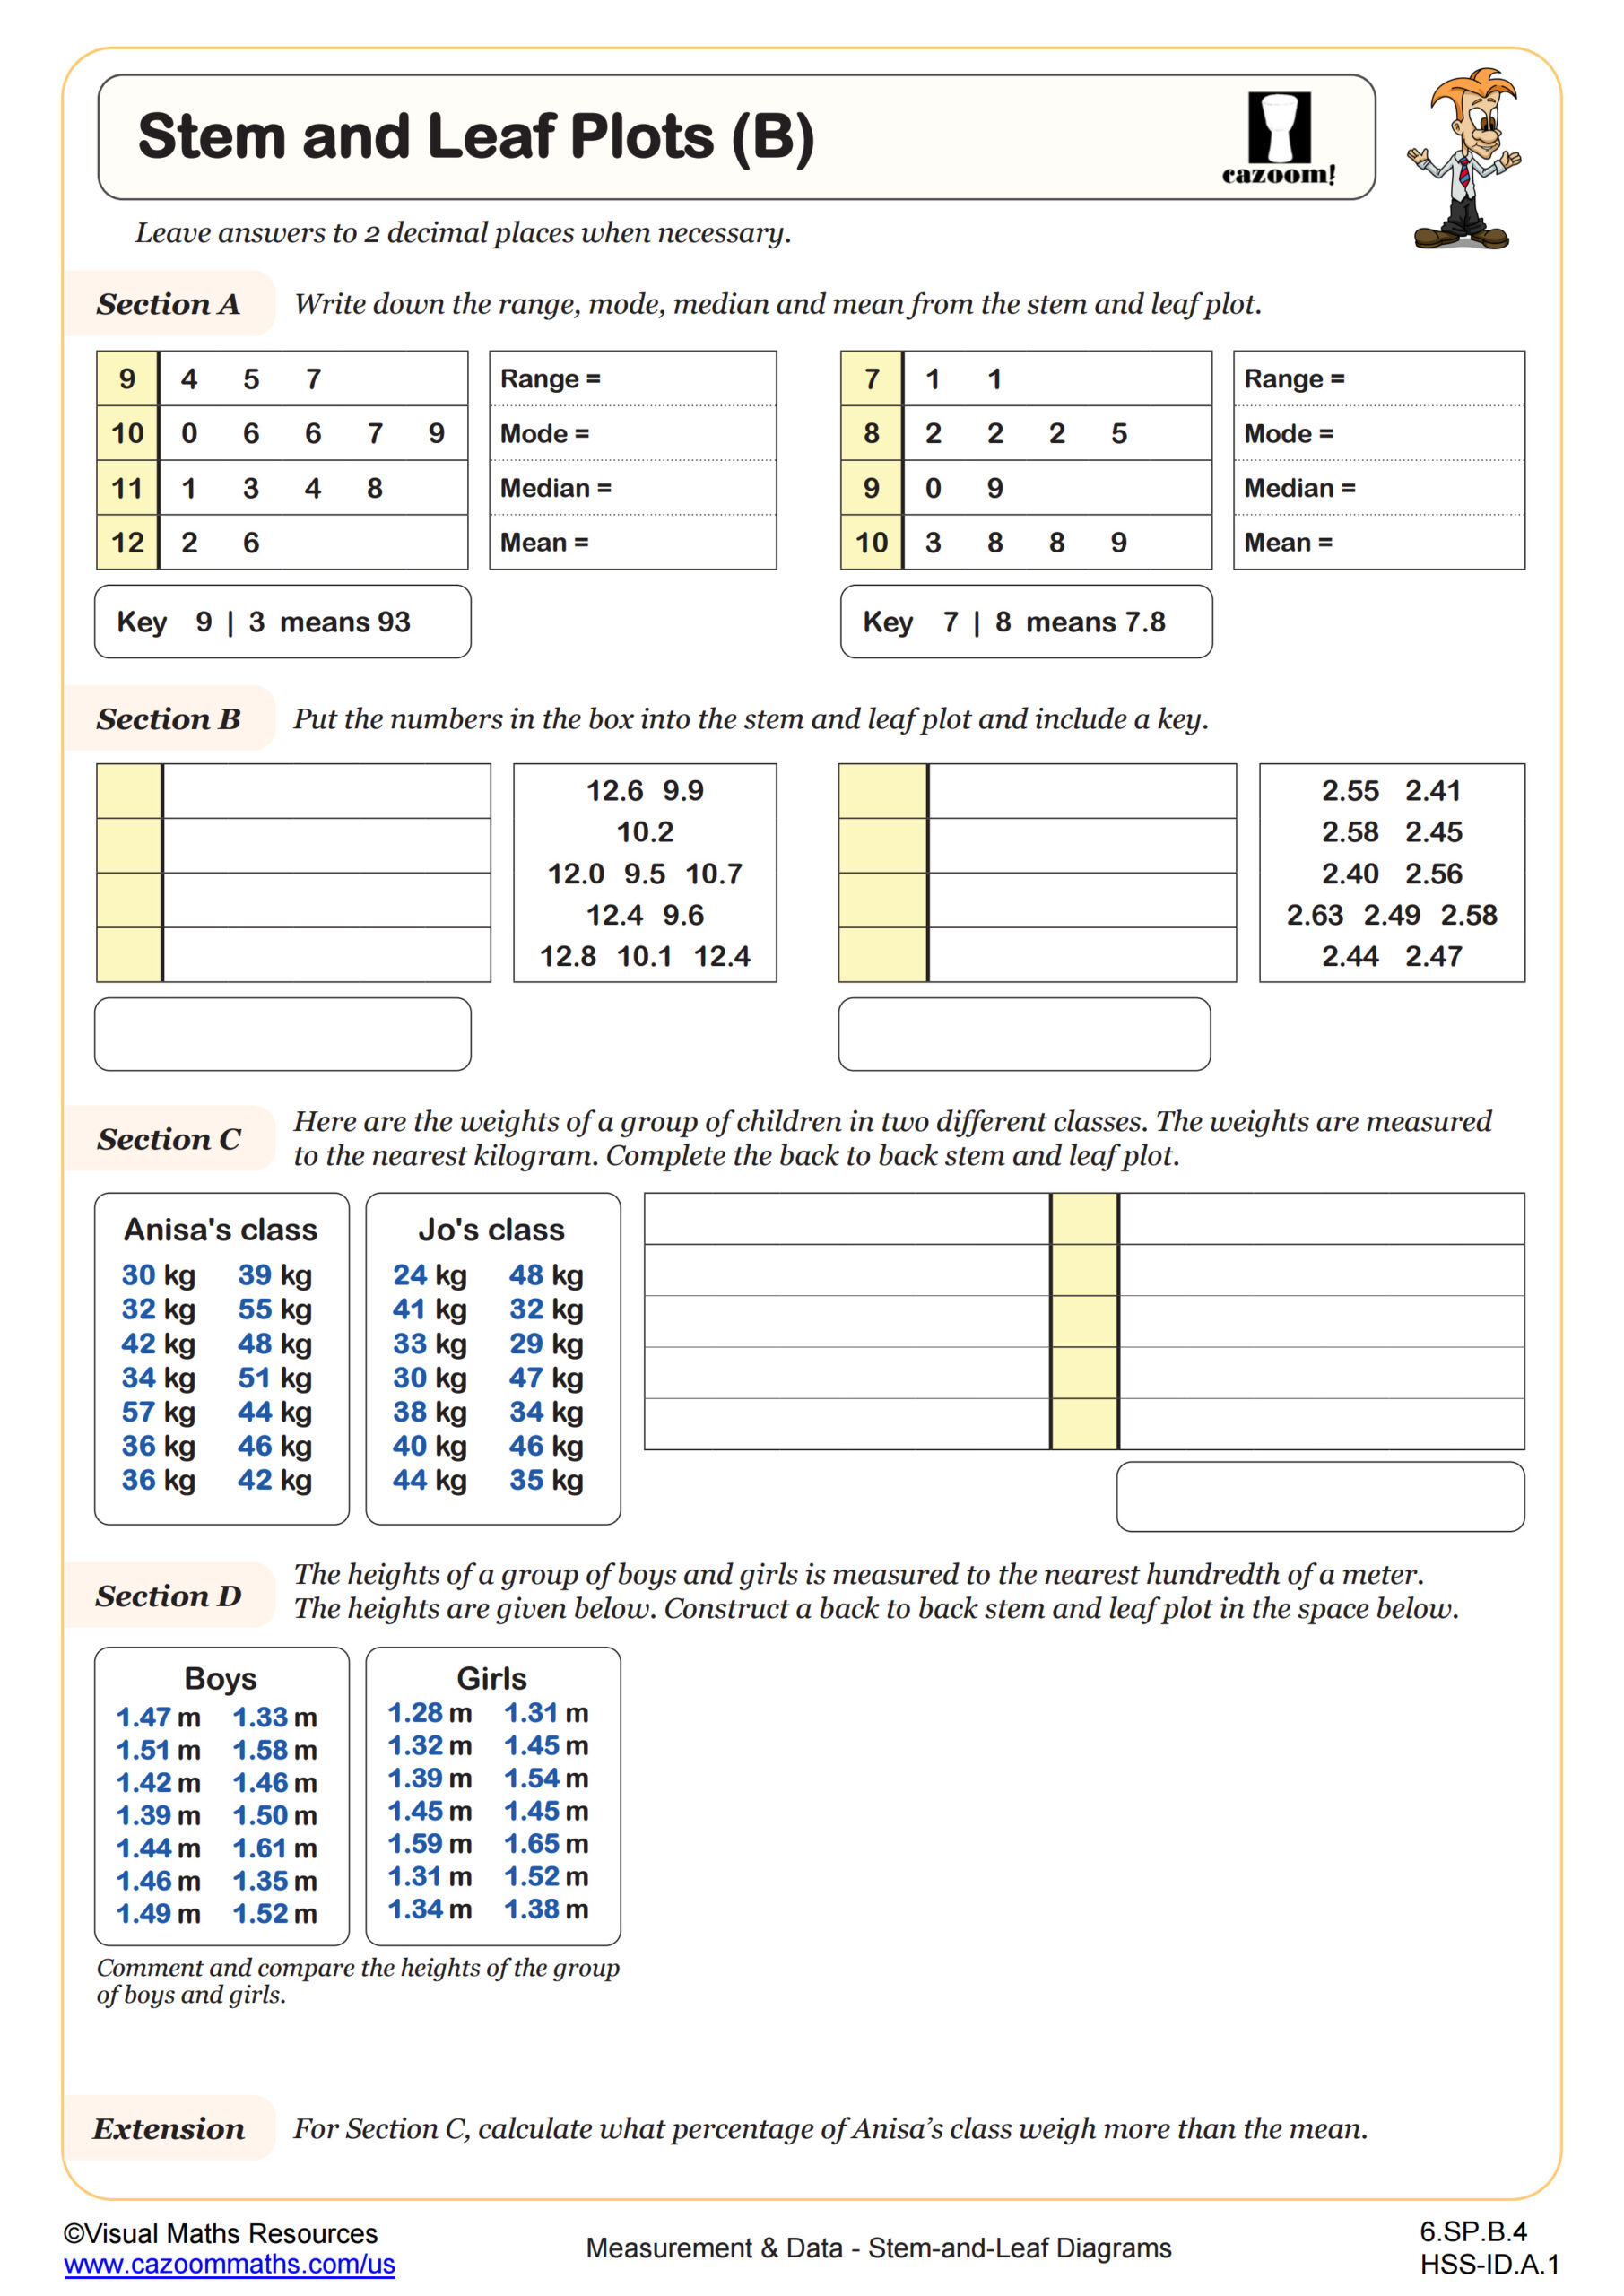
These worksheets introduce statistical representation through a clear concrete-to-abstract sequence. Students start by reading and interpreting completed stem-and-leaf plots before learning to construct their own from raw data. Fully worked solutions demonstrate how to calculate range, median, and interquartile range while interpreting real-world datasets.
Traditional Lessons or Worksheets? Why Cazoom Math Stem-and-Leaf Diagrams Work Best
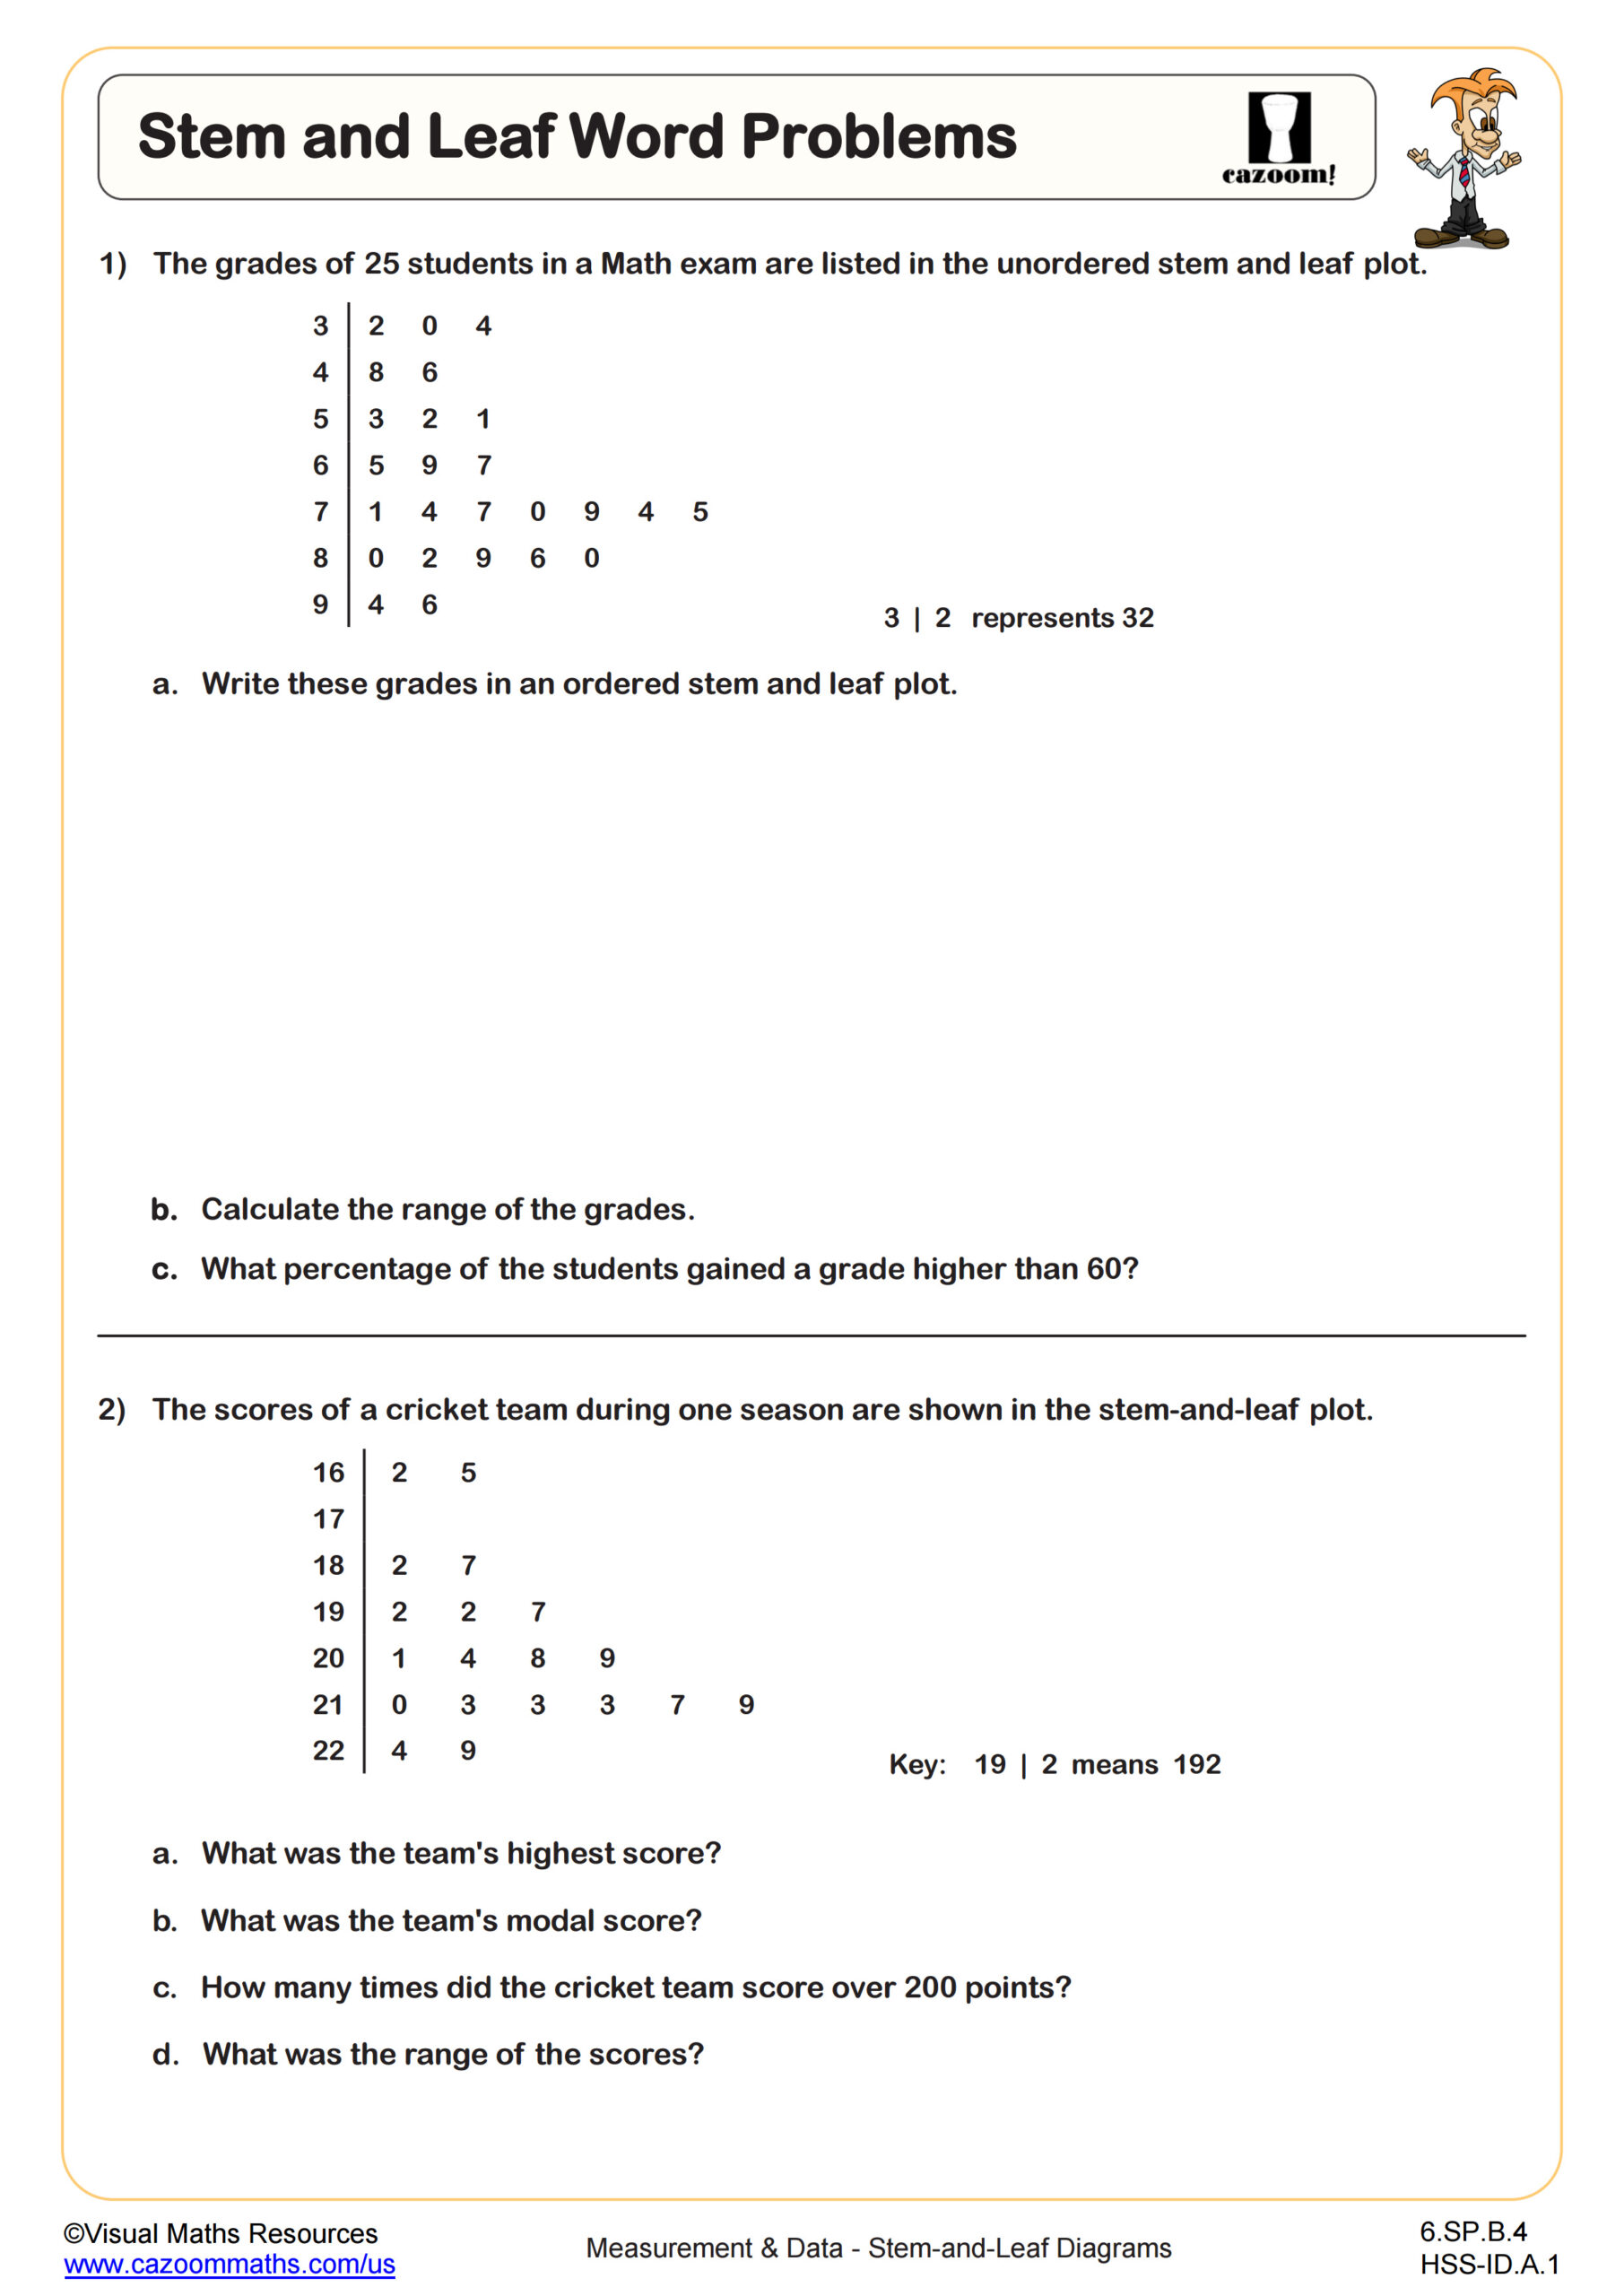
The clear layout makes these sheets ideal for warm-ups, independent practice, or homework assignments. Teachers differentiate easily by directing students to foundational exercises or challenging word problems based on readiness. The word problem sheet works particularly well for spiral review because it integrates multiple statistical concepts. Answer keys provide complete worked solutions that reveal the reasoning behind each step, not just final answers. This transparency helps teachers pinpoint exactly where misunderstandings occur during assessment review. The structured format reduces preparation time while maintaining rigorous mathematical thinking. Teachers use these worksheets for targeted intervention with small groups or as extension material for students who finish early.
Where Stem and Leaf Skills Apply Outside the Classroom
Organizing numerical information appears constantly in academic and personal contexts. The method remains valuable whenever preserving exact values matters more than creating simplified graphs.
• Compare test scores across classes or terms.
• Track daily temperatures or rainfall.
• Organise sports stats to spot patterns.
• Monitor fitness data like steps or exercise minutes.