Middle School Two-Way Tables and Pictograms Worksheets
All worksheets are created by the team of experienced teachers at Cazoom Math.
The Hidden Benefits of Our Printable Middle School Two-Way Tables and Pictograms Worksheets
Students arrive at middle school able to read simple charts and tallies. Two-way tables make it challenging for users to arrange their data because they require sorting by two categories simultaneously. Students learn to identify connections between categories through this skill, which shows them patterns that single-variable charts cannot detect. Students who learn these layouts will develop logical thinking skills that they can use in all mathematical subjects.
Students develop their skills in high school through regular practice with tables and pictograms before learning sampling methods, conditional probability, and bivariate analysis. Learning these formats helps students better understand complex statistical concepts.
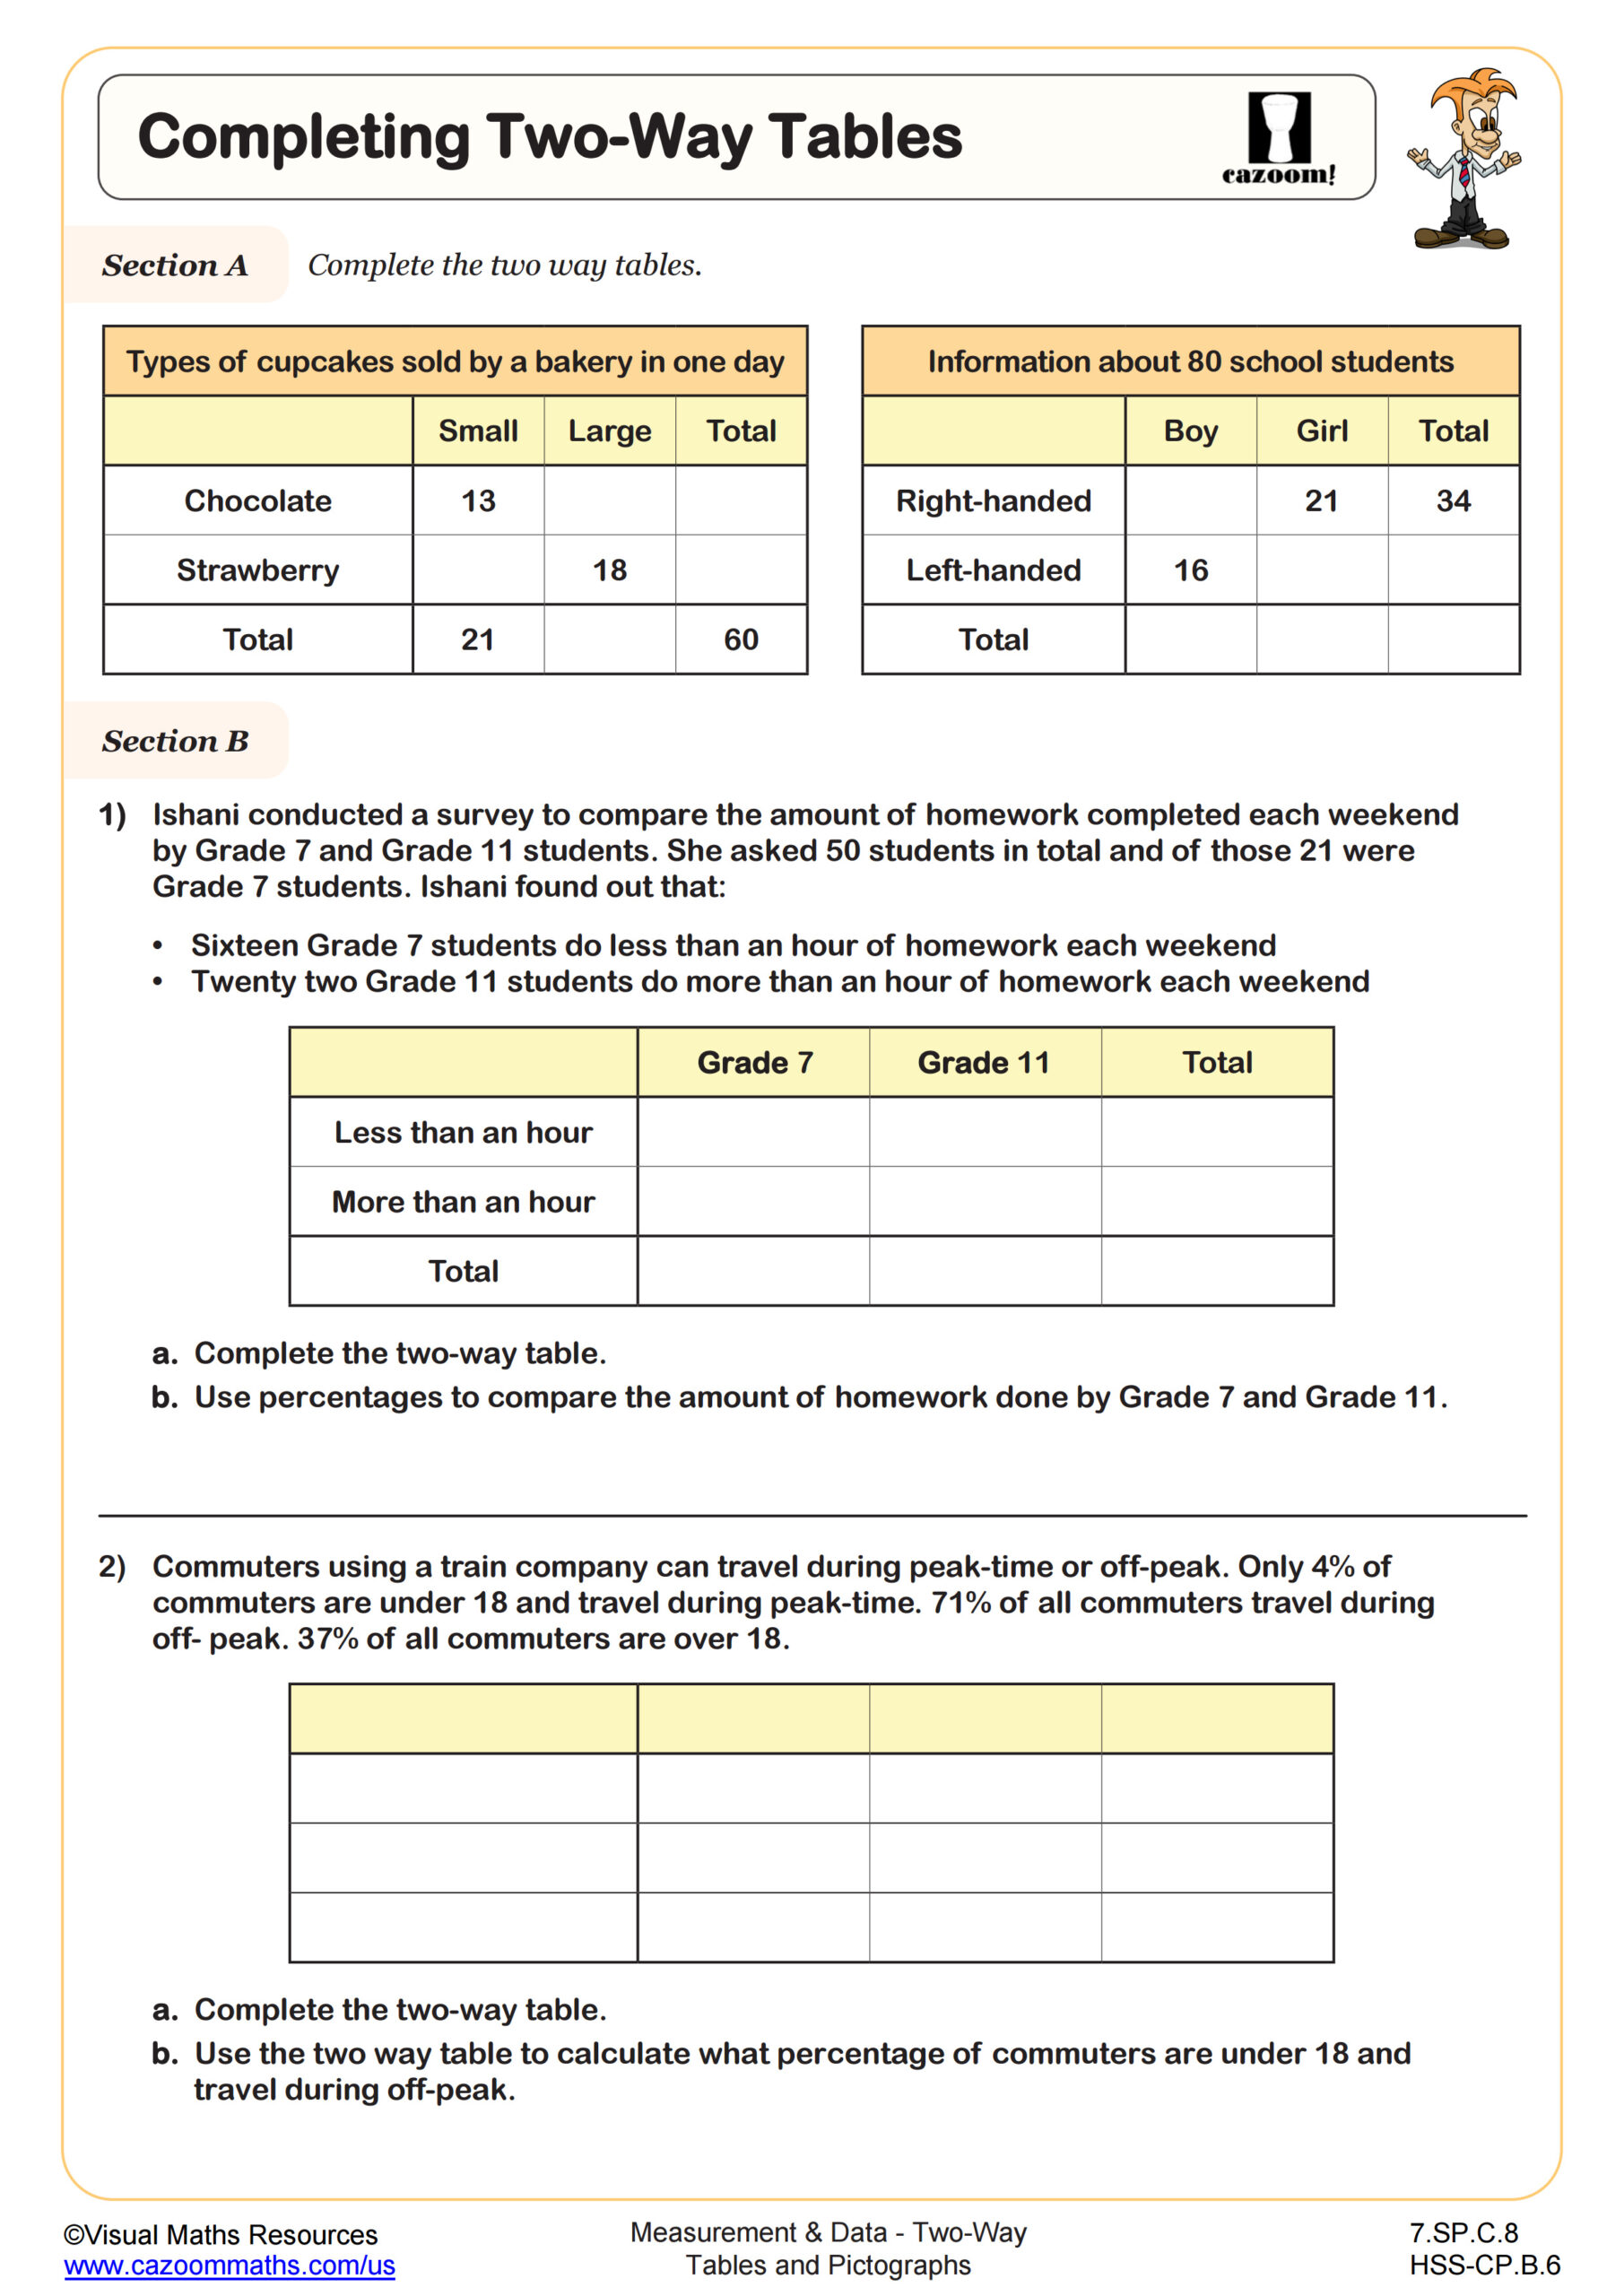
Topics at a Glance: Two-Way Tables, Pictographs, Tree Diagrams, and More
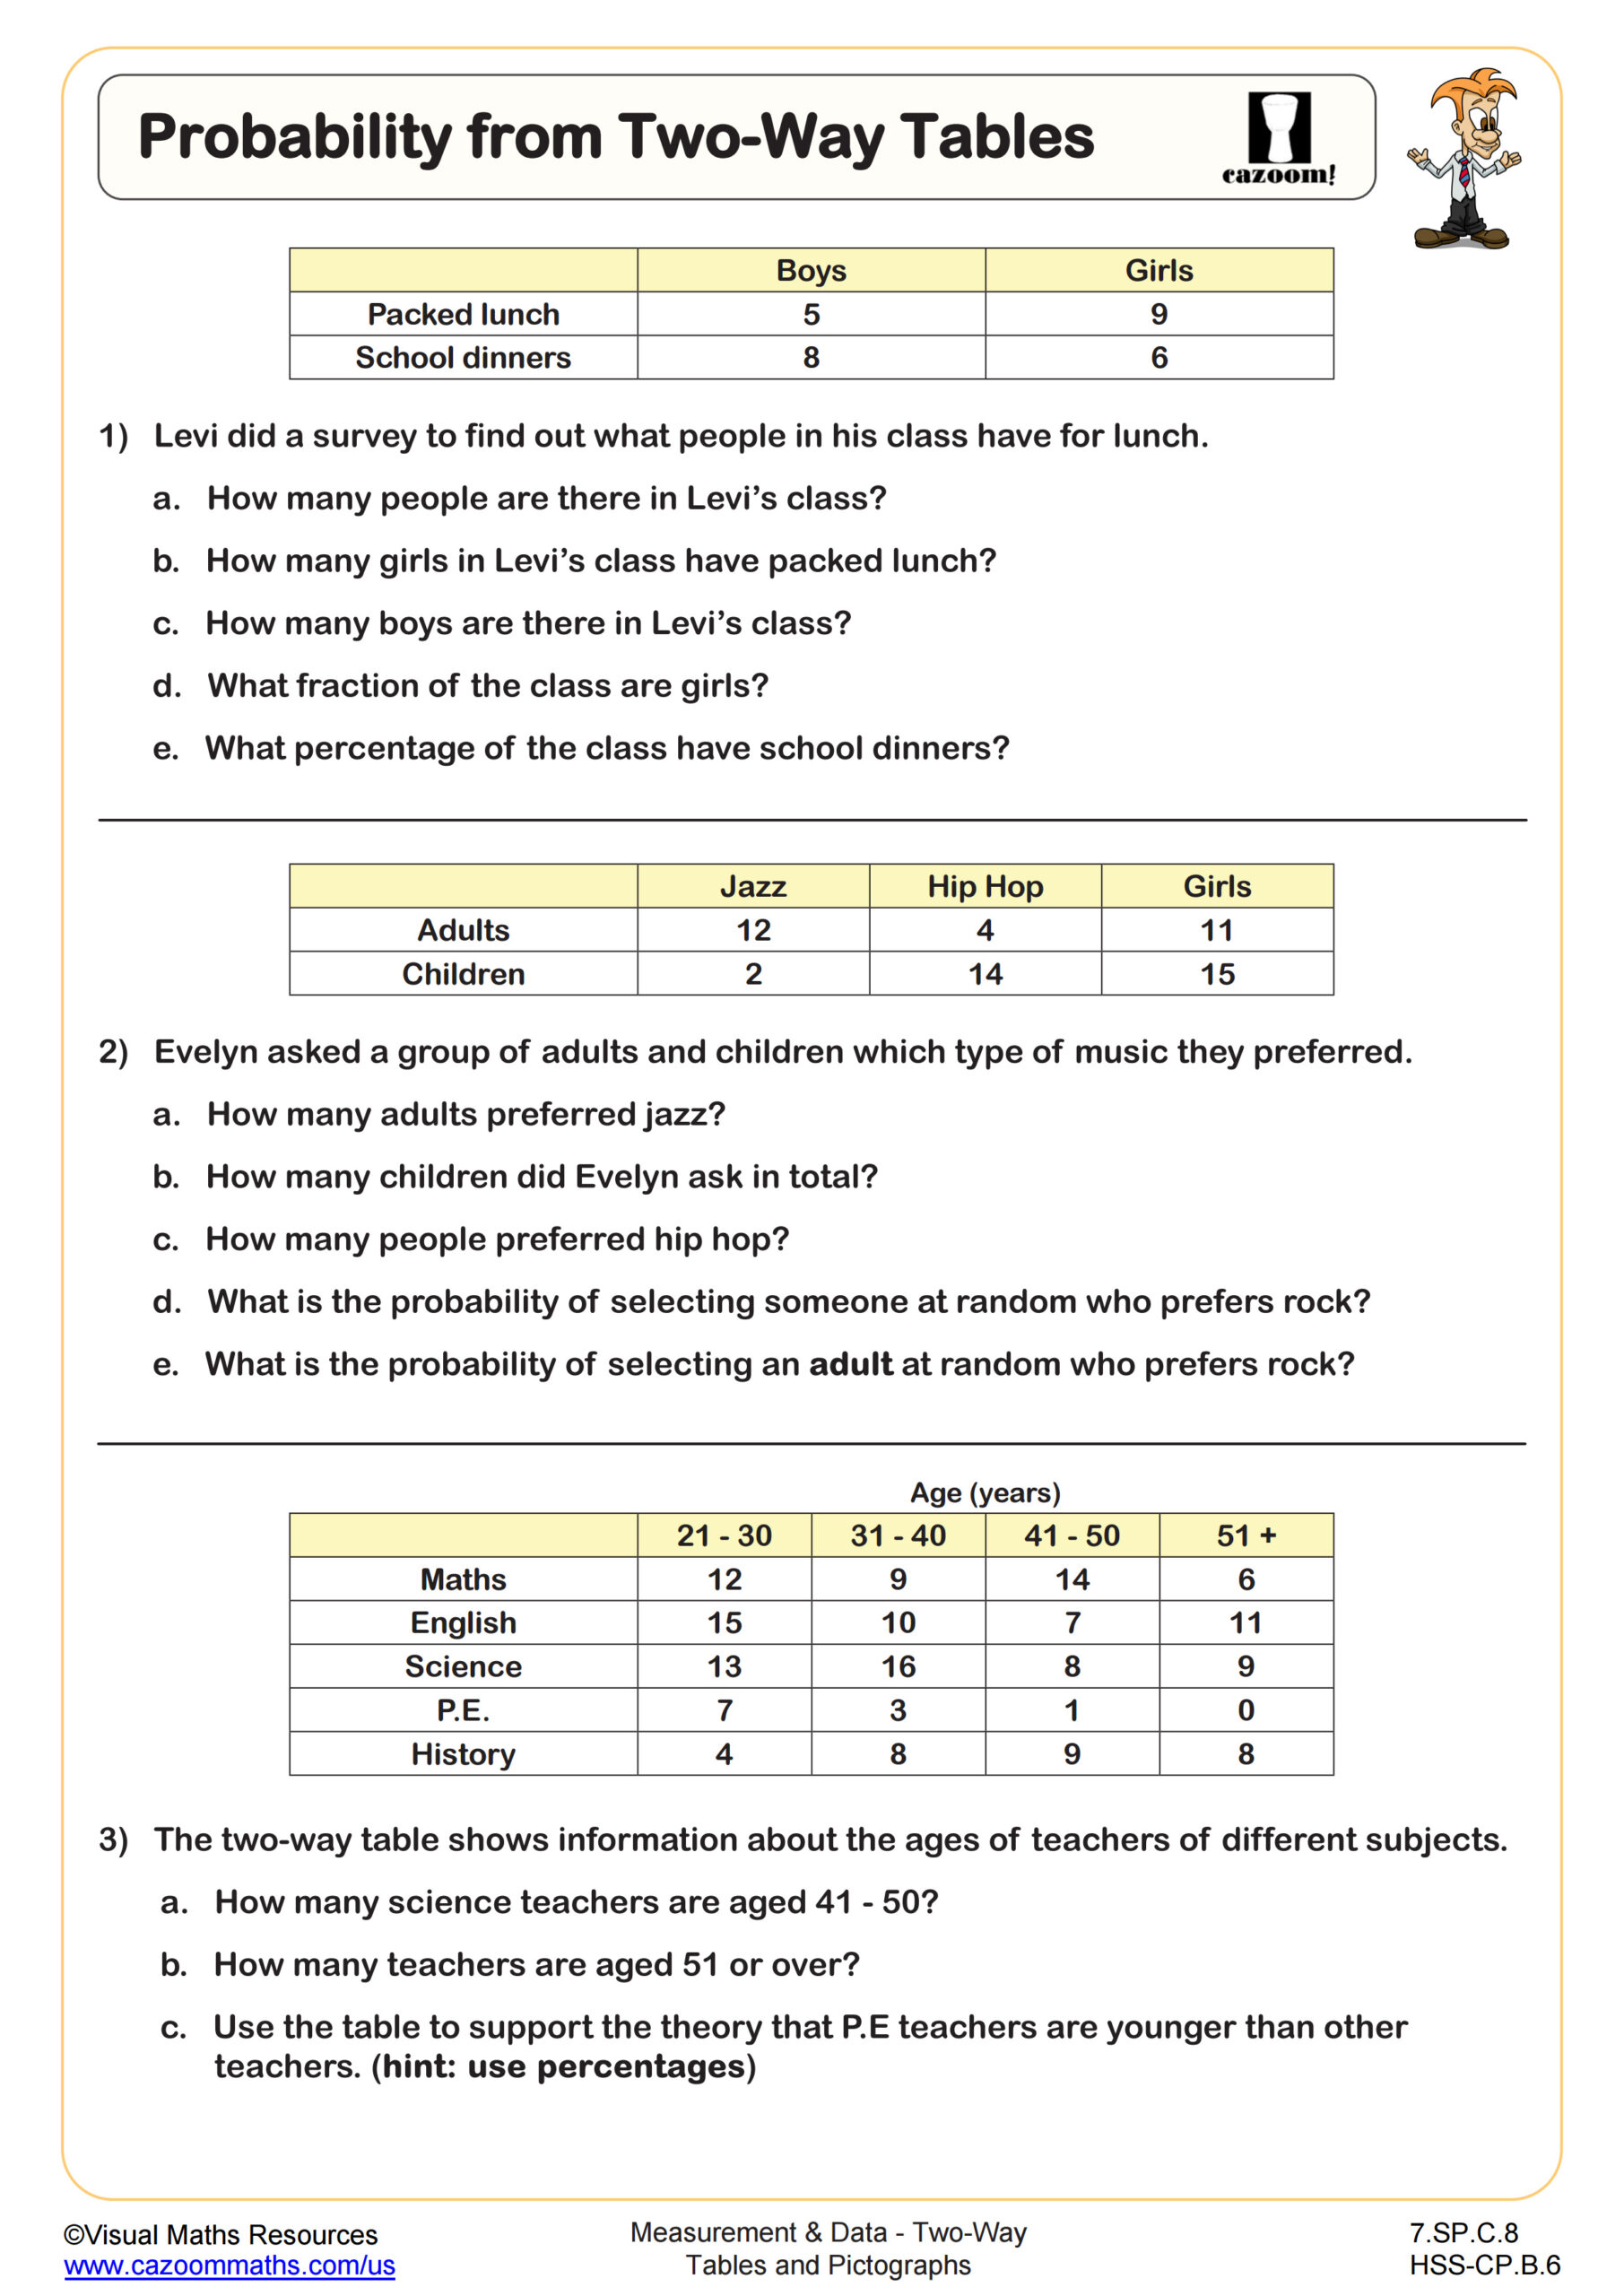
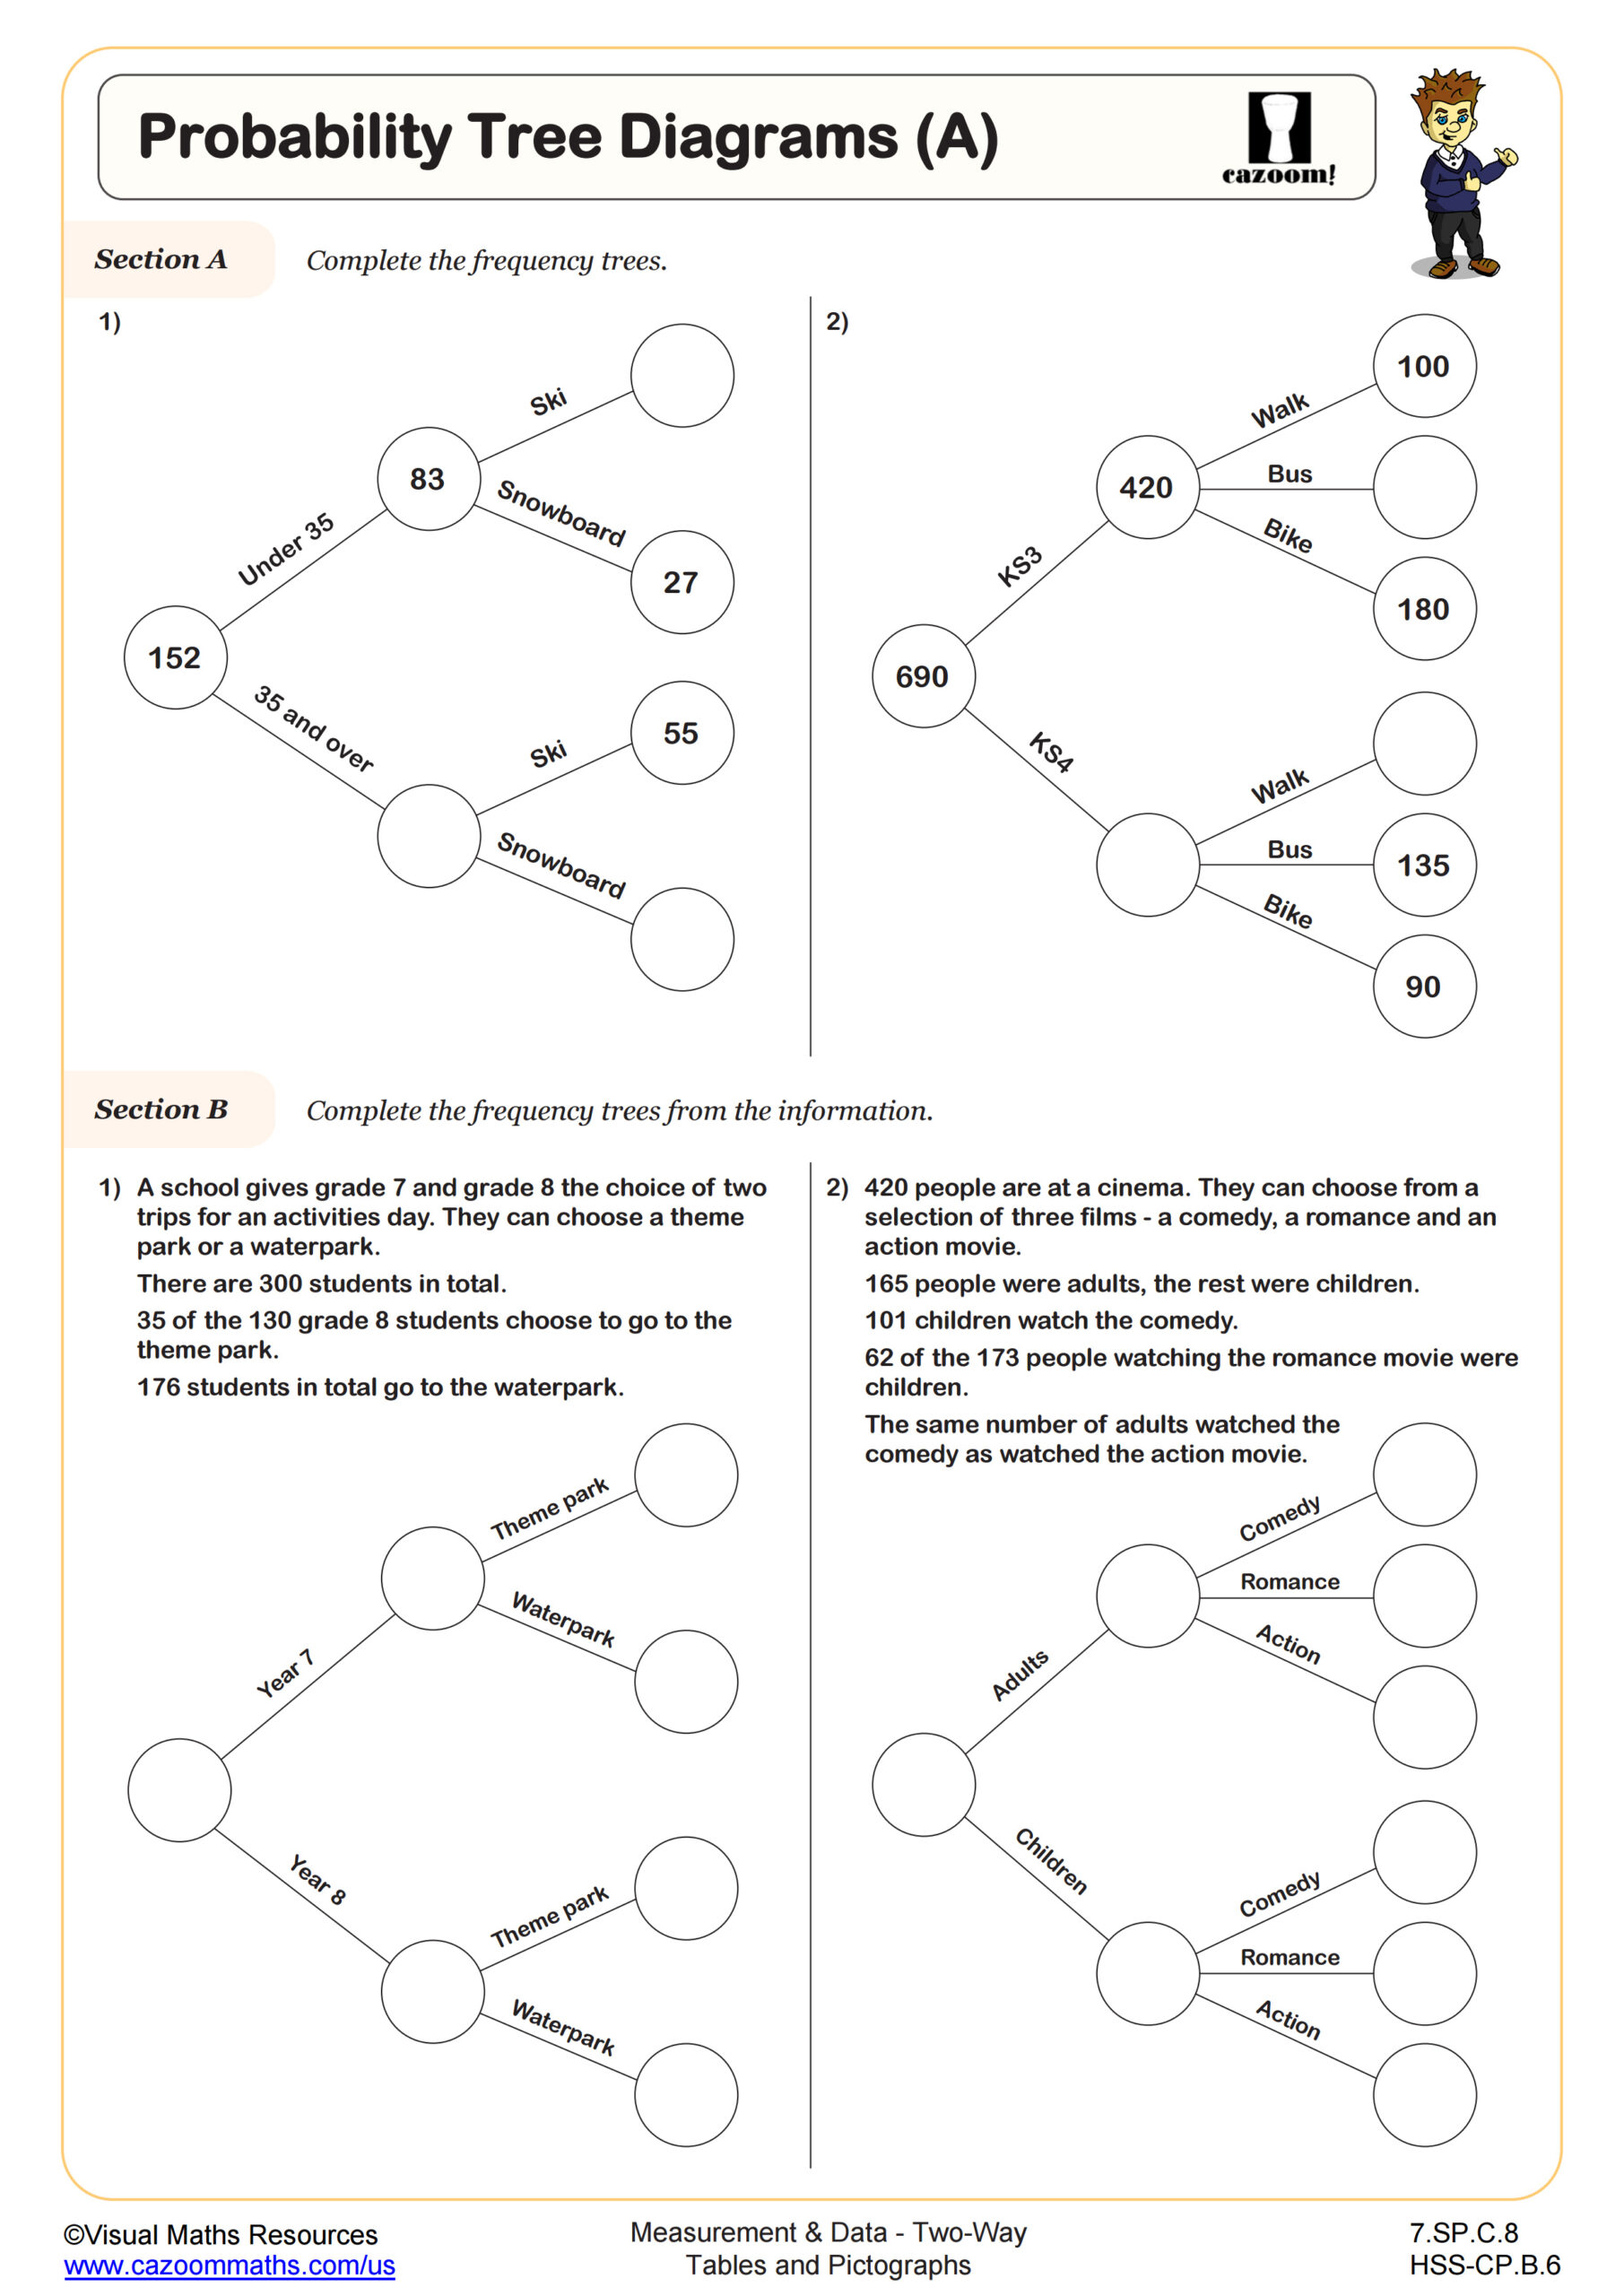
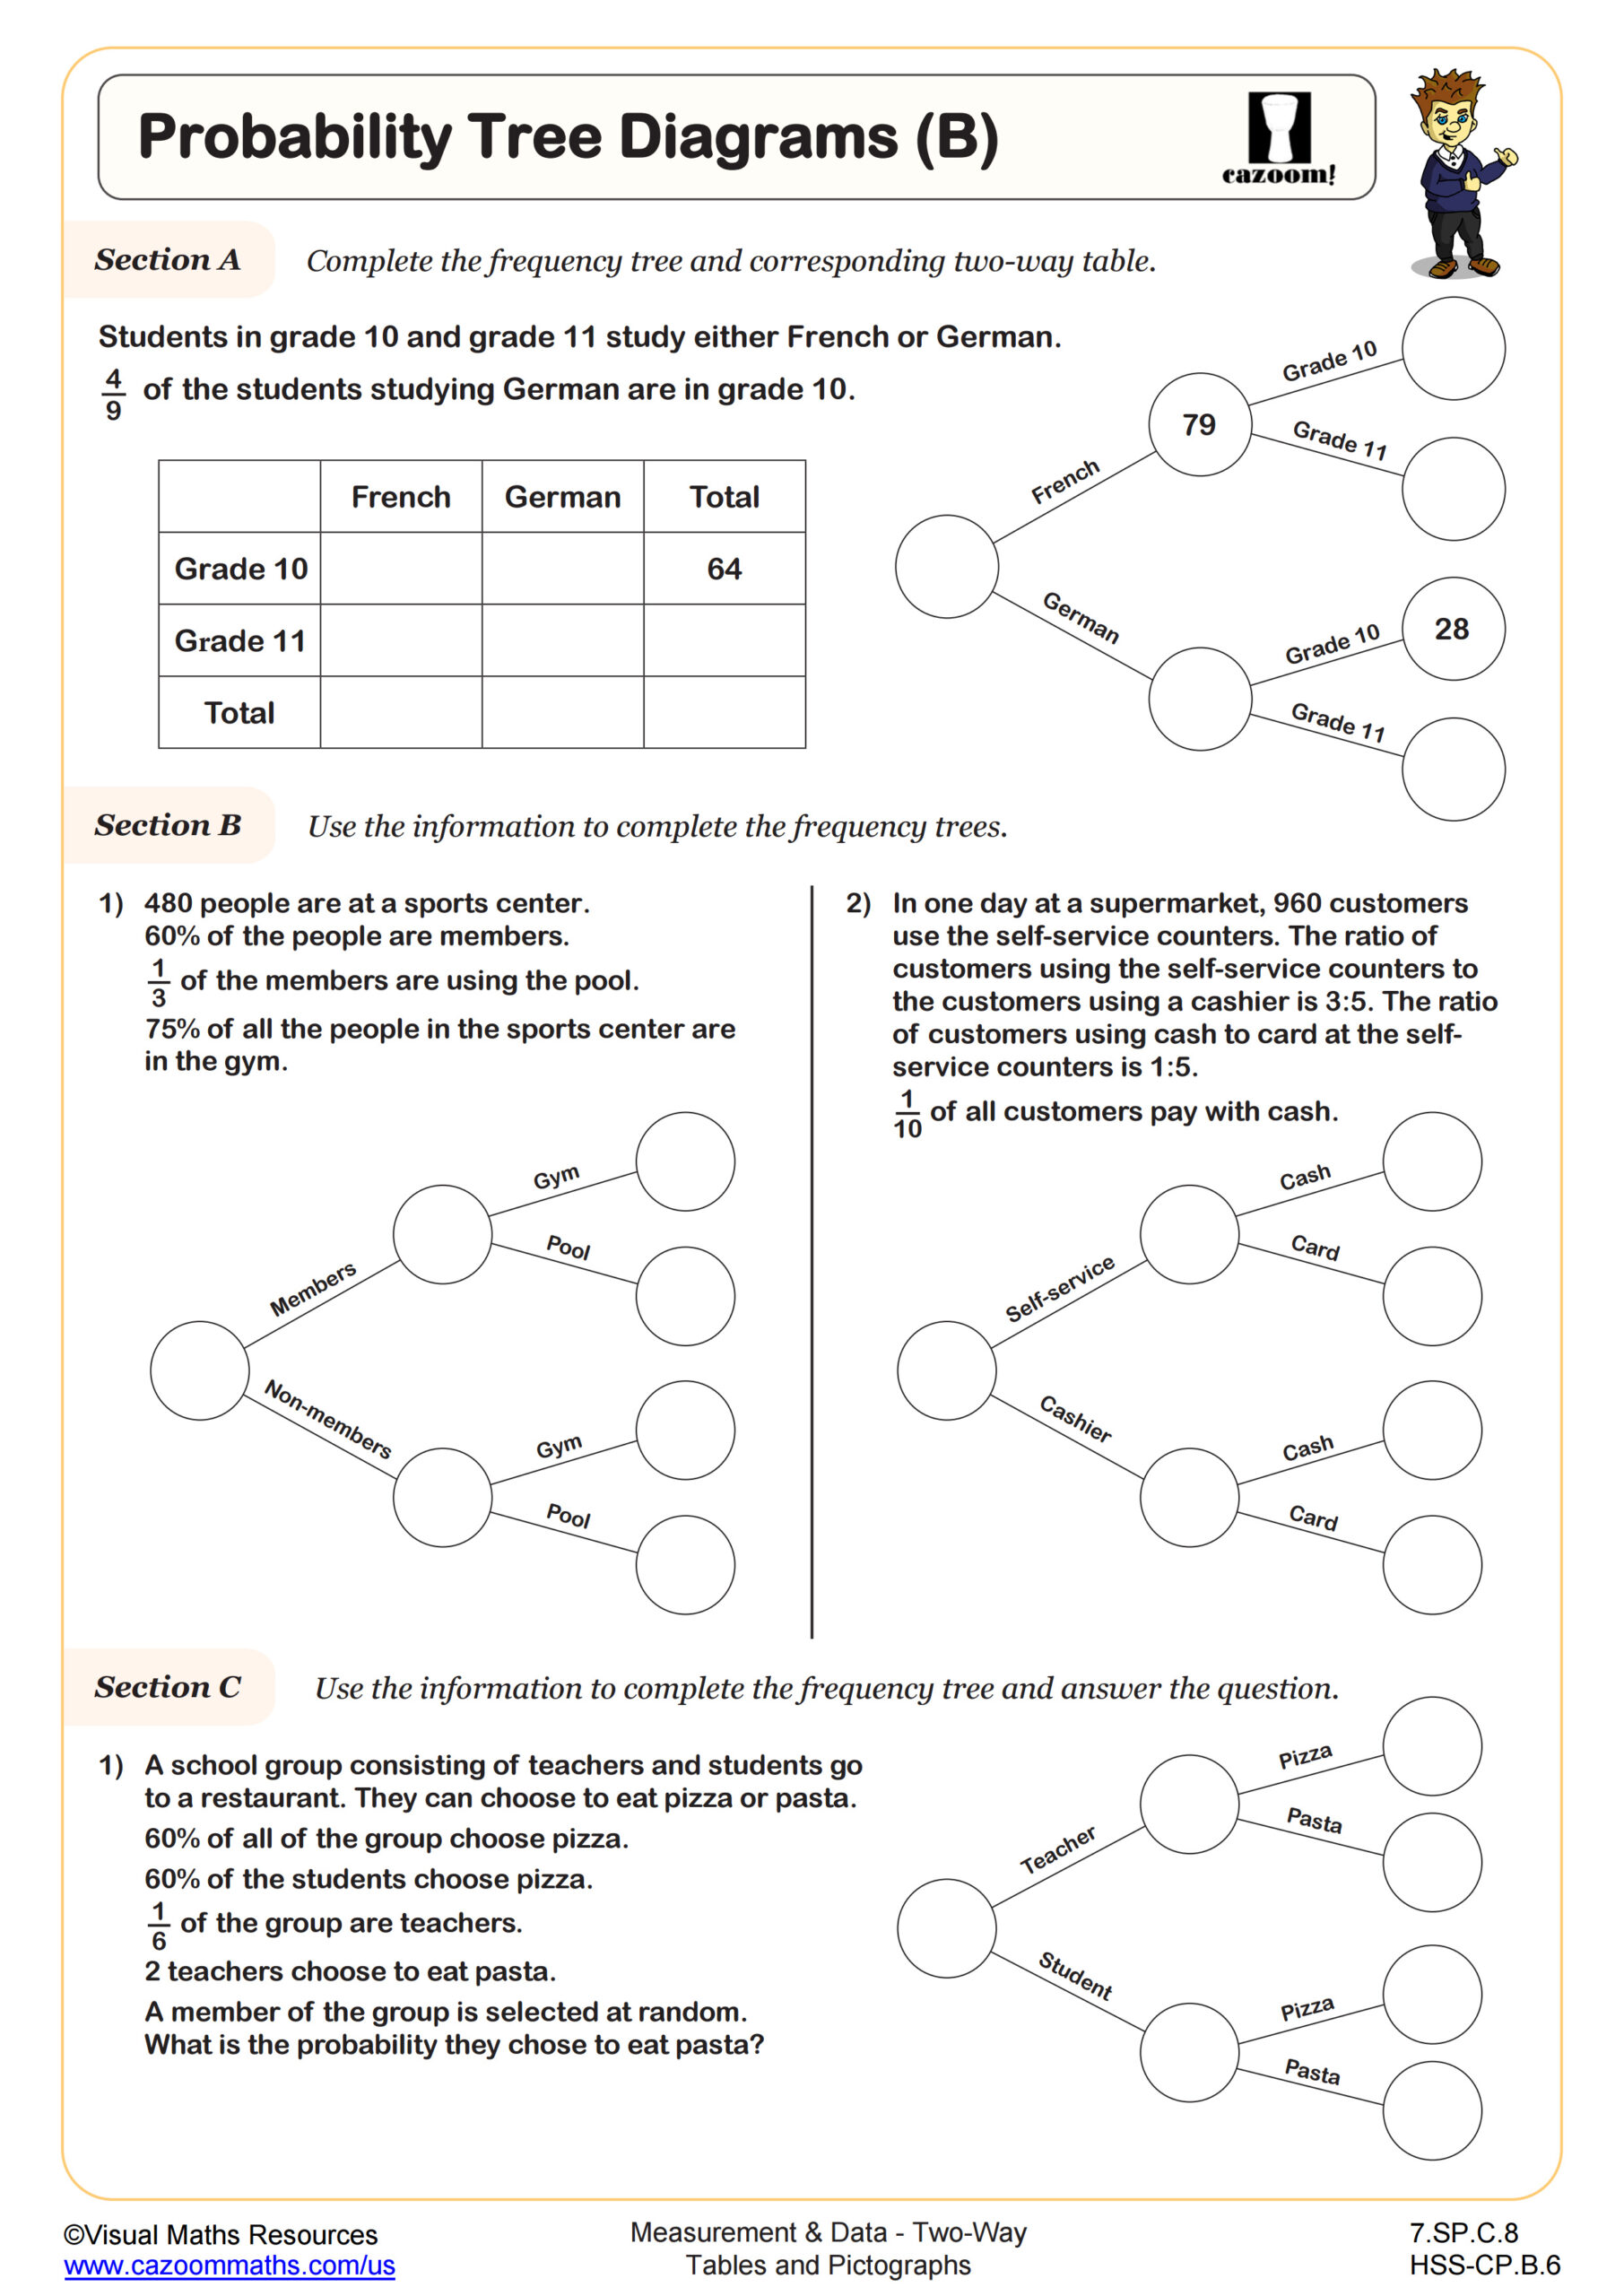
These worksheets build statistical reasoning through clear, progressive activities. Learners begin by organizing and interpreting data in two-way tables, strengthening their understanding of relationships between variables. They then advance to calculating probabilities, exploring conditional events, and constructing multi-stage tree diagrams. Each task introduces new reasoning skills while reinforcing prior knowledge. Complete answer sheets guide students through every stage, ensuring they can follow each logical step, check their methods, and develop confidence in solving probability problems accurately.
Why Teachers Choose Cazoom Math Middle School Two-Way Tables and Pictograms Resources
The collection contains materials that span all skill levels, which simplifies the process of differentiating instruction. Teachers should assign table-completion work to students who need simple assistance, but should assign tree-diagram tasks to students who demonstrate readiness for complex problem-solving. The worksheets serve as formative assessments that indicate which concepts require extra practice.
The grading process becomes more efficient when students provide complete reasoning in their solutions, rather than just presenting final answers. Teachers can identify student logic errors by observing their work methods to deliver targeted feedback. The ready-made format enables teachers to avoid searching for materials that align with curriculum objectives, freeing up their planning time for other educational duties.
Where Two-Way Tables and Pictograms Appear in Everyday Situations
Data tables and pictograms fill news articles, product packaging, and digital dashboards. These skills help young people navigate a range of topics, from health information to financial decisions, as they transition toward independence.
• Compare product reviews and ratings.
• Read nutrition facts across brands.
• Interpret sports standings and records.
• Track personal fitness data like steps or heart rate.