Histograms and Frequency Polygon Worksheets in PDF
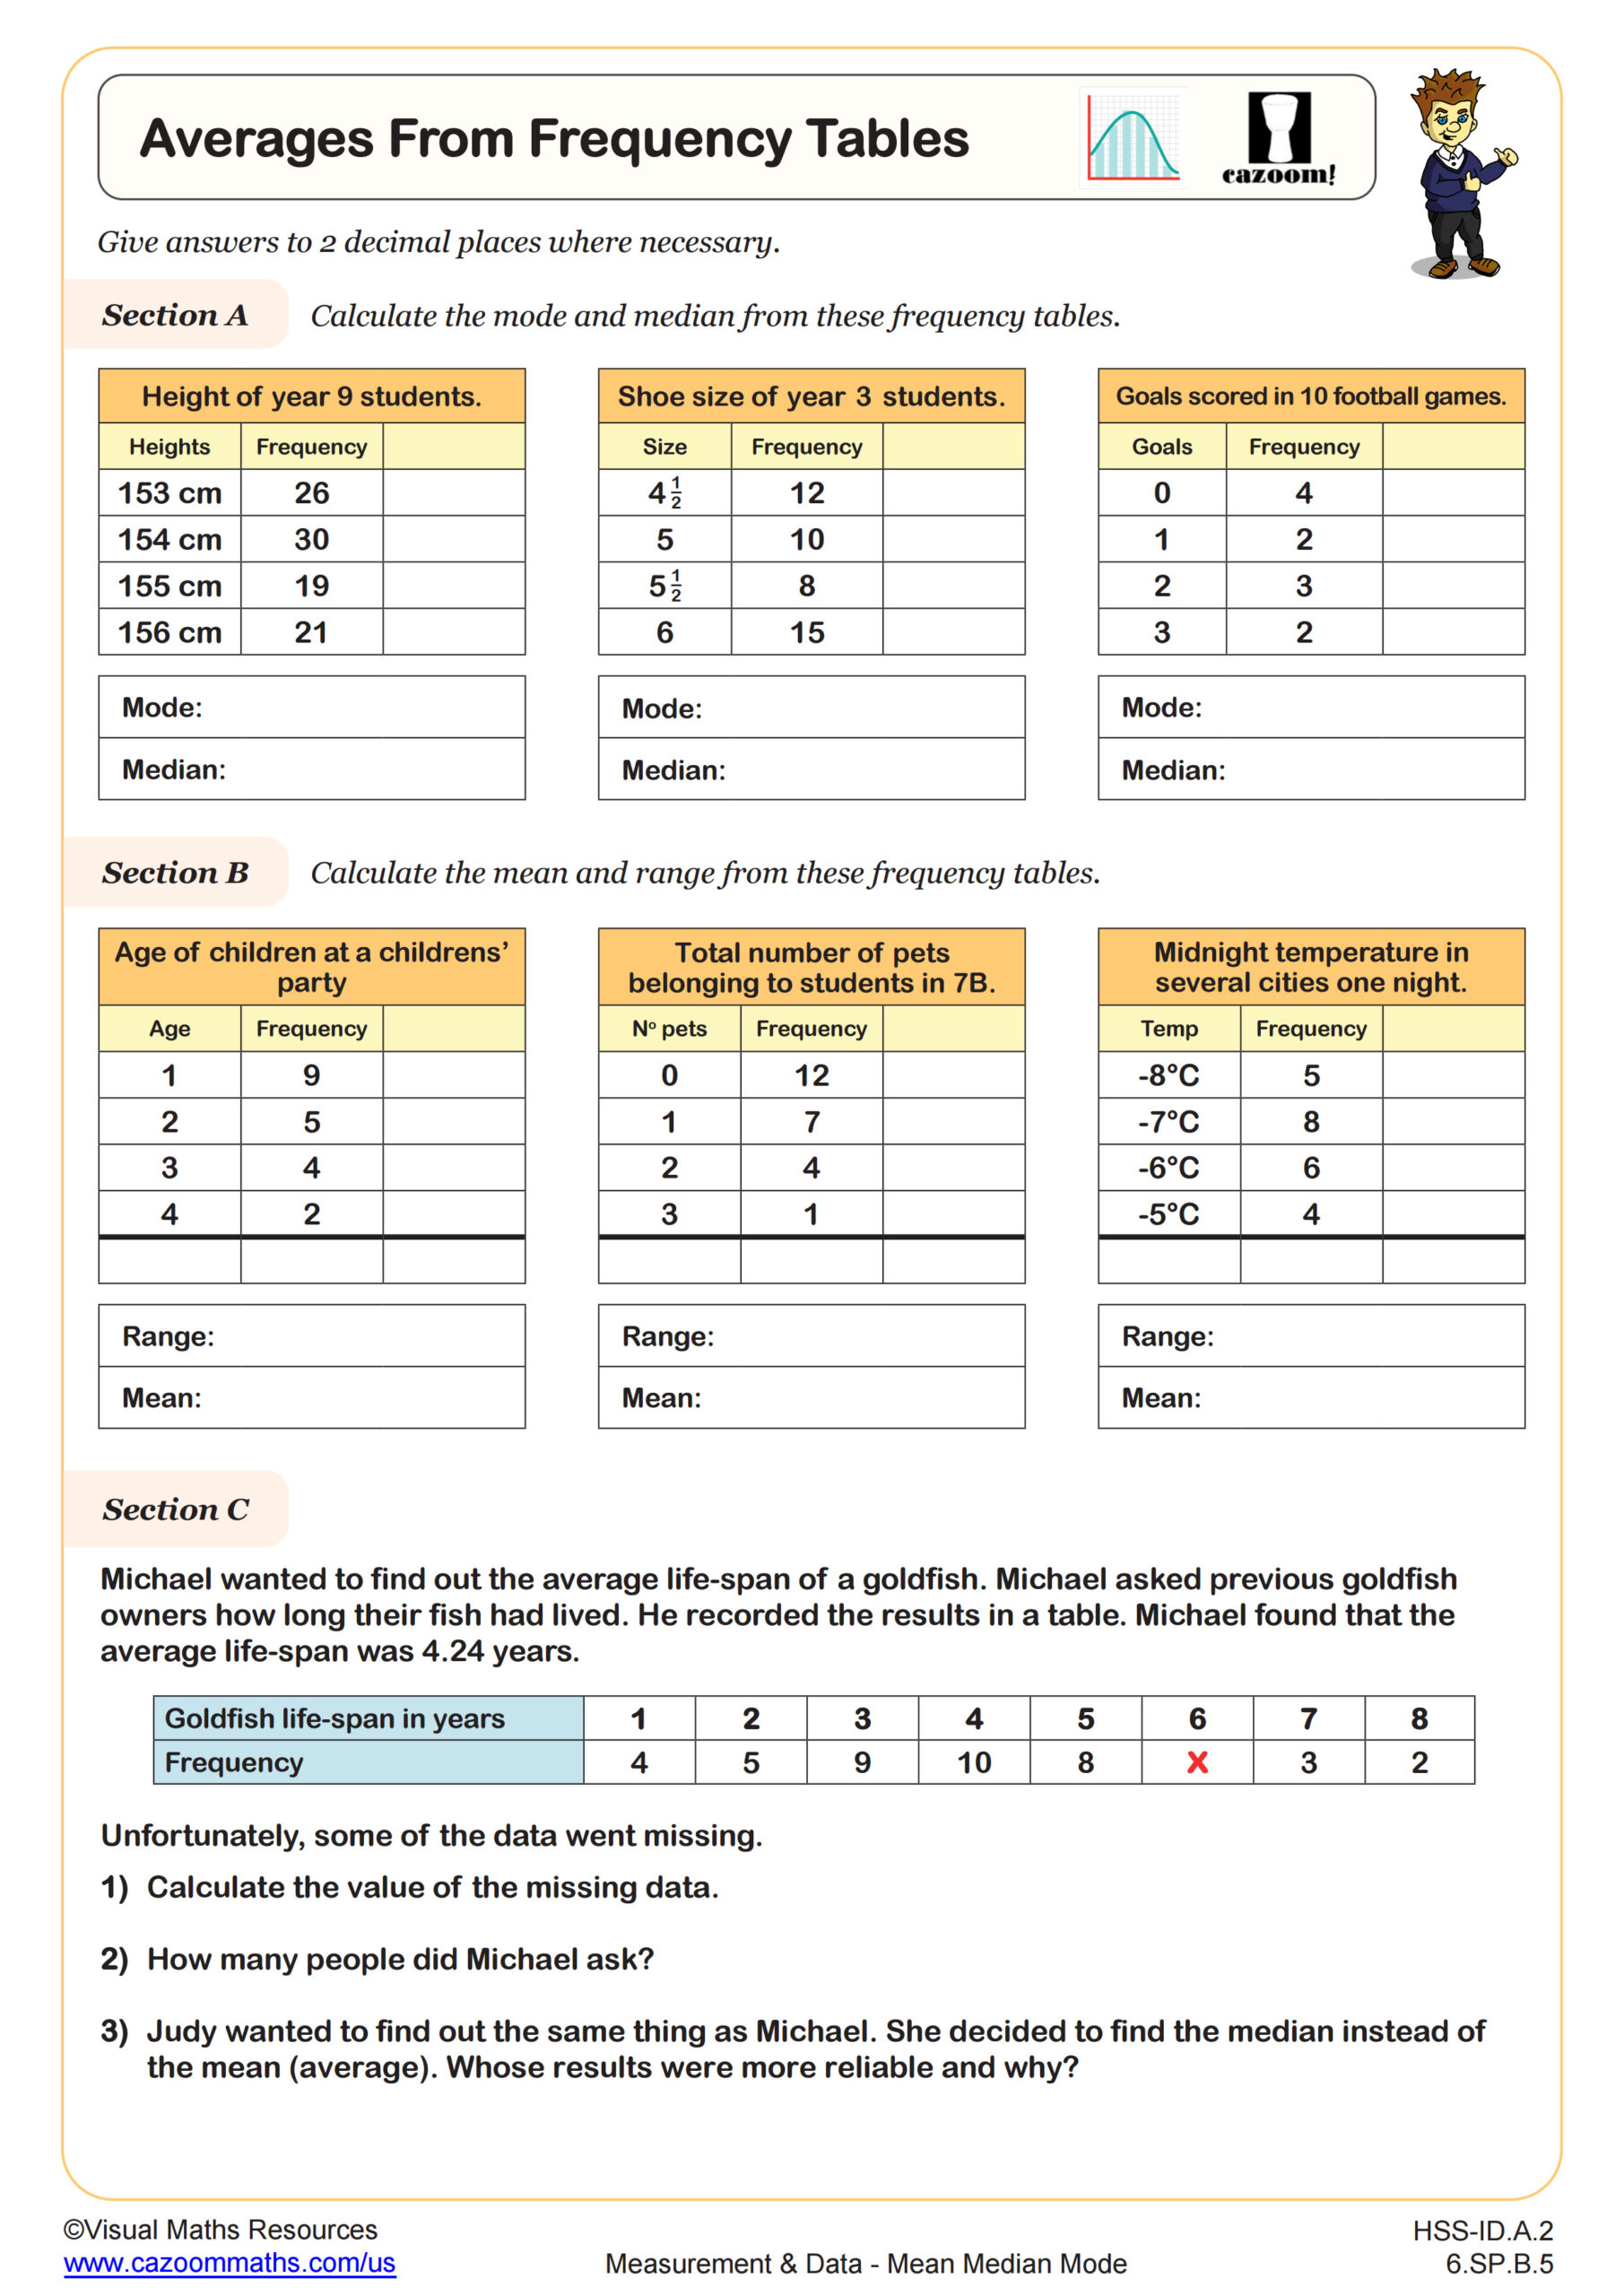
Averages from Frequency Tables
Grades: 6th Grade, Algebra I
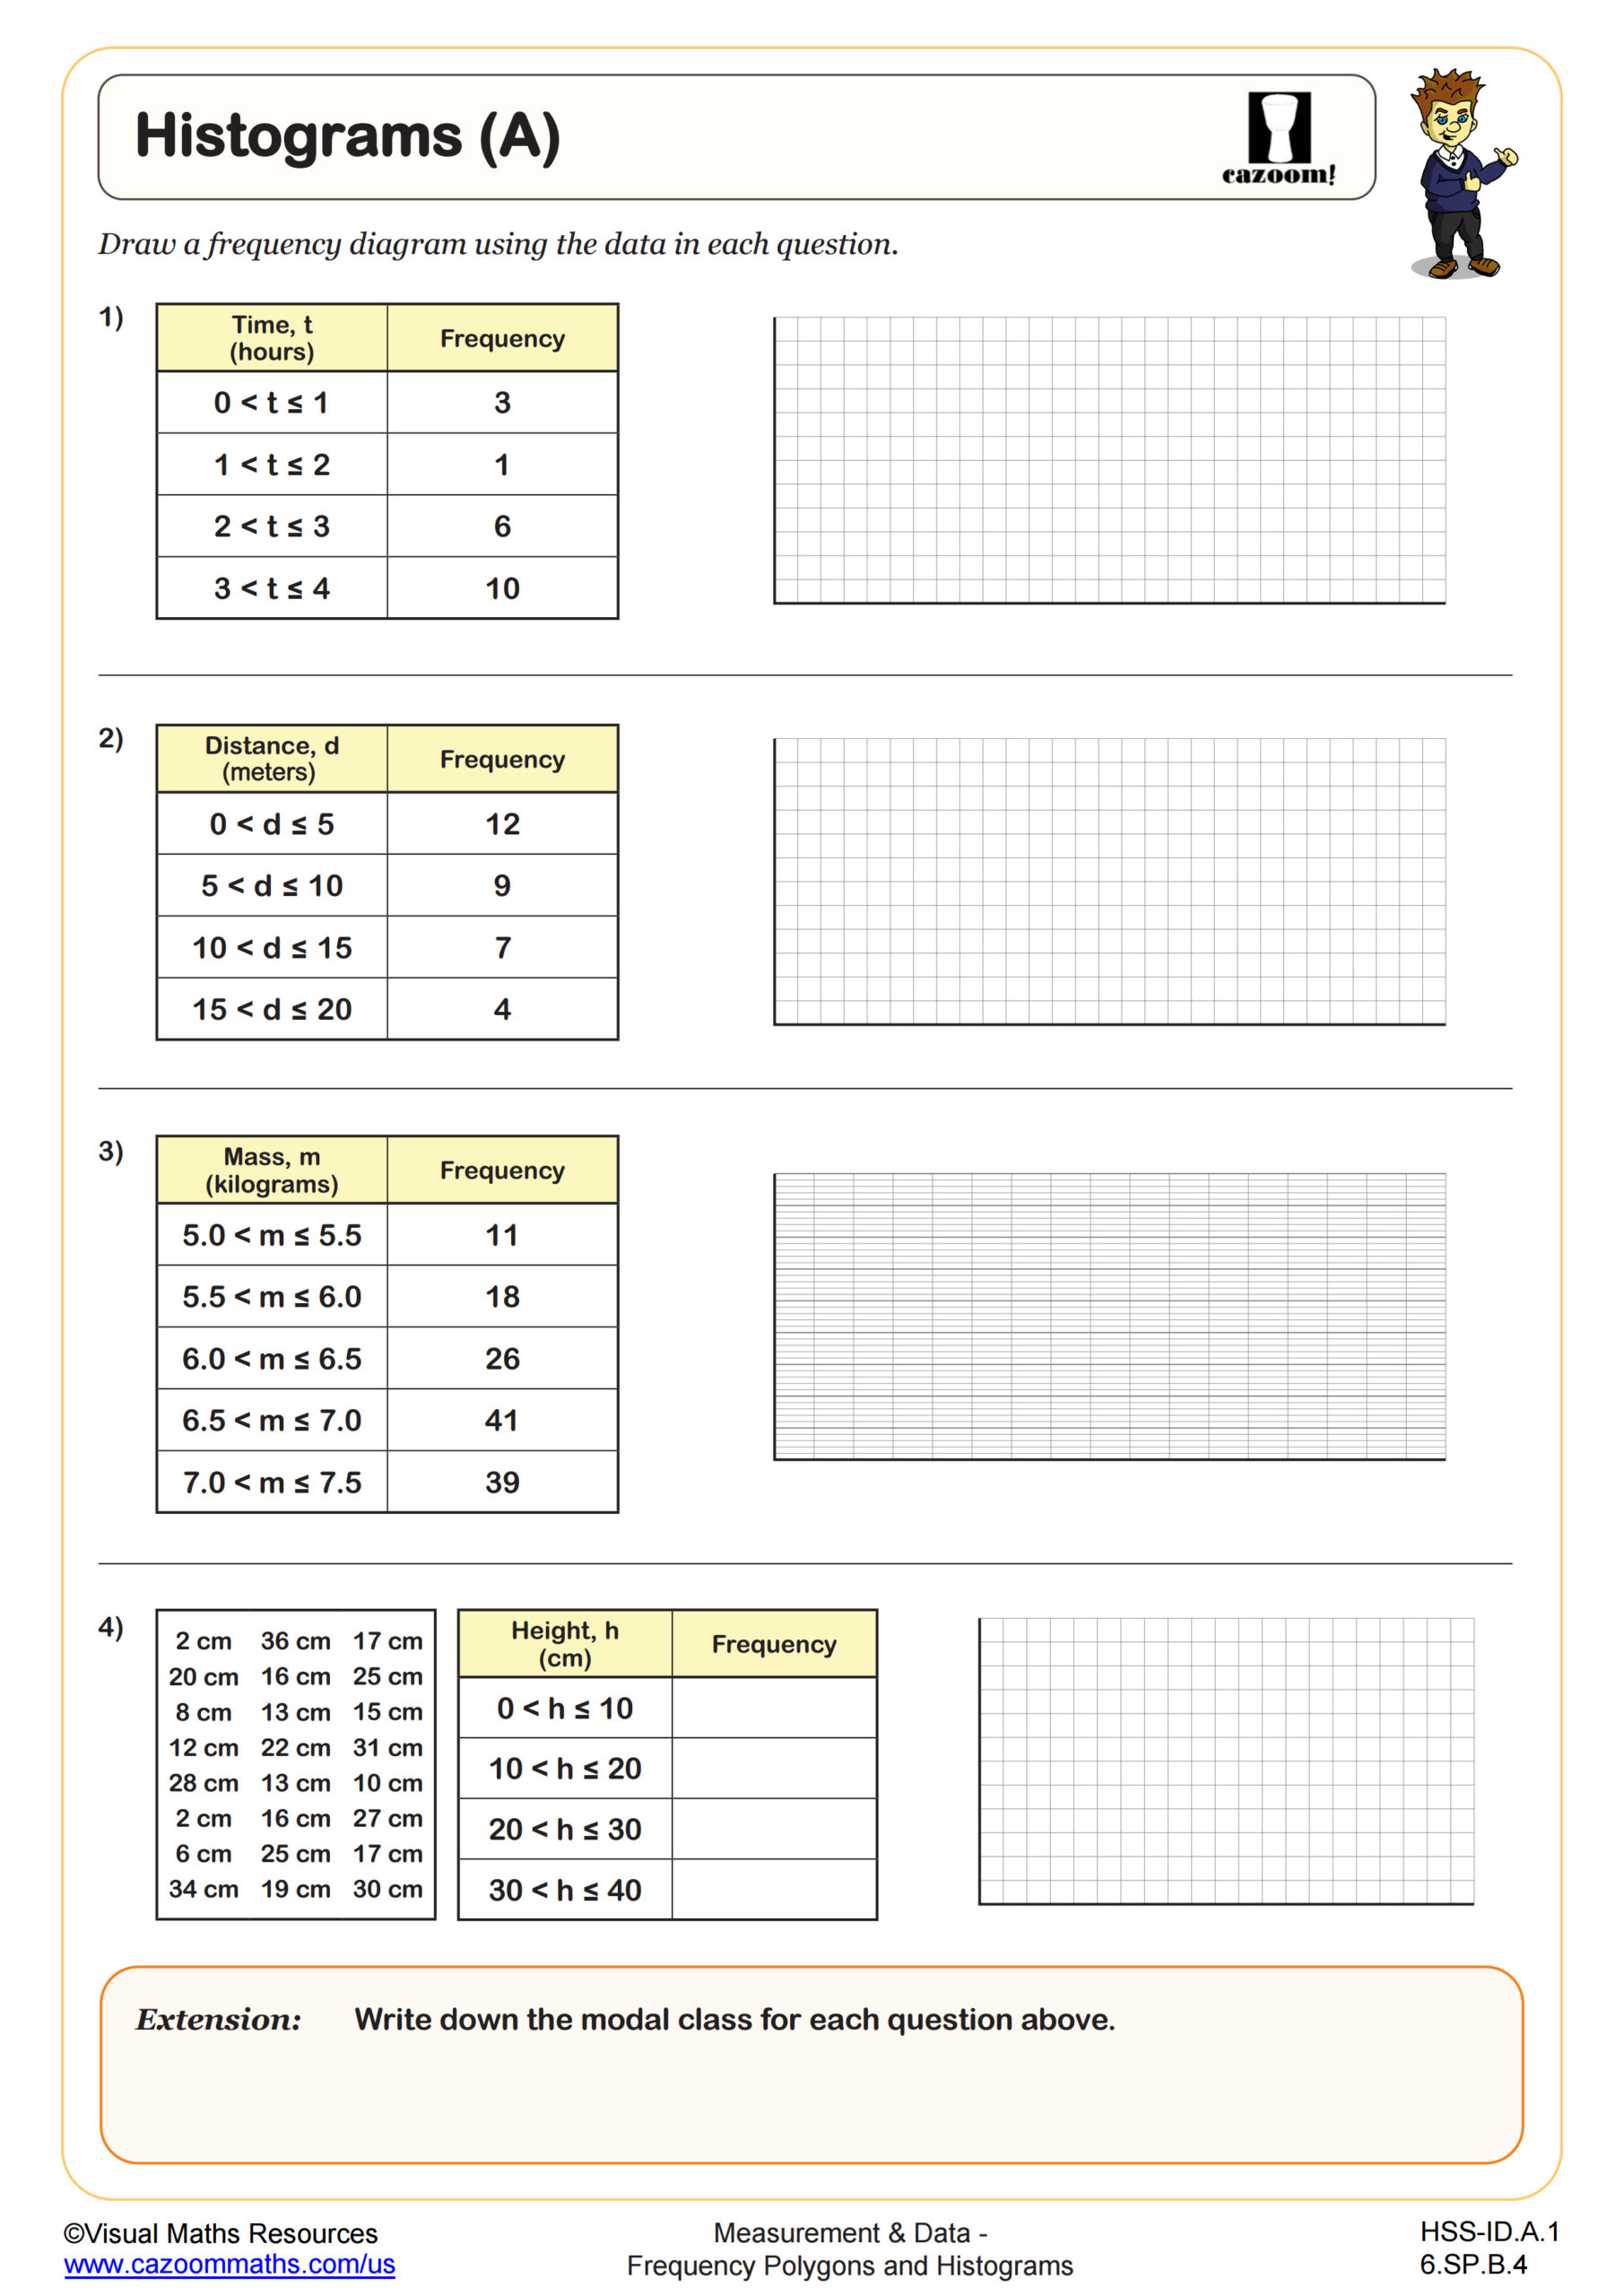
Histograms (A)
Grades: 6th Grade, Algebra I
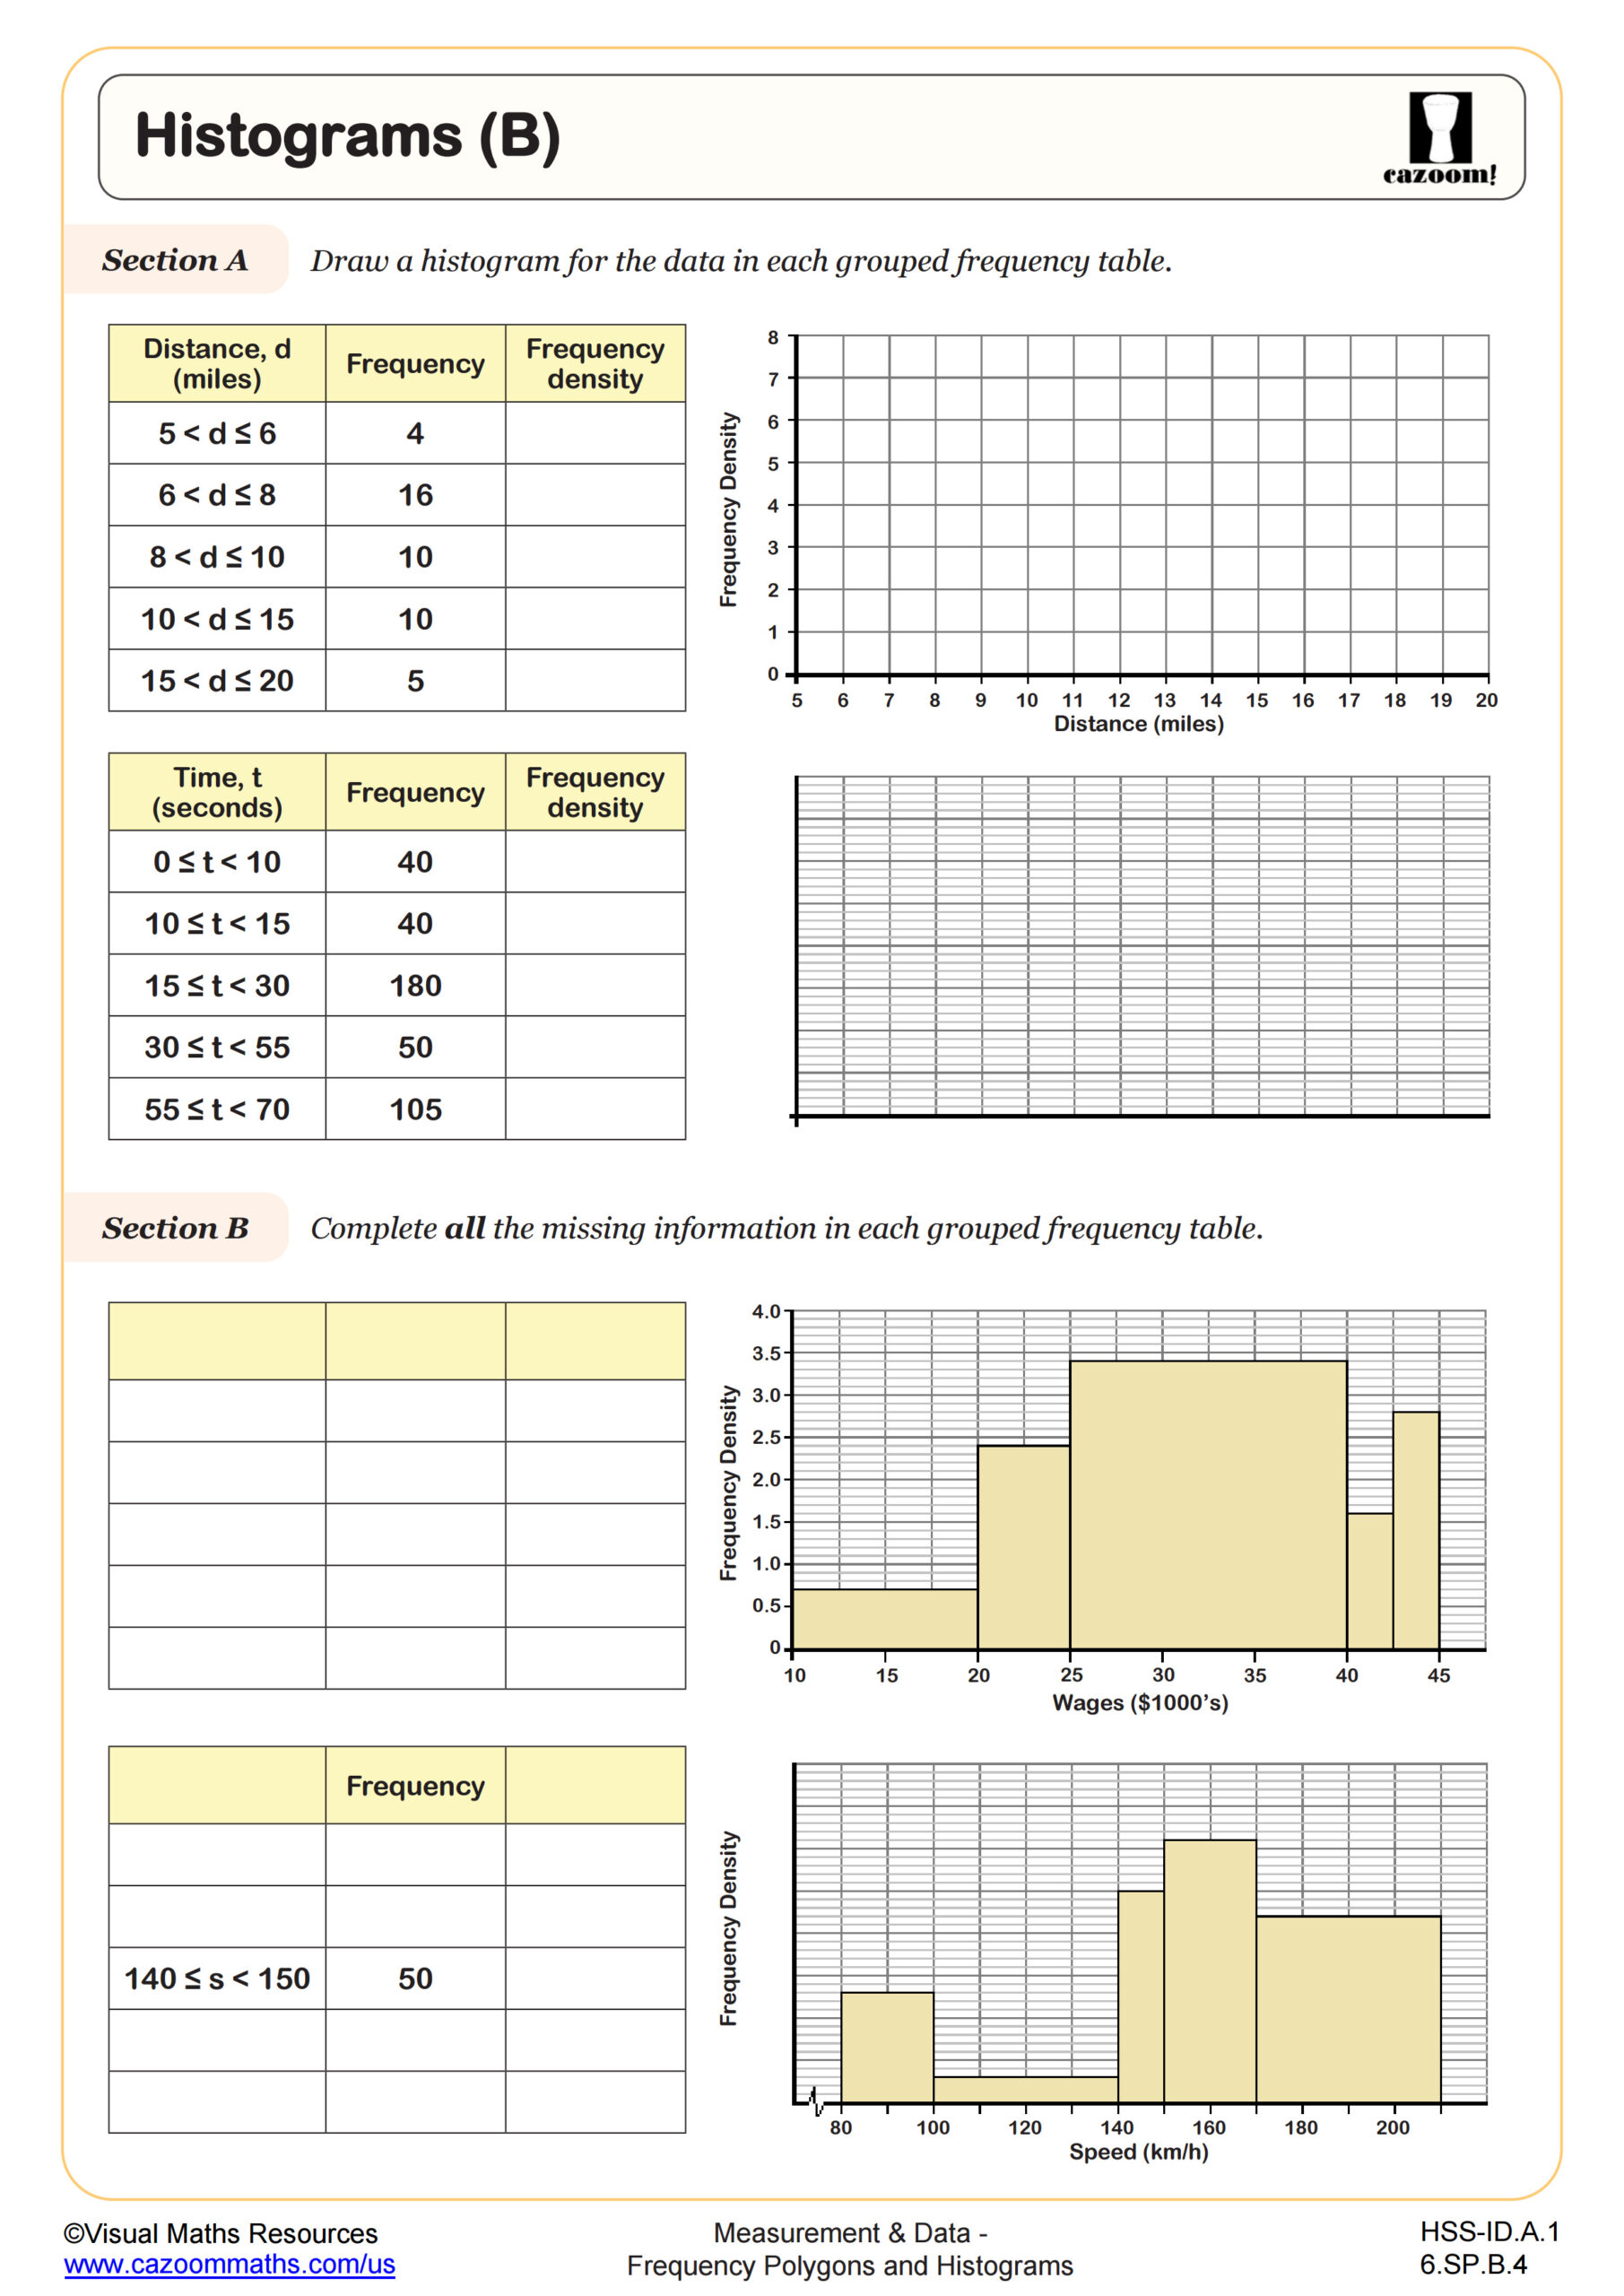
Histograms (B)
Grades: 6th Grade, Algebra I
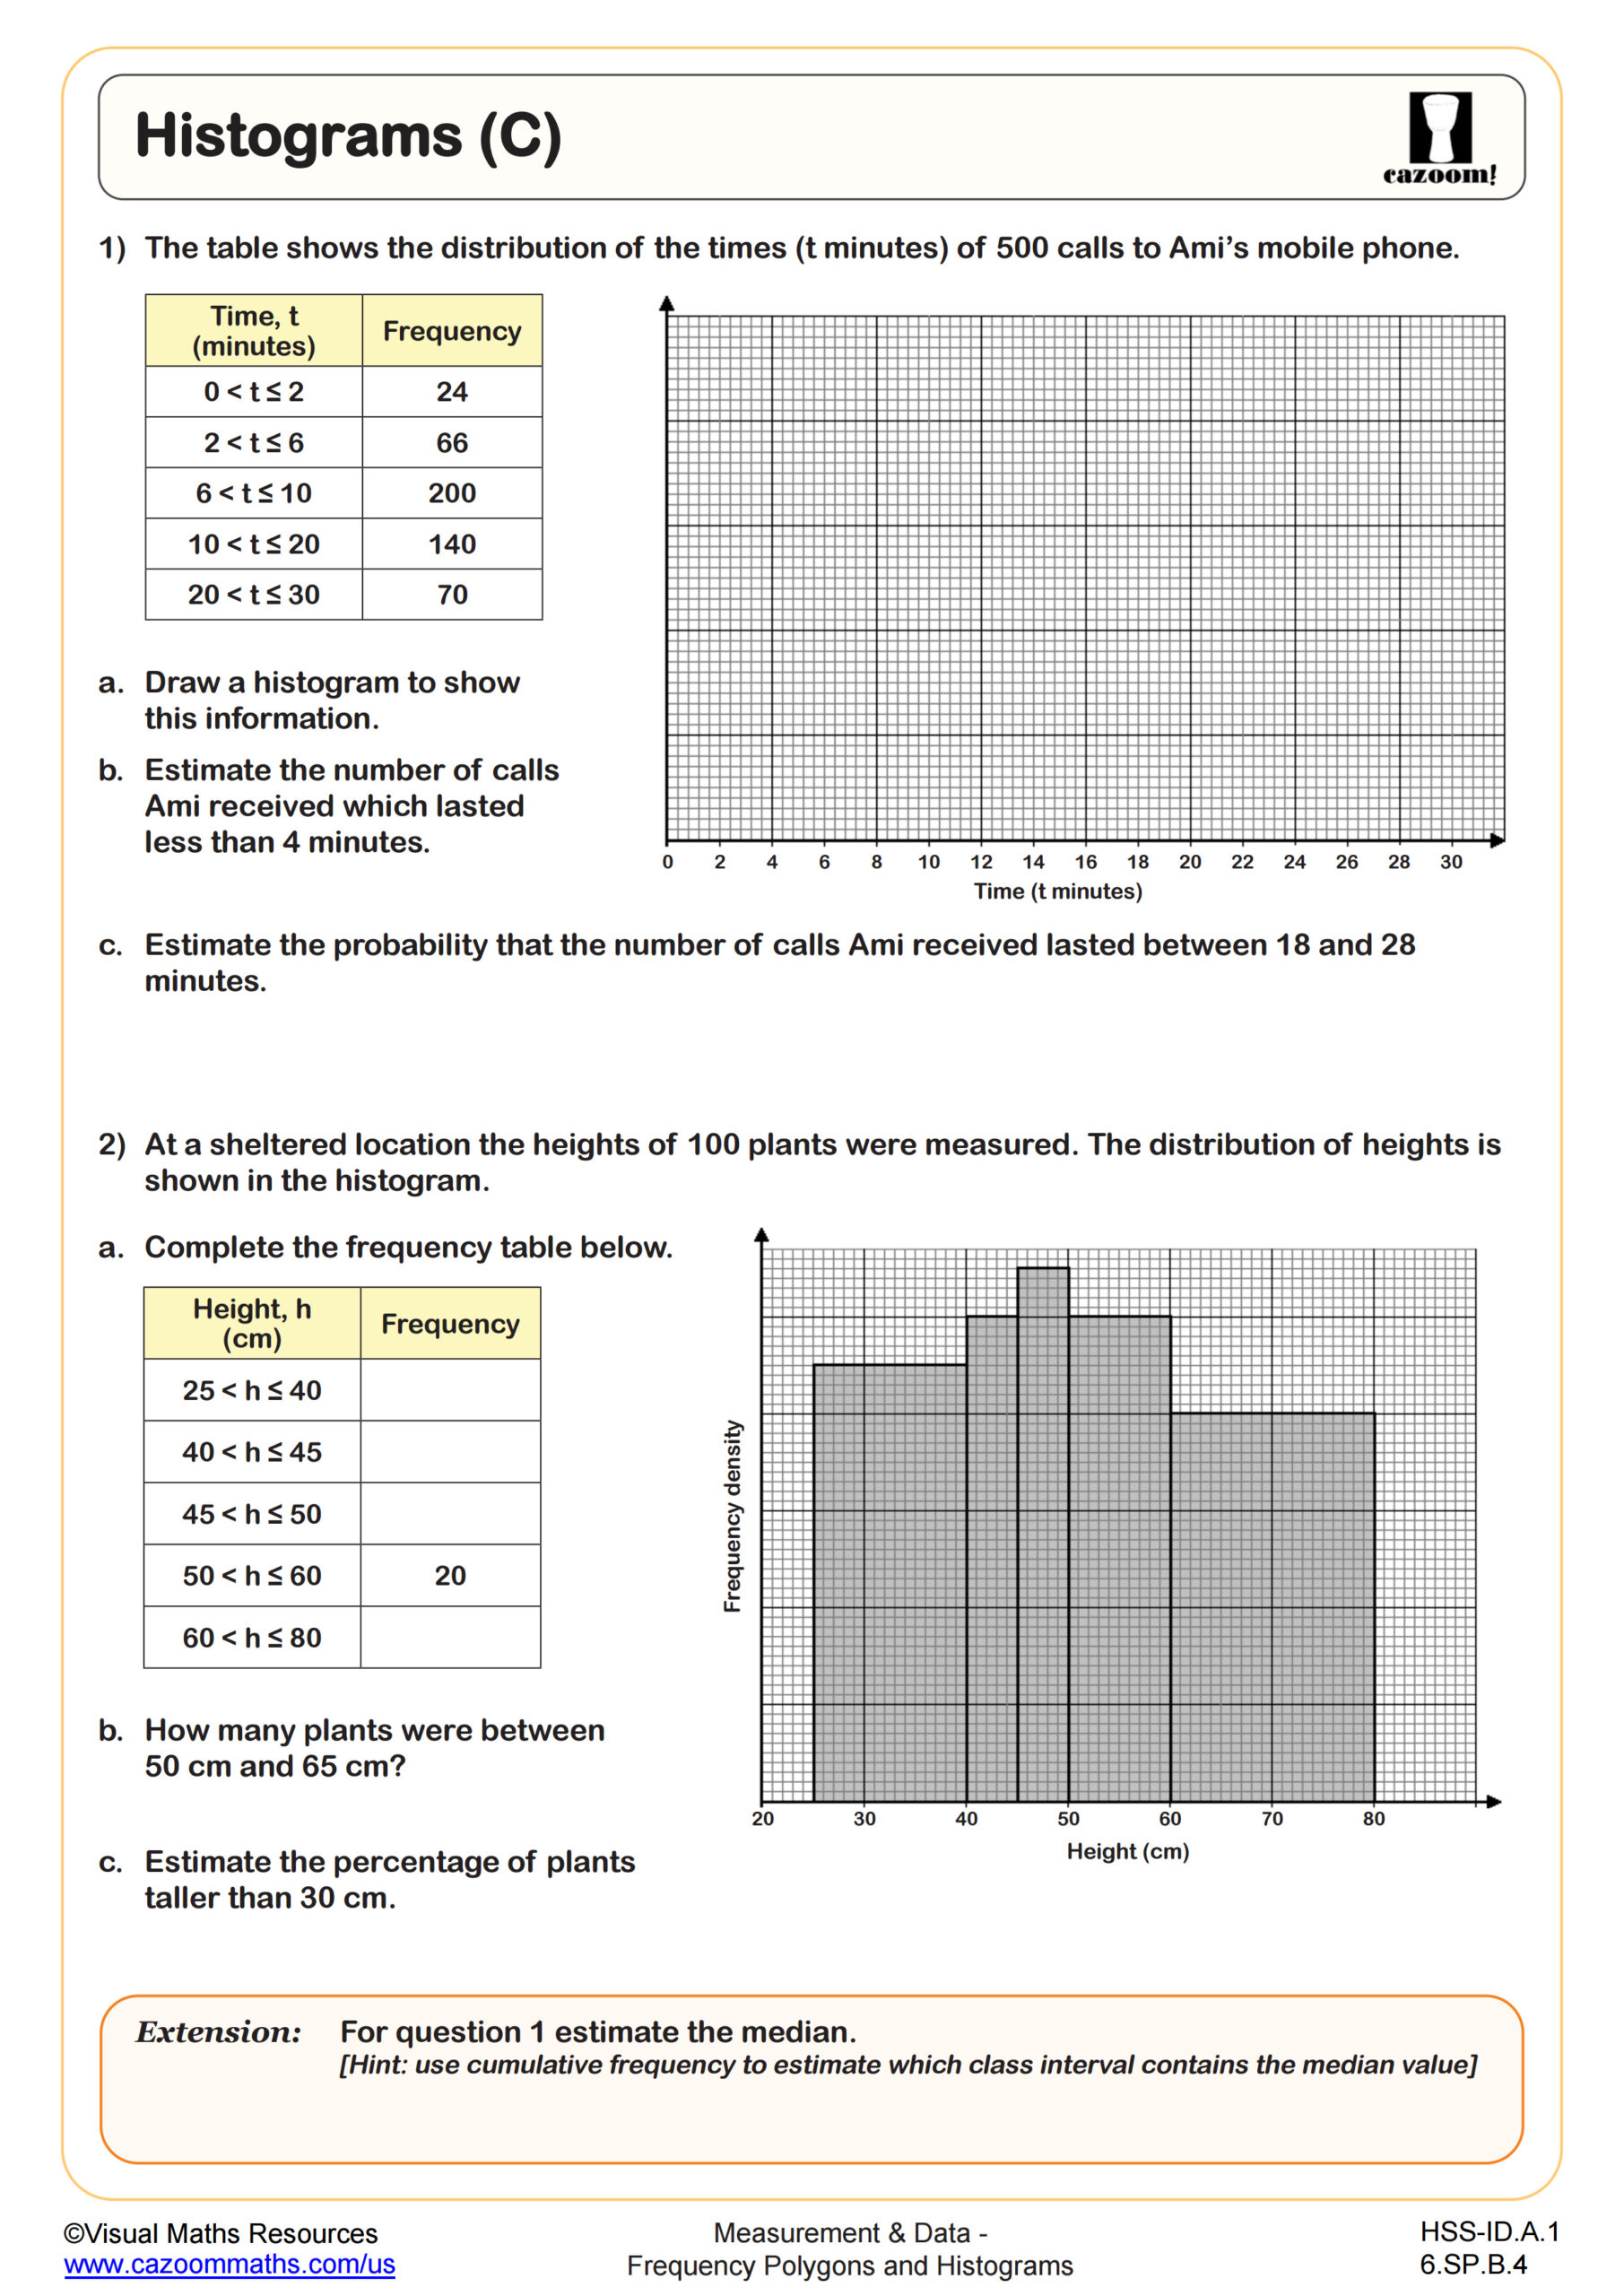
Histograms (C)
Grades: 6th Grade, Algebra I
Cumulative Frequency Diagrams (A)
Grades: Algebra I
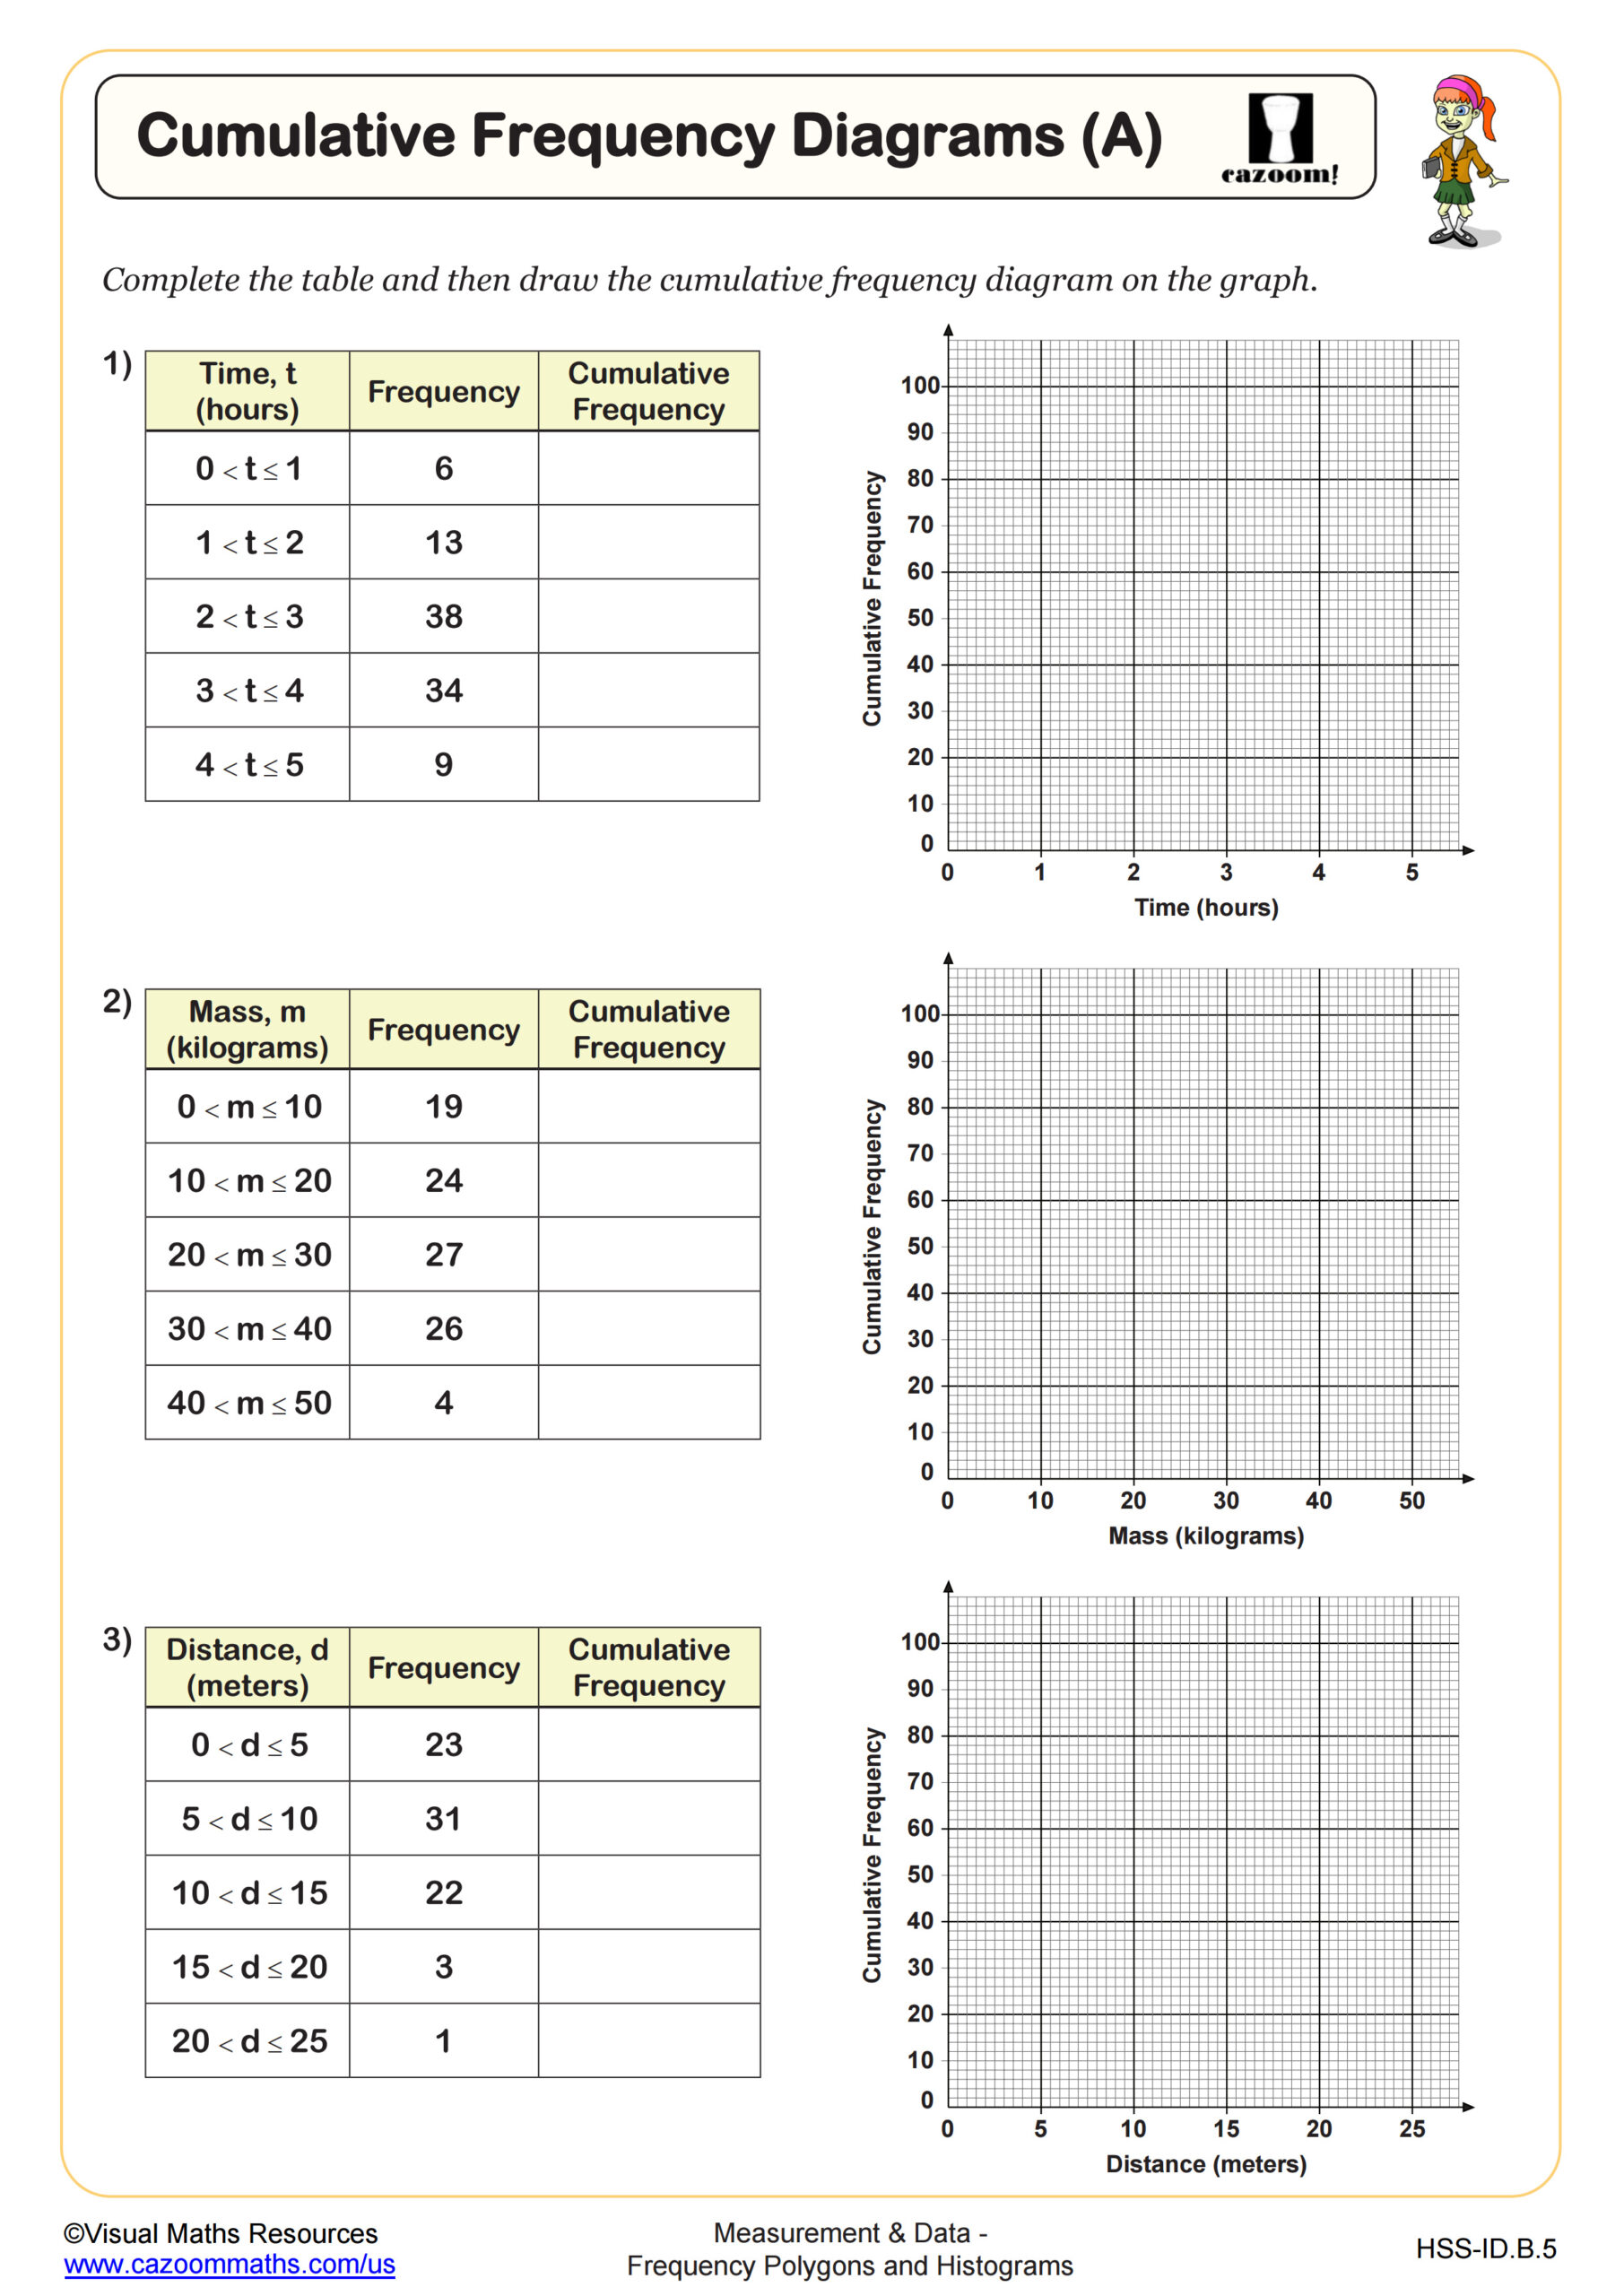
Cumulative Frequency Diagrams (B)
Grades: Algebra I
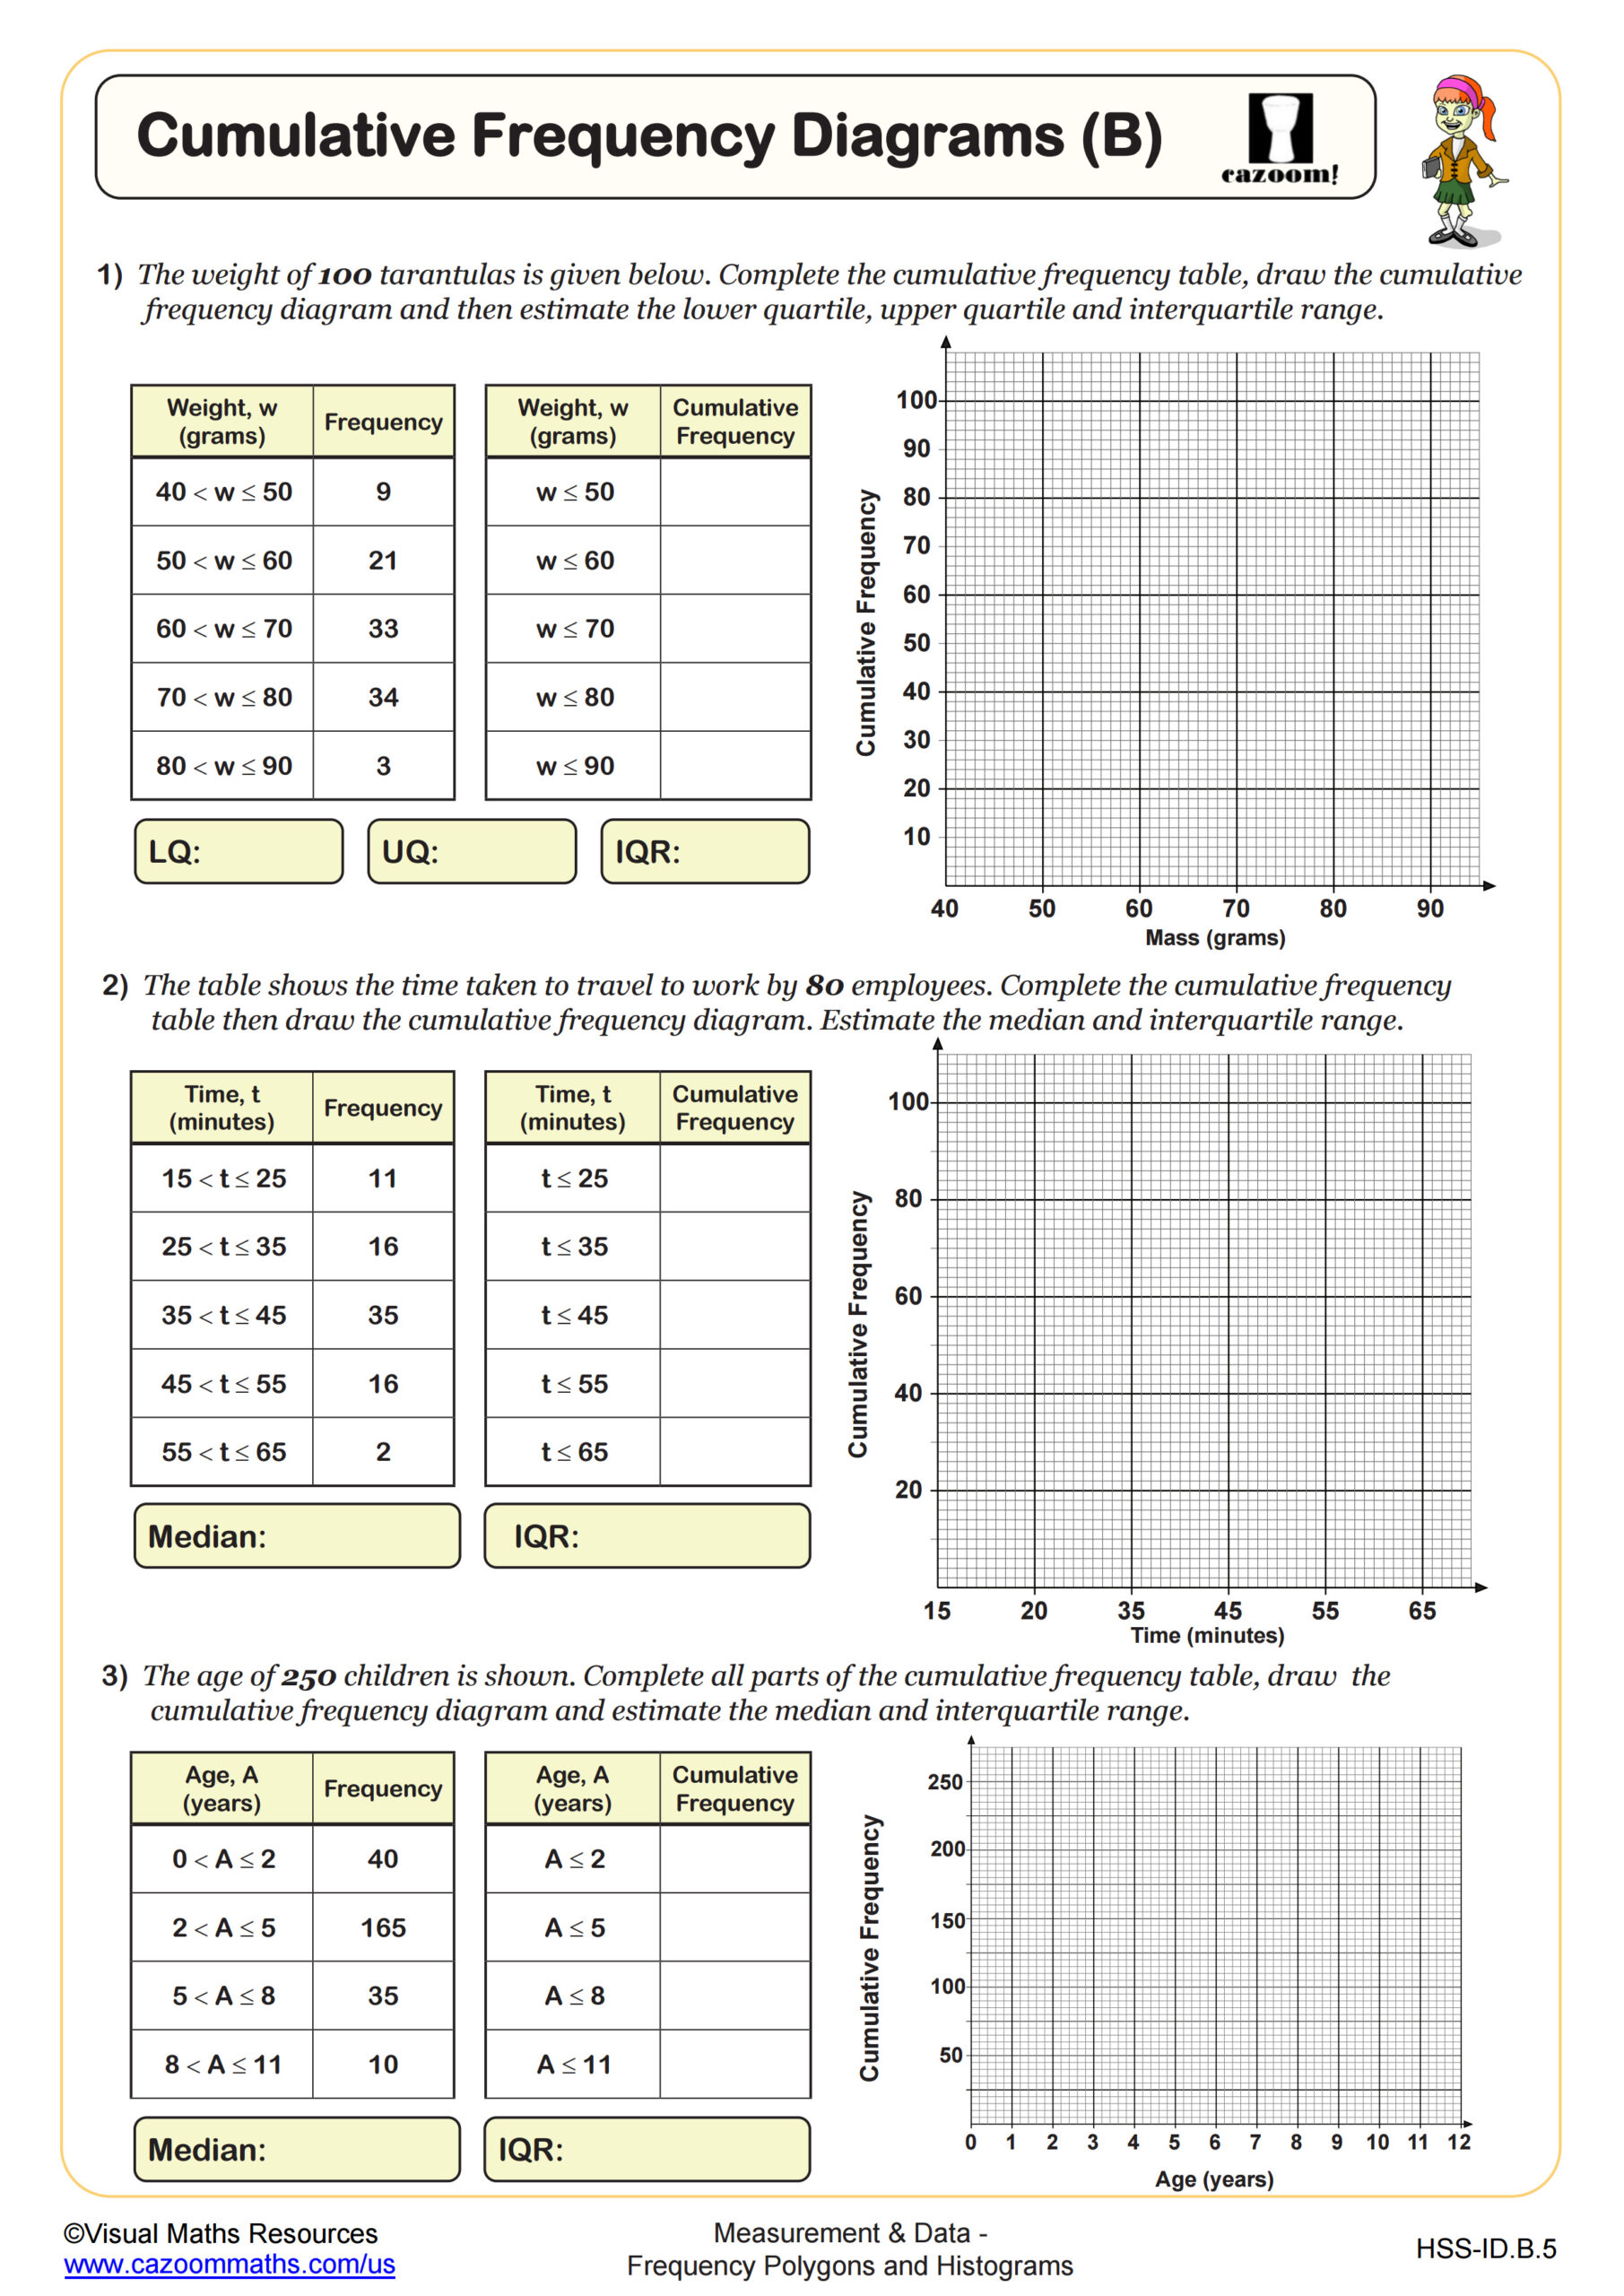
Drawing Box Plots from Cumulative Frequency Diagrams
Grades: Algebra I
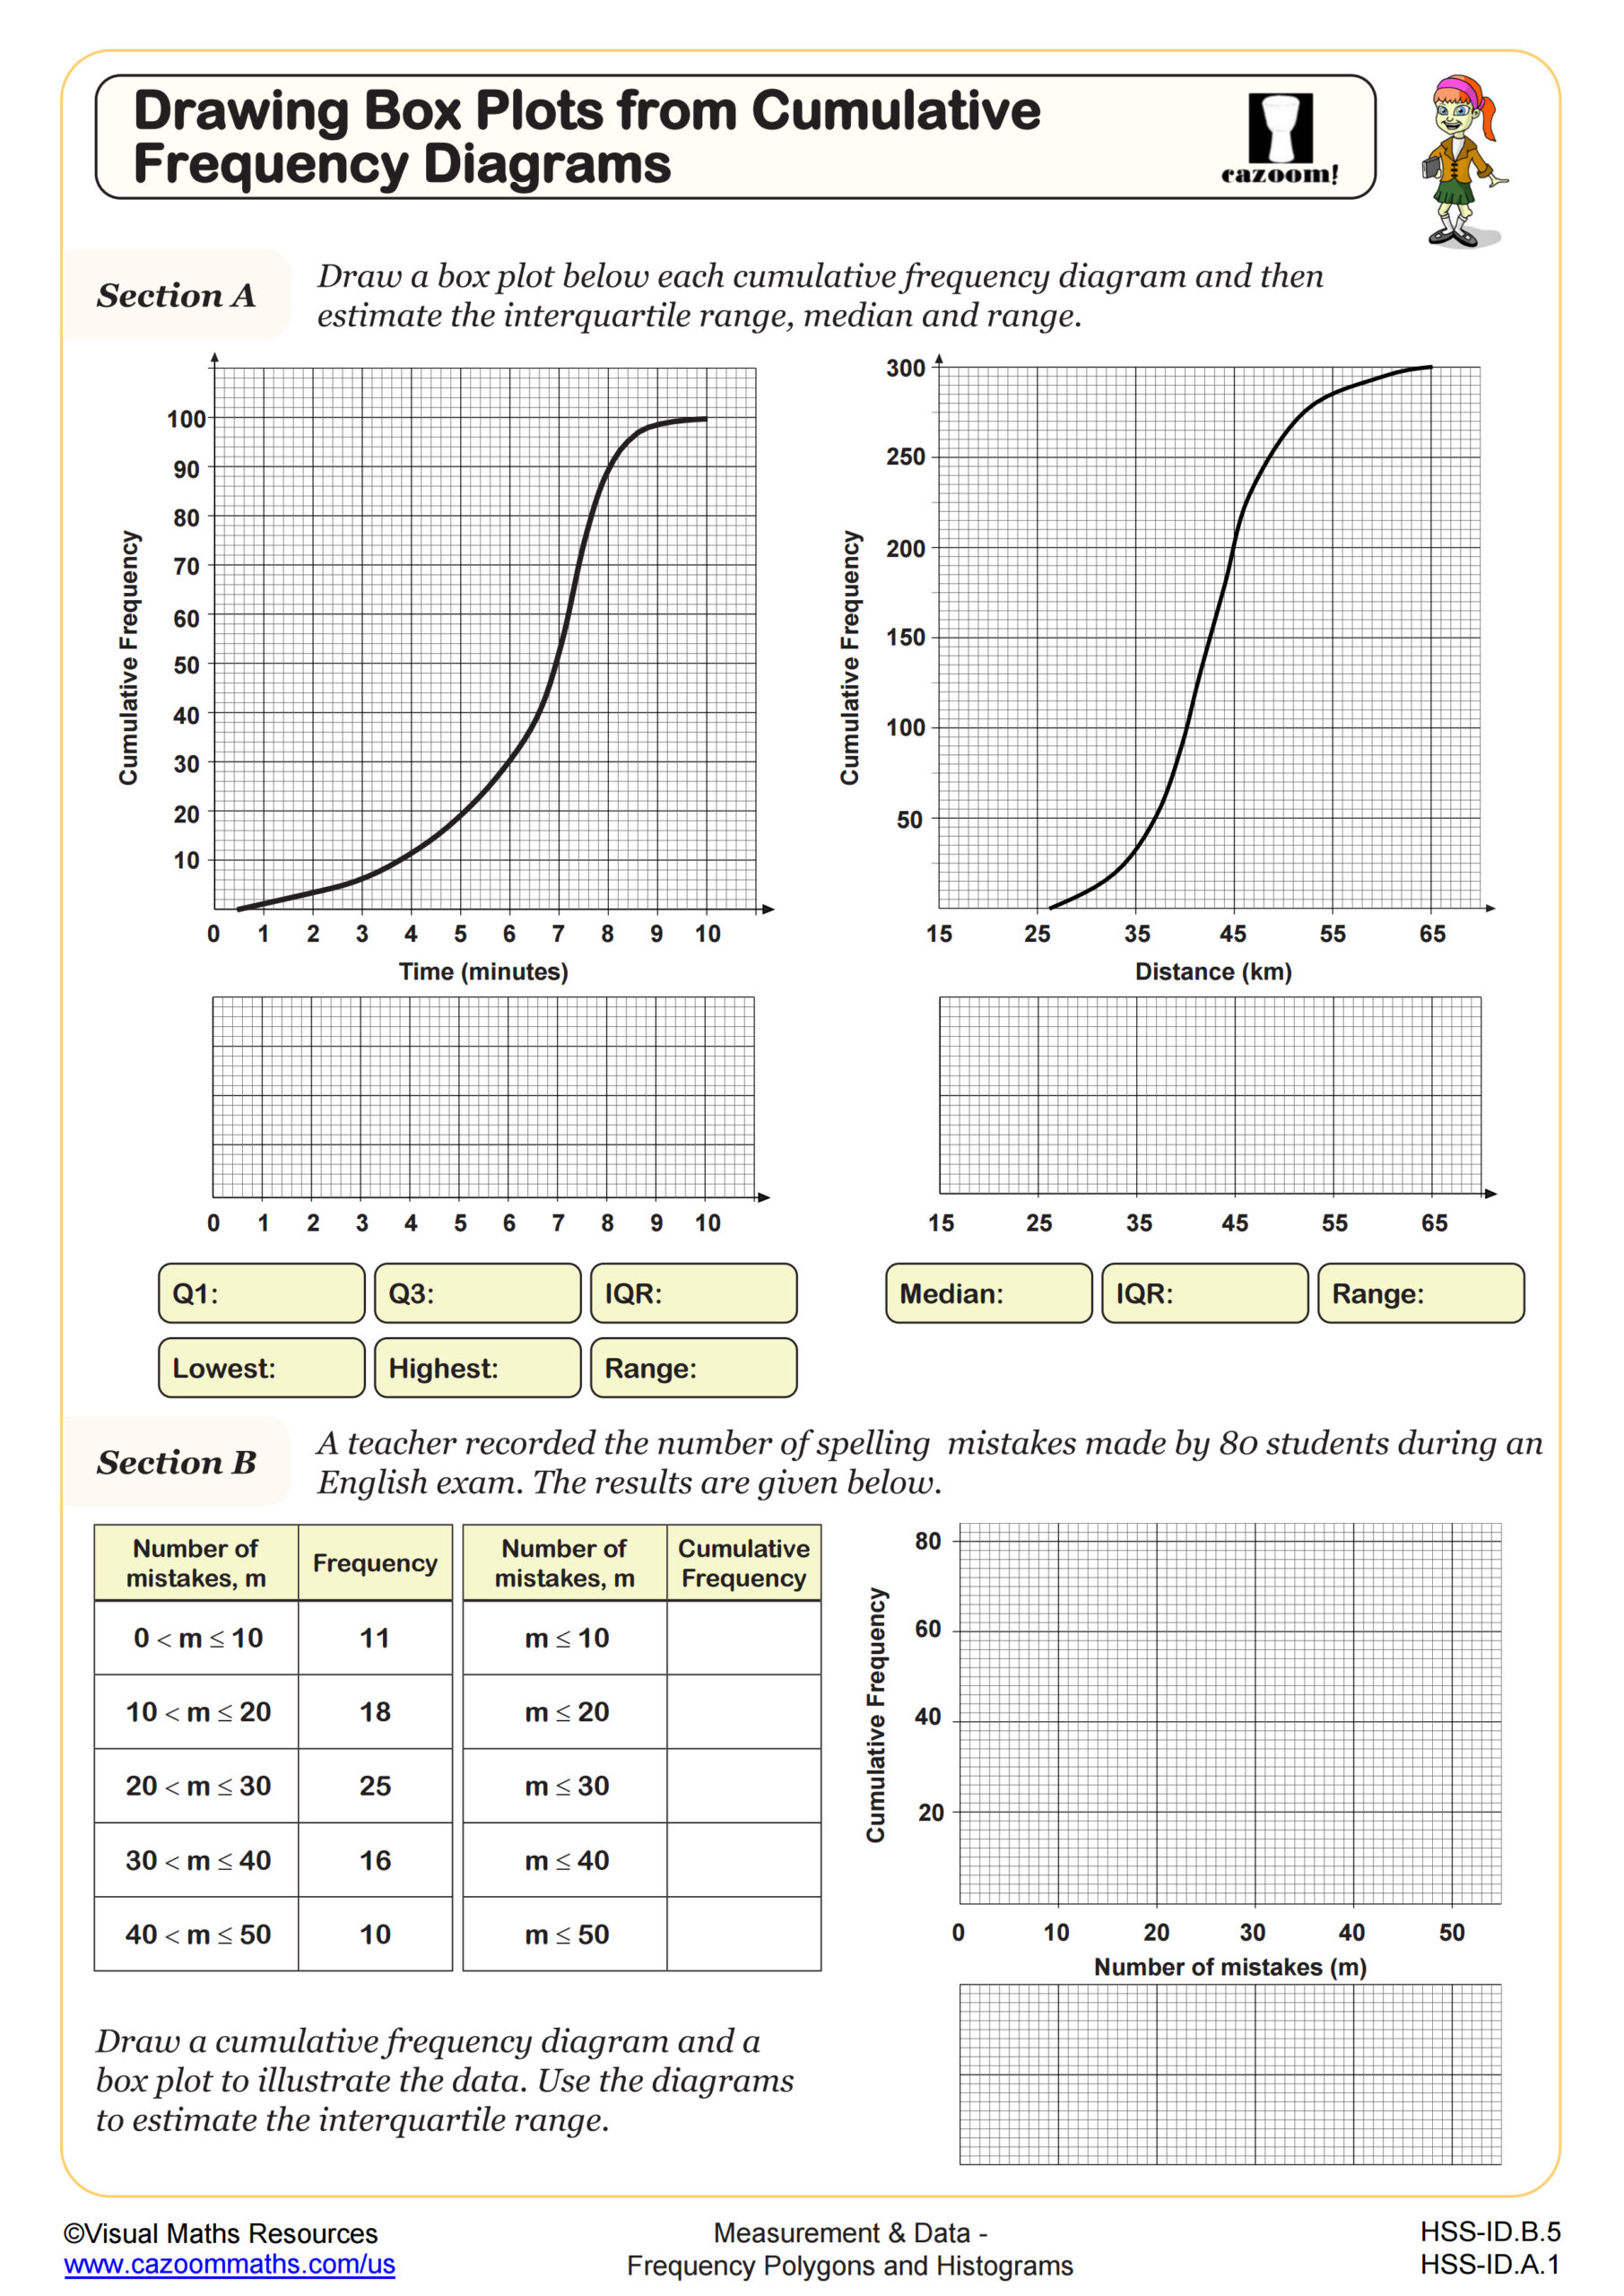
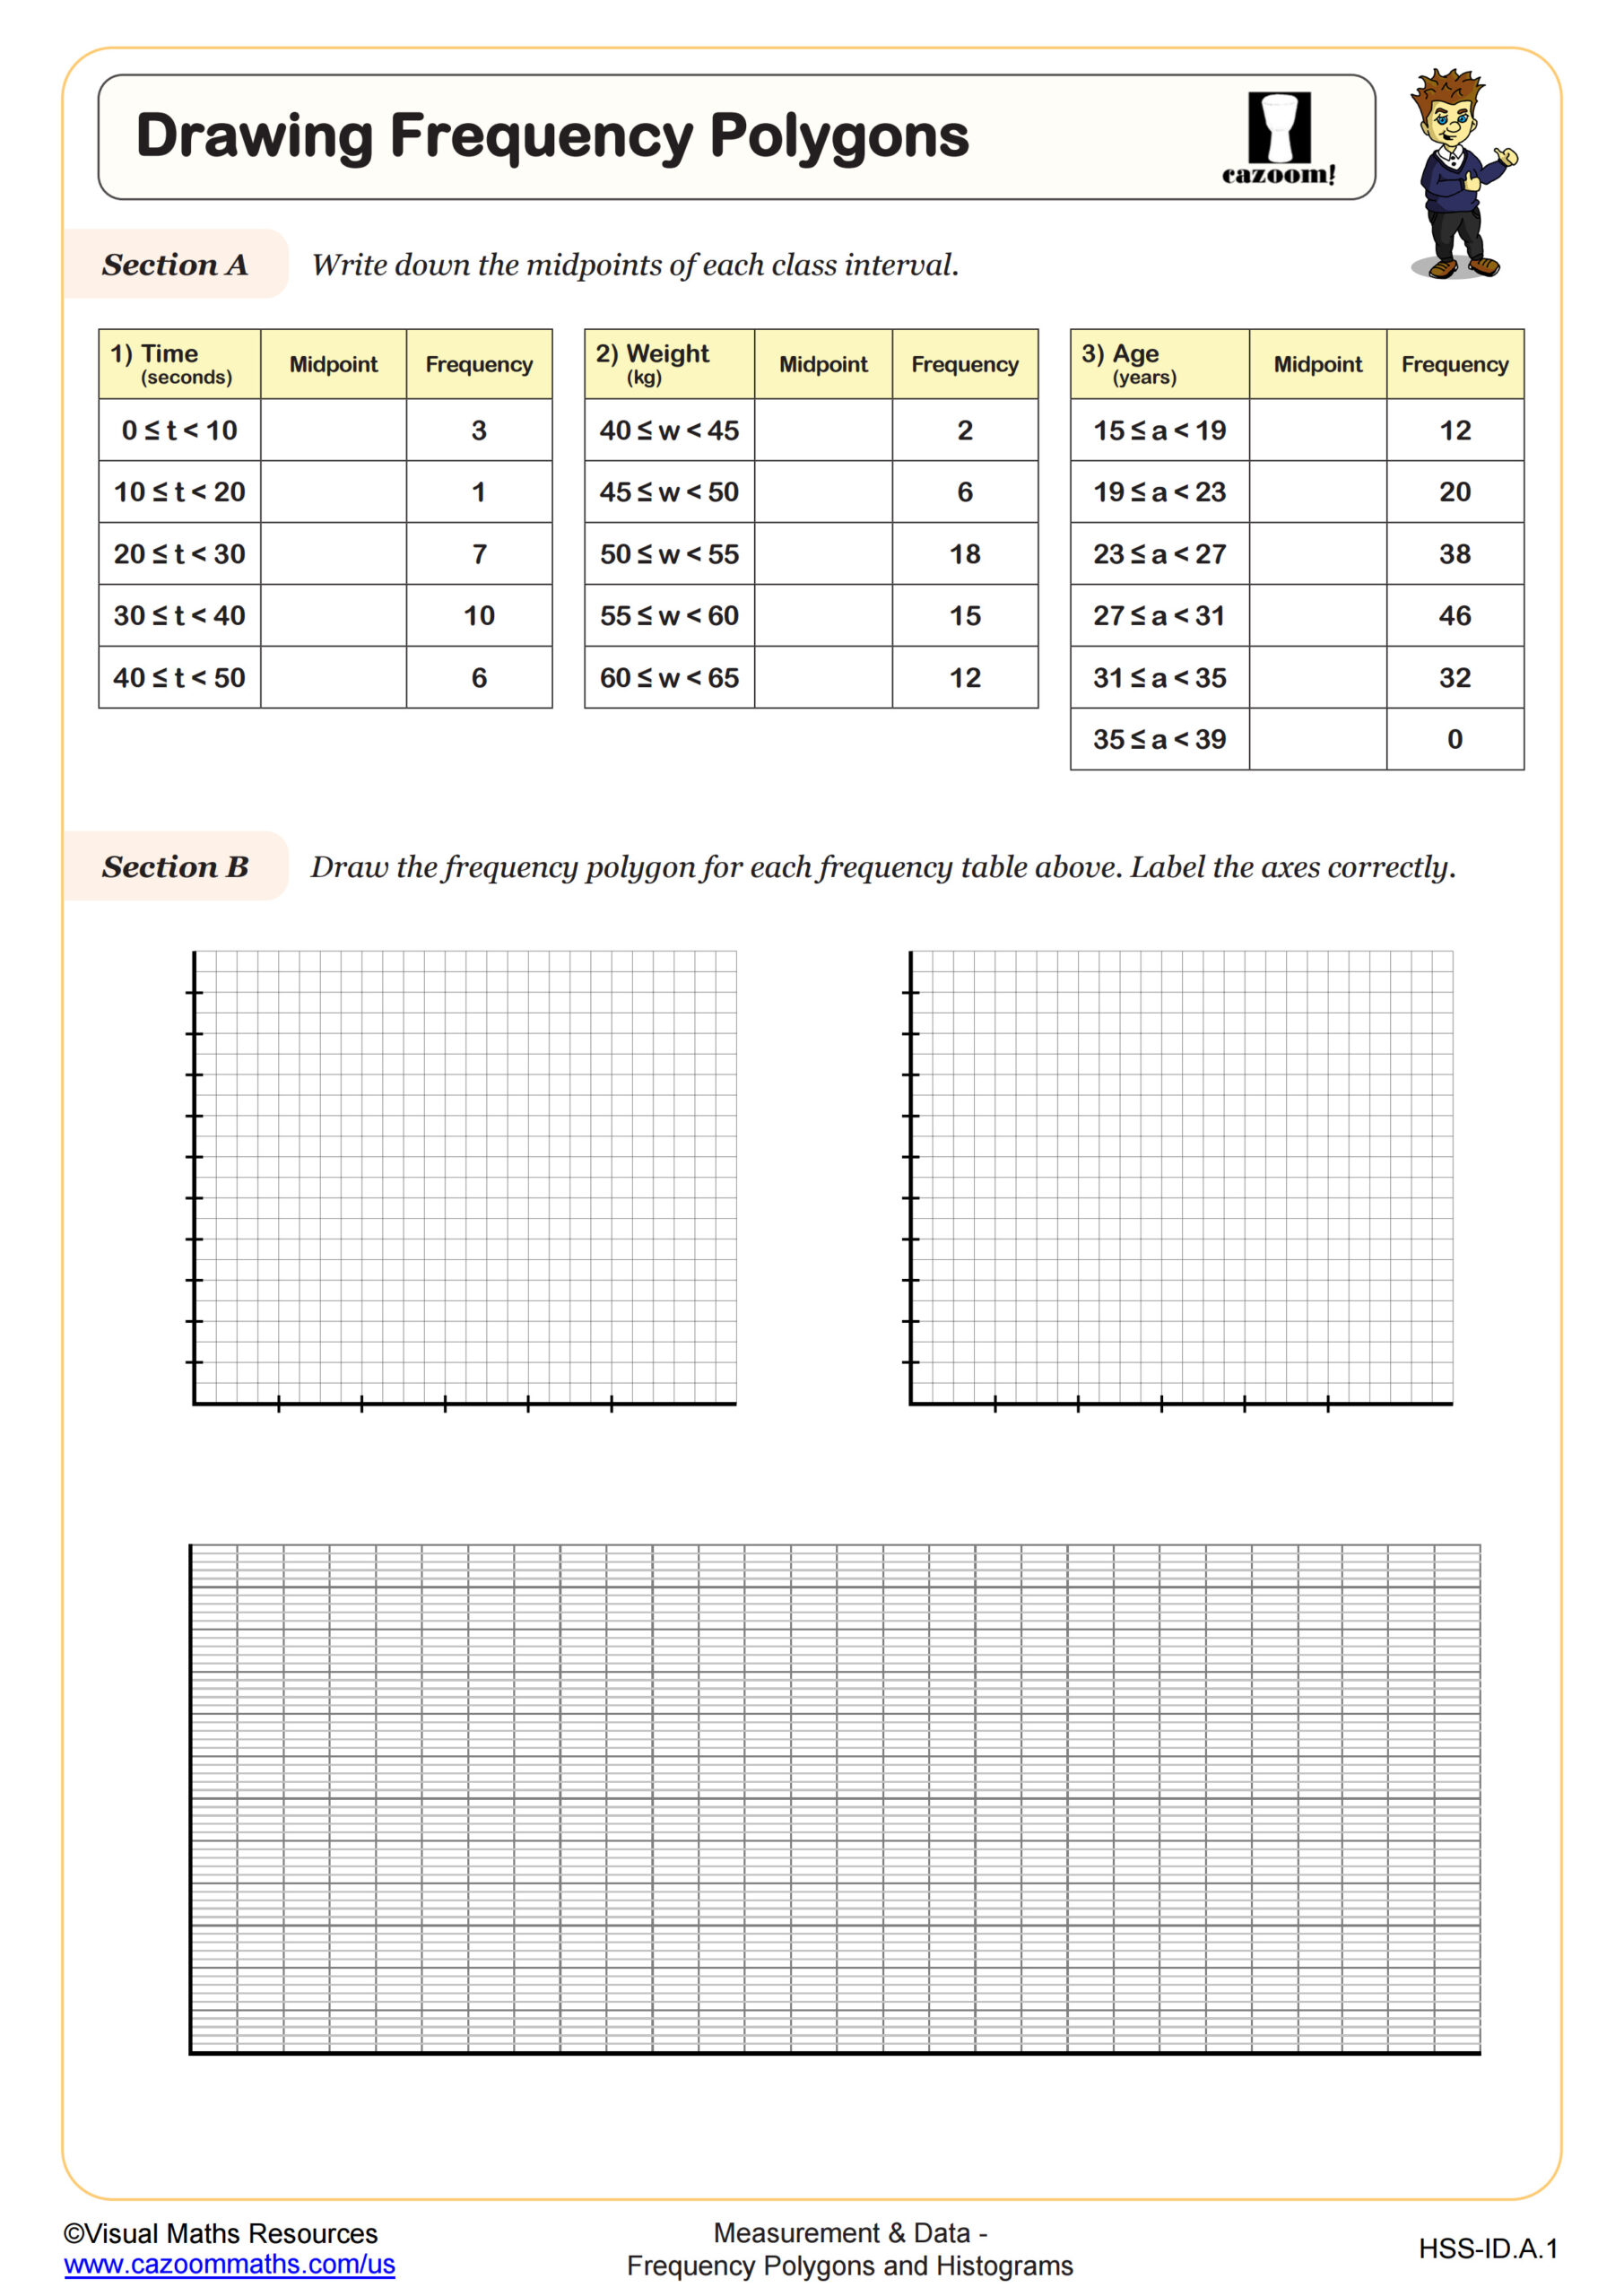
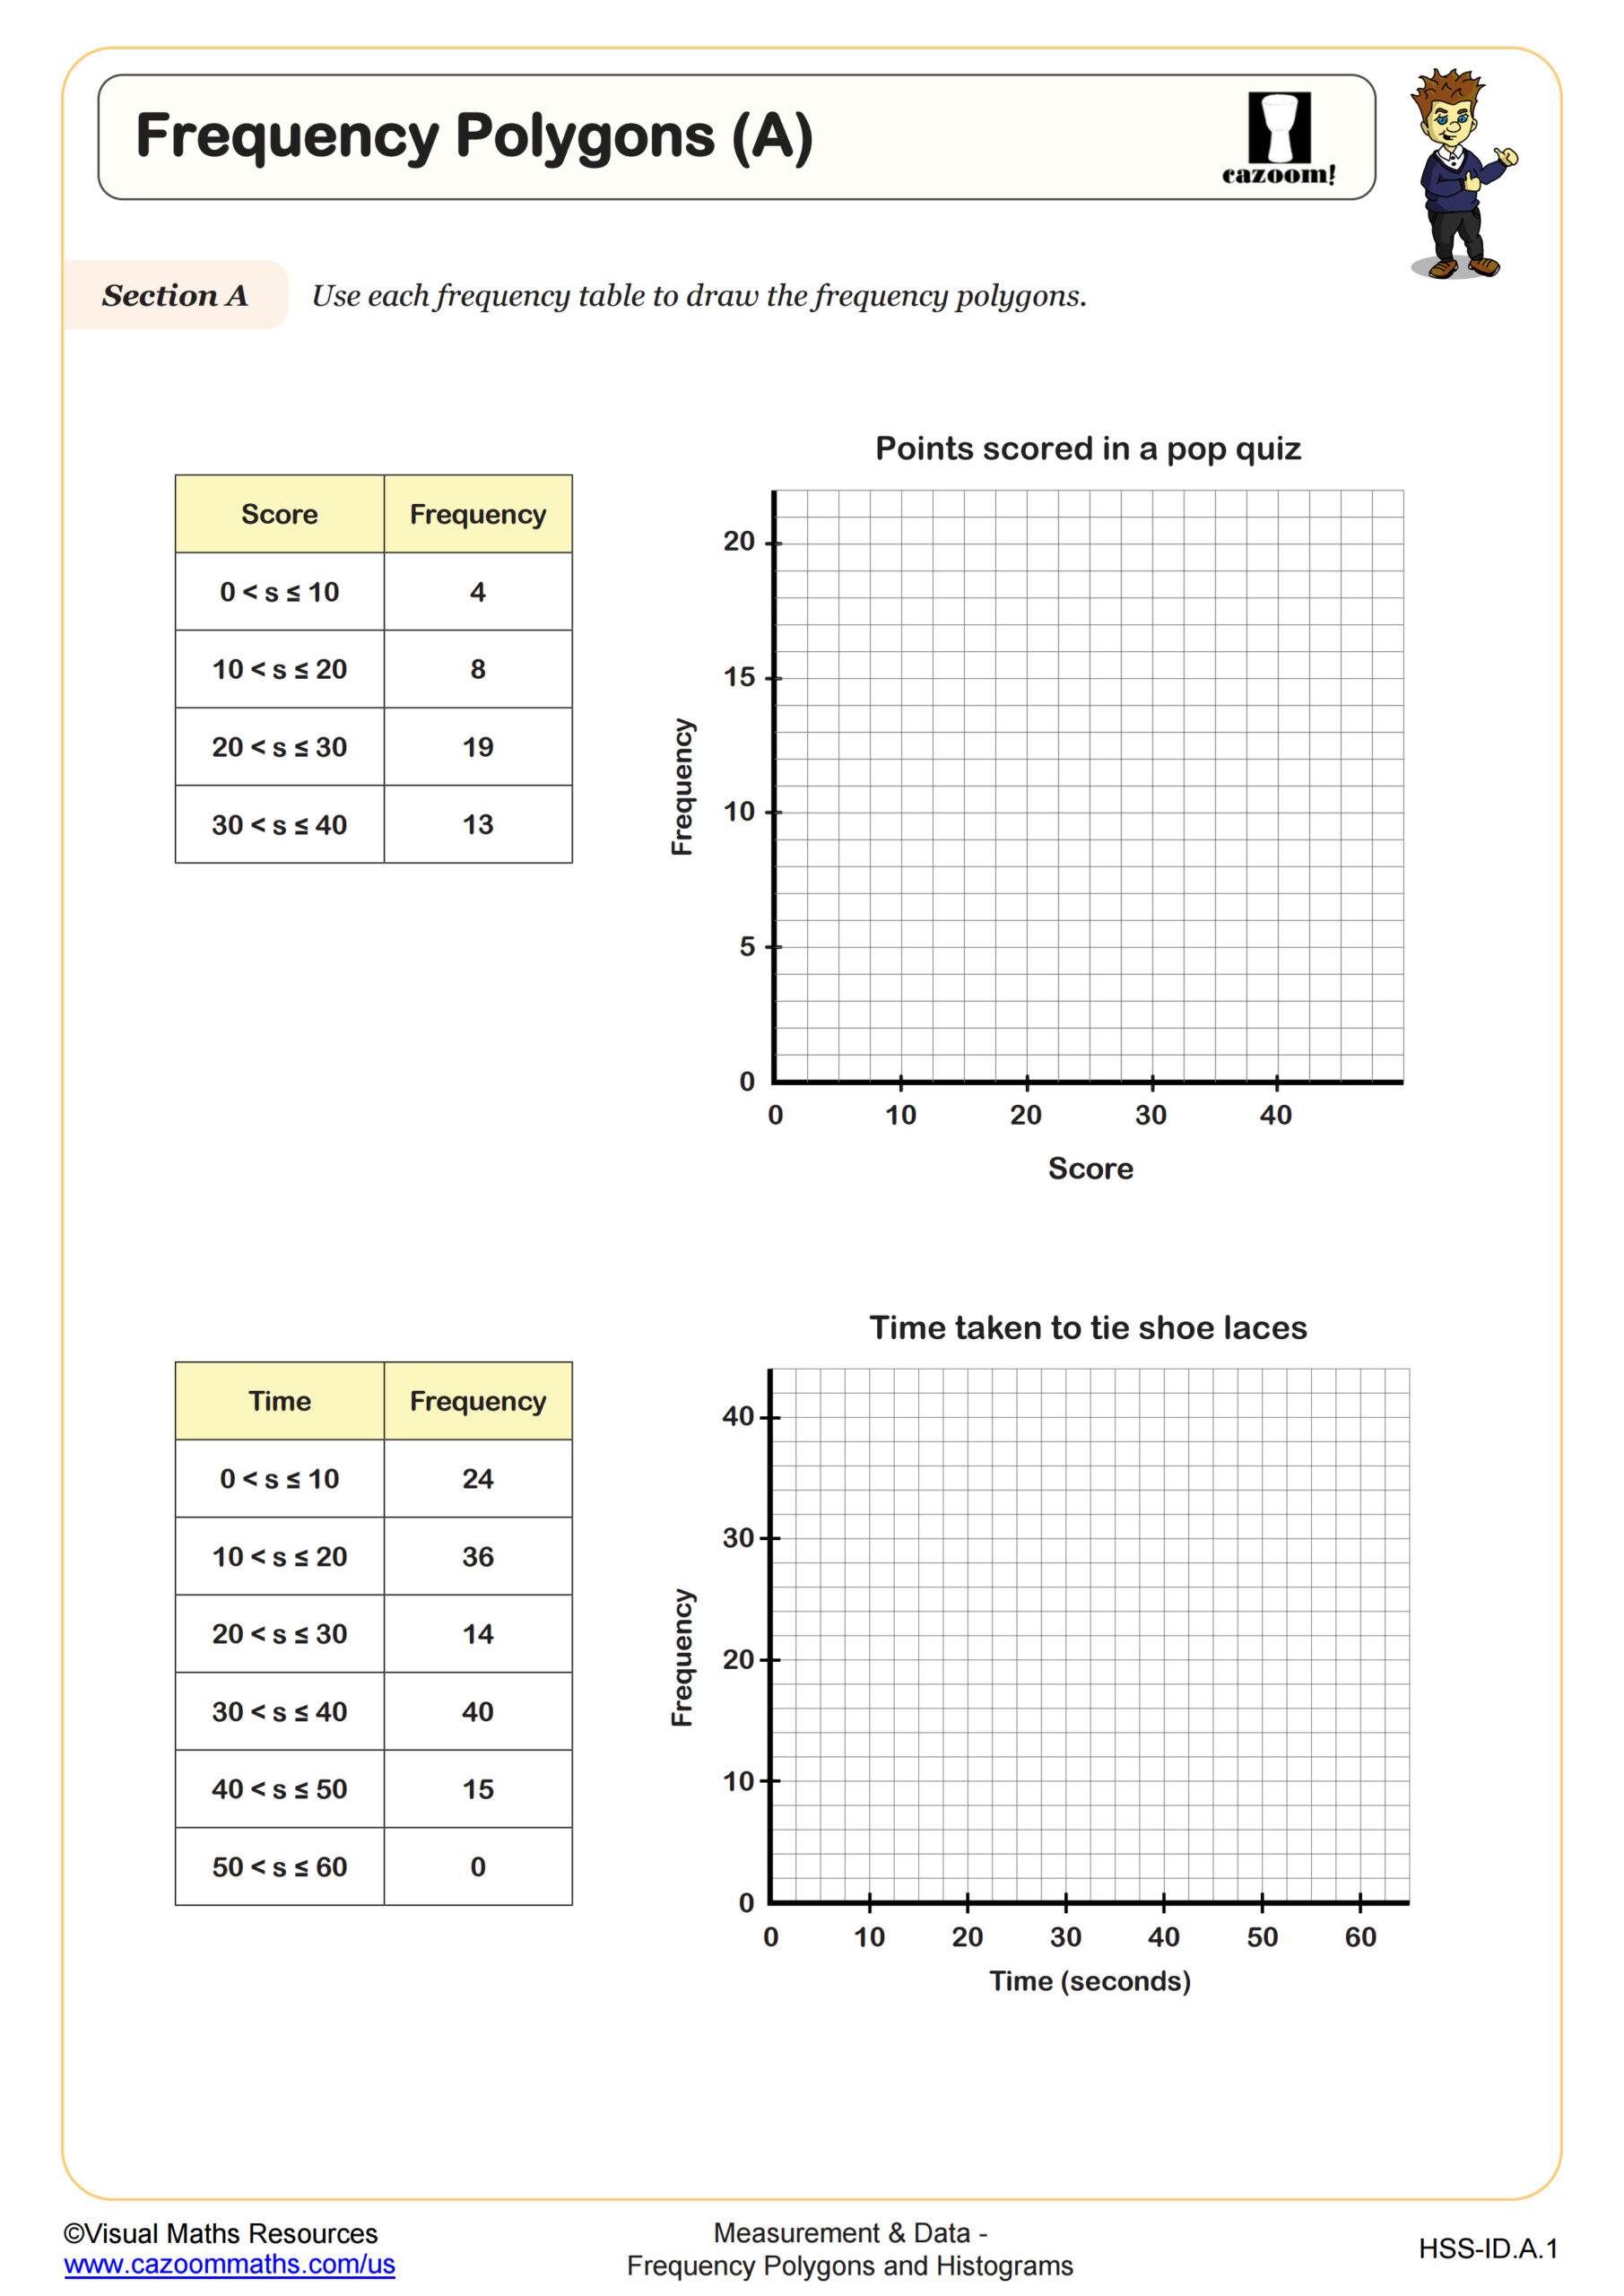
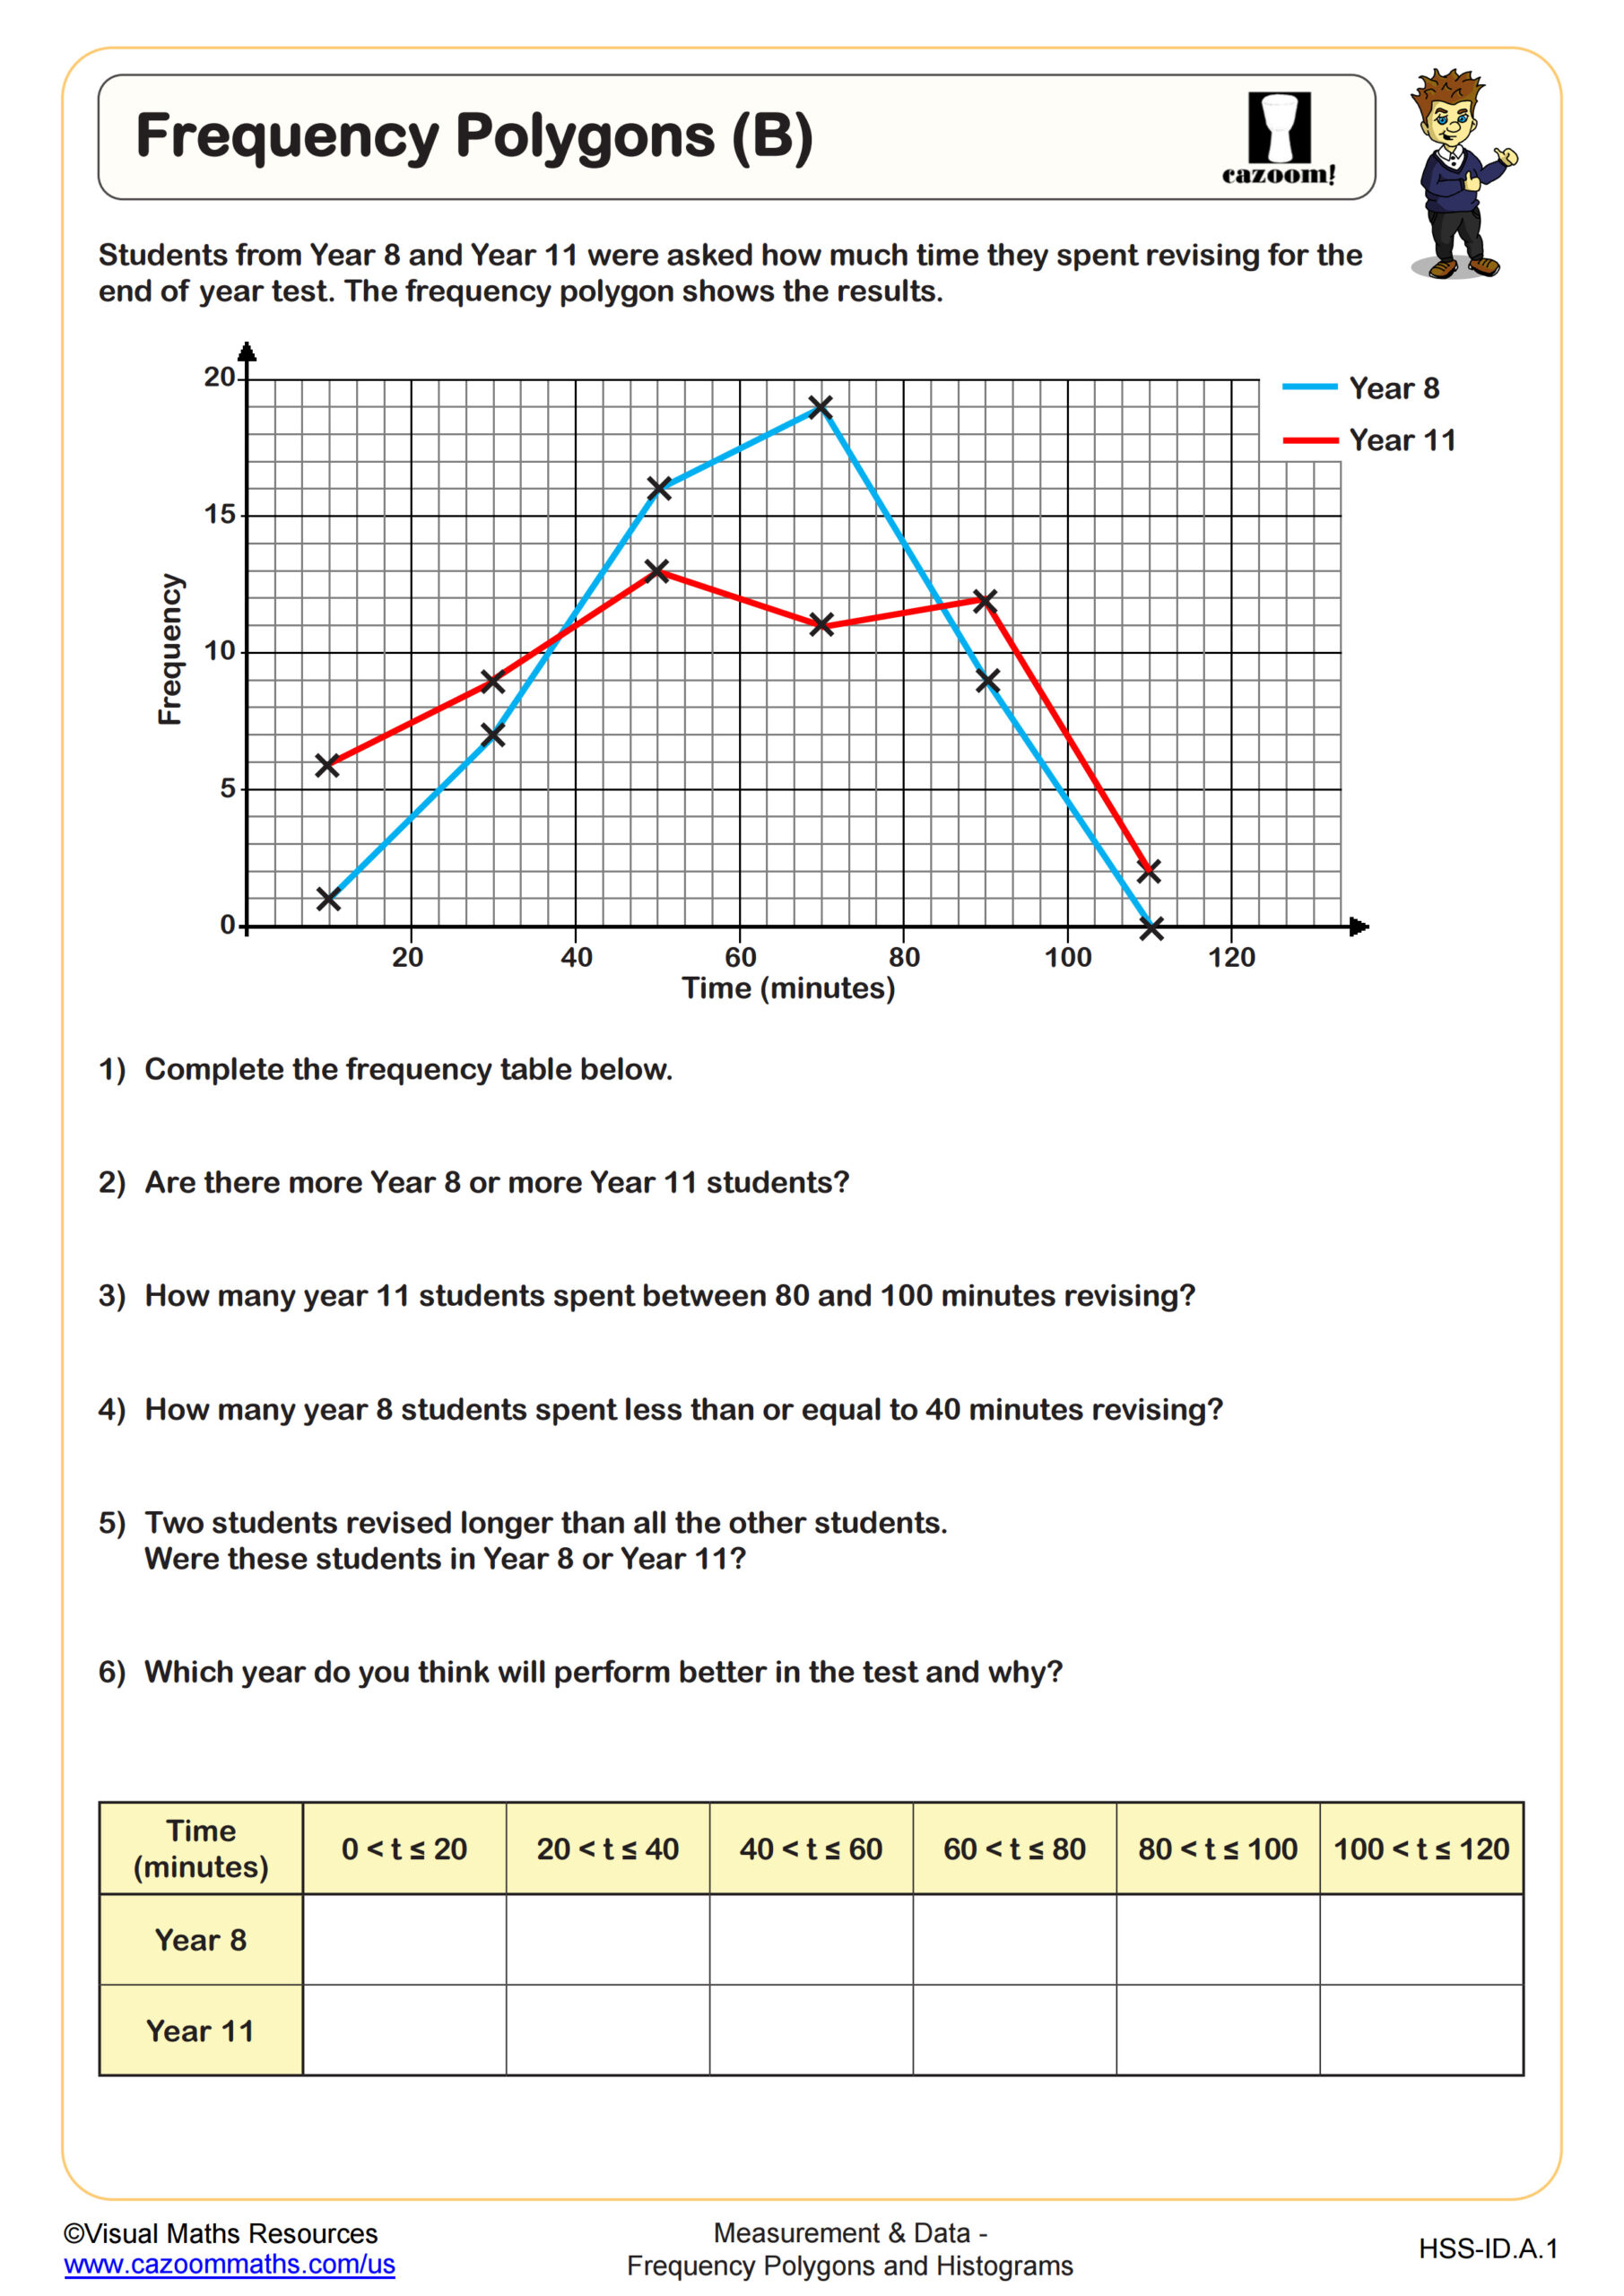
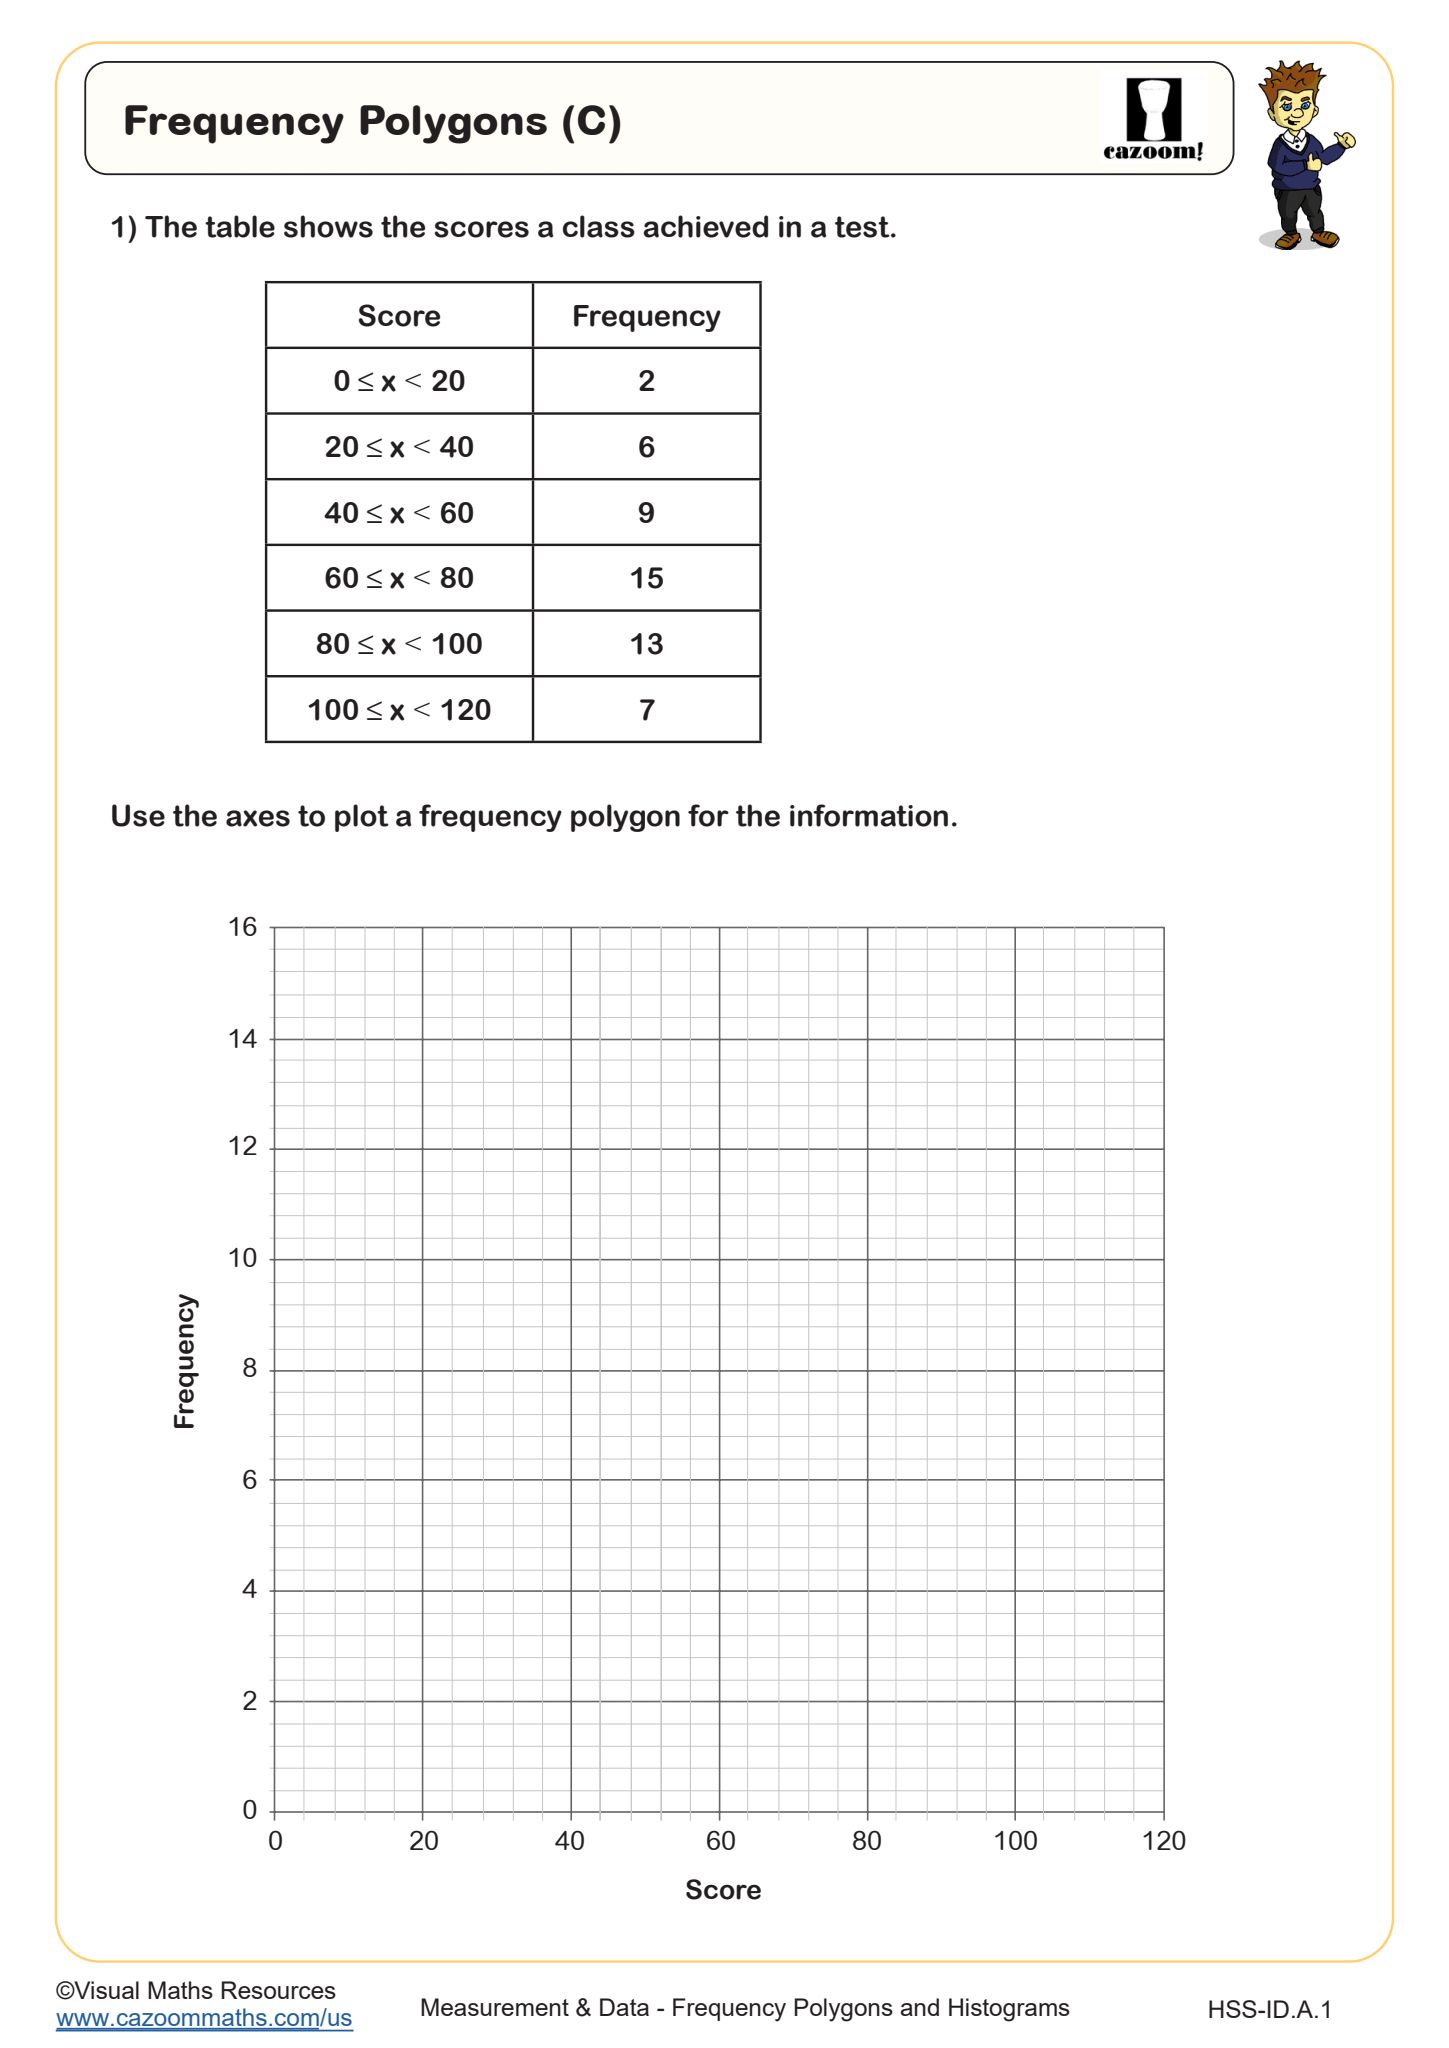
Drawing Frequency Polygons
Grades: Algebra I
Frequency Polygons (A)
Grades: Algebra I
Frequency Polygons (B)
Grades: Algebra I
Frequency Polygons (C)
Grades: Algebra I, IM 1
All worksheets are created by the team of experienced teachers at Cazoom Math.
Printable PDF Histograms and Frequency Polygon Worksheet with Answers.
We have created Math worksheets to help your child understand histograms and frequency polygons. When working with data, these can be 2 of the more difficult graphical representations to understand. At Cazoom, we recognize this and that is why we created Math worksheets that would help support your child in this area, along with answer keys to be able to make sure they are understanding the content.
Histograms and Frequency Polygons in the Real World
Both histograms and frequency polygons are data representations dealing with ranges of values.
Although they represent these ranges in different forms, they can help us be able to get a picture of what is happening over a range of data. Many companies can use these graphs to be able to have a visual representation of their company's significant data points. Cazoom is helping to prepare your child to be confident in histograms and frequency polygons through these Math worksheets that when they come across them in the future, they feel prepared.