Pie Charts and Bar Charts Worksheets
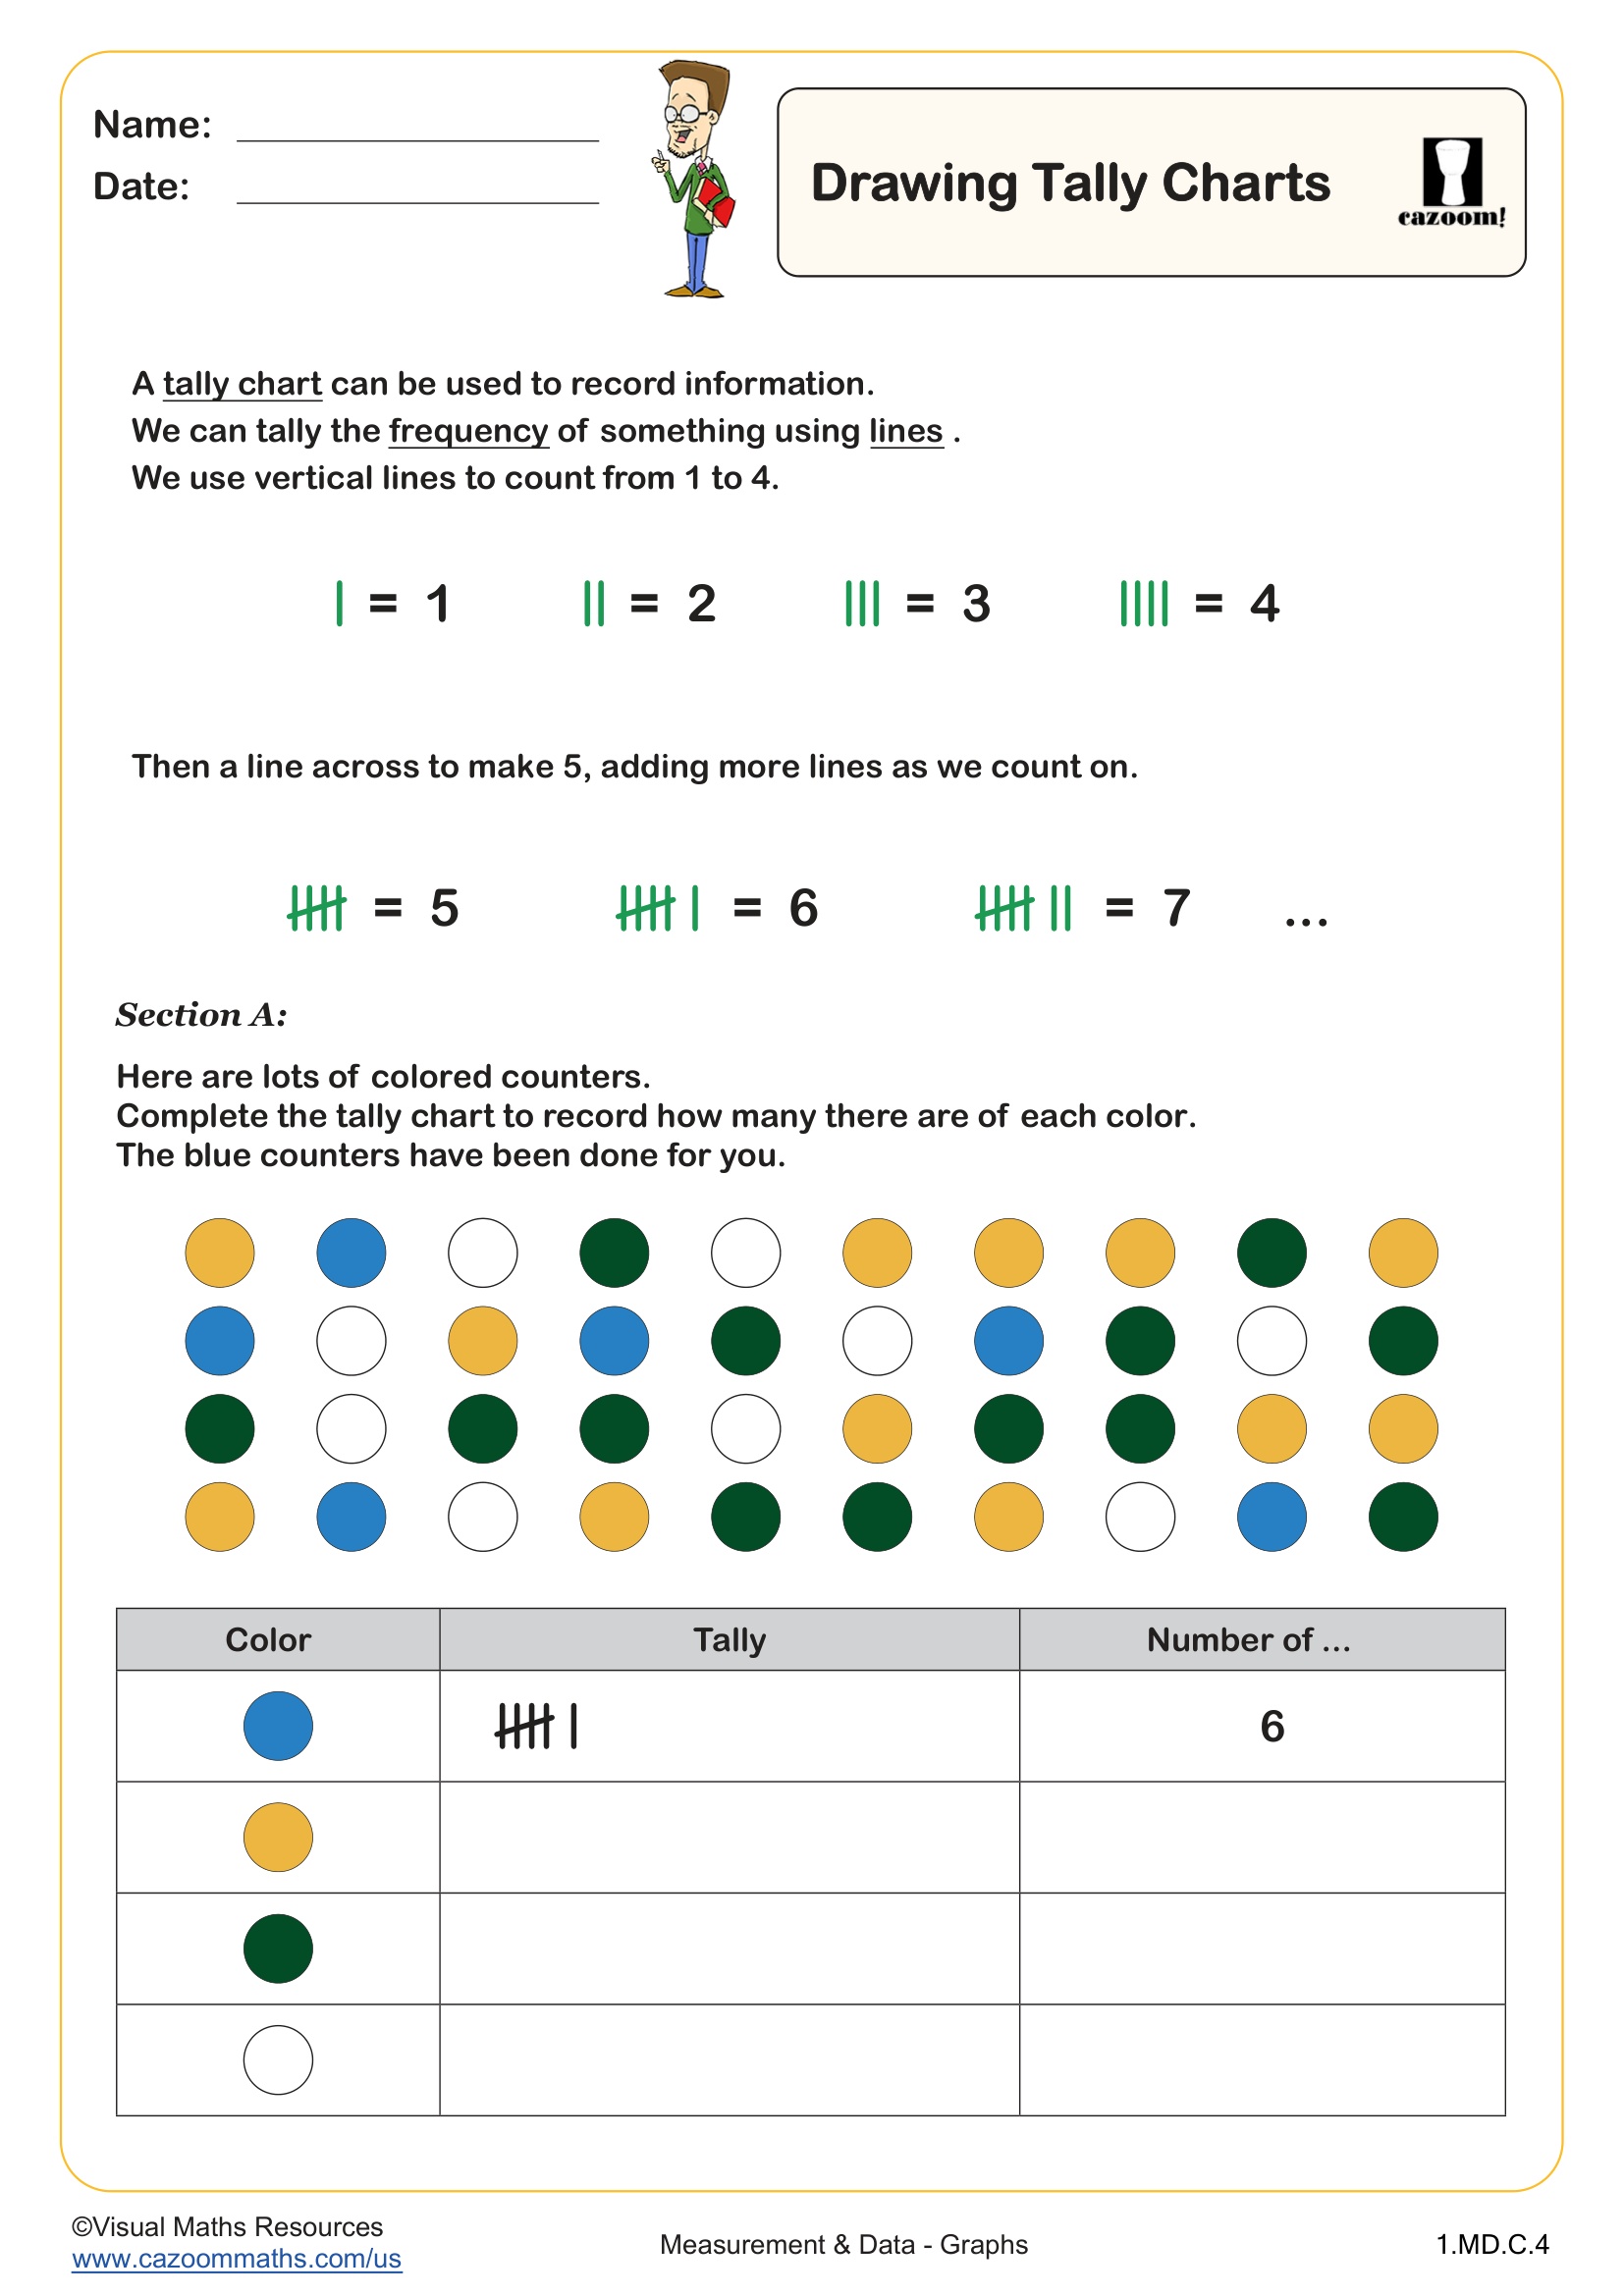
Drawing Tally Charts
Grades: 1st Grade
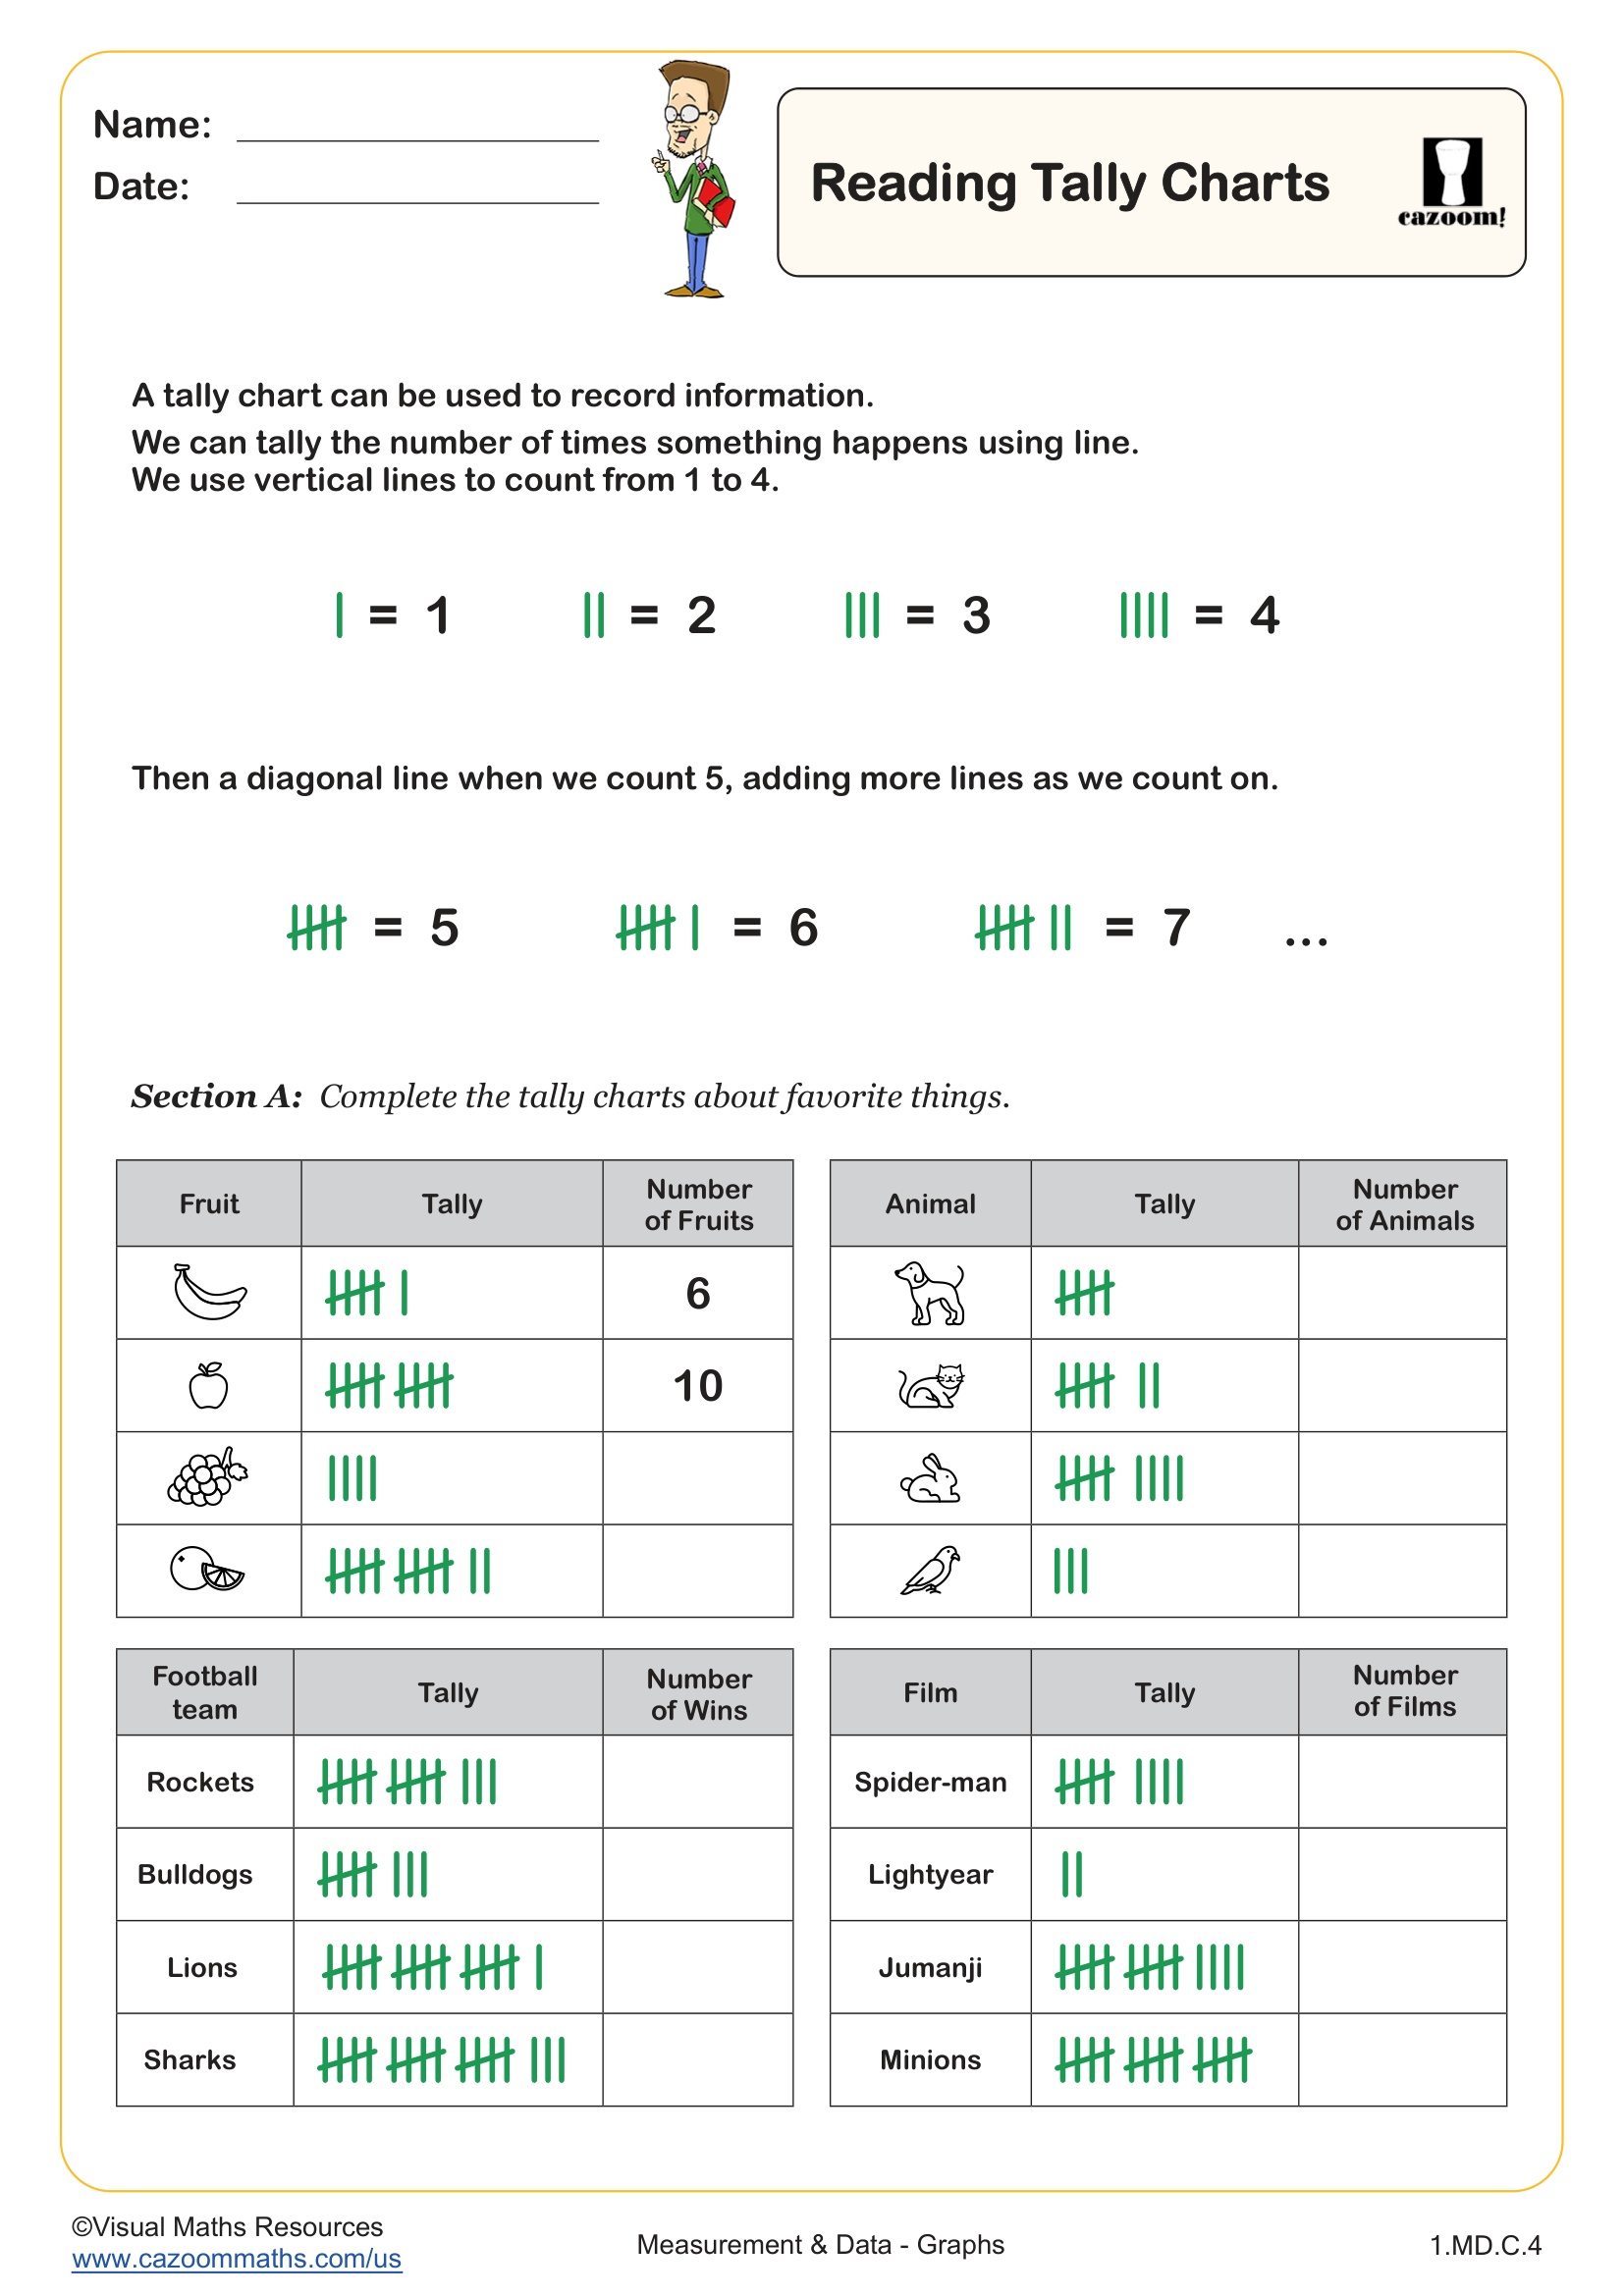
Reading Tally Charts
Grades: 1st Grade
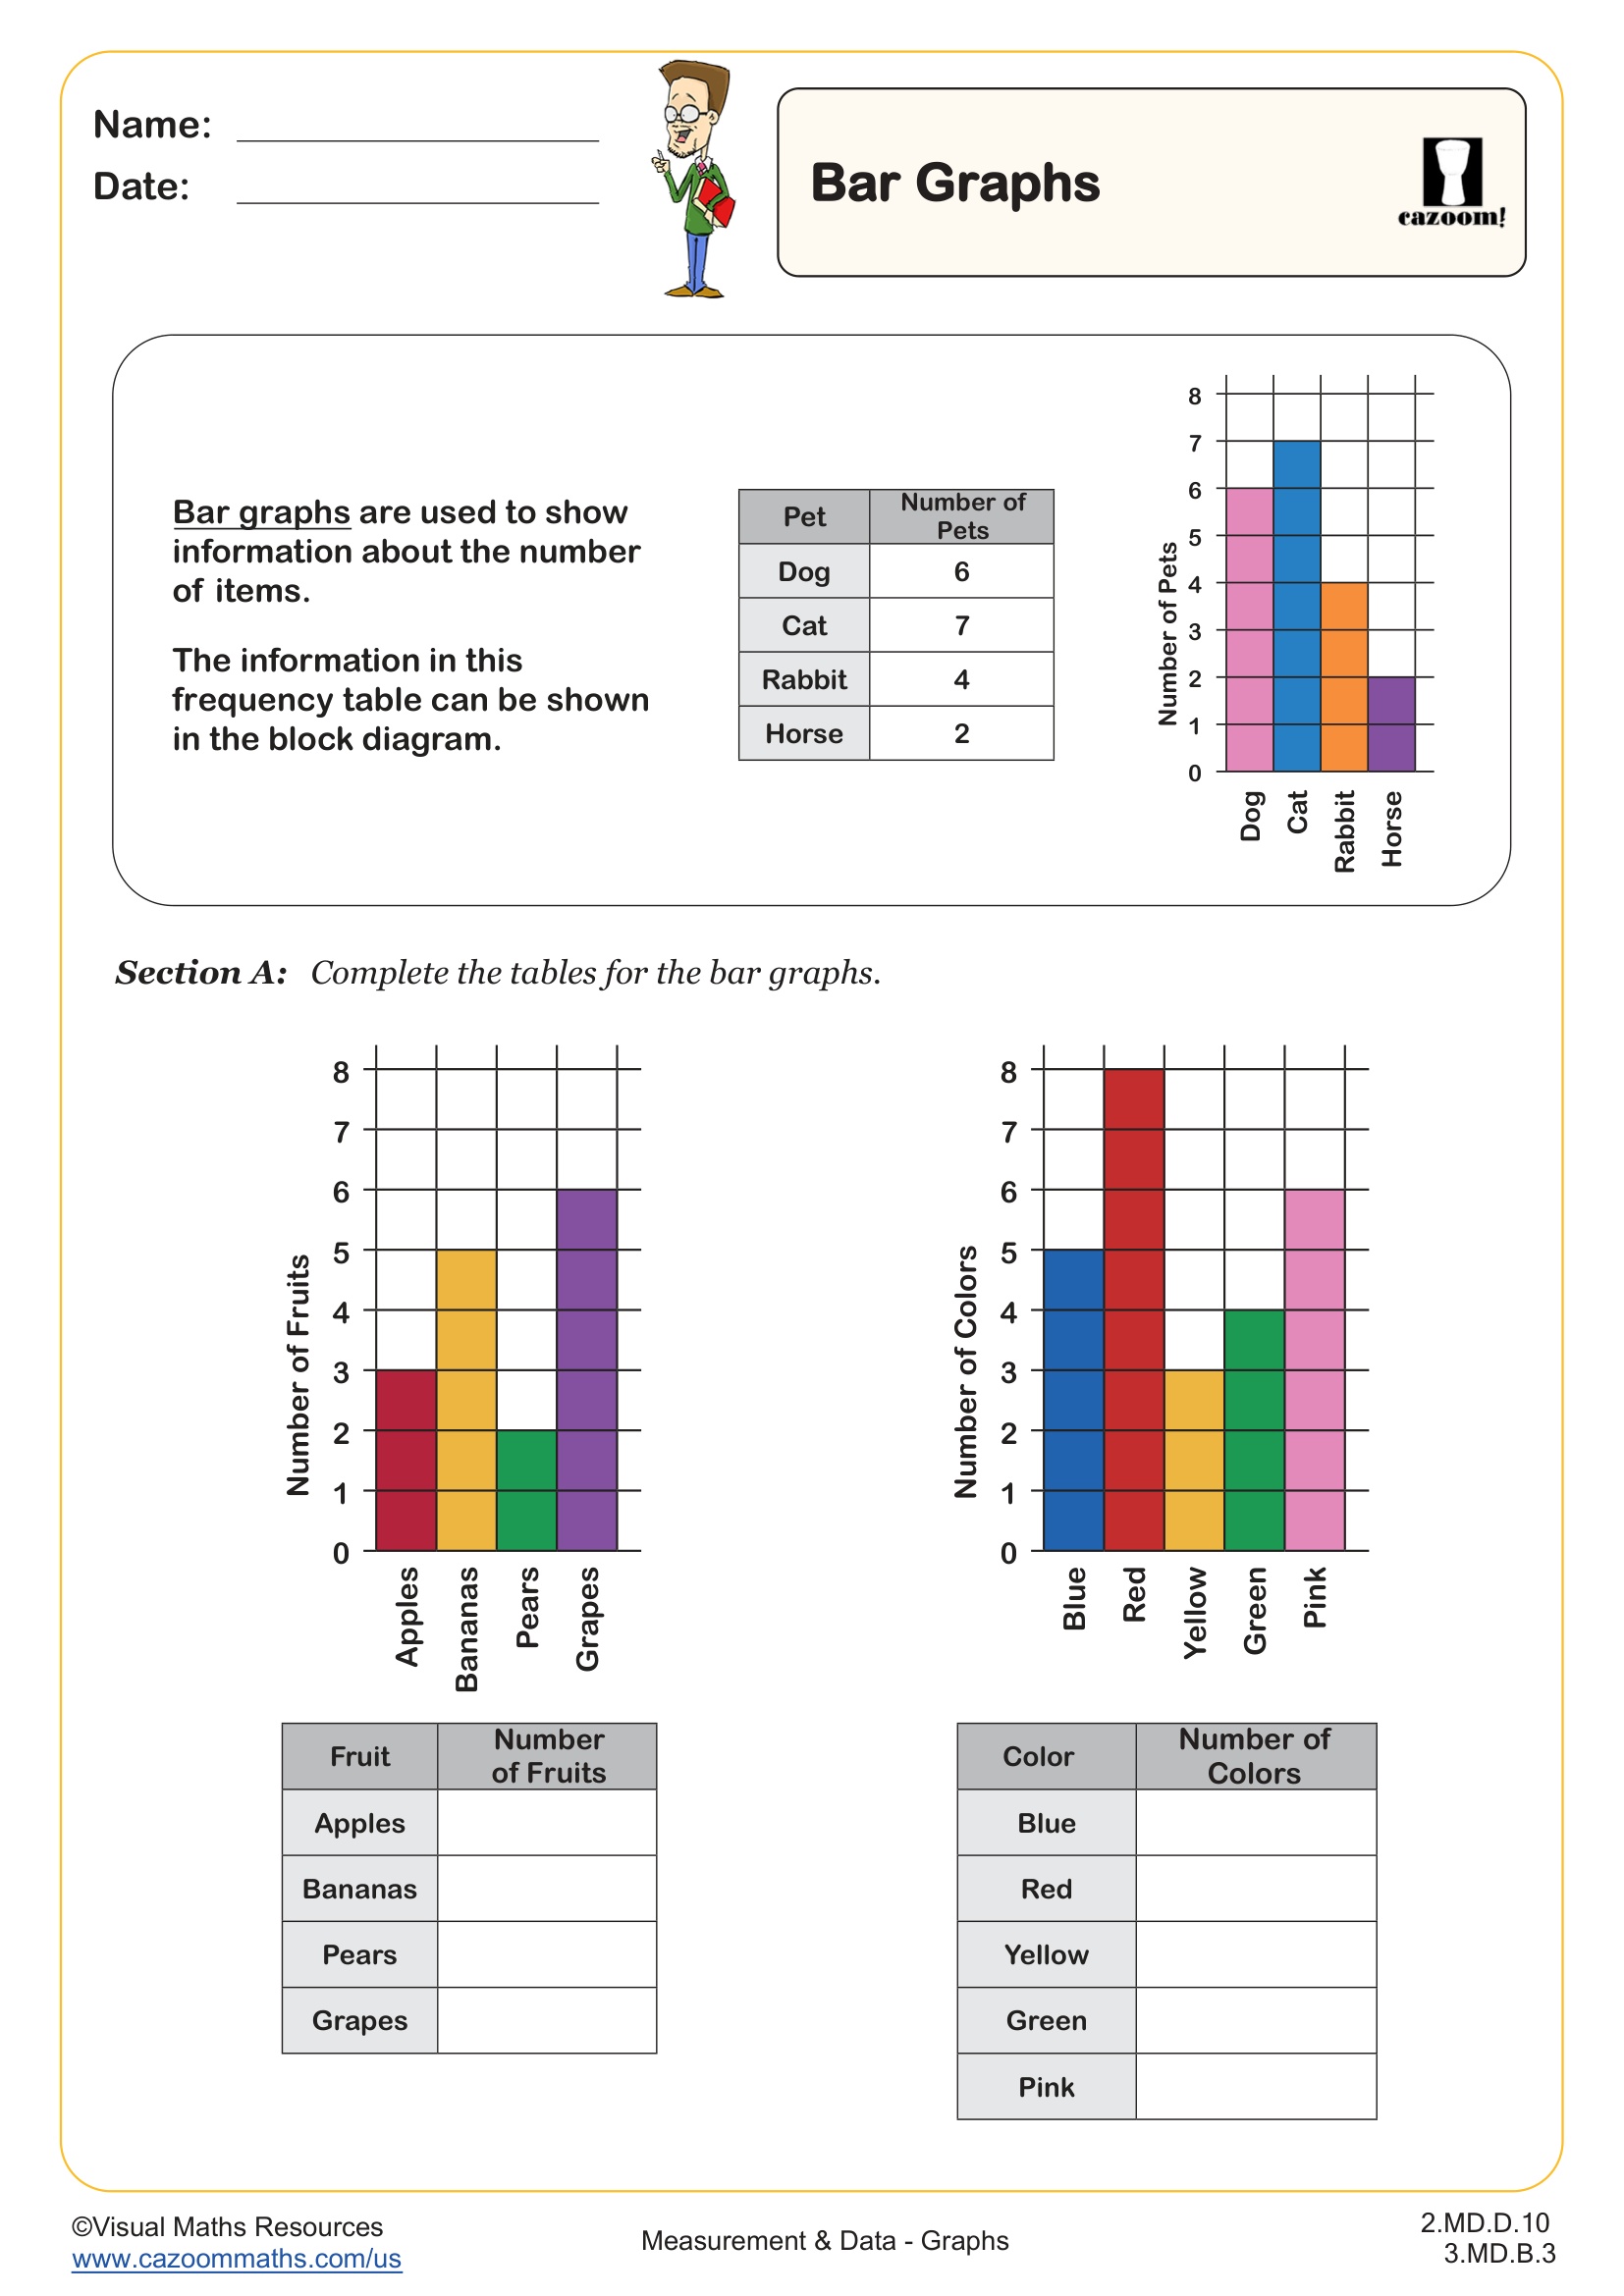
Bar Graphs
Grades: 2nd Grade, 3rd Grade
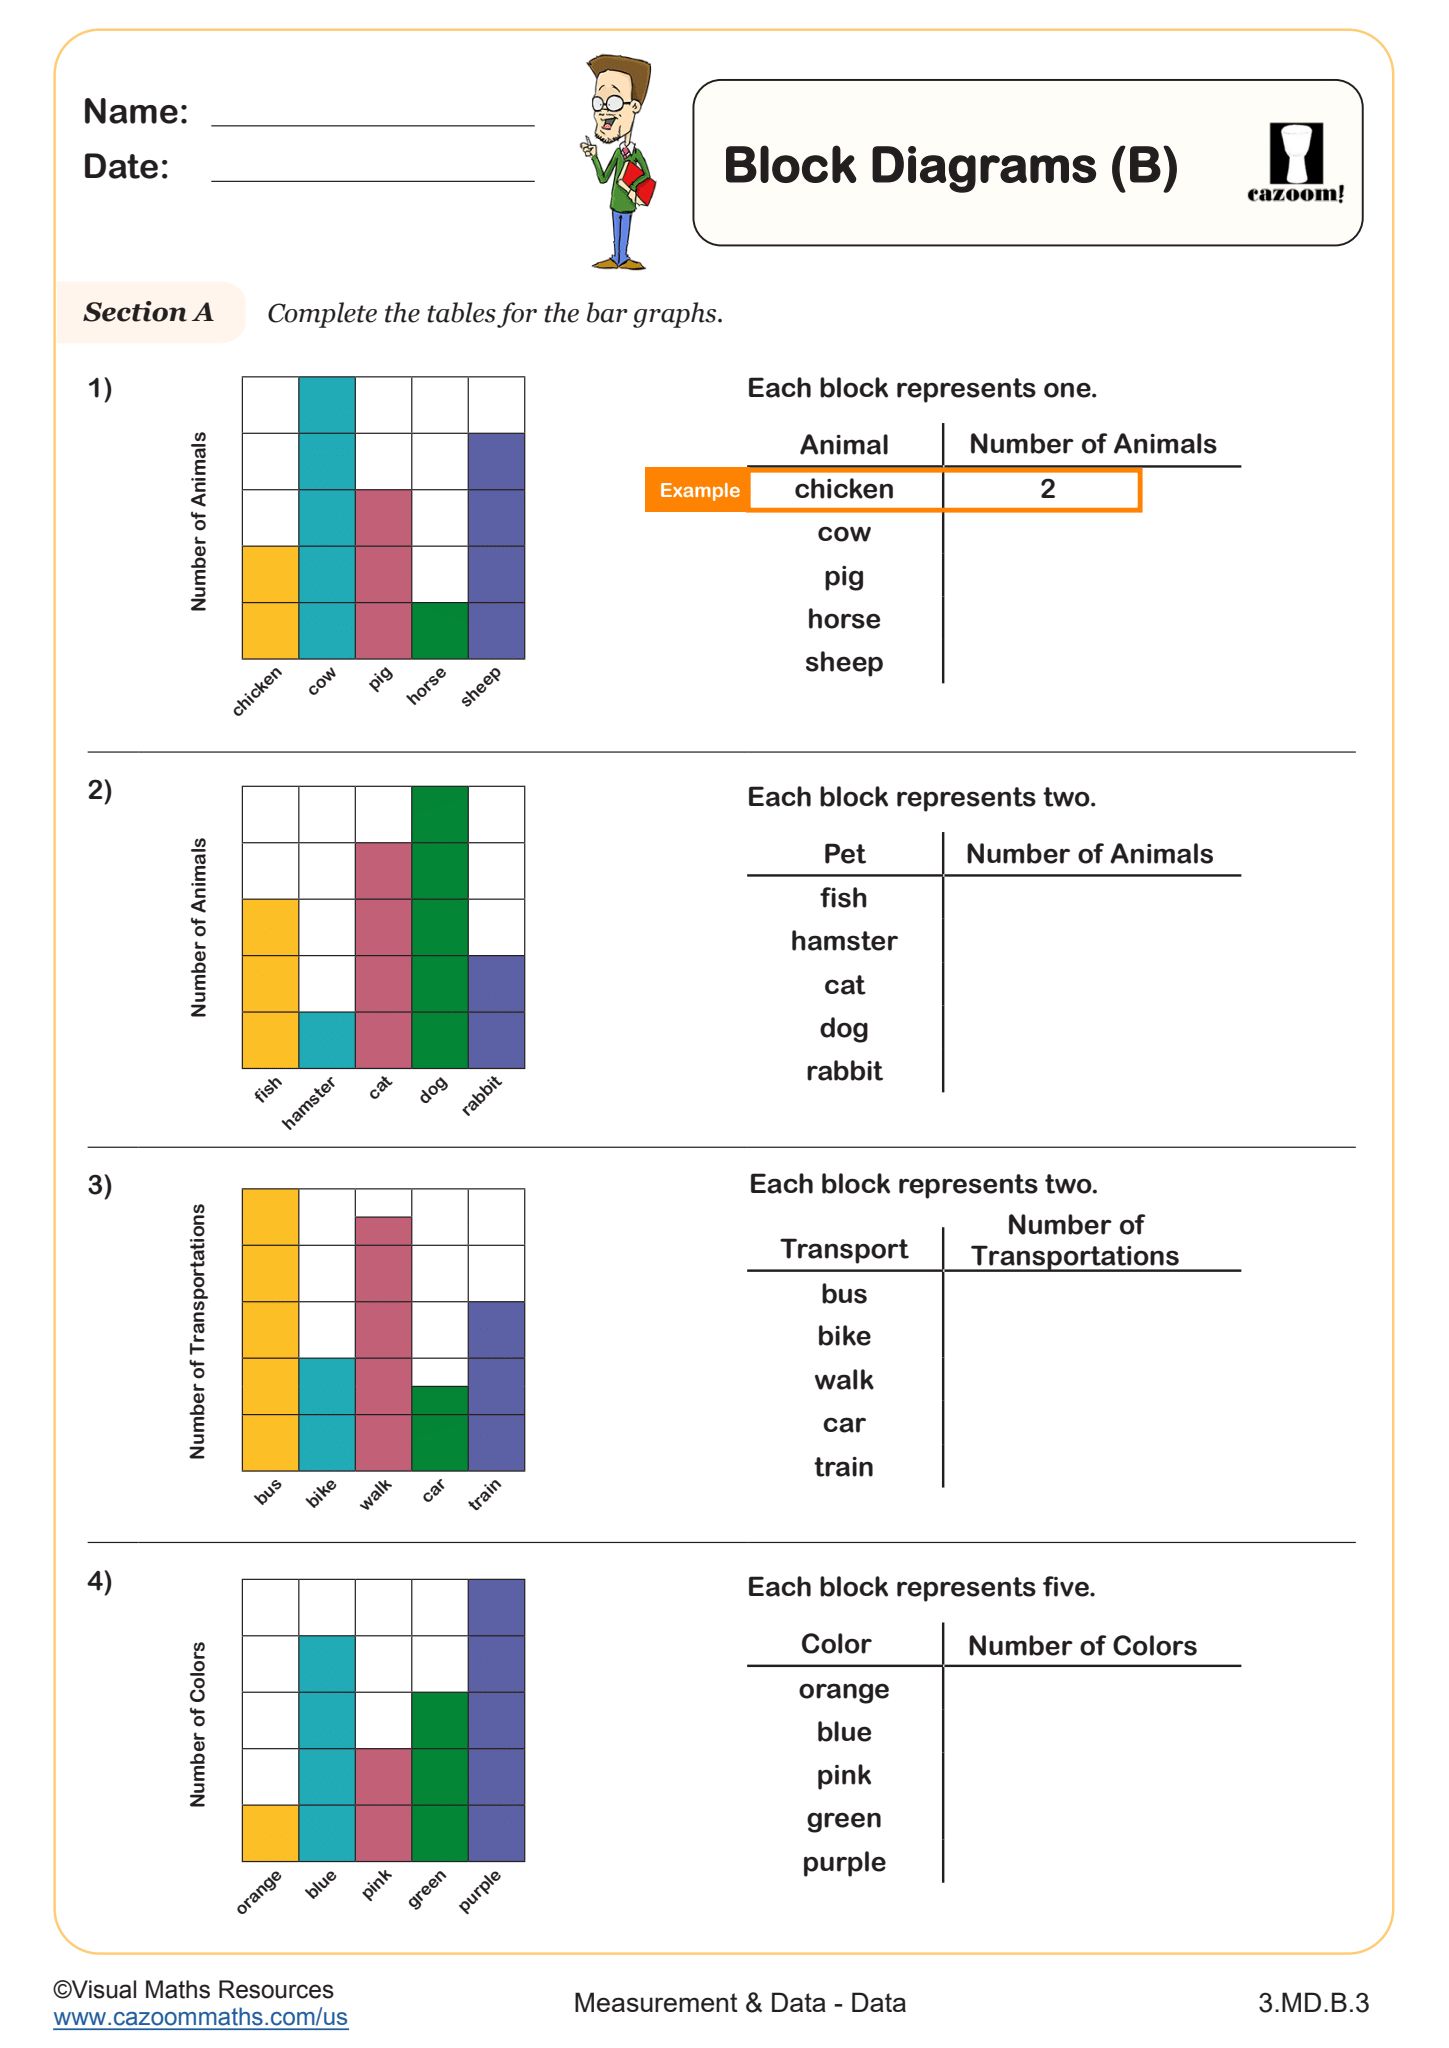
Block Diagrams (B)
Grades: 2nd Grade, 3rd Grade
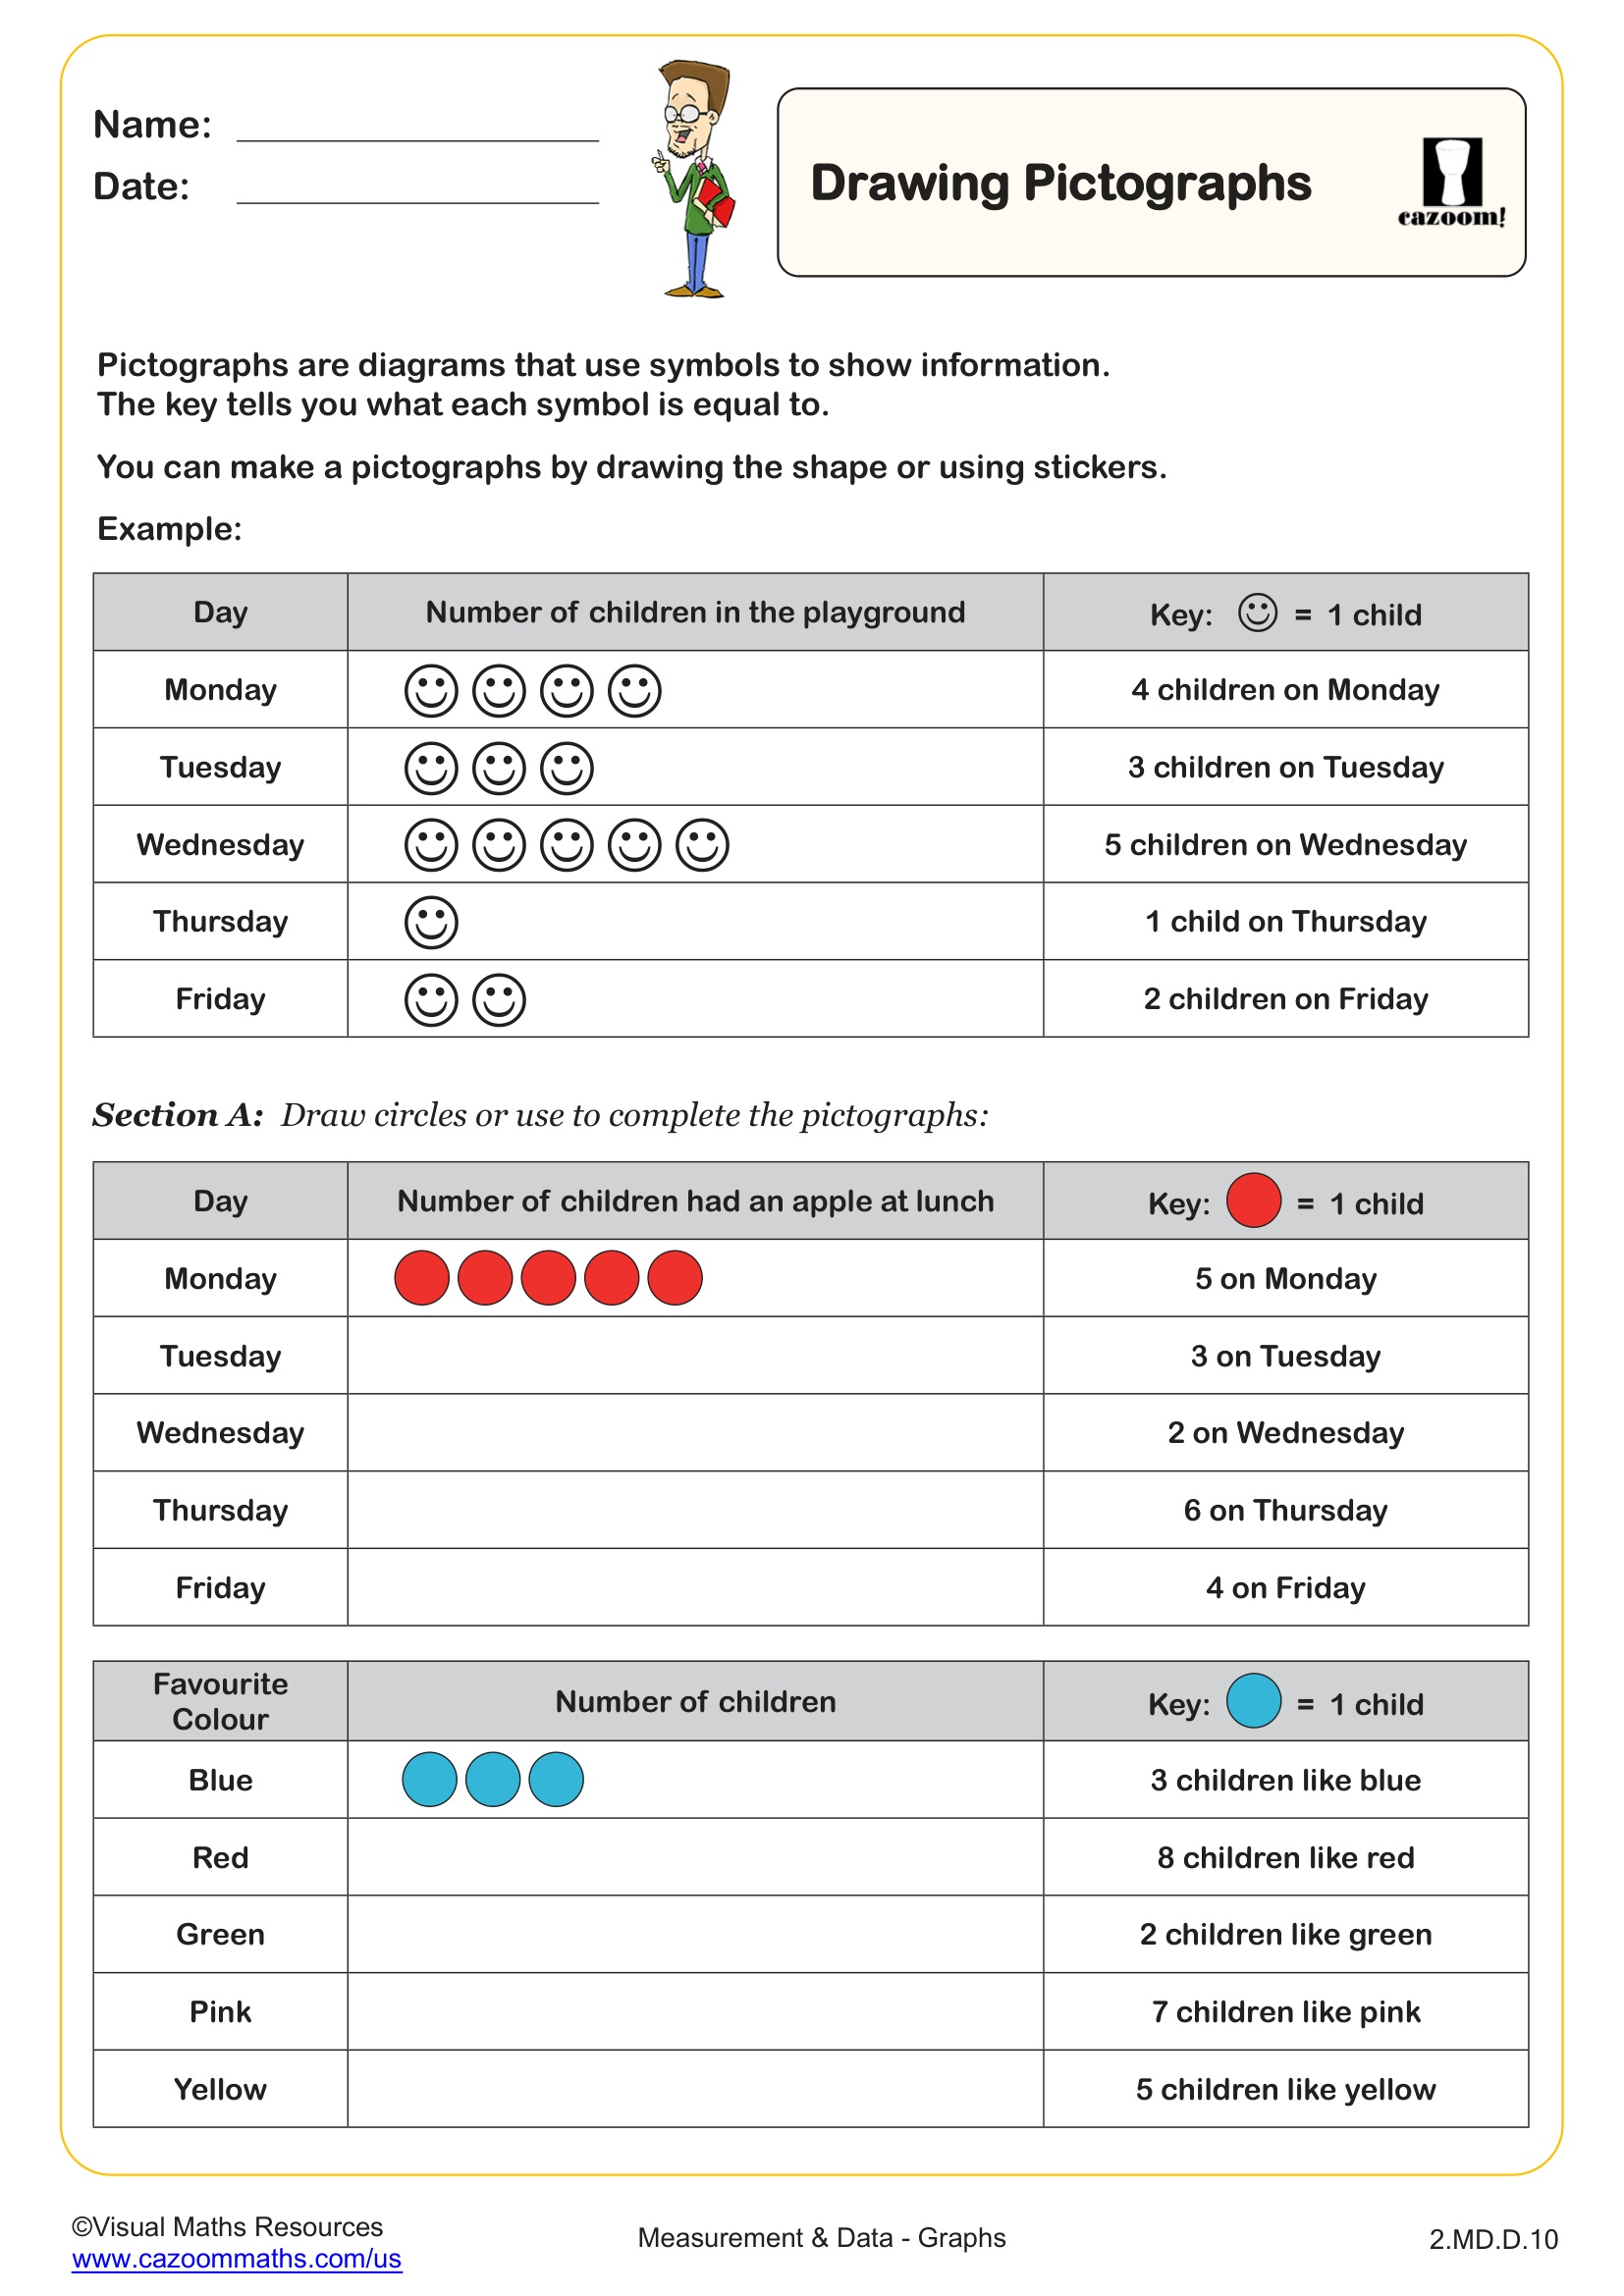
Drawing Pictographs
Grades: 2nd Grade
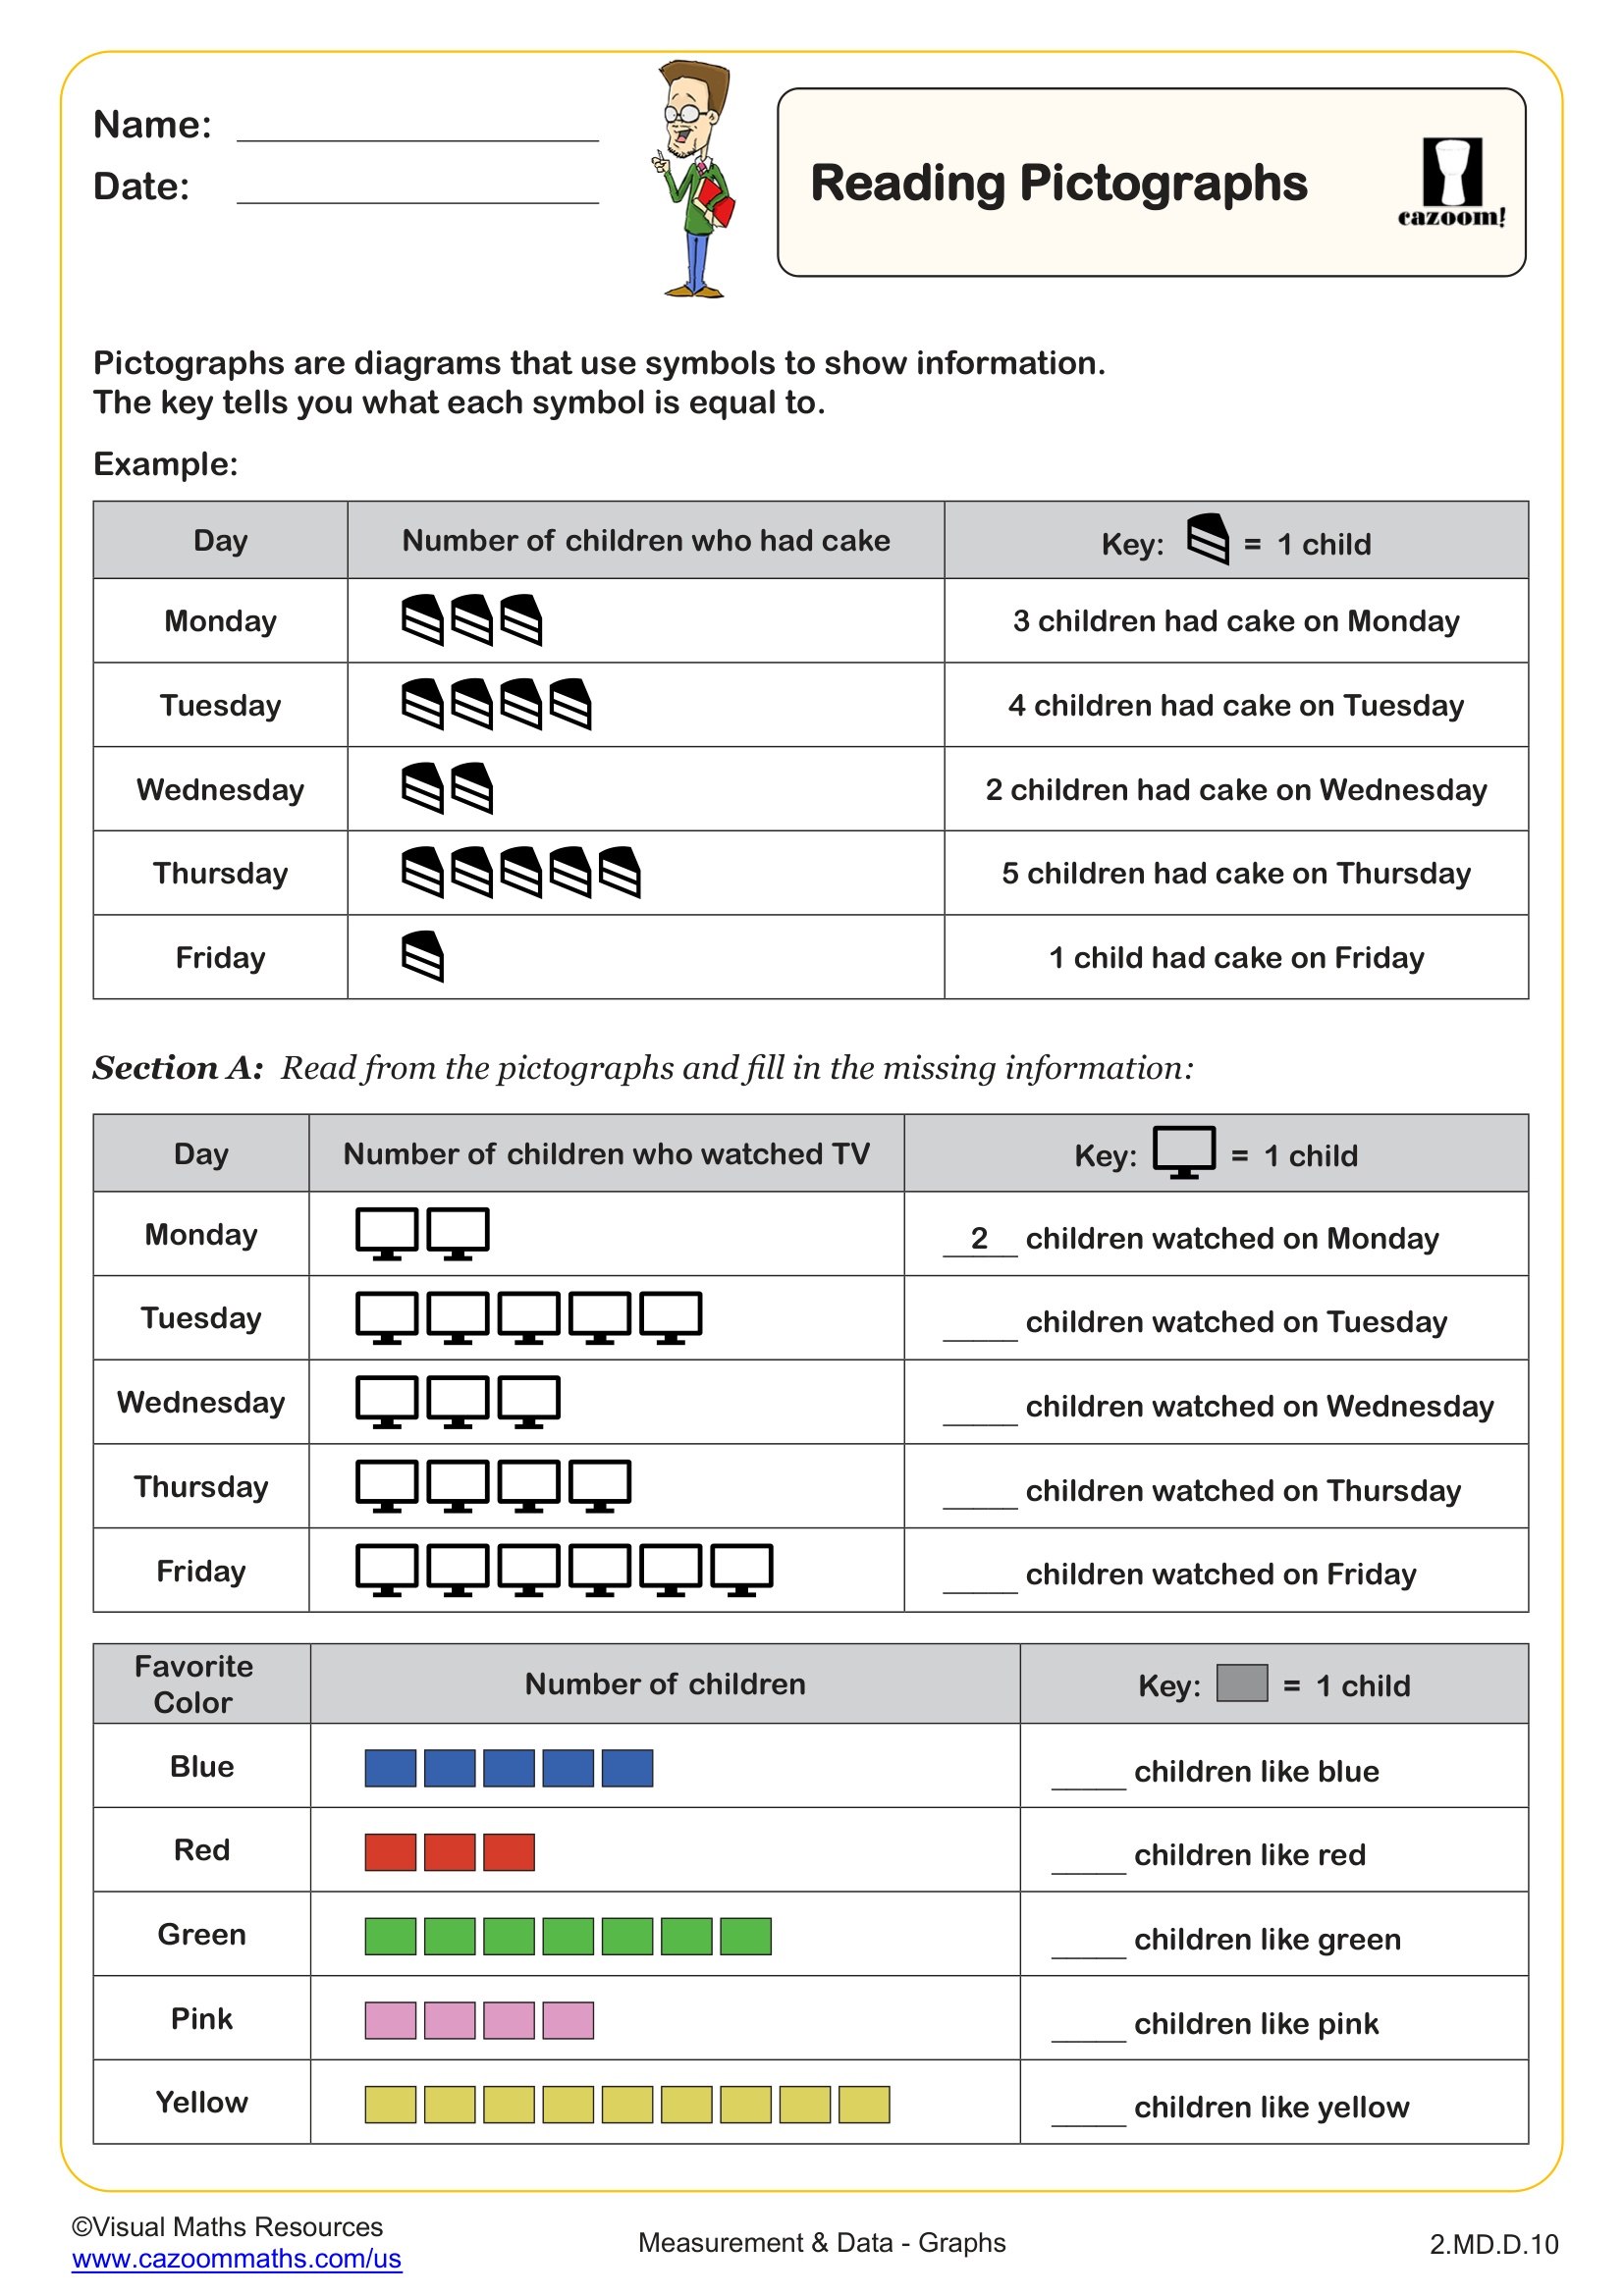
Reading Pictographs
Grades: 2nd Grade
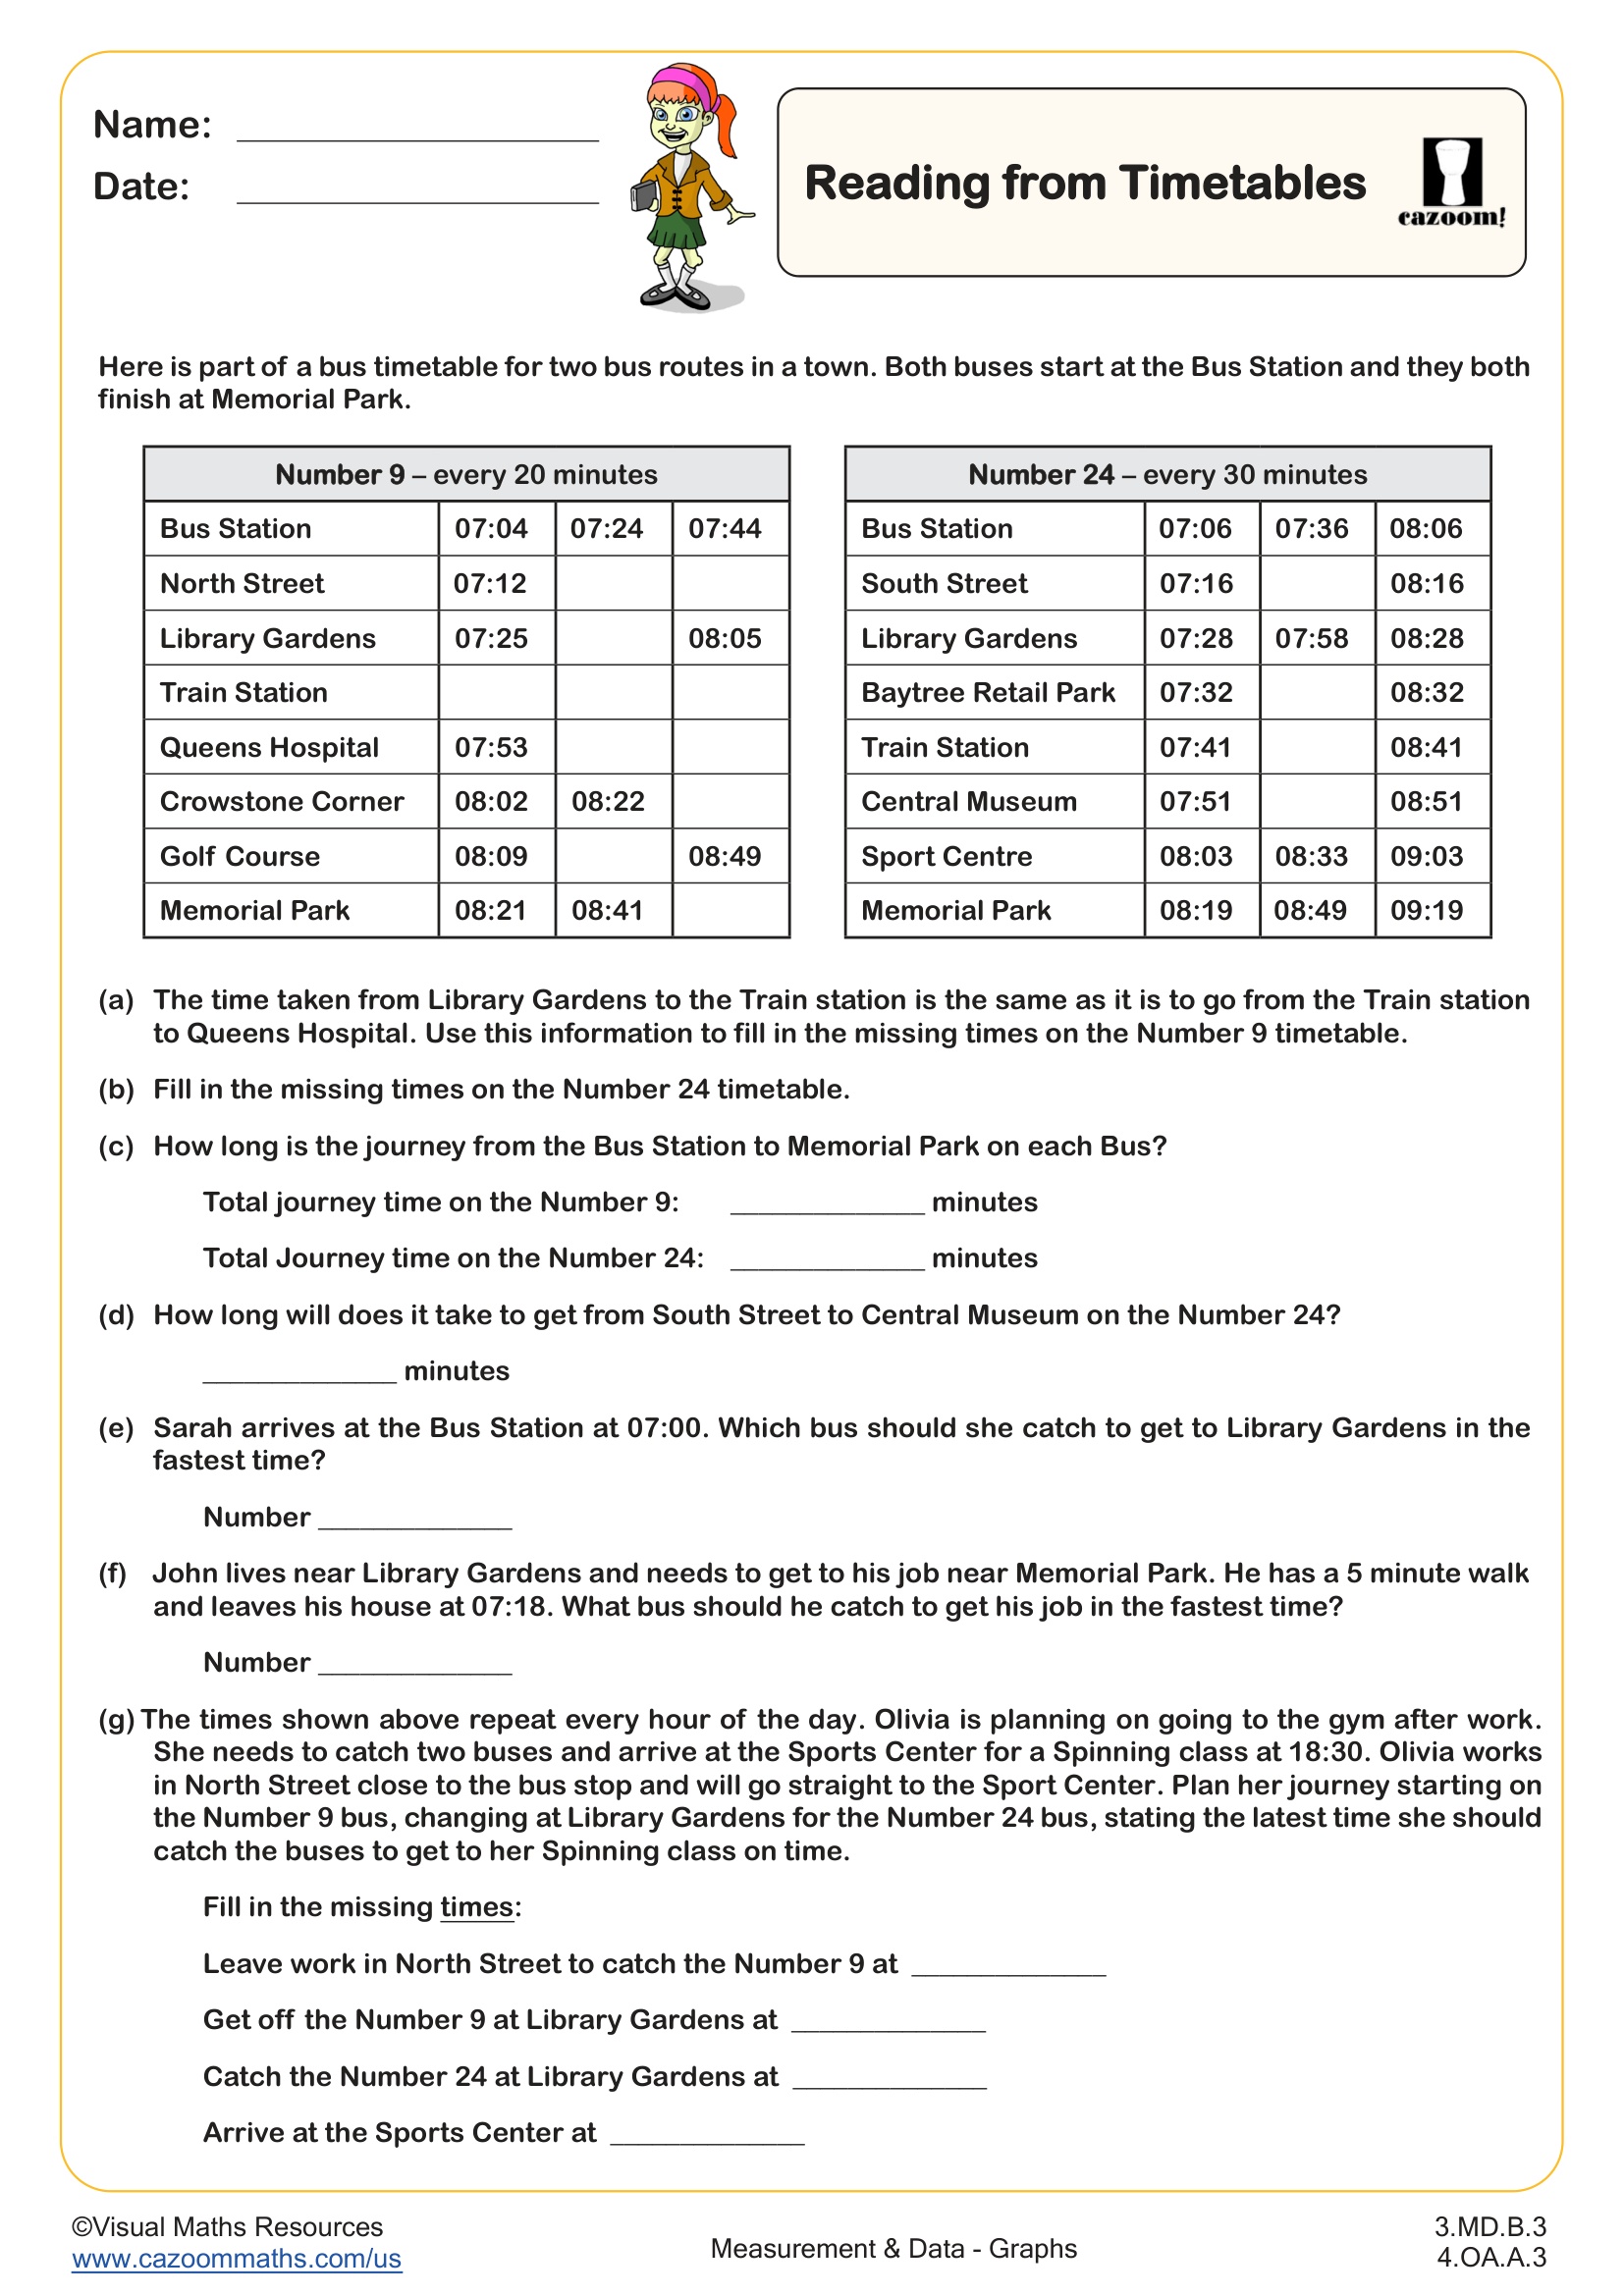
Reading from Time Tables
Grades: 3rd Grade, 4th Grade
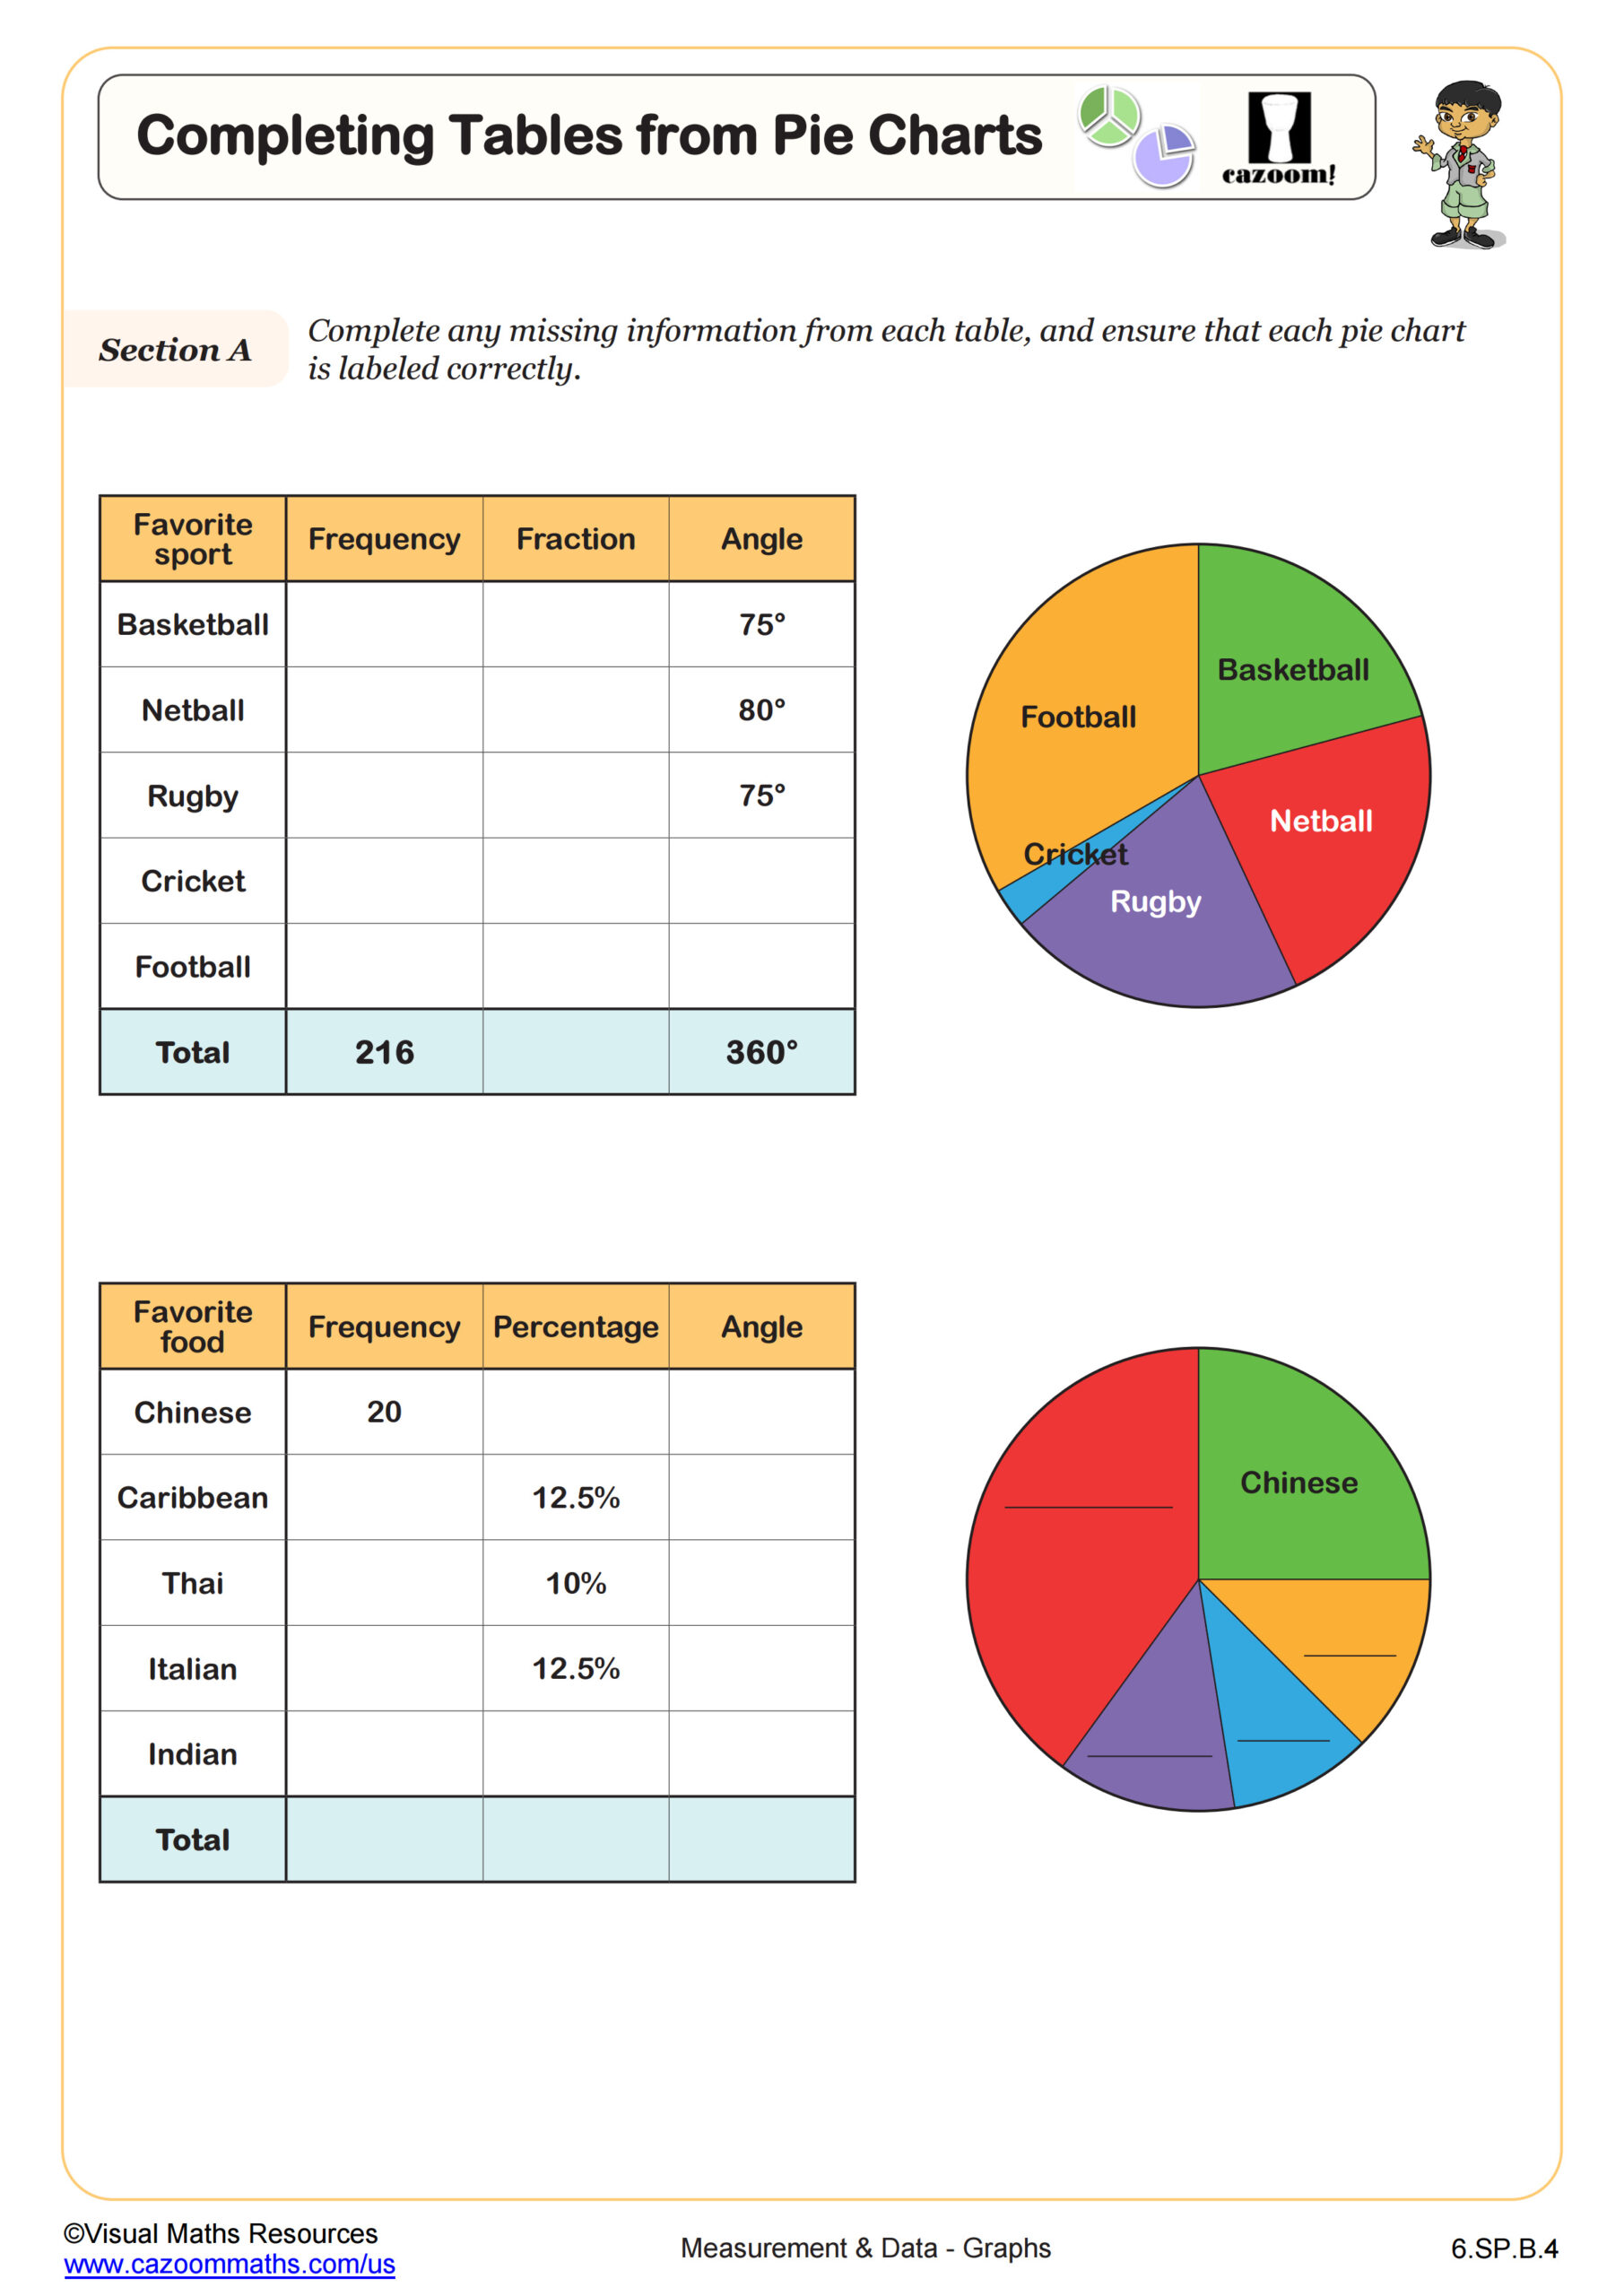
Completing Tables from Pie Charts
Grades: 6th Grade
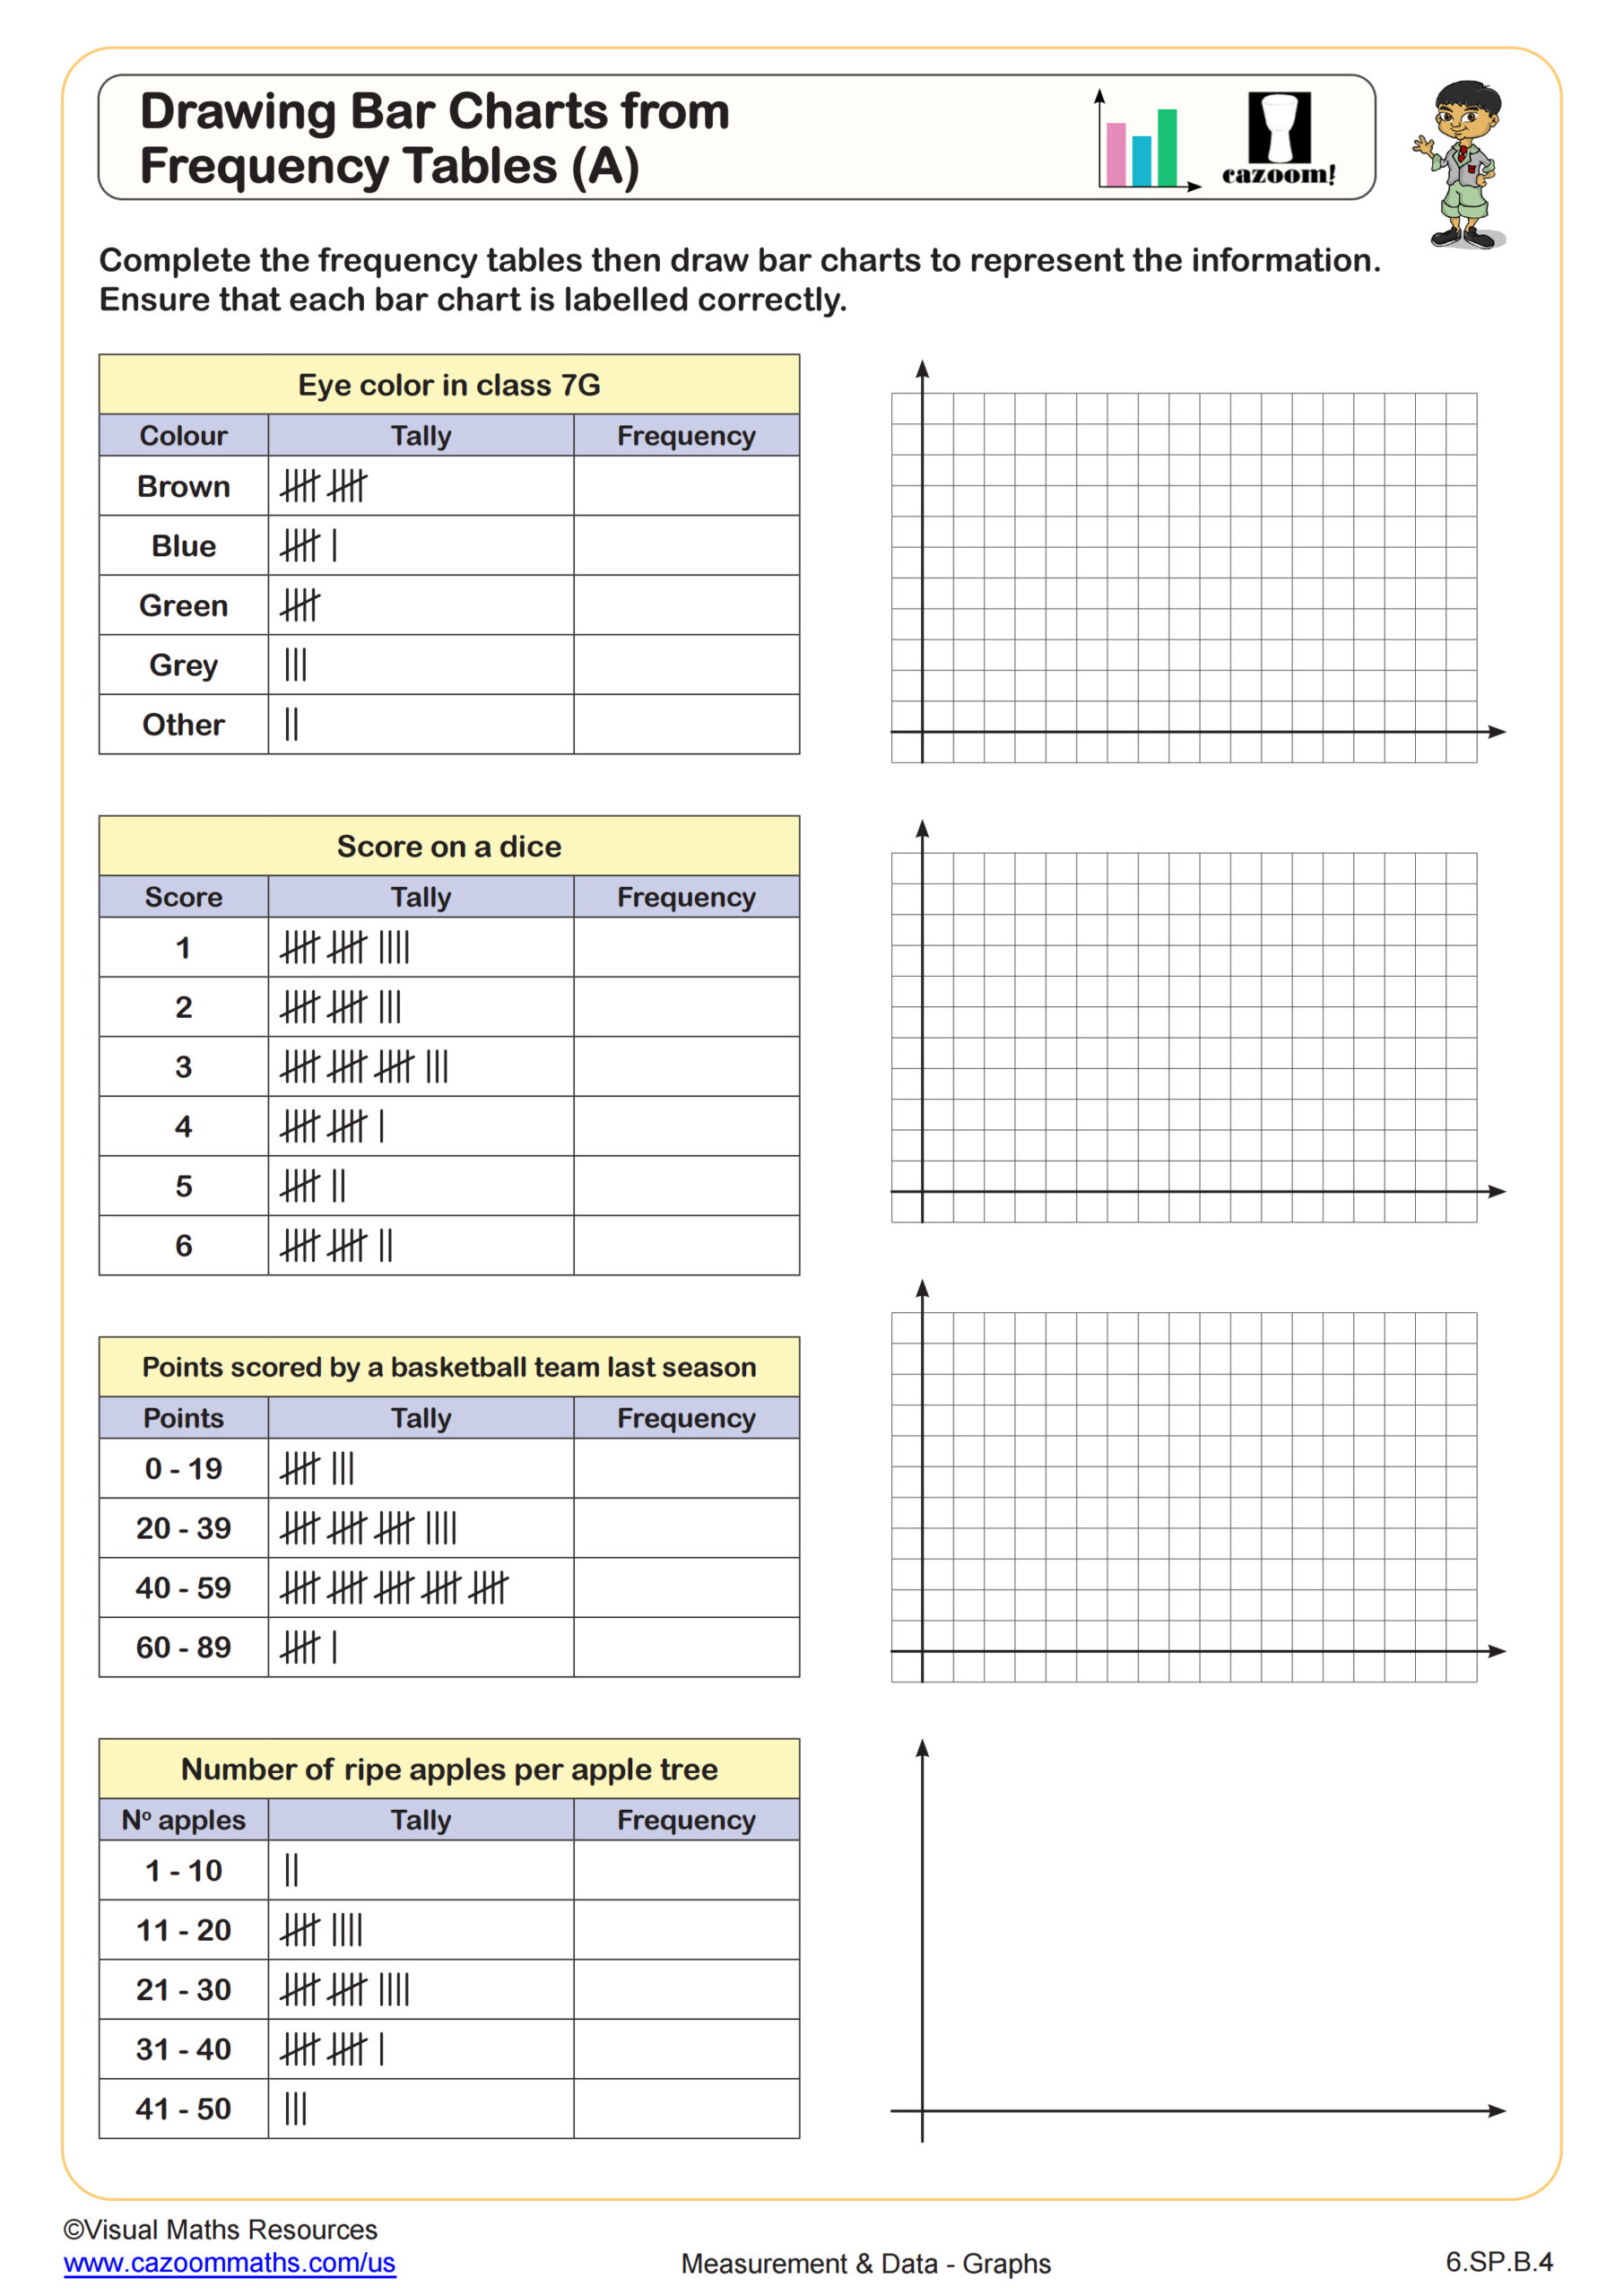
Drawing Bar Graphs from Frequency Tables (A)
Grades: 6th Grade
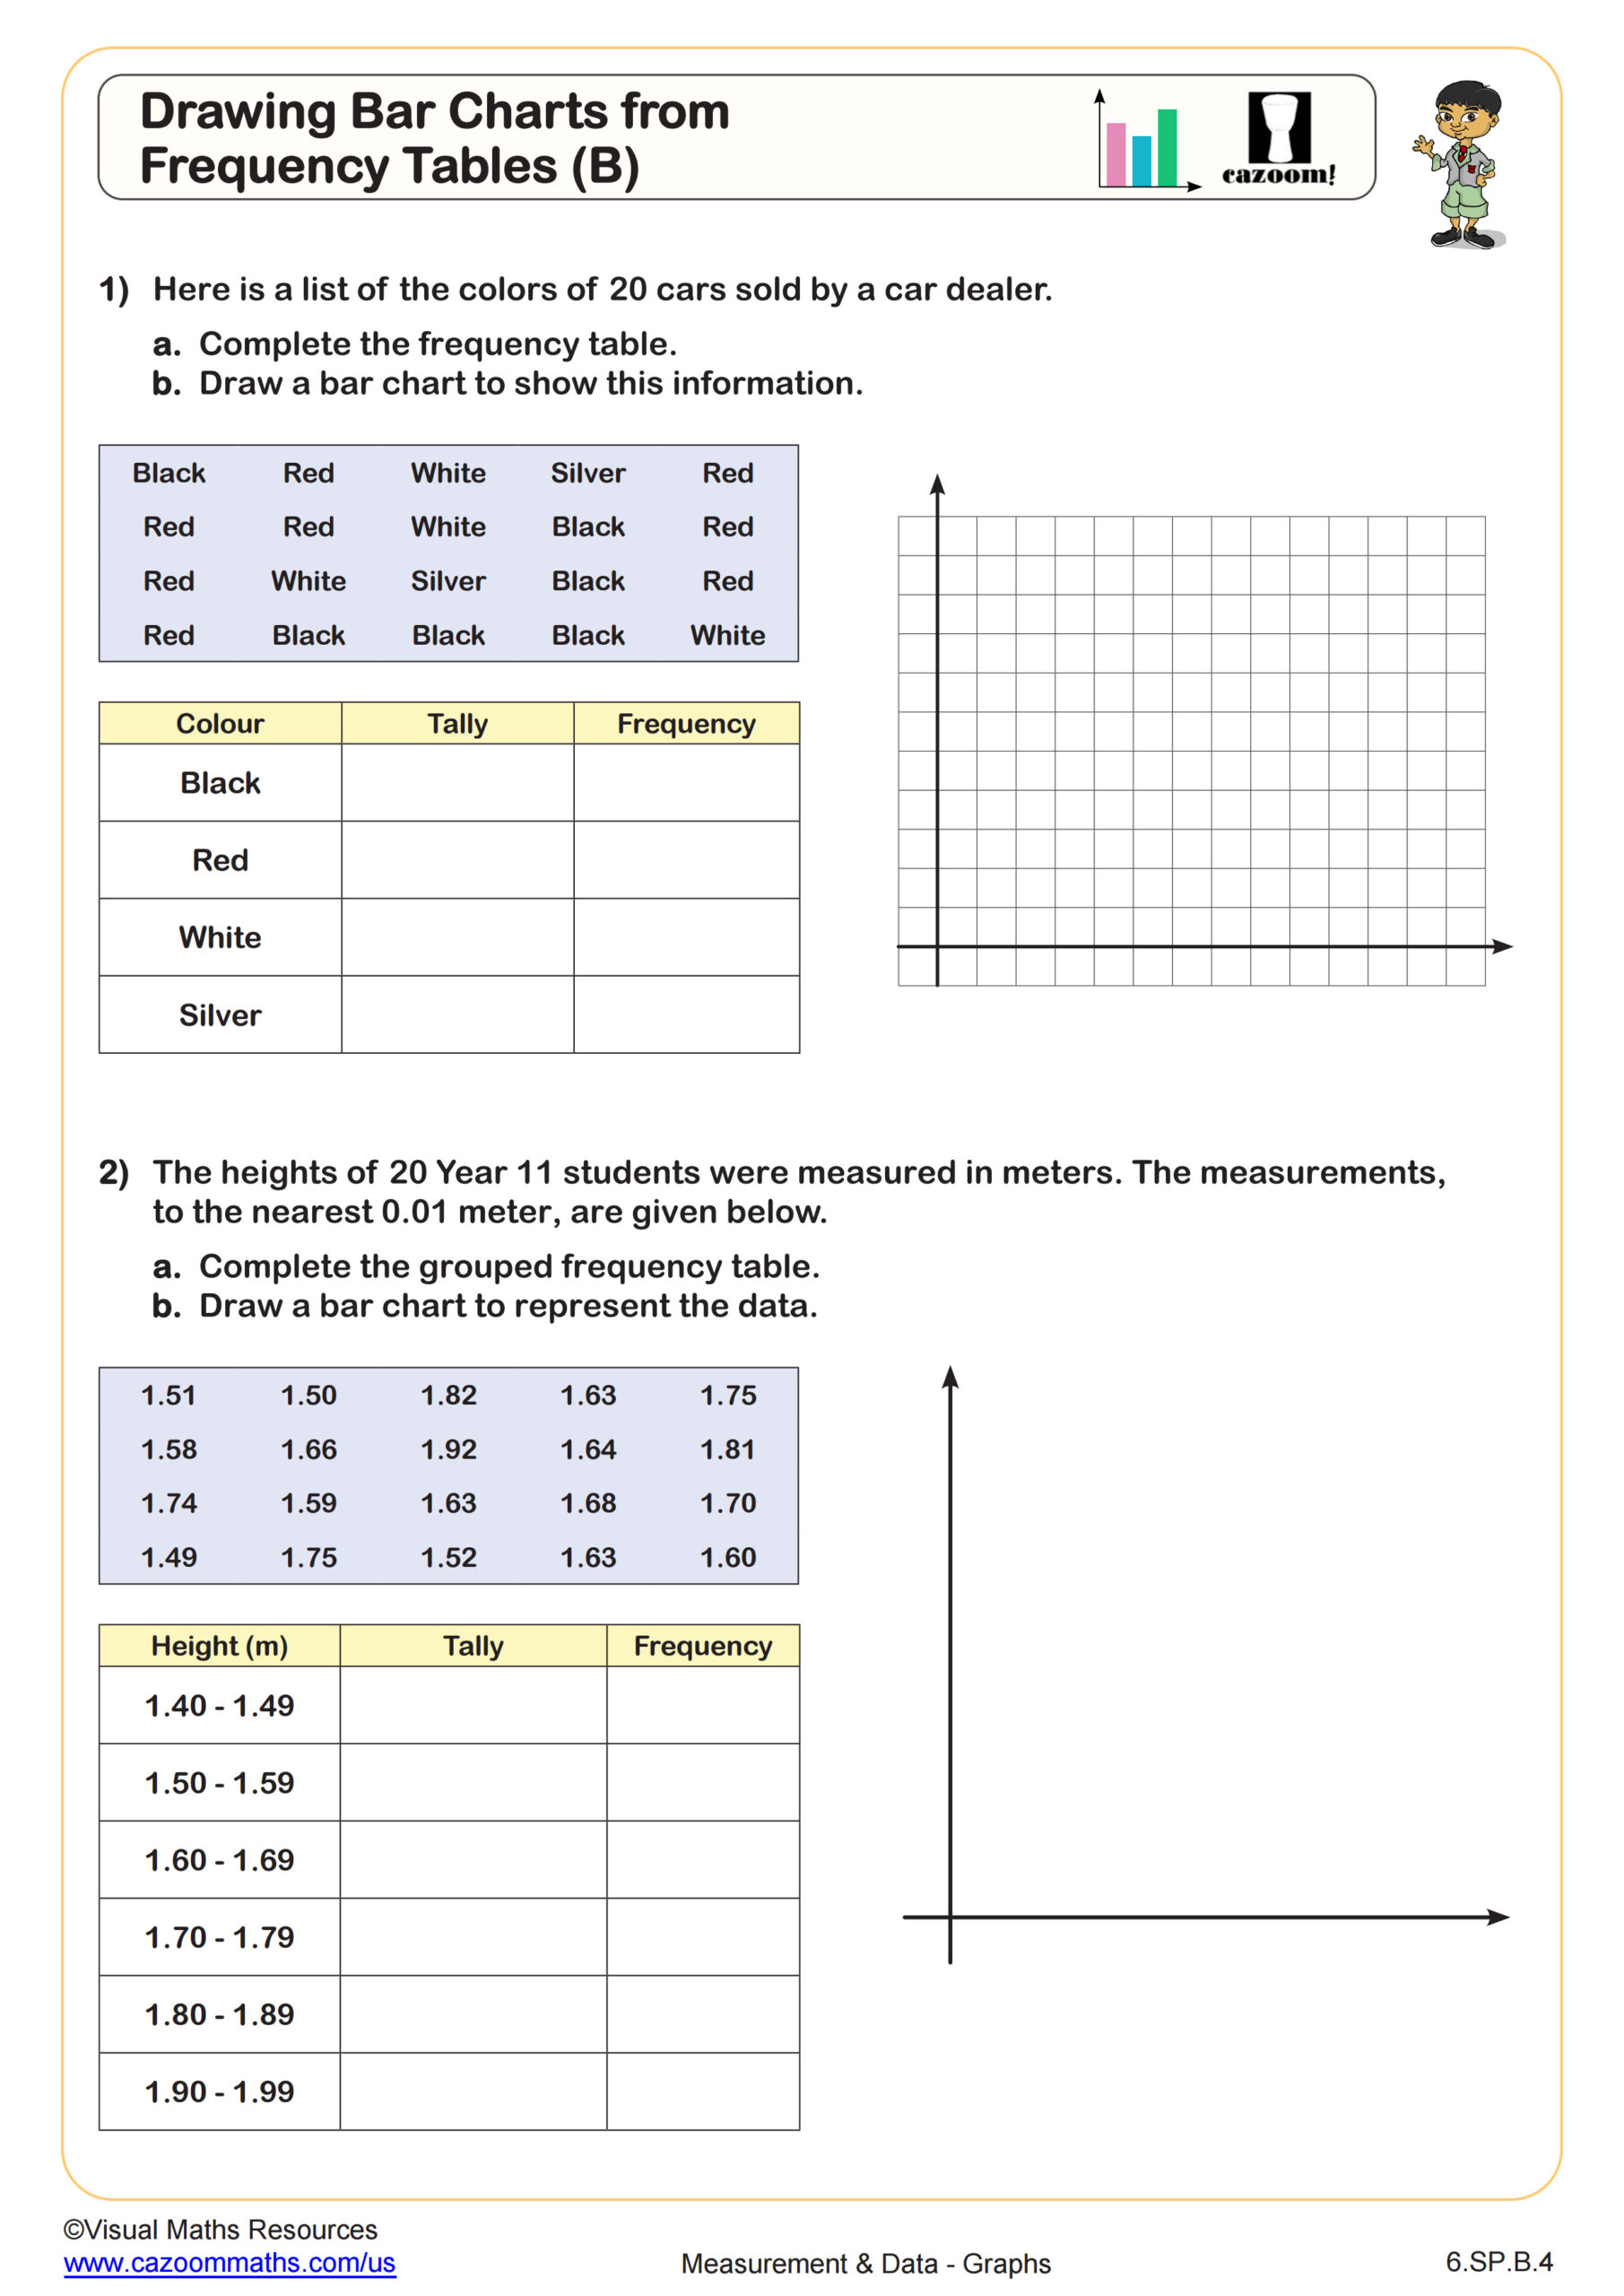
Drawing Bar Graphs from Frequency Tables (B)
Grades: 6th Grade
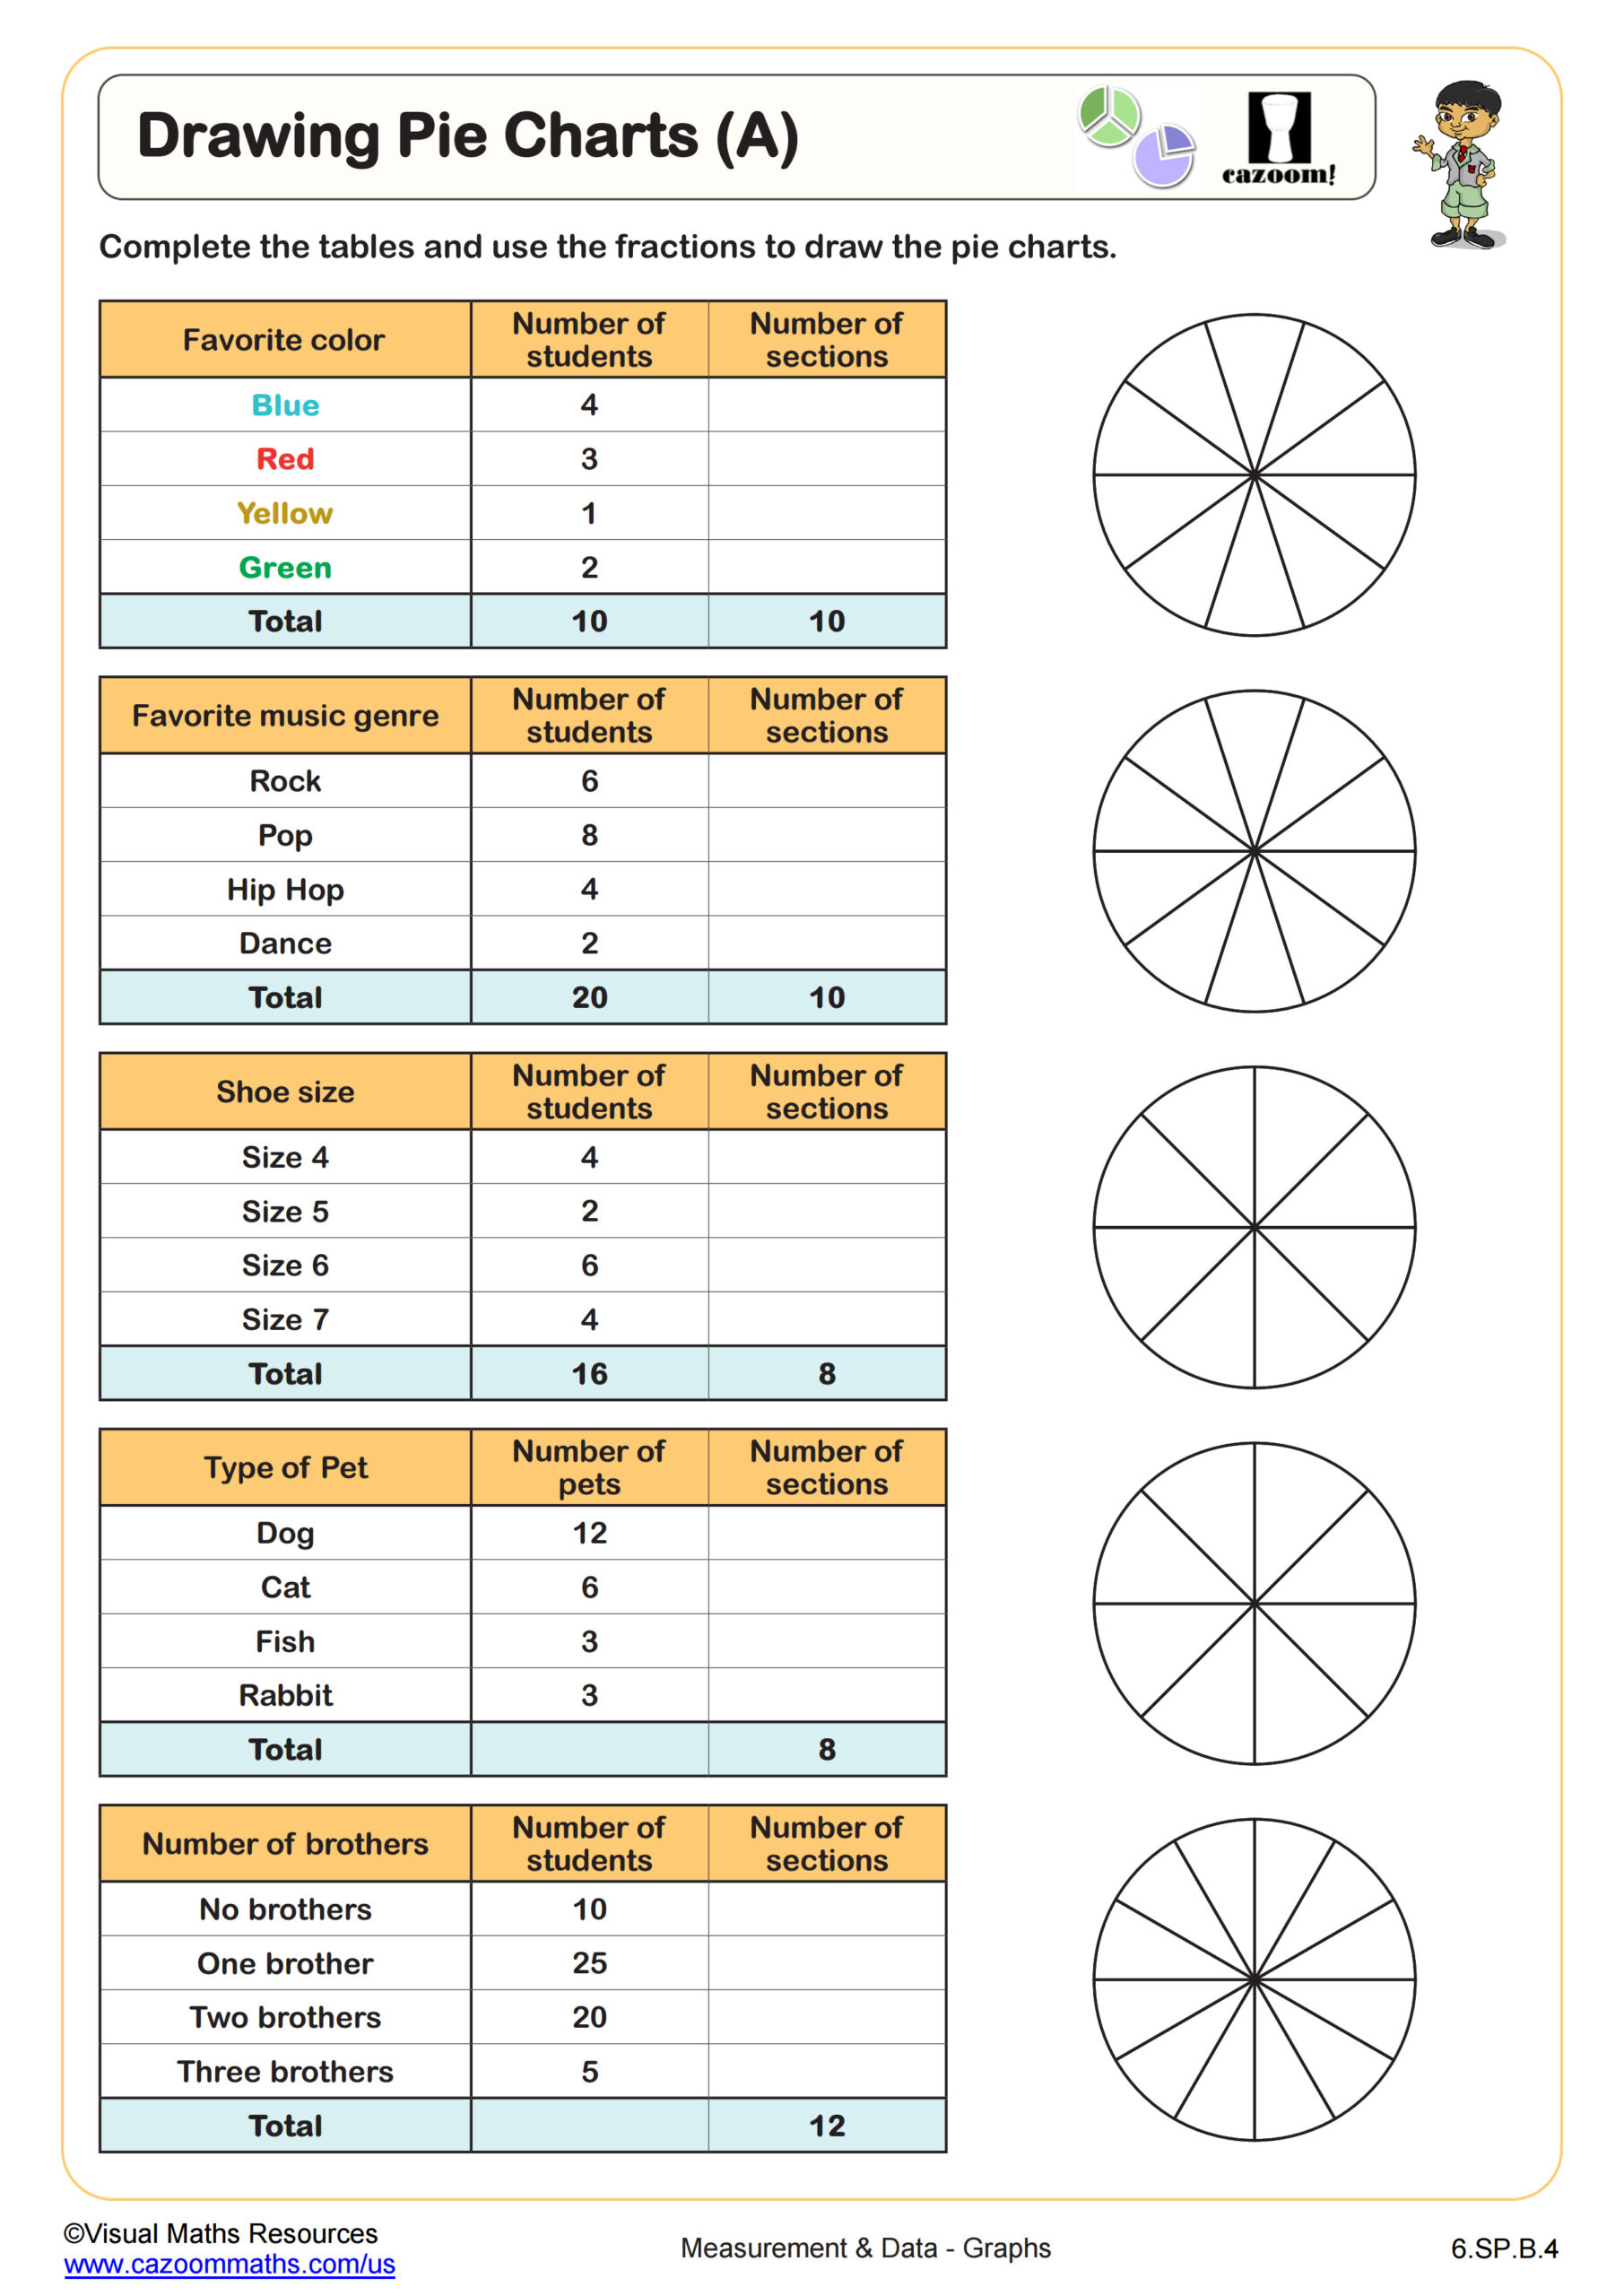
Drawing Pie Charts (A)
Grades: 6th Grade
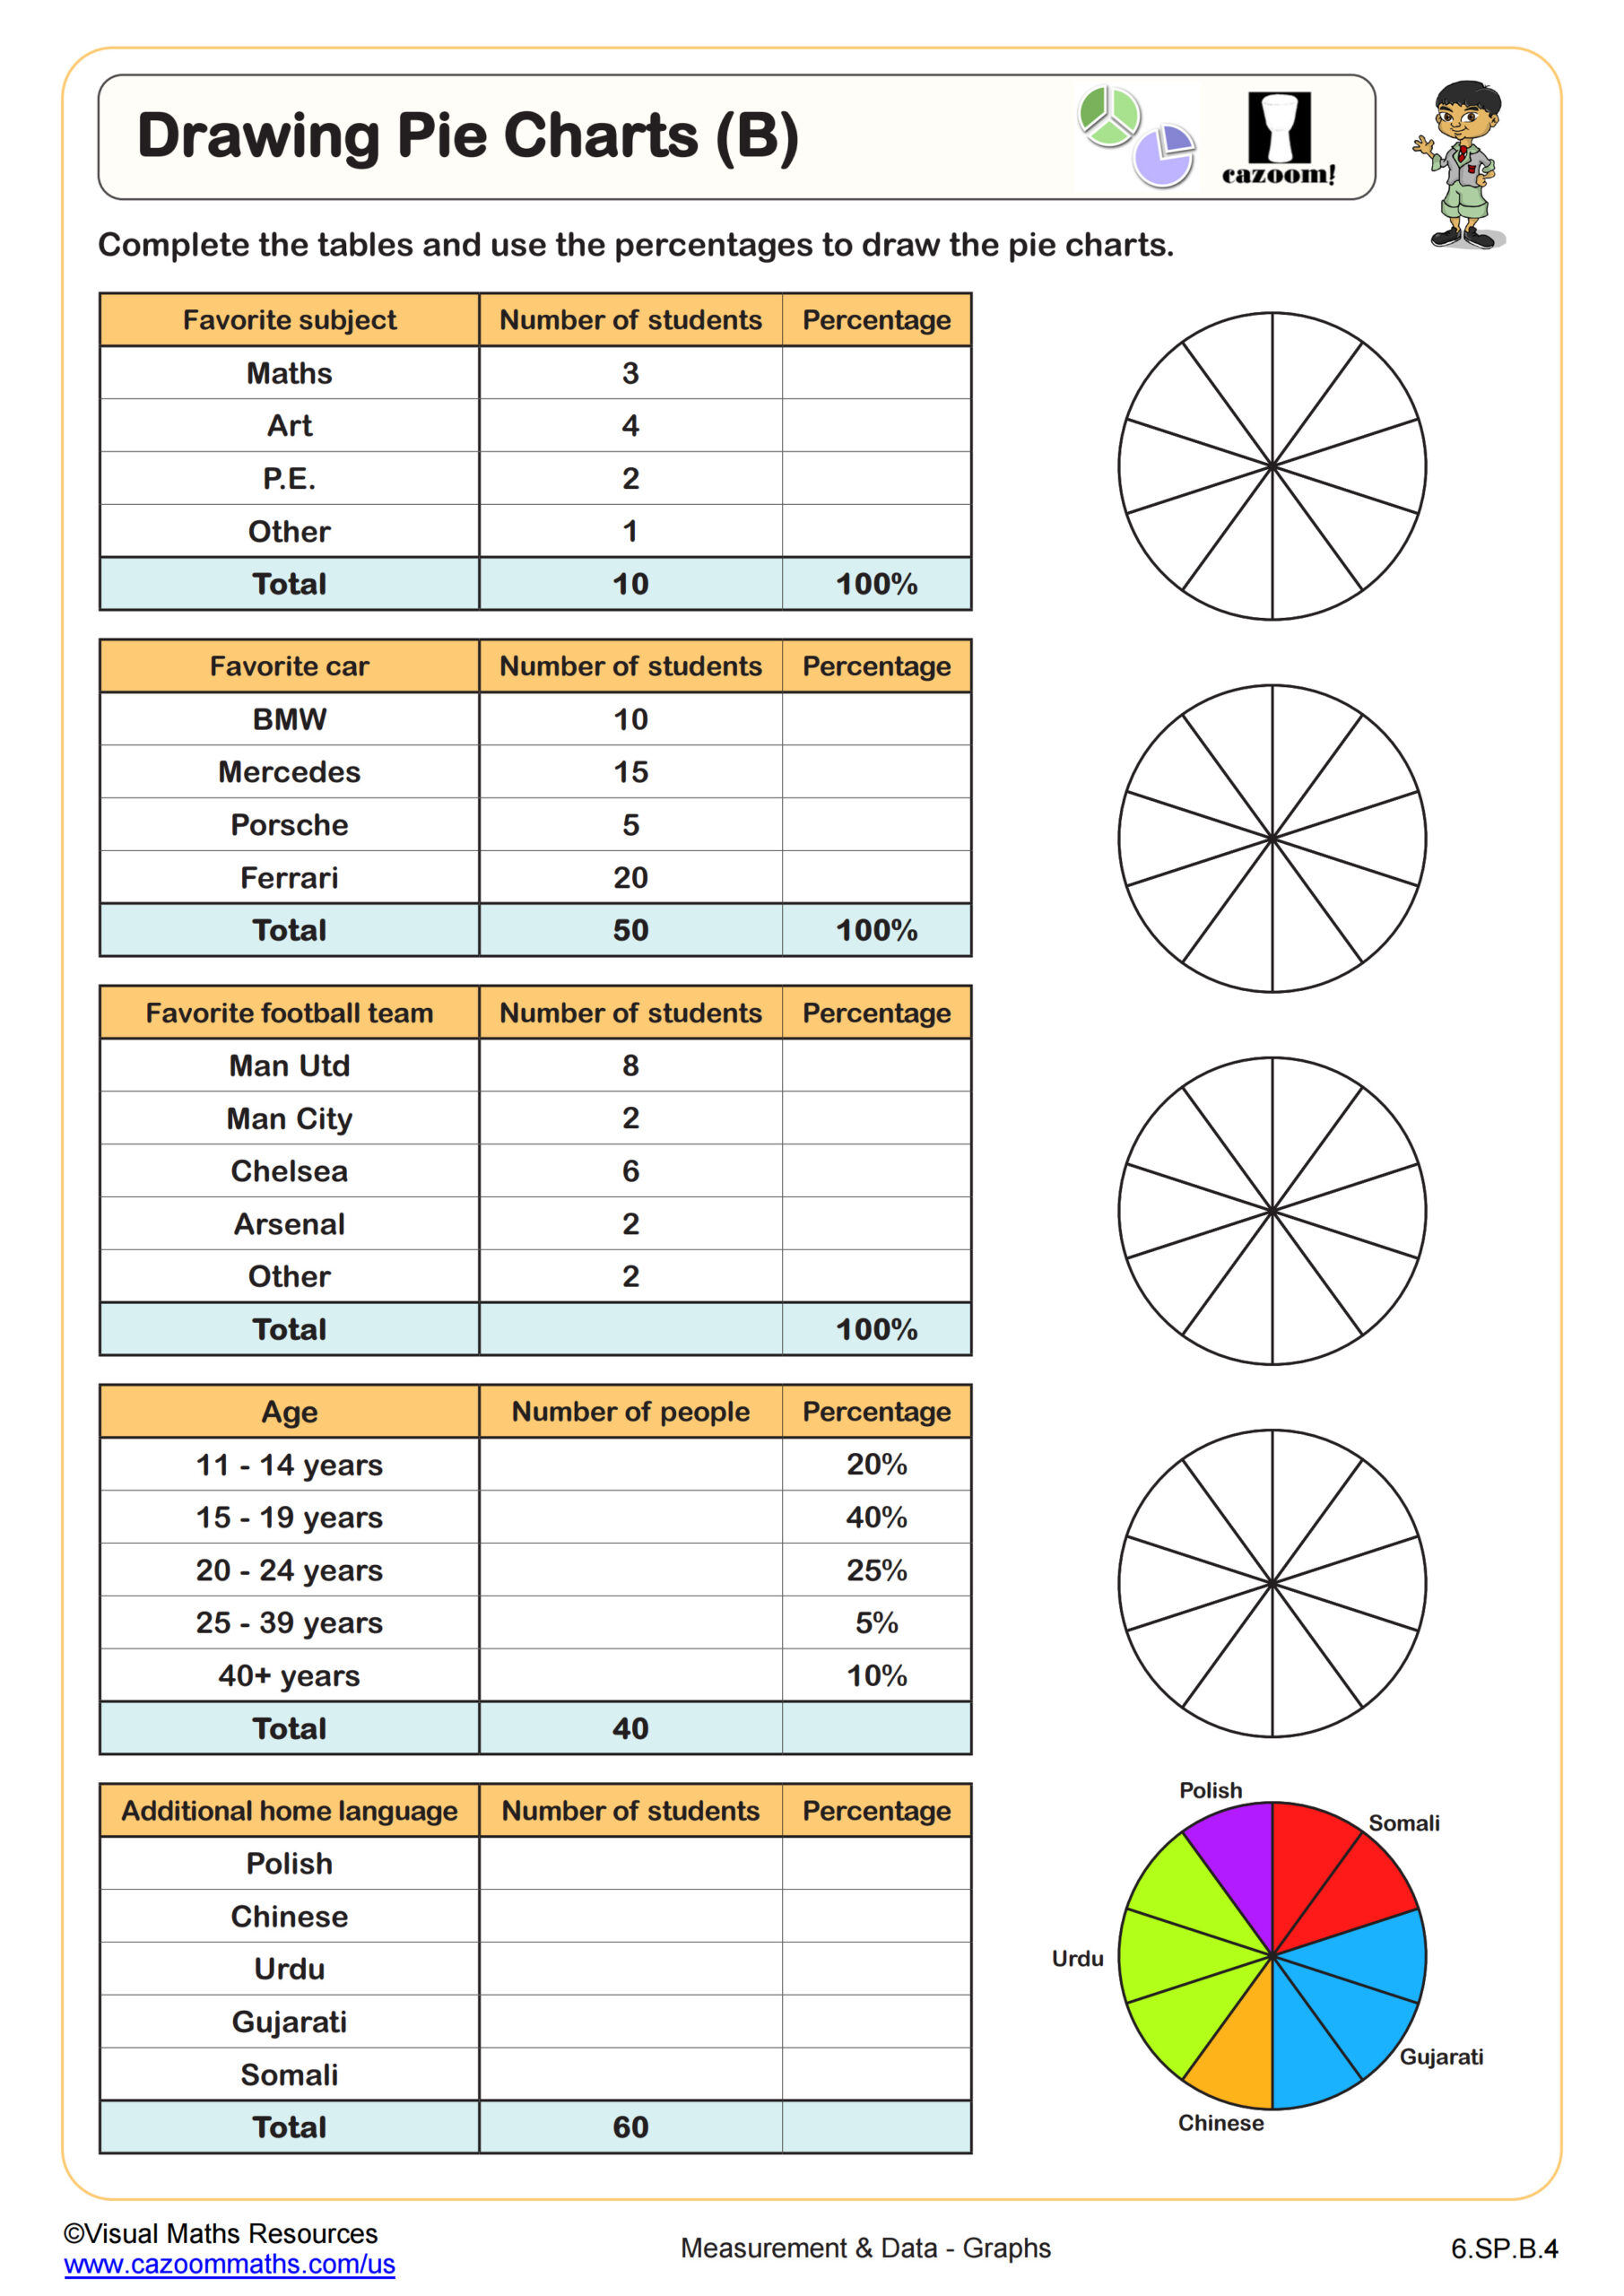
Drawing Pie Charts (B)
Grades: 6th Grade
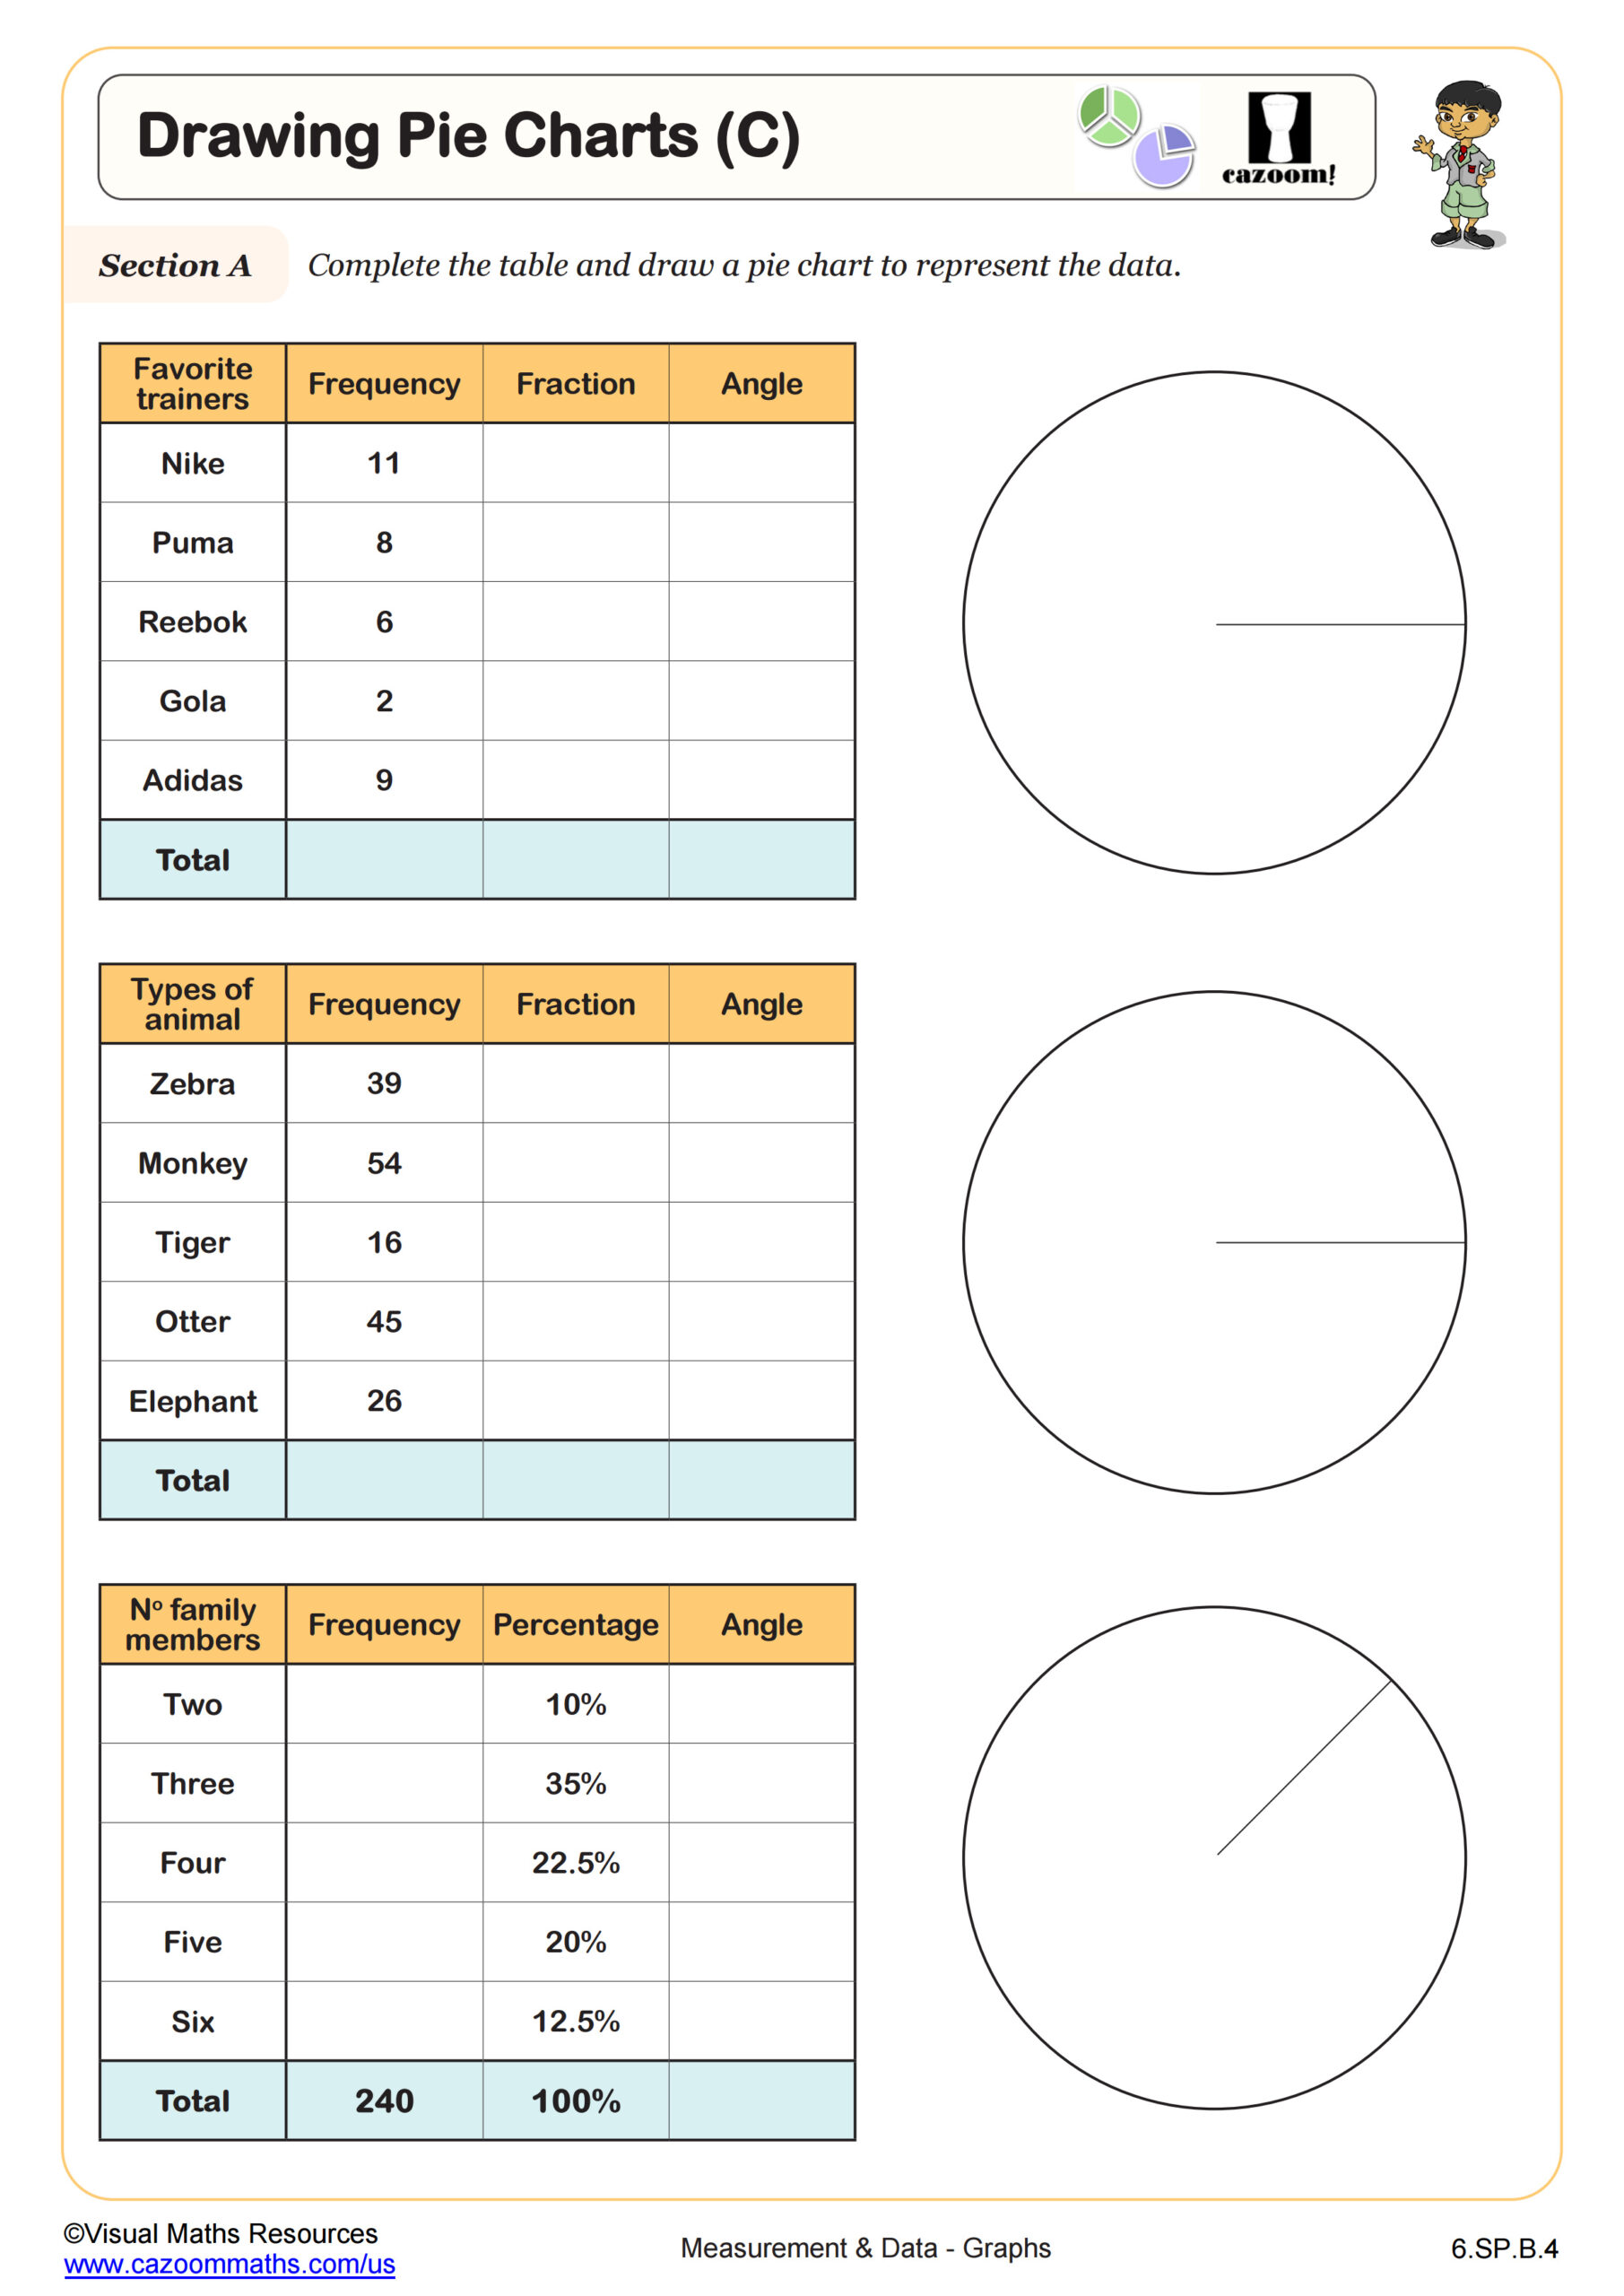
Drawing Pie Charts (C)
Grades: 6th Grade
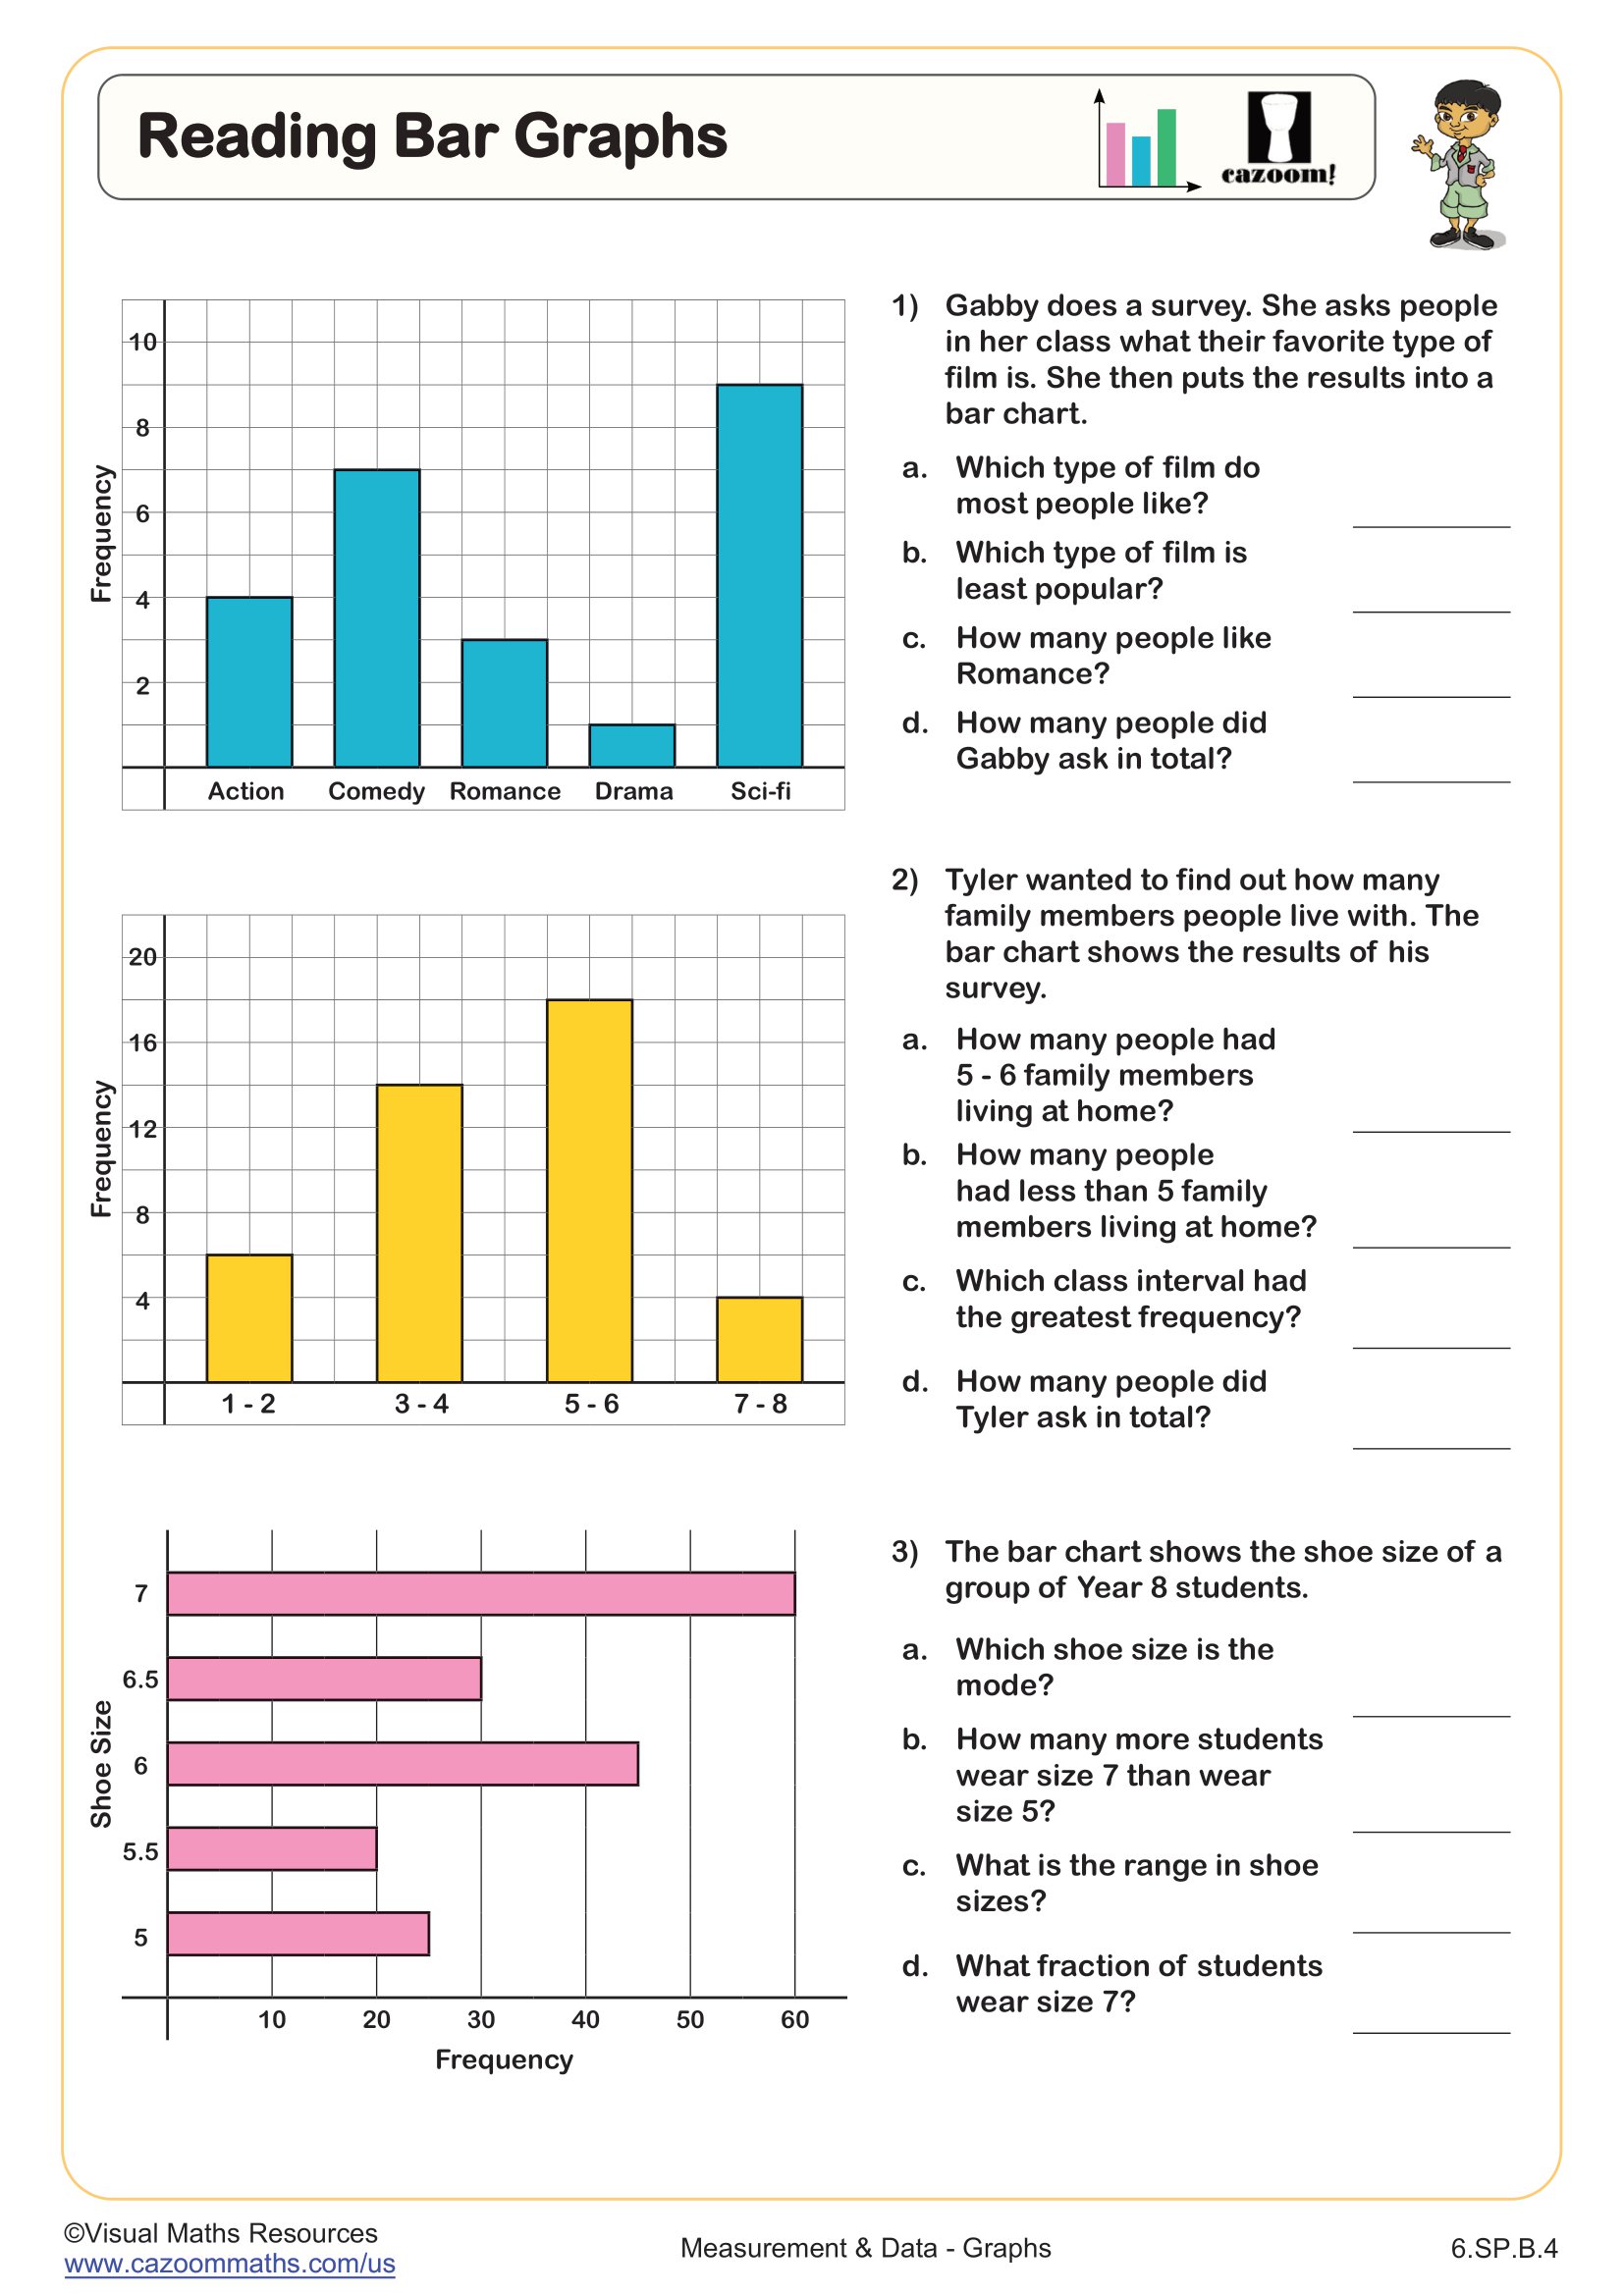
Reading Bar Graphs
Grades: 6th Grade
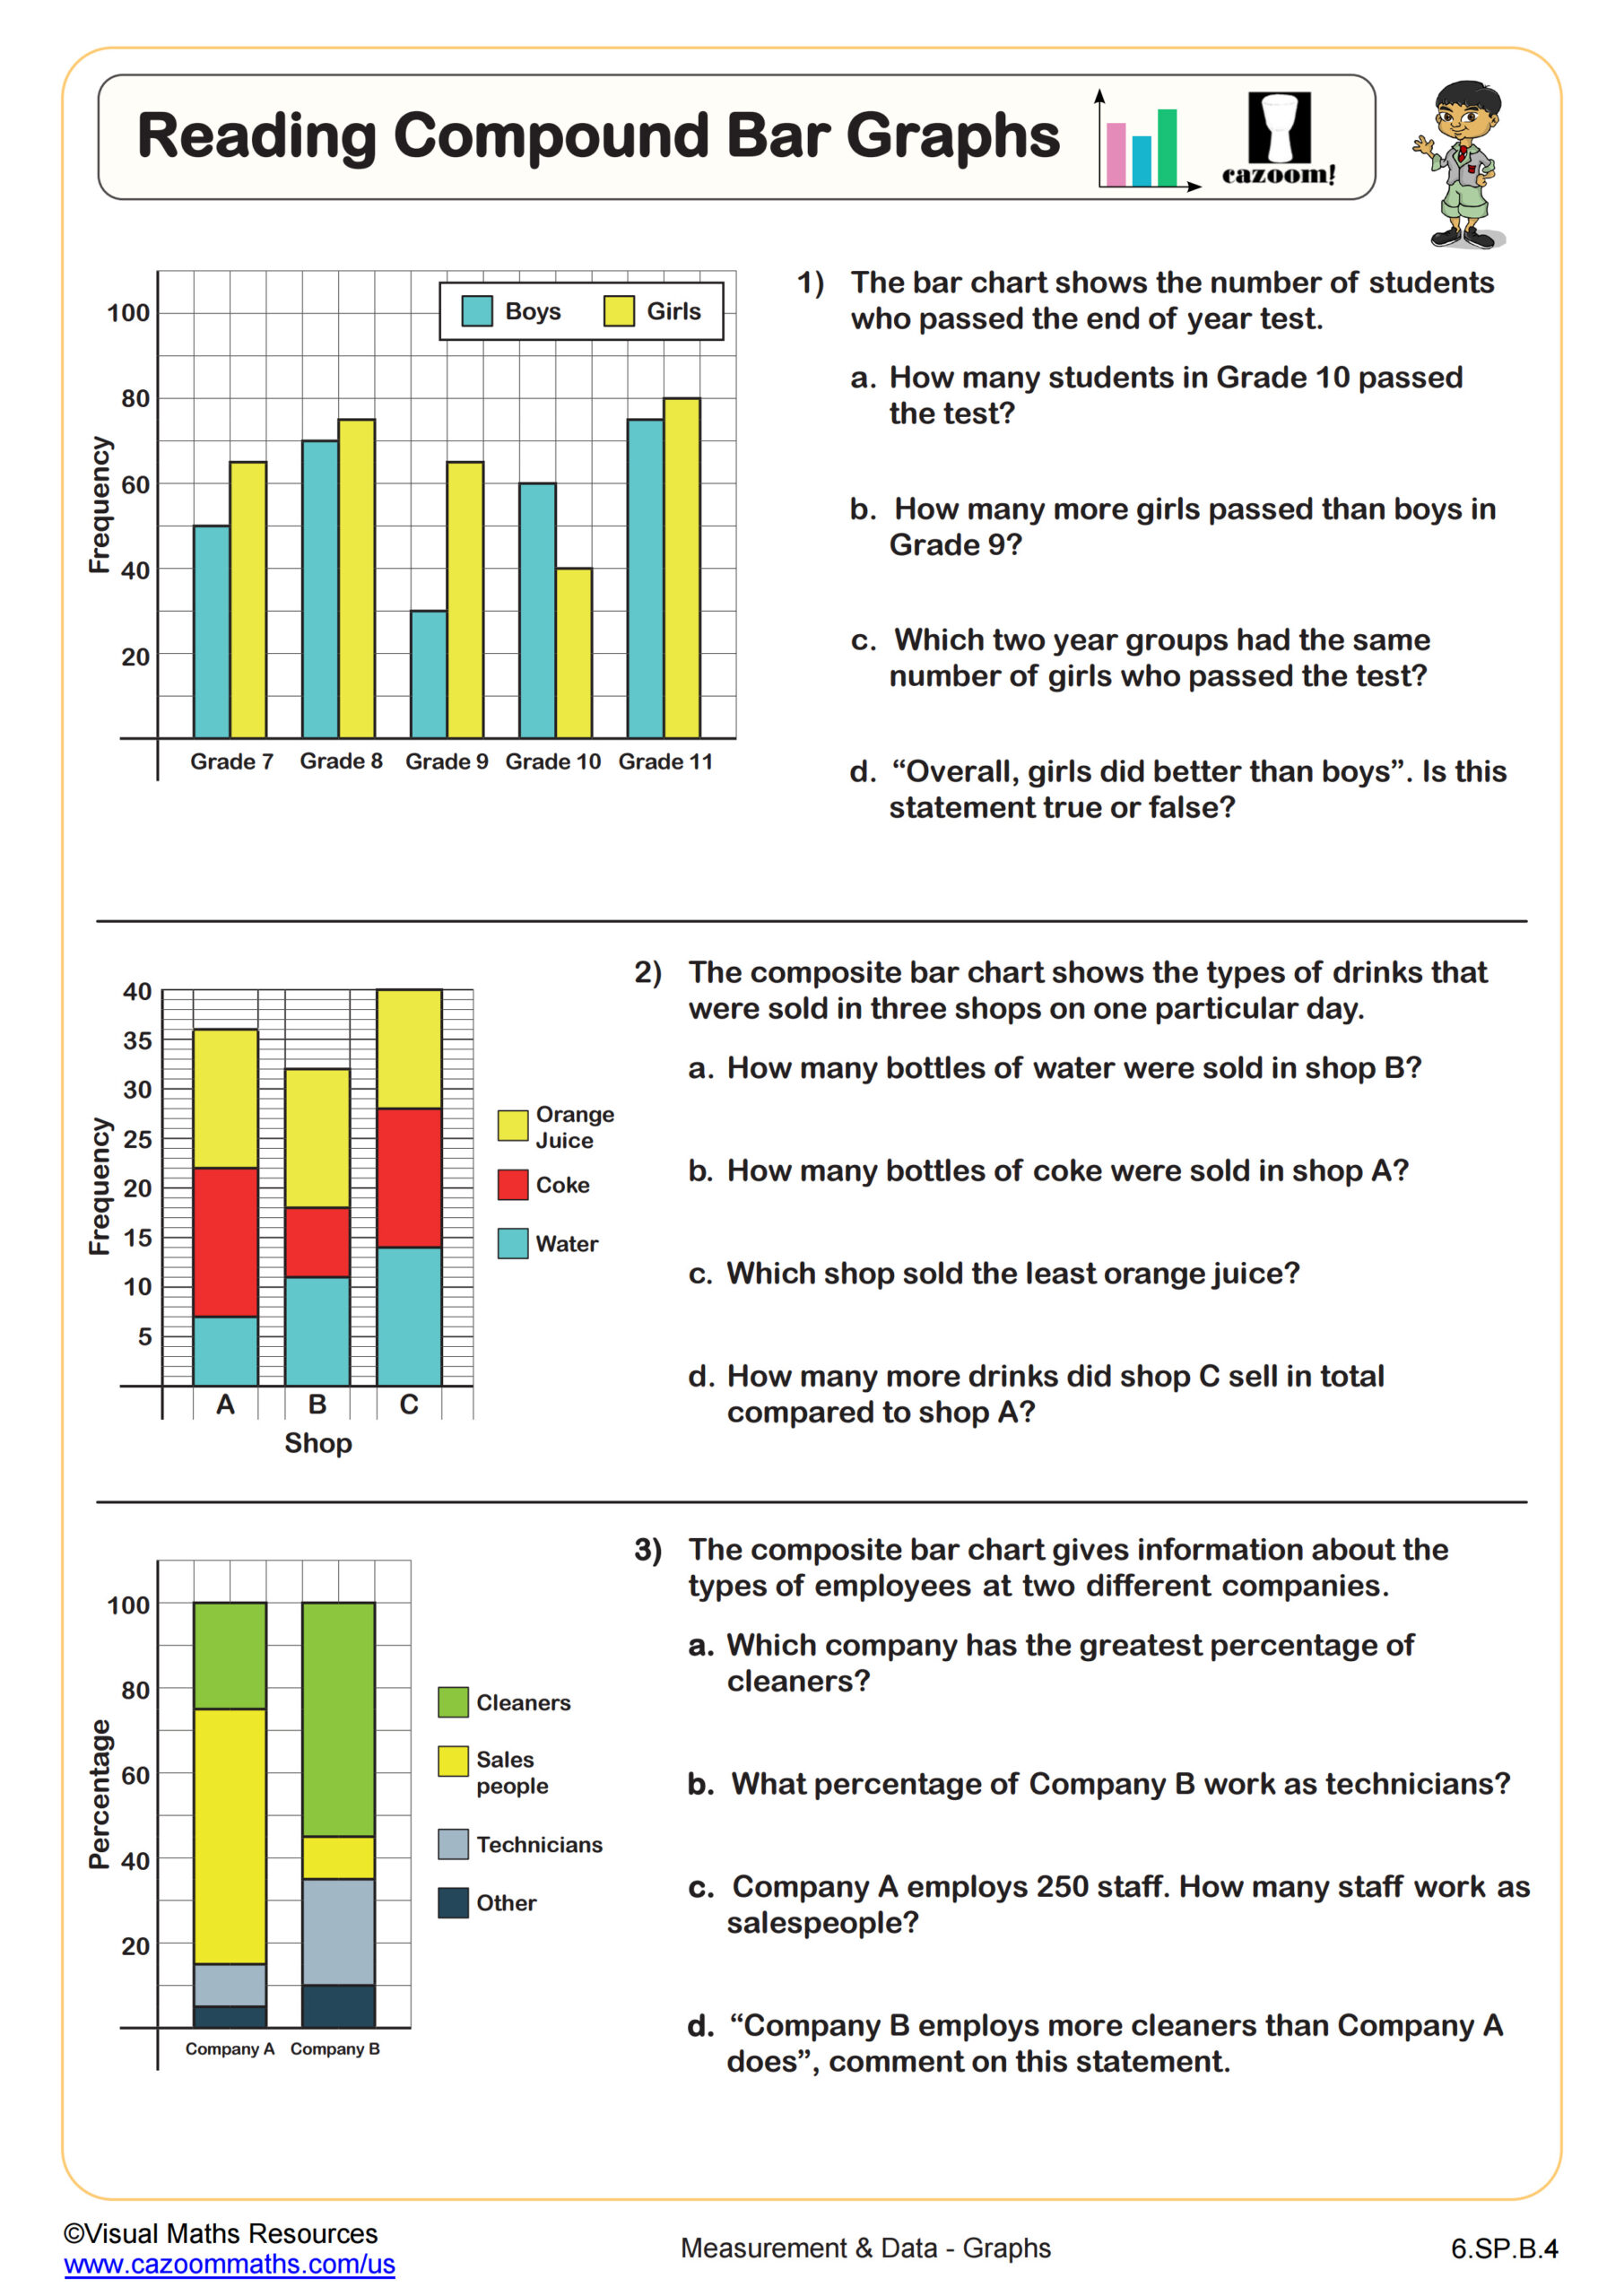
Reading Compound Bar Graphs
Grades: 6th Grade
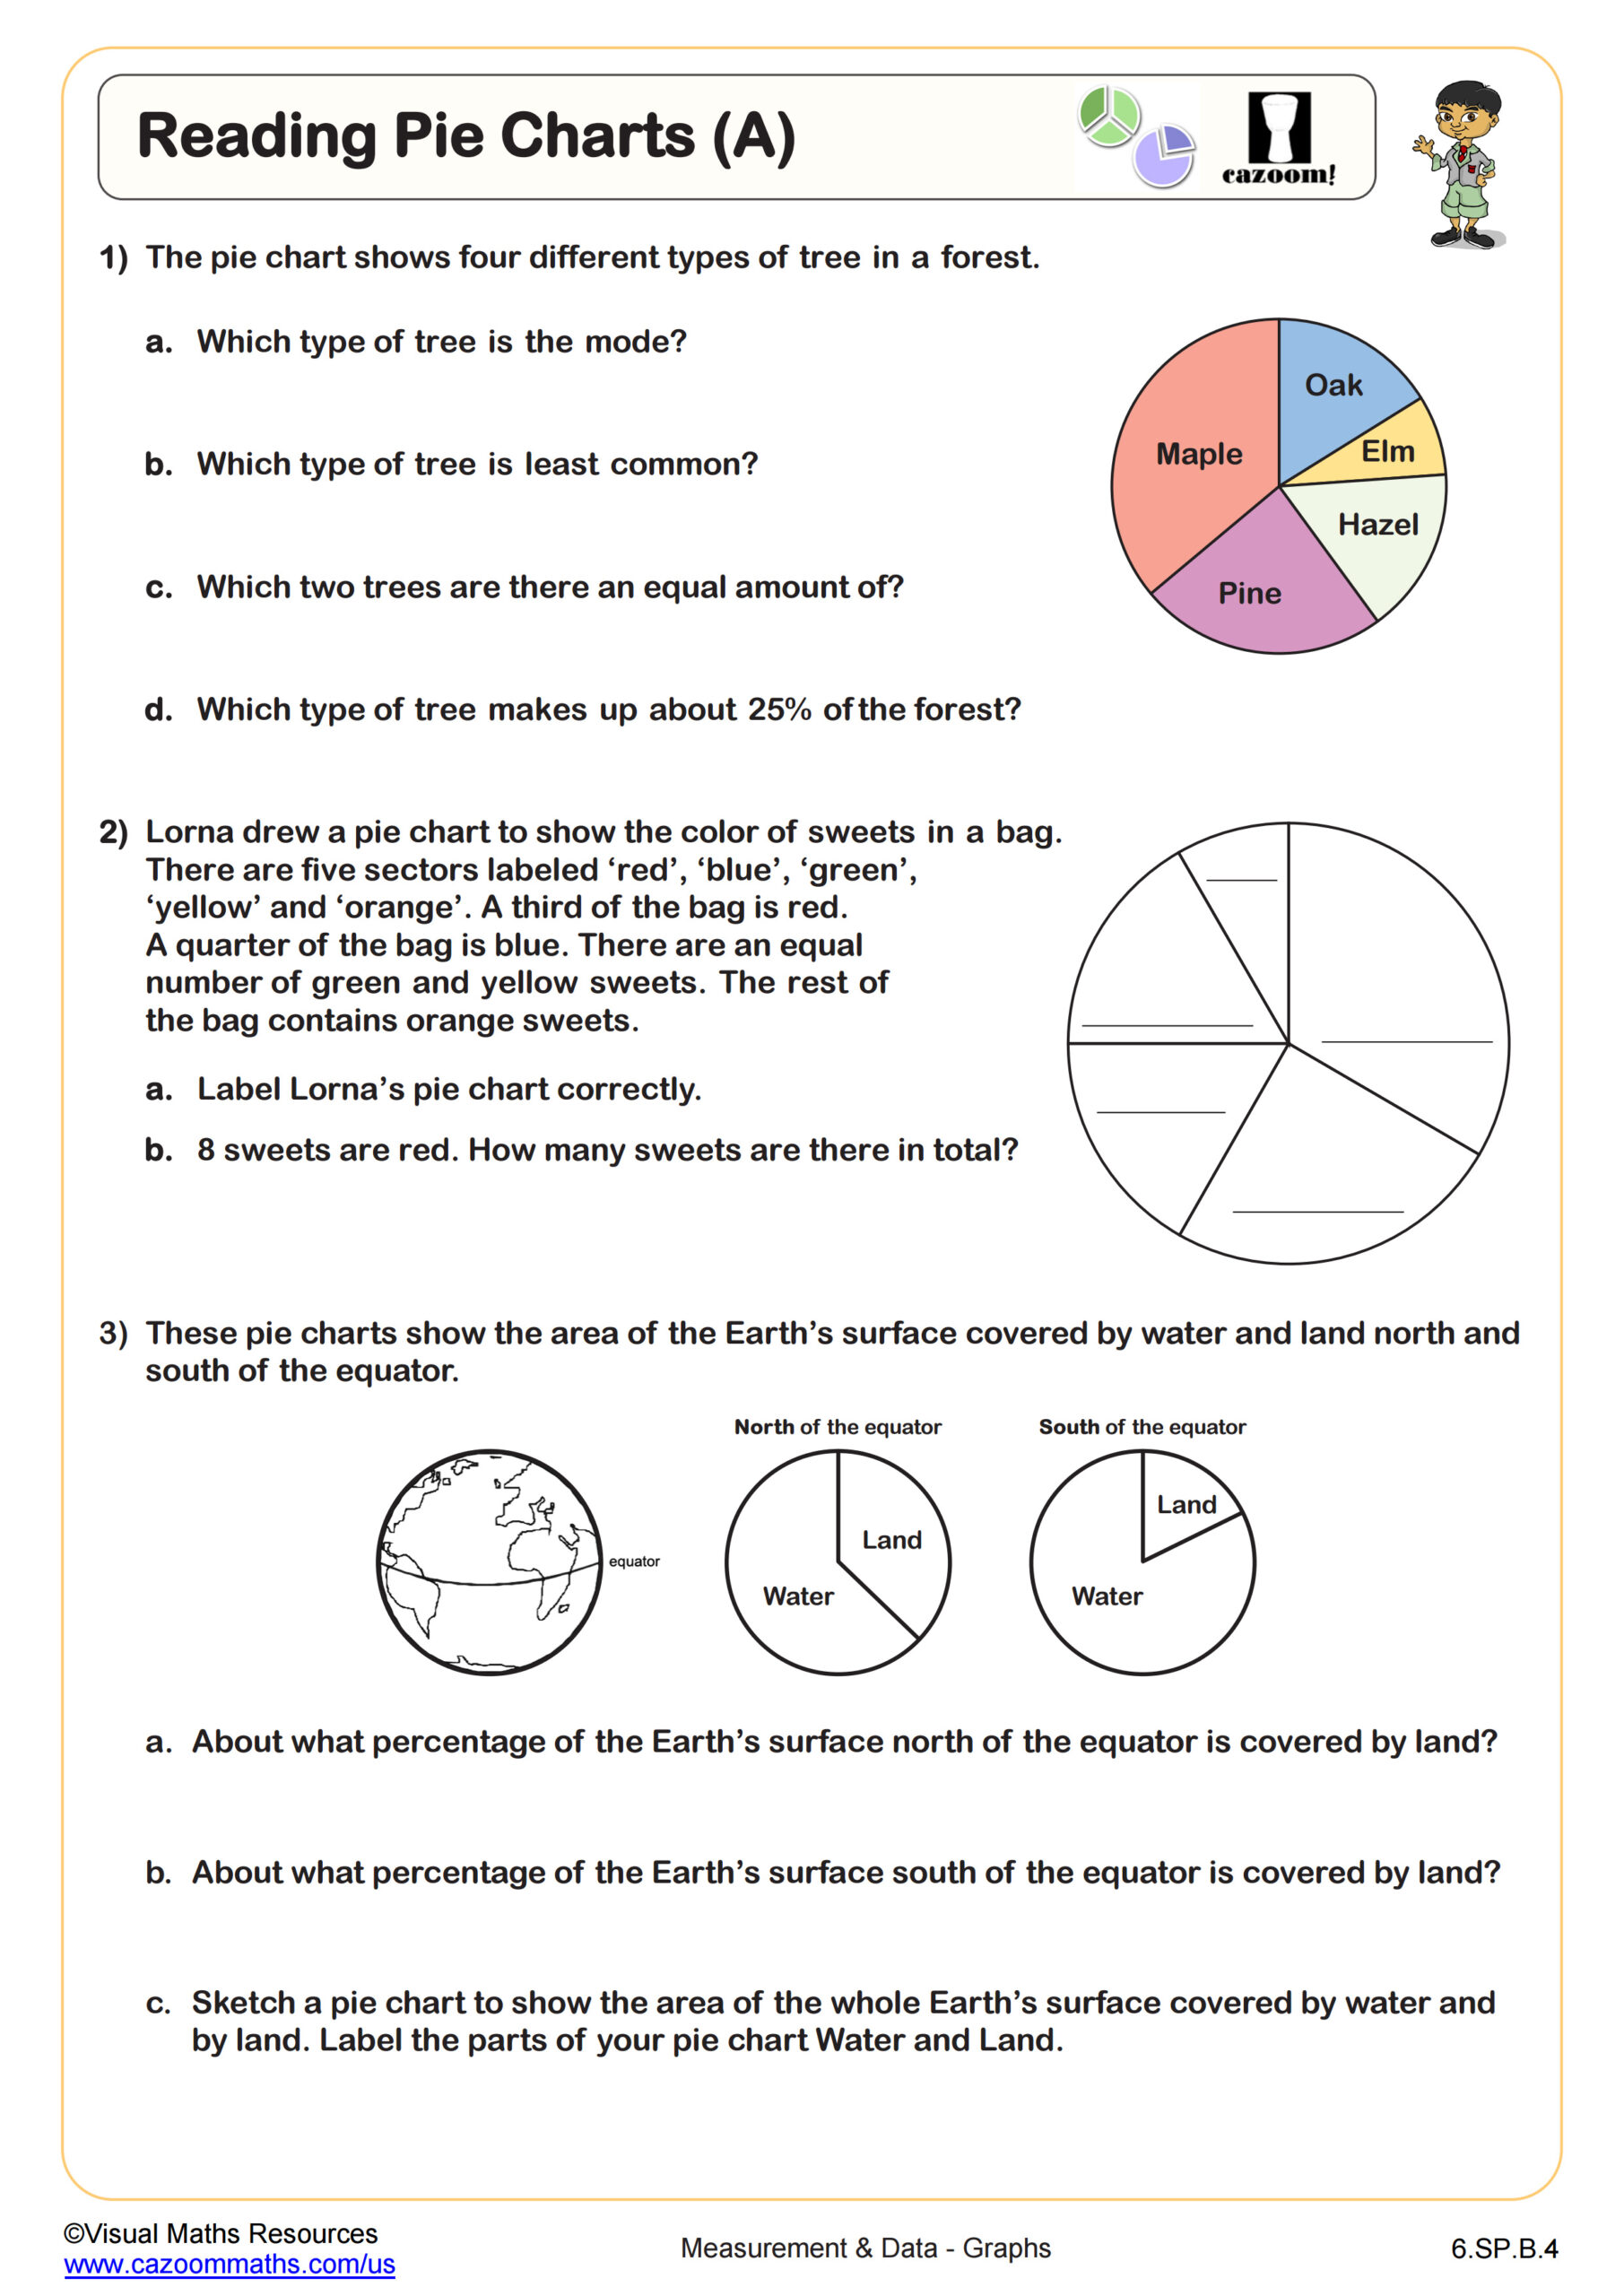
Reading Pie Charts (A)
Grades: 6th Grade
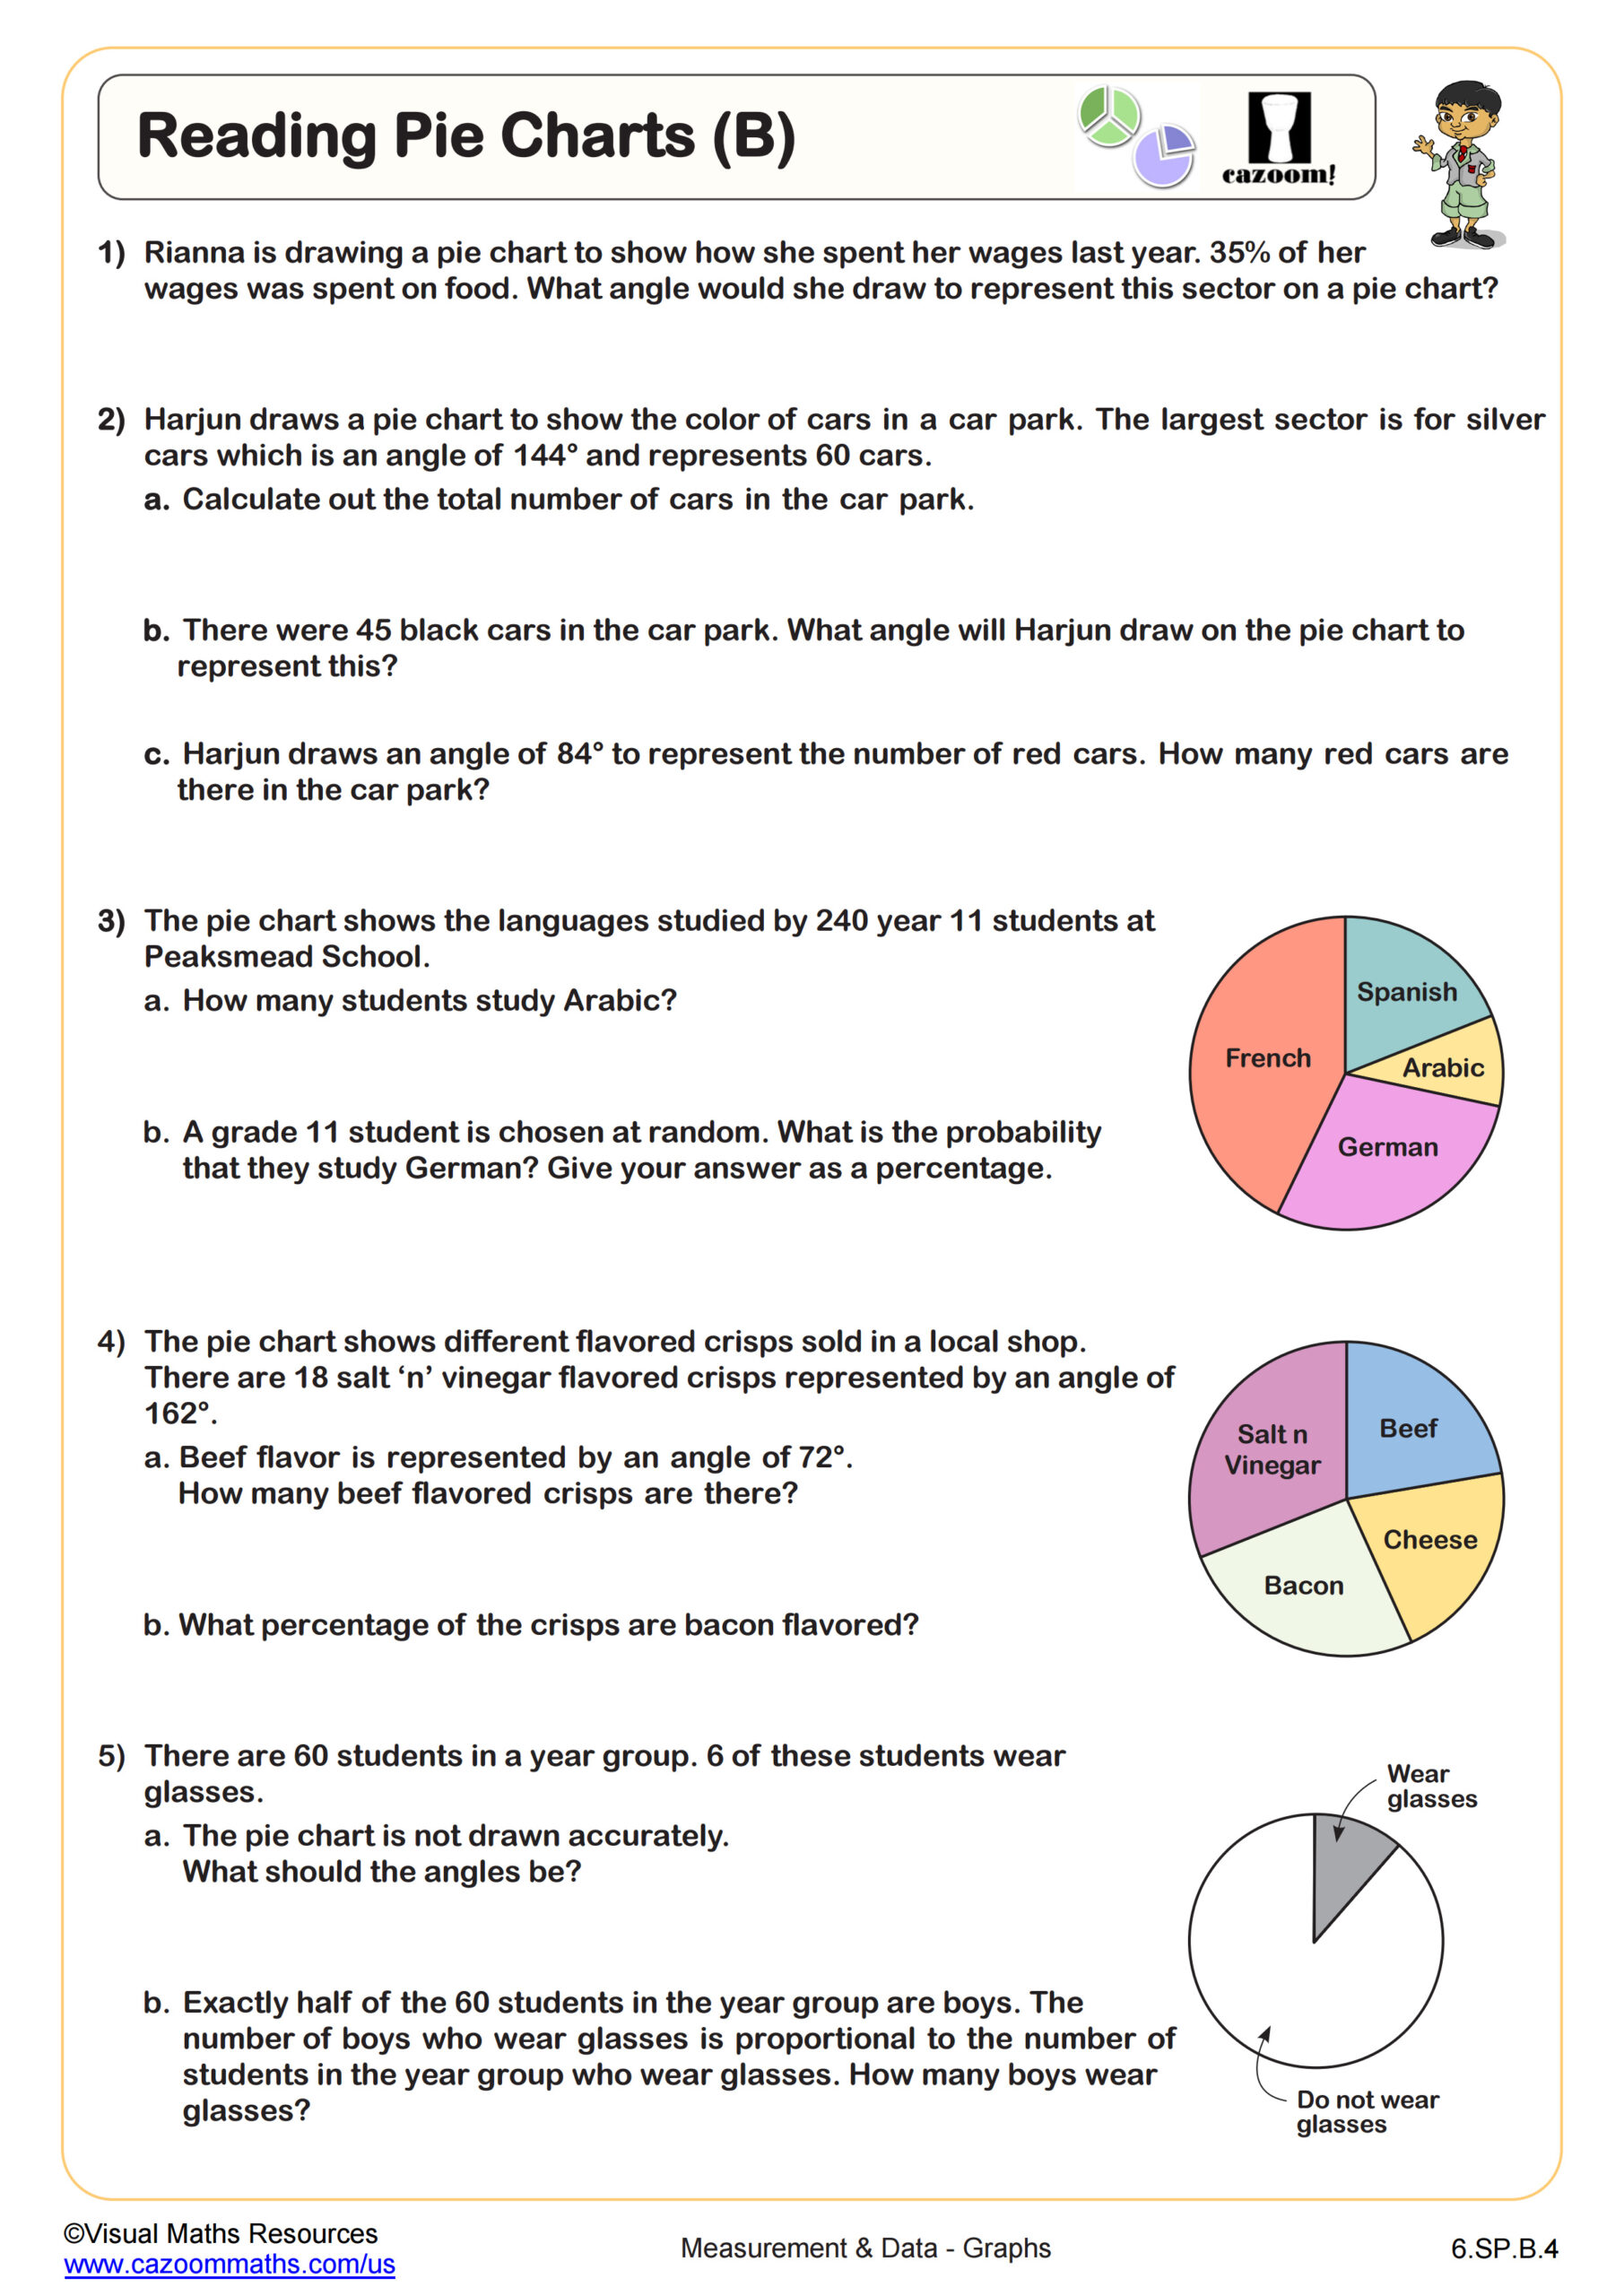
Reading Pie Charts (B)
Grades: 6th Grade
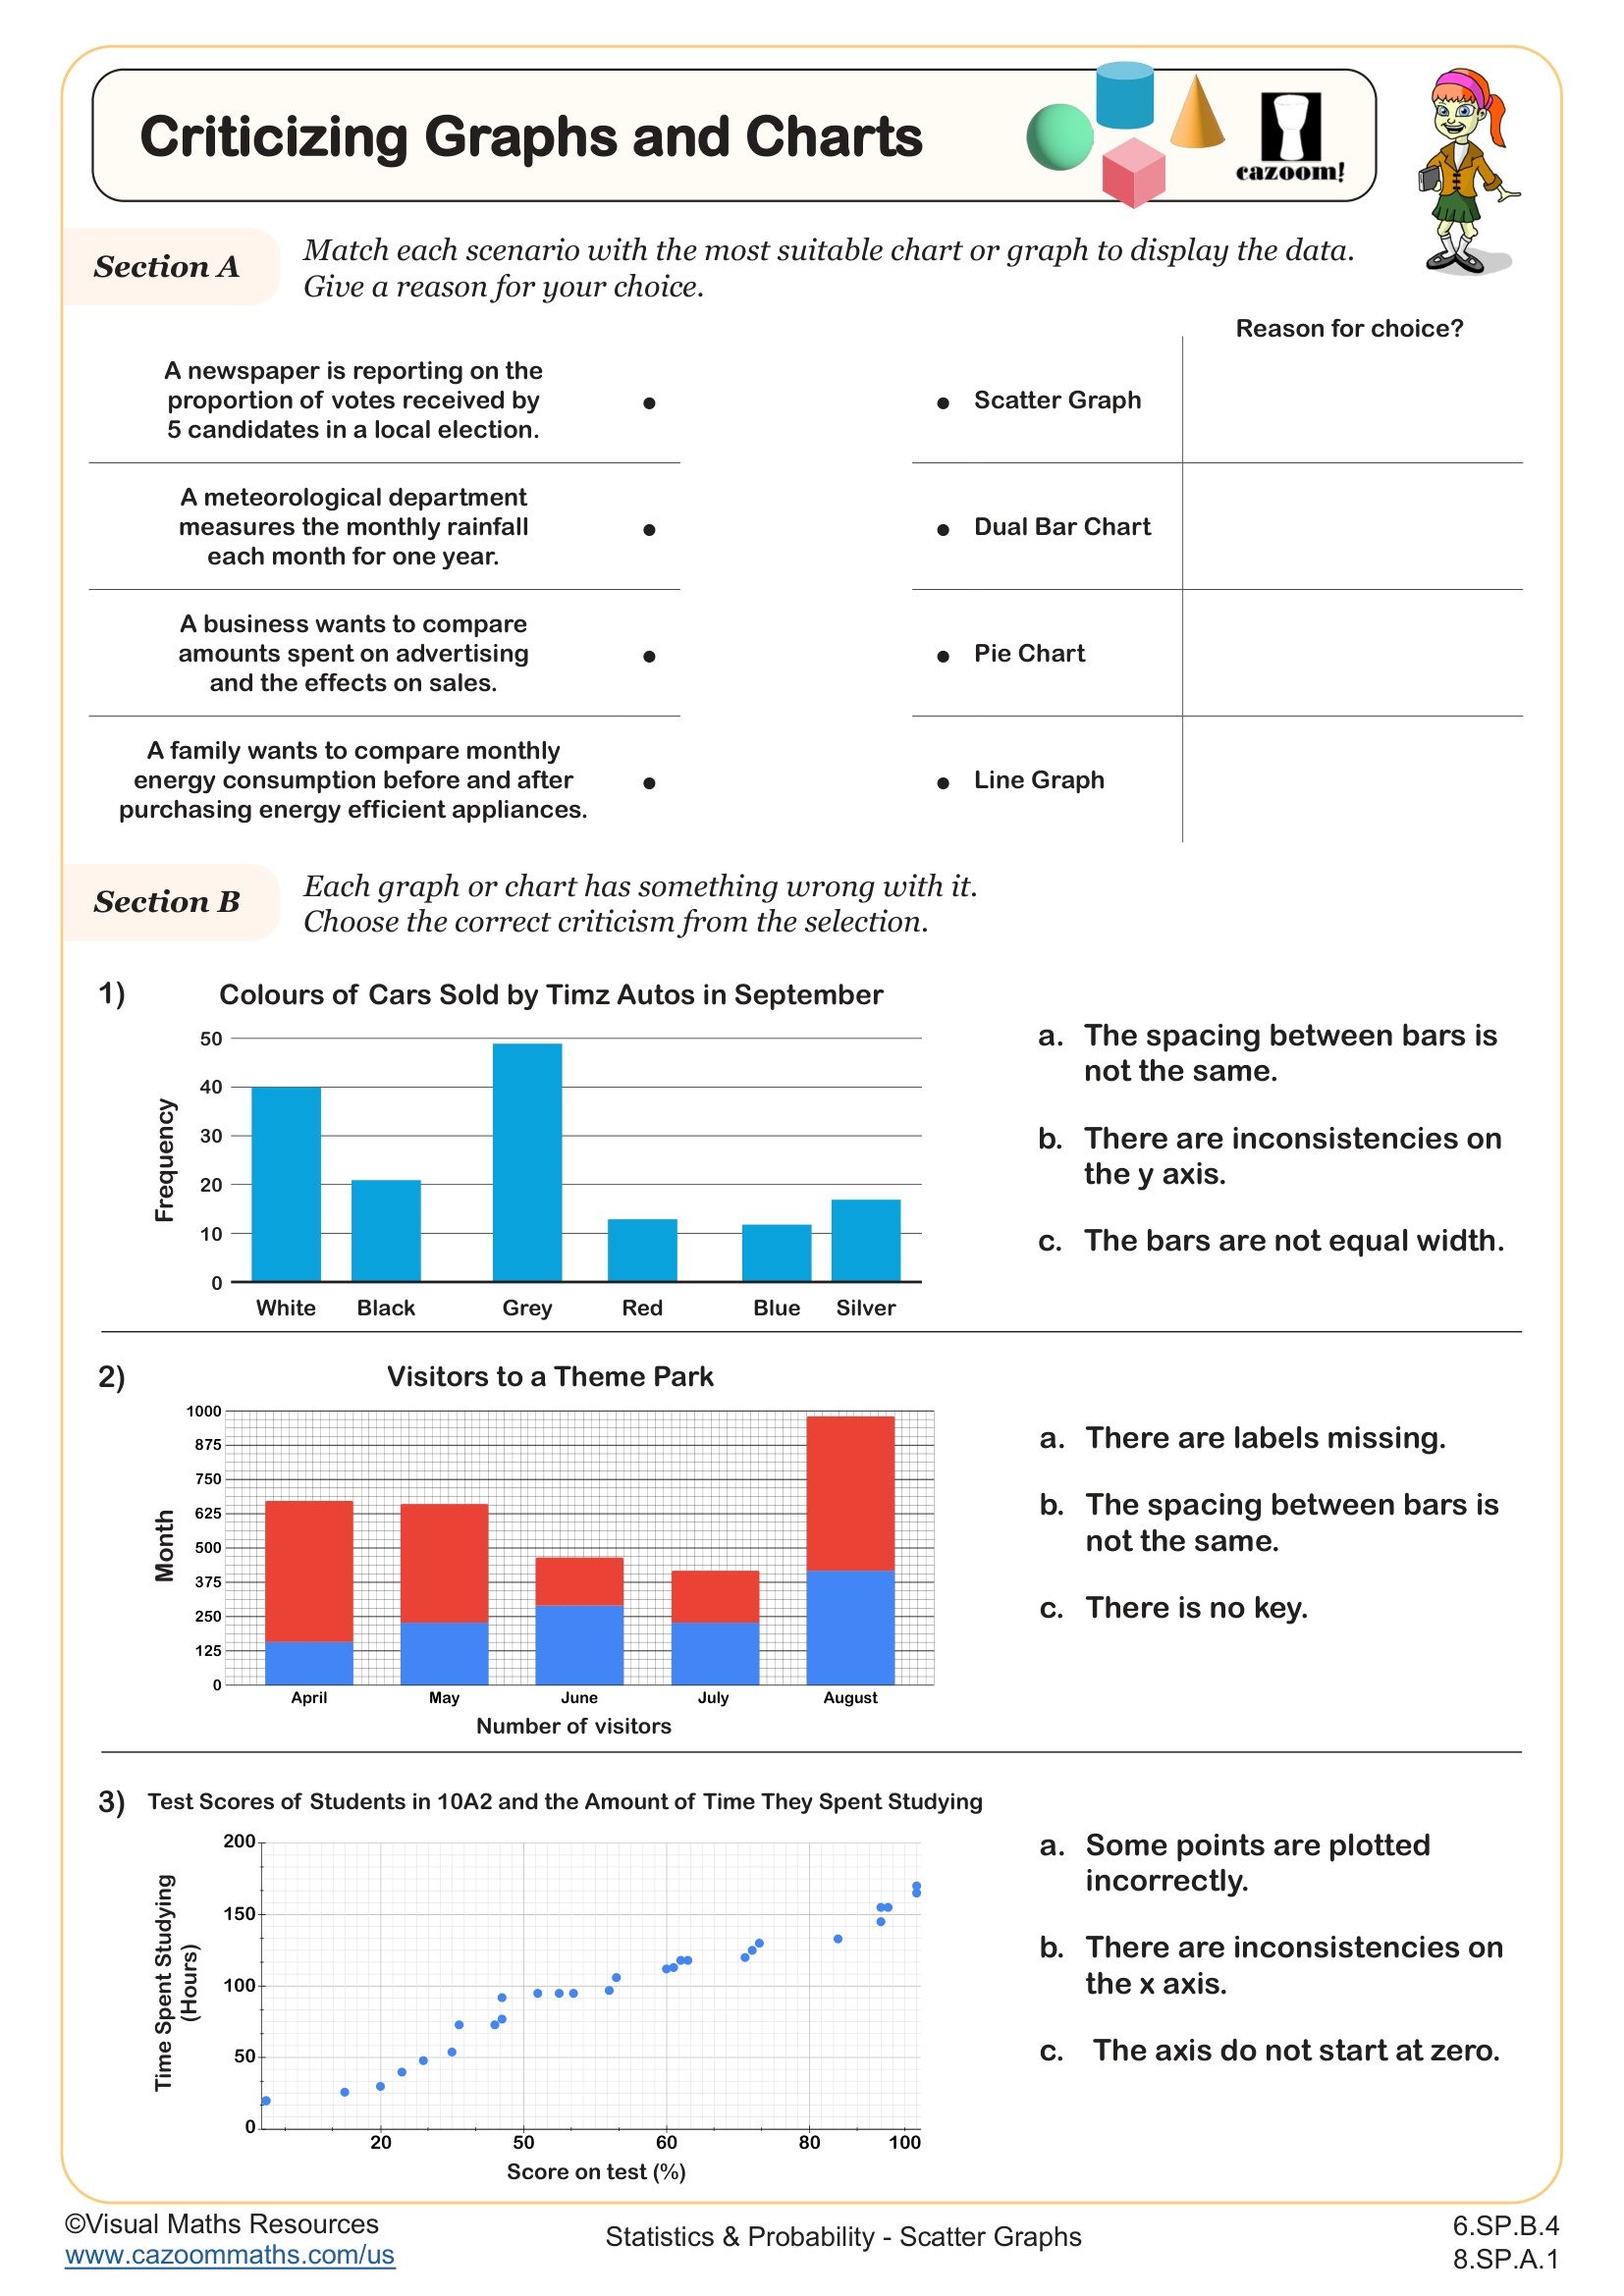
Criticising Graphs and Charts
Grades: 7th Grade, 8th Grade
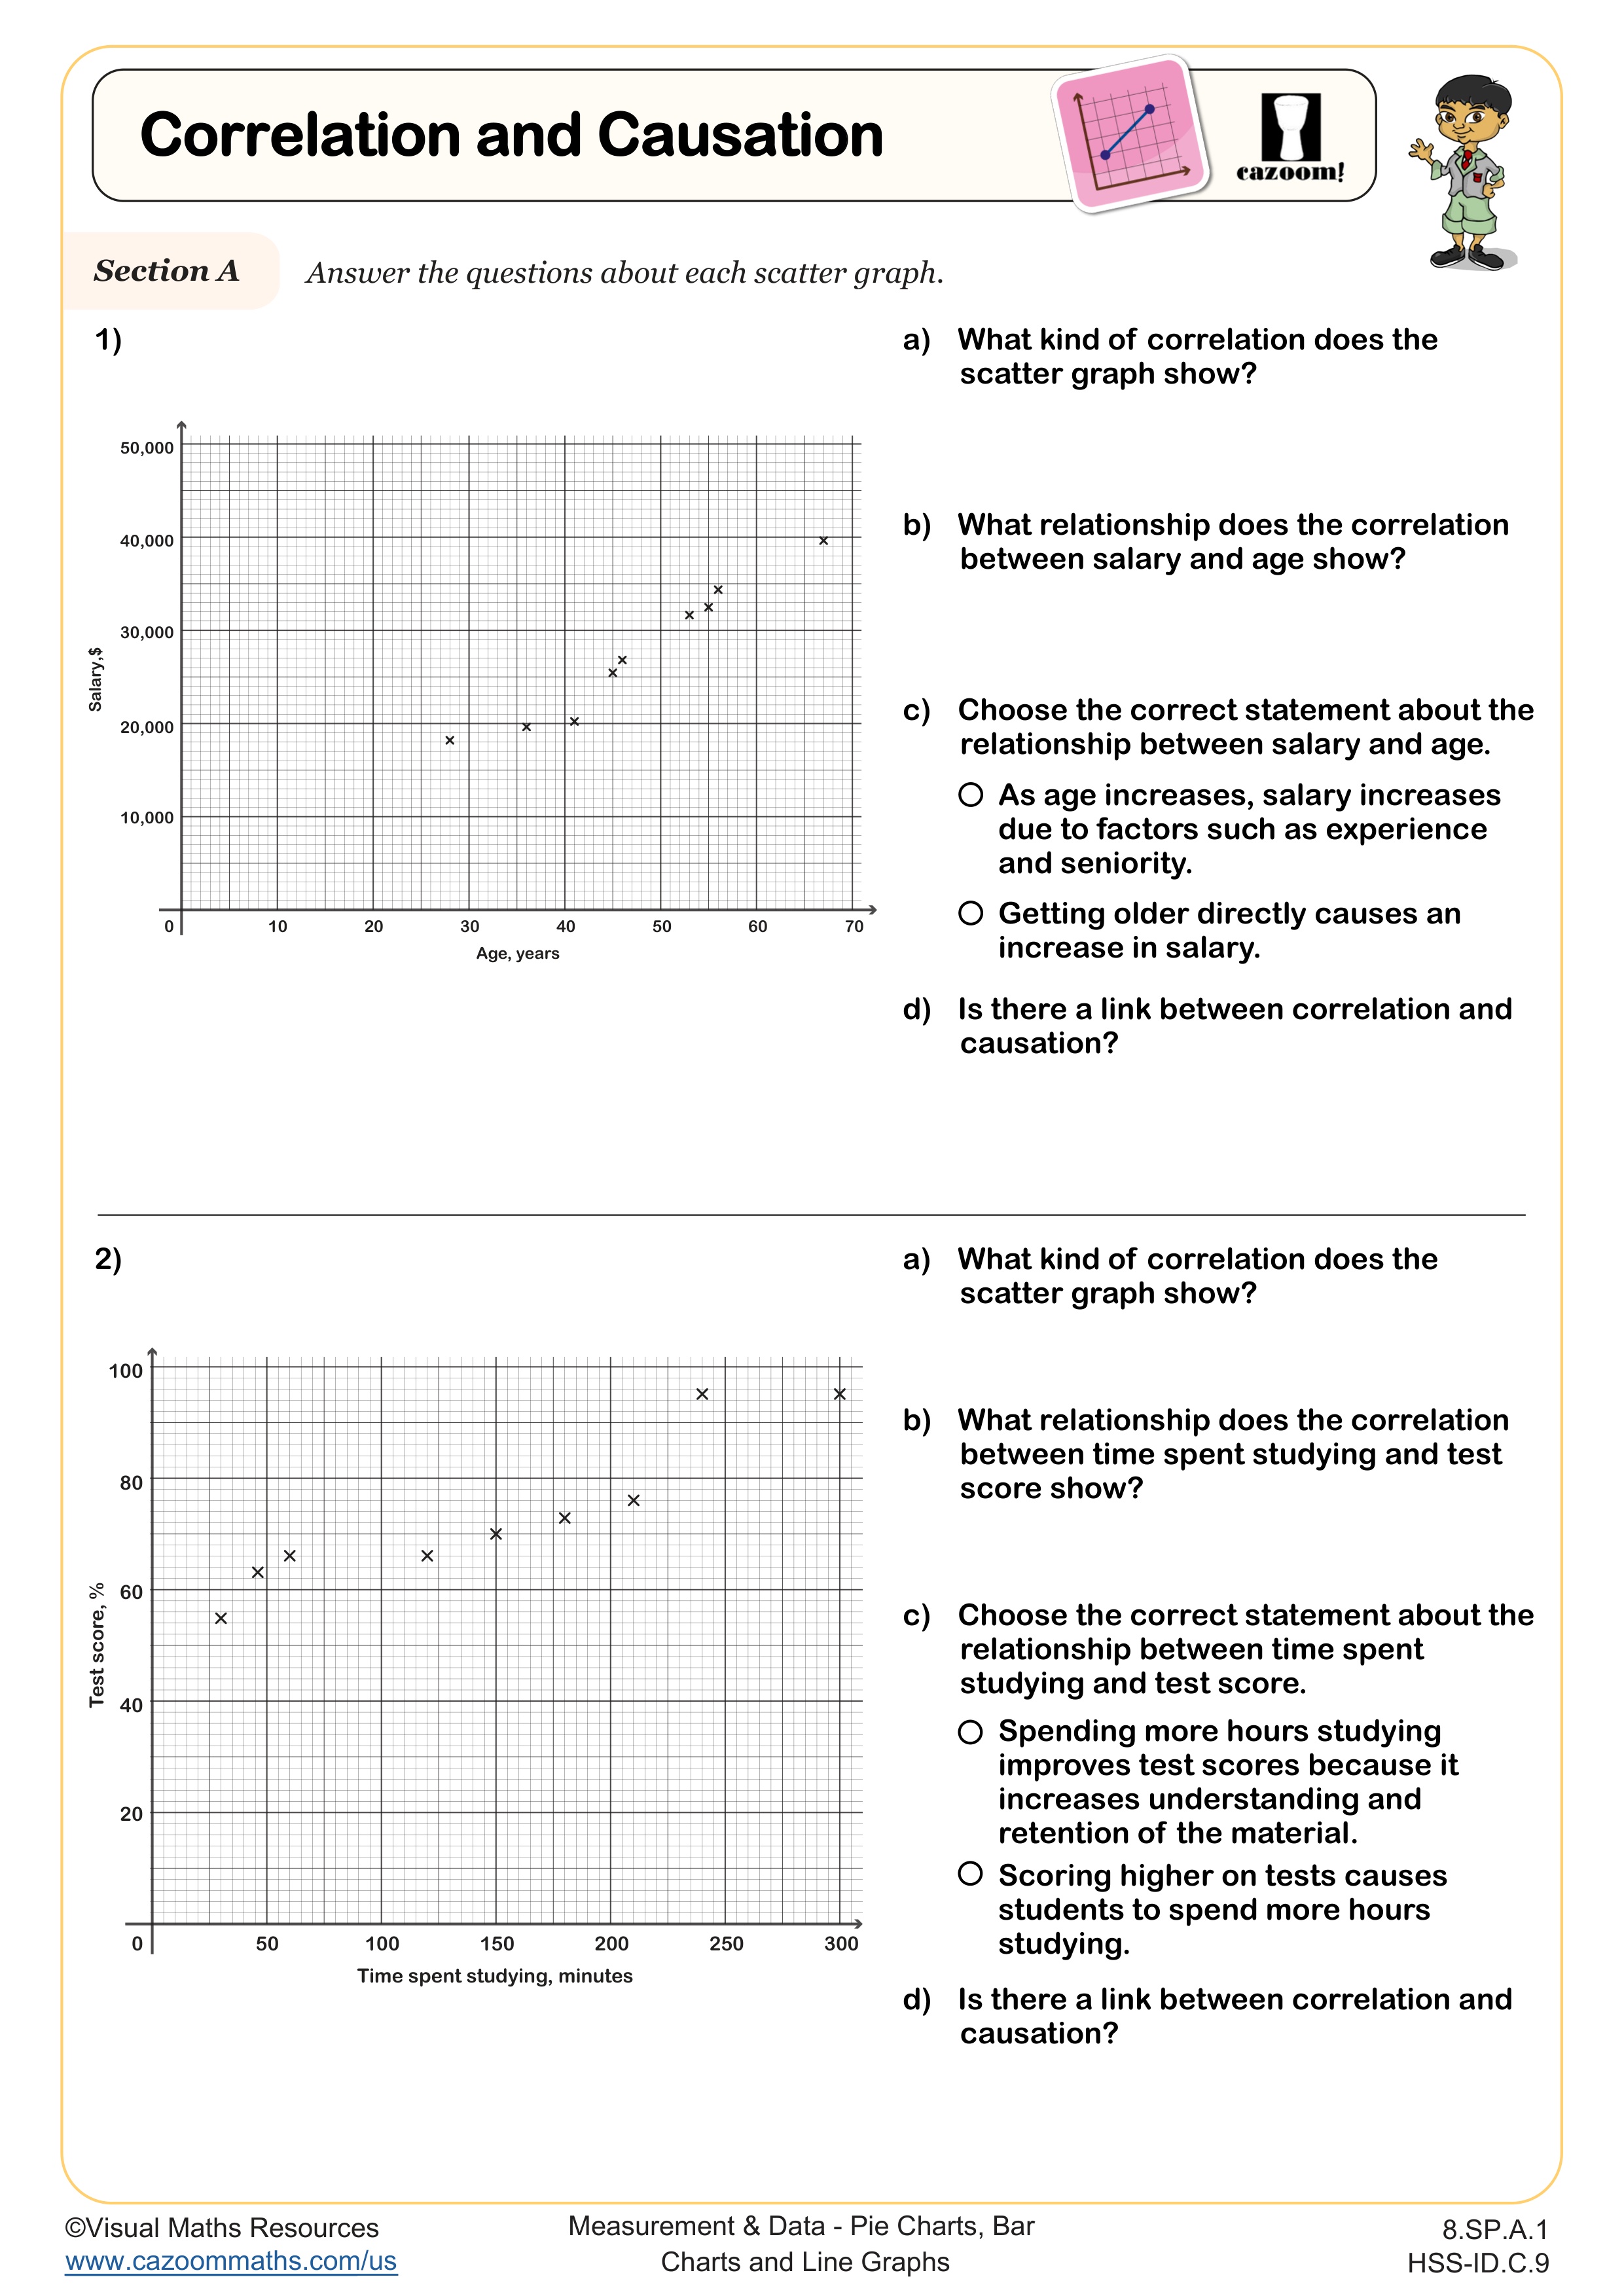
Correlation and Causation
Grades: 8th Grade, IM 1
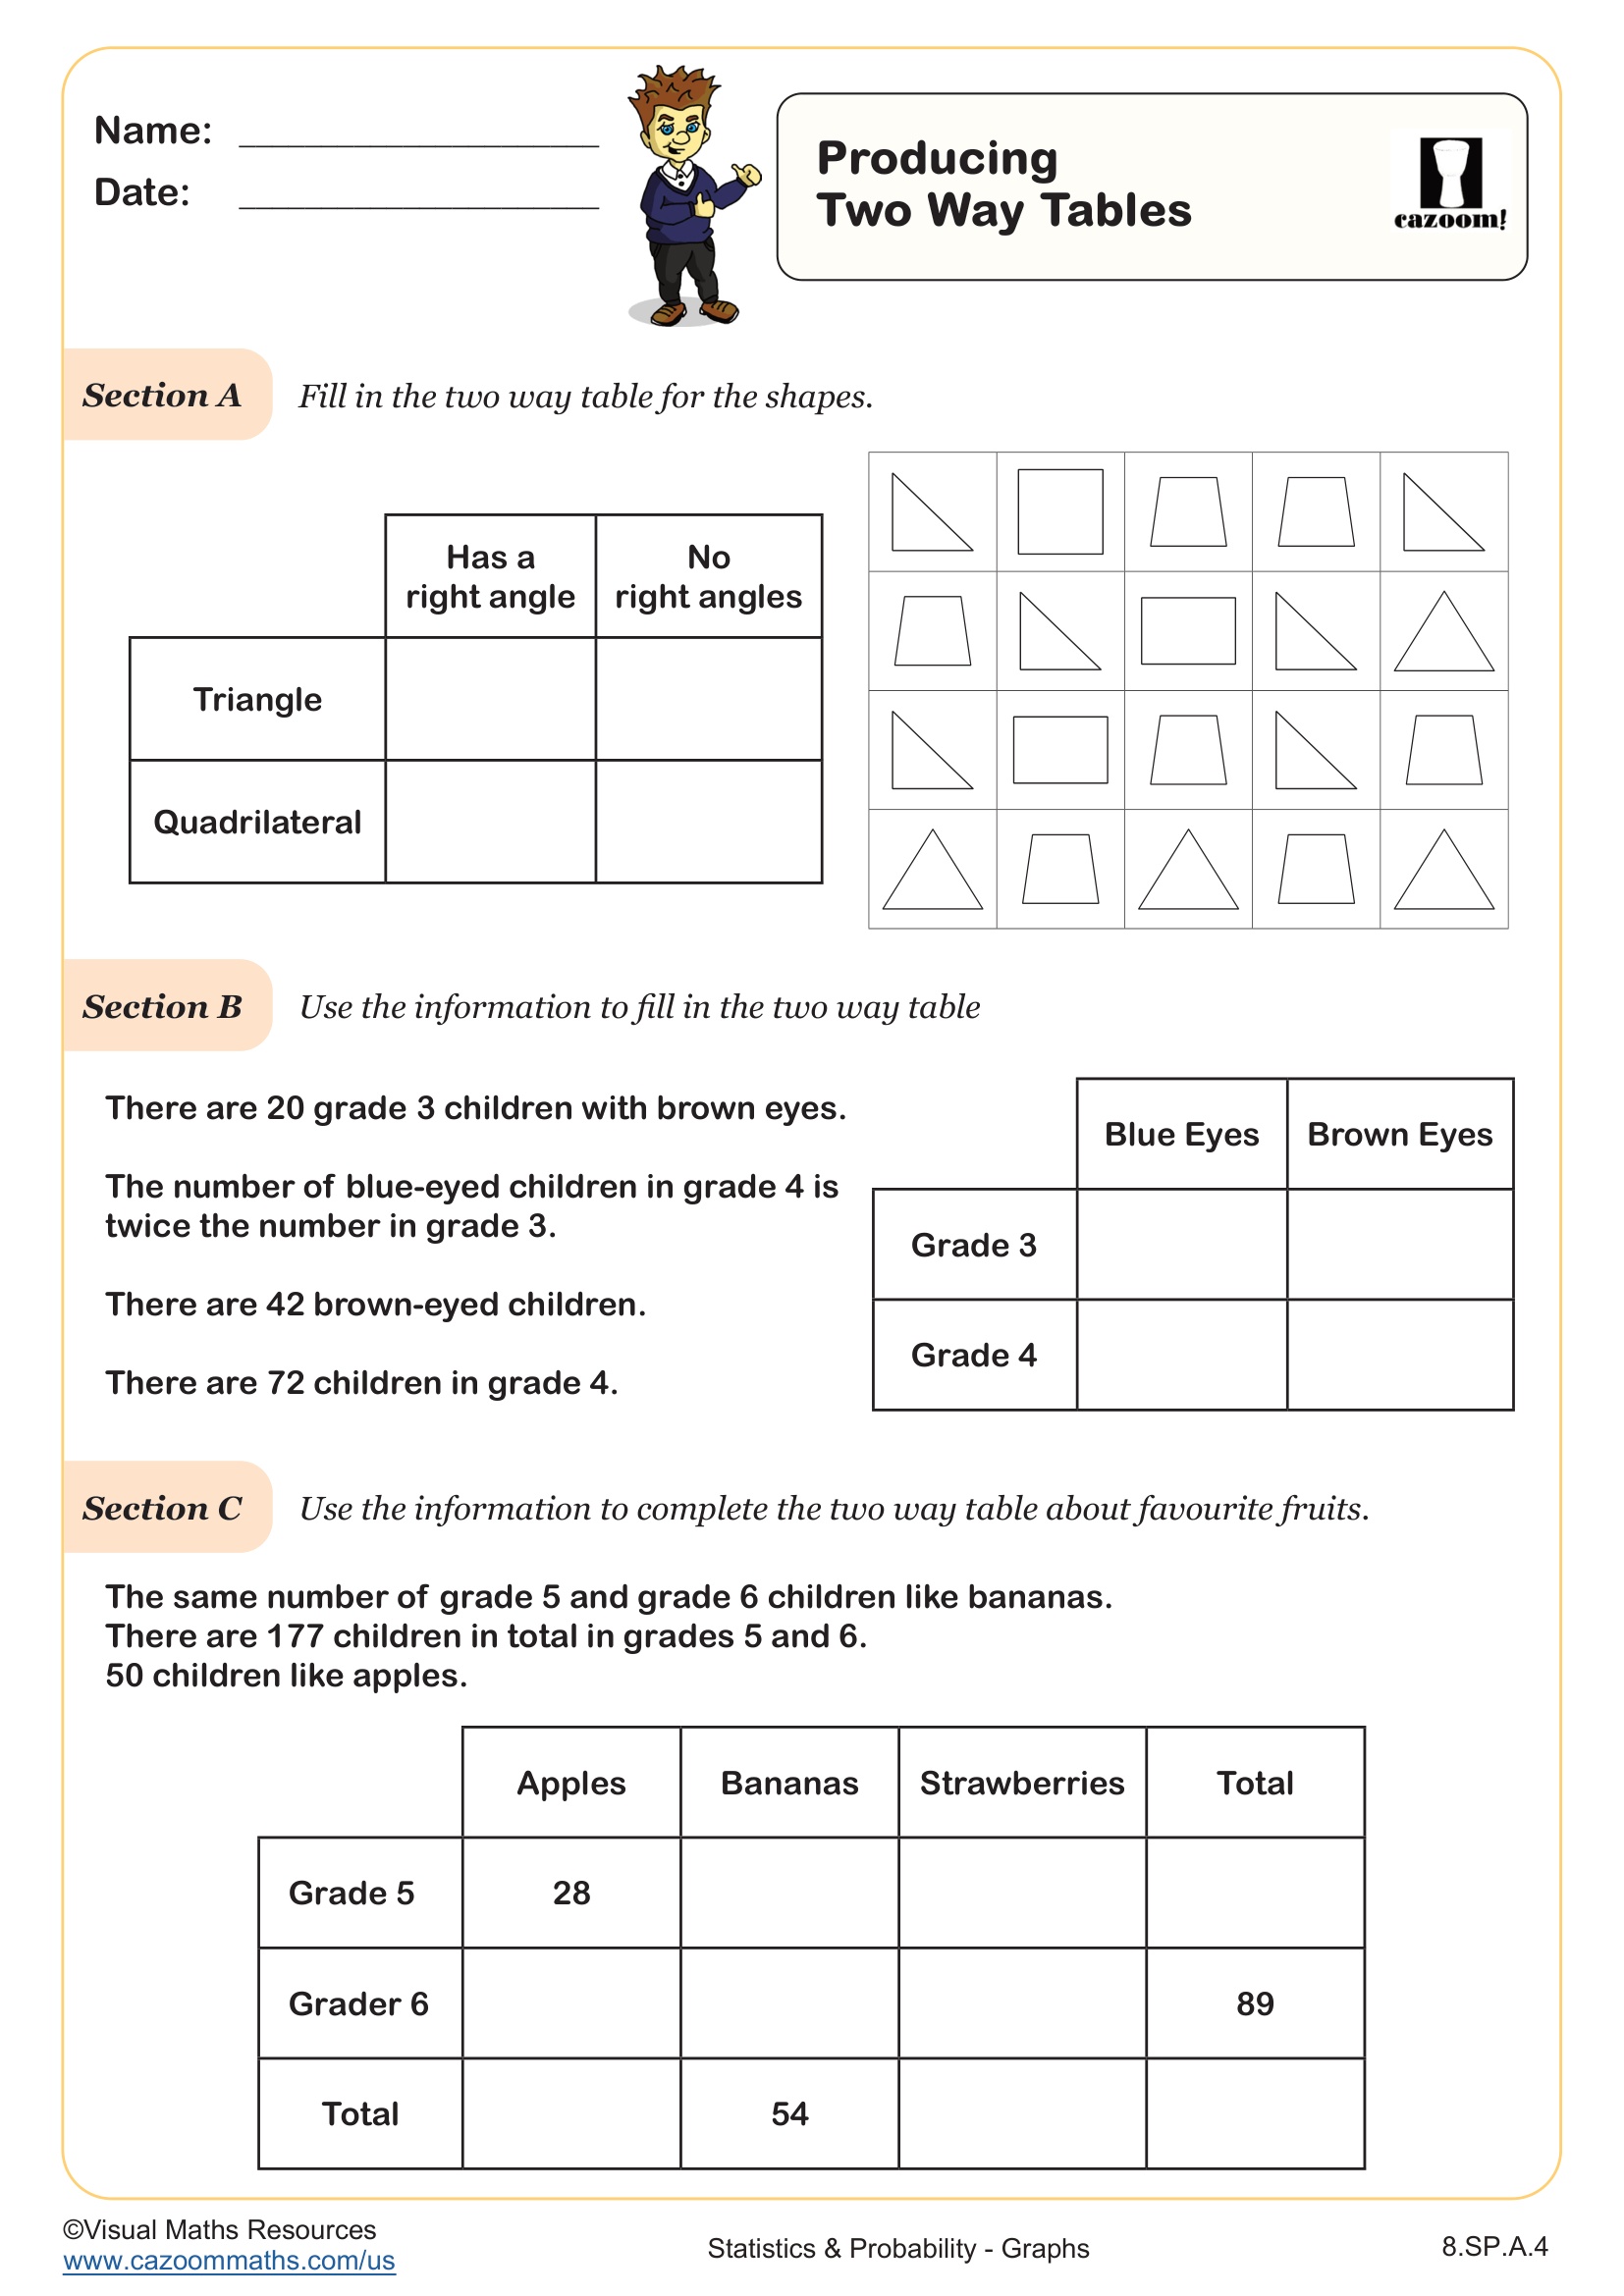
Producing Two Way Tables
Grades: 8th Grade
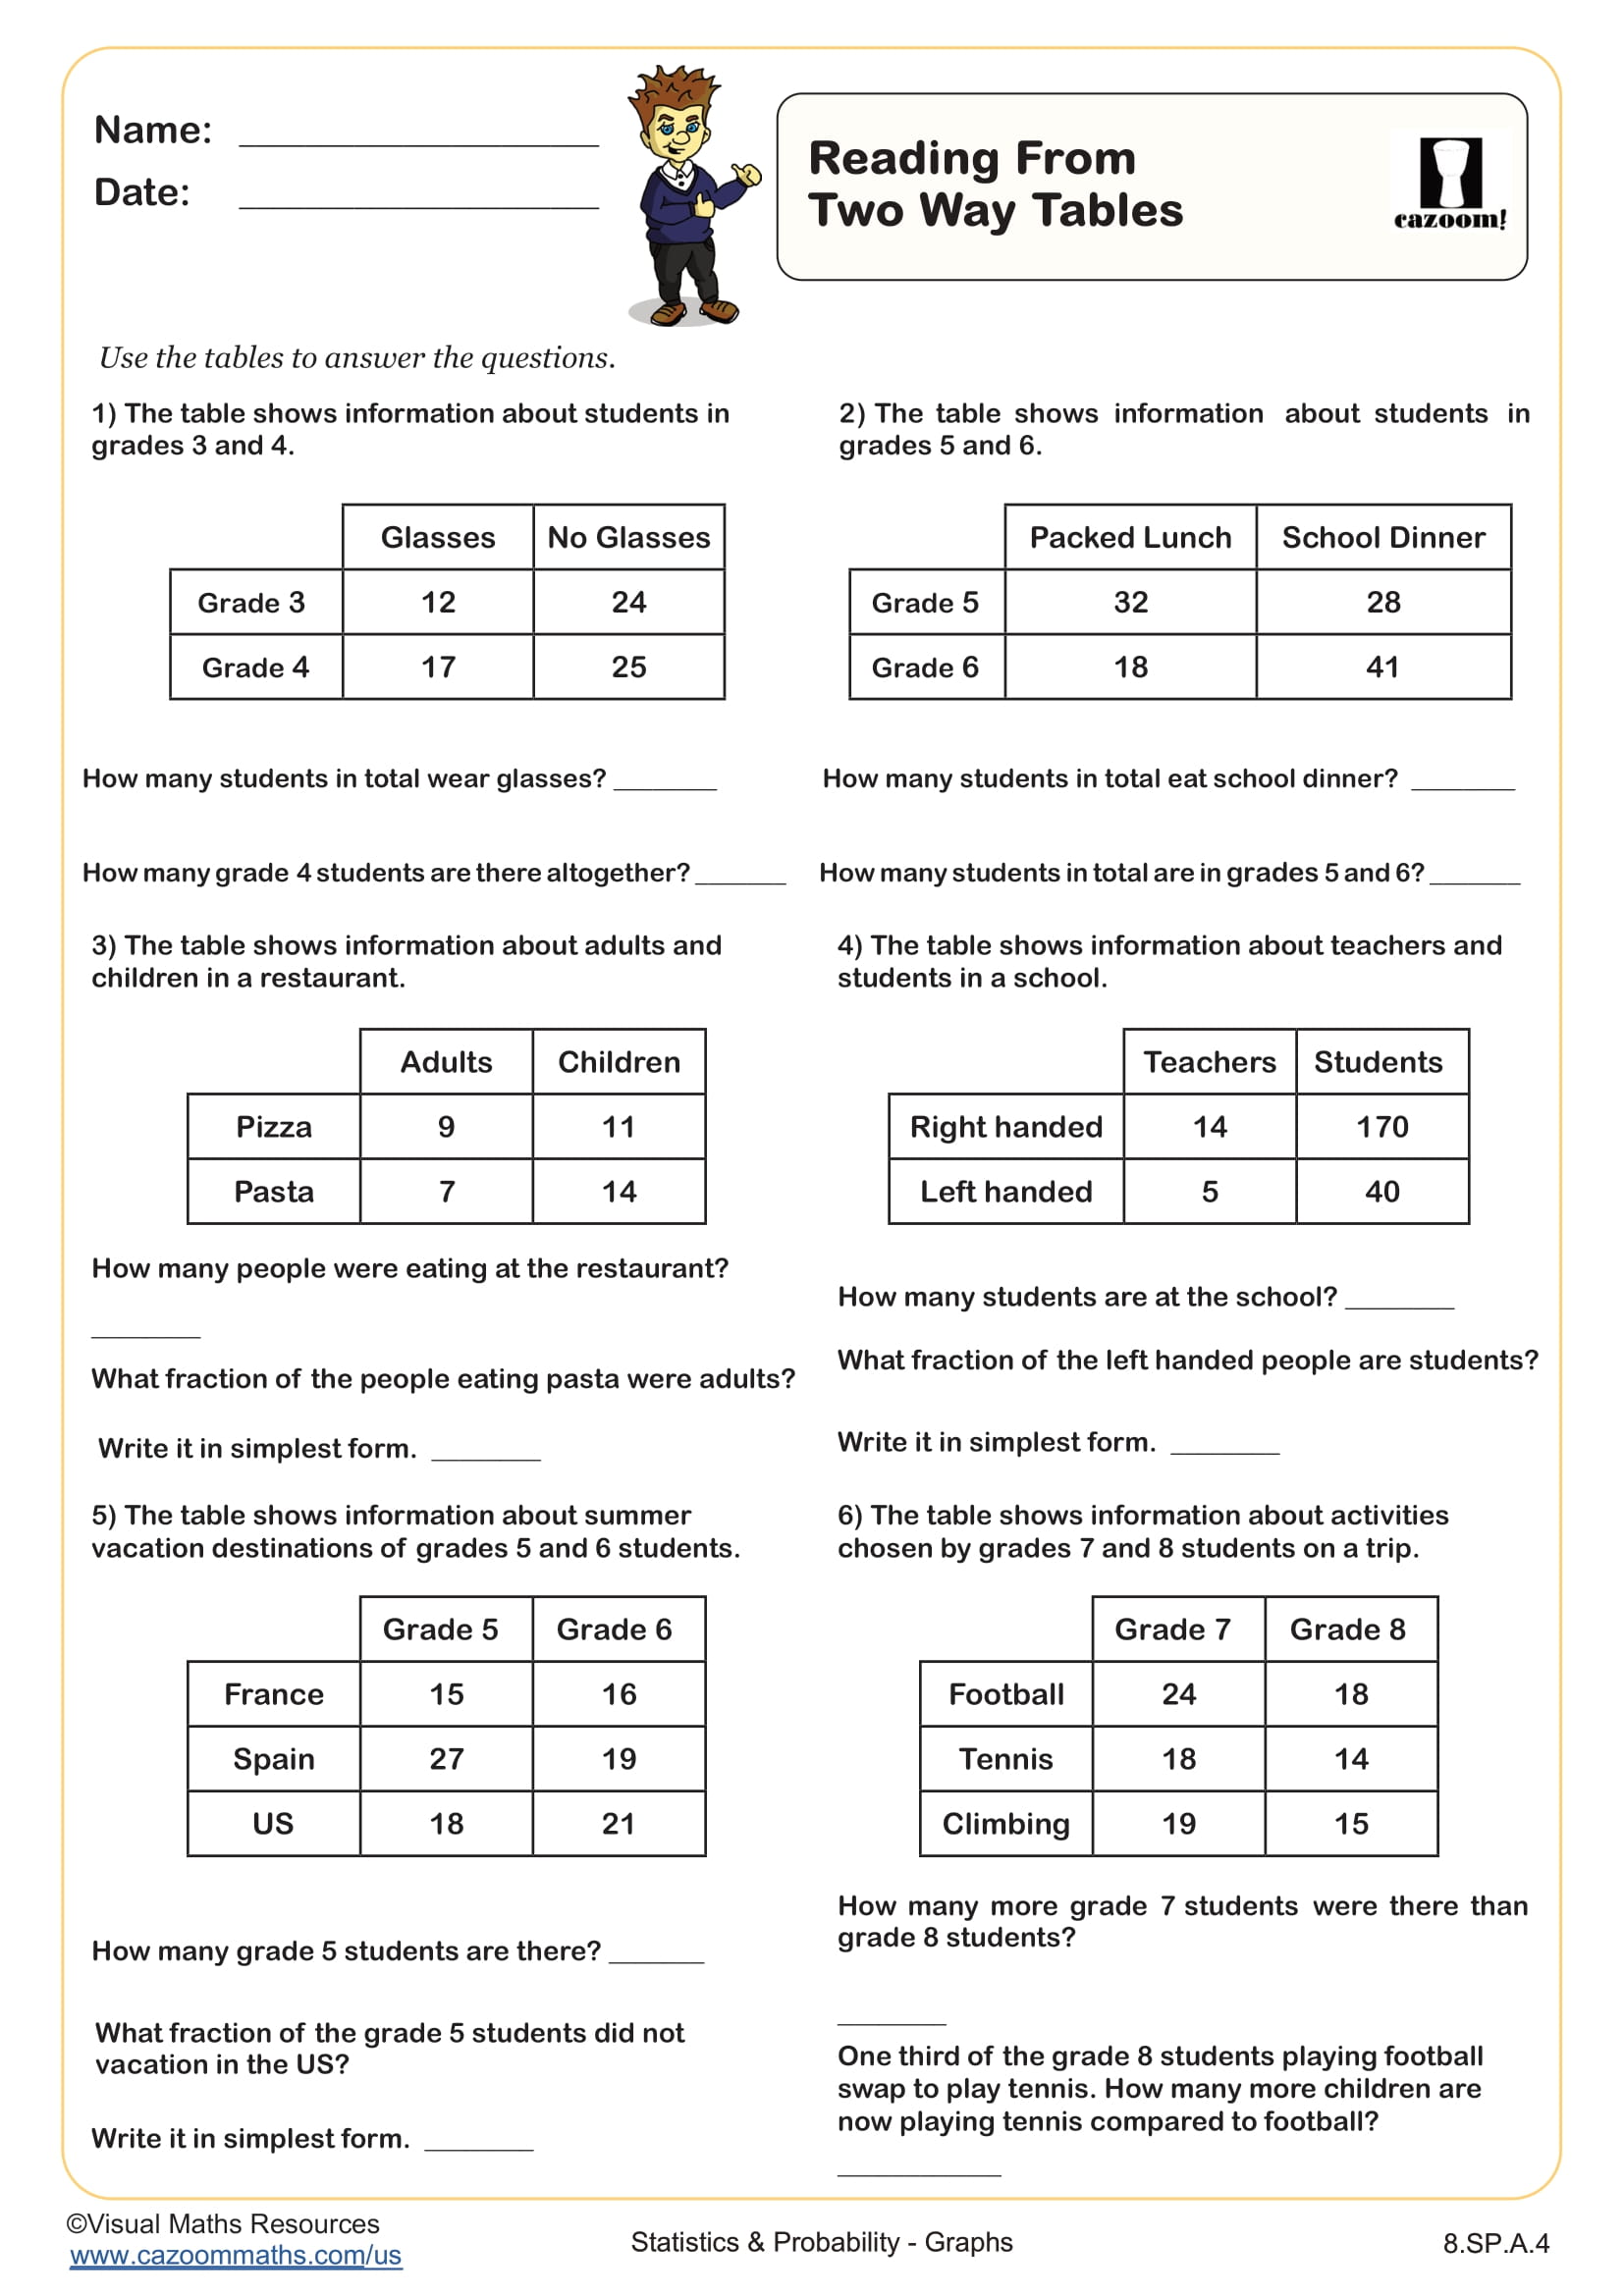
Reading from Two Way Tables
Grades: 8th Grade, IM 1
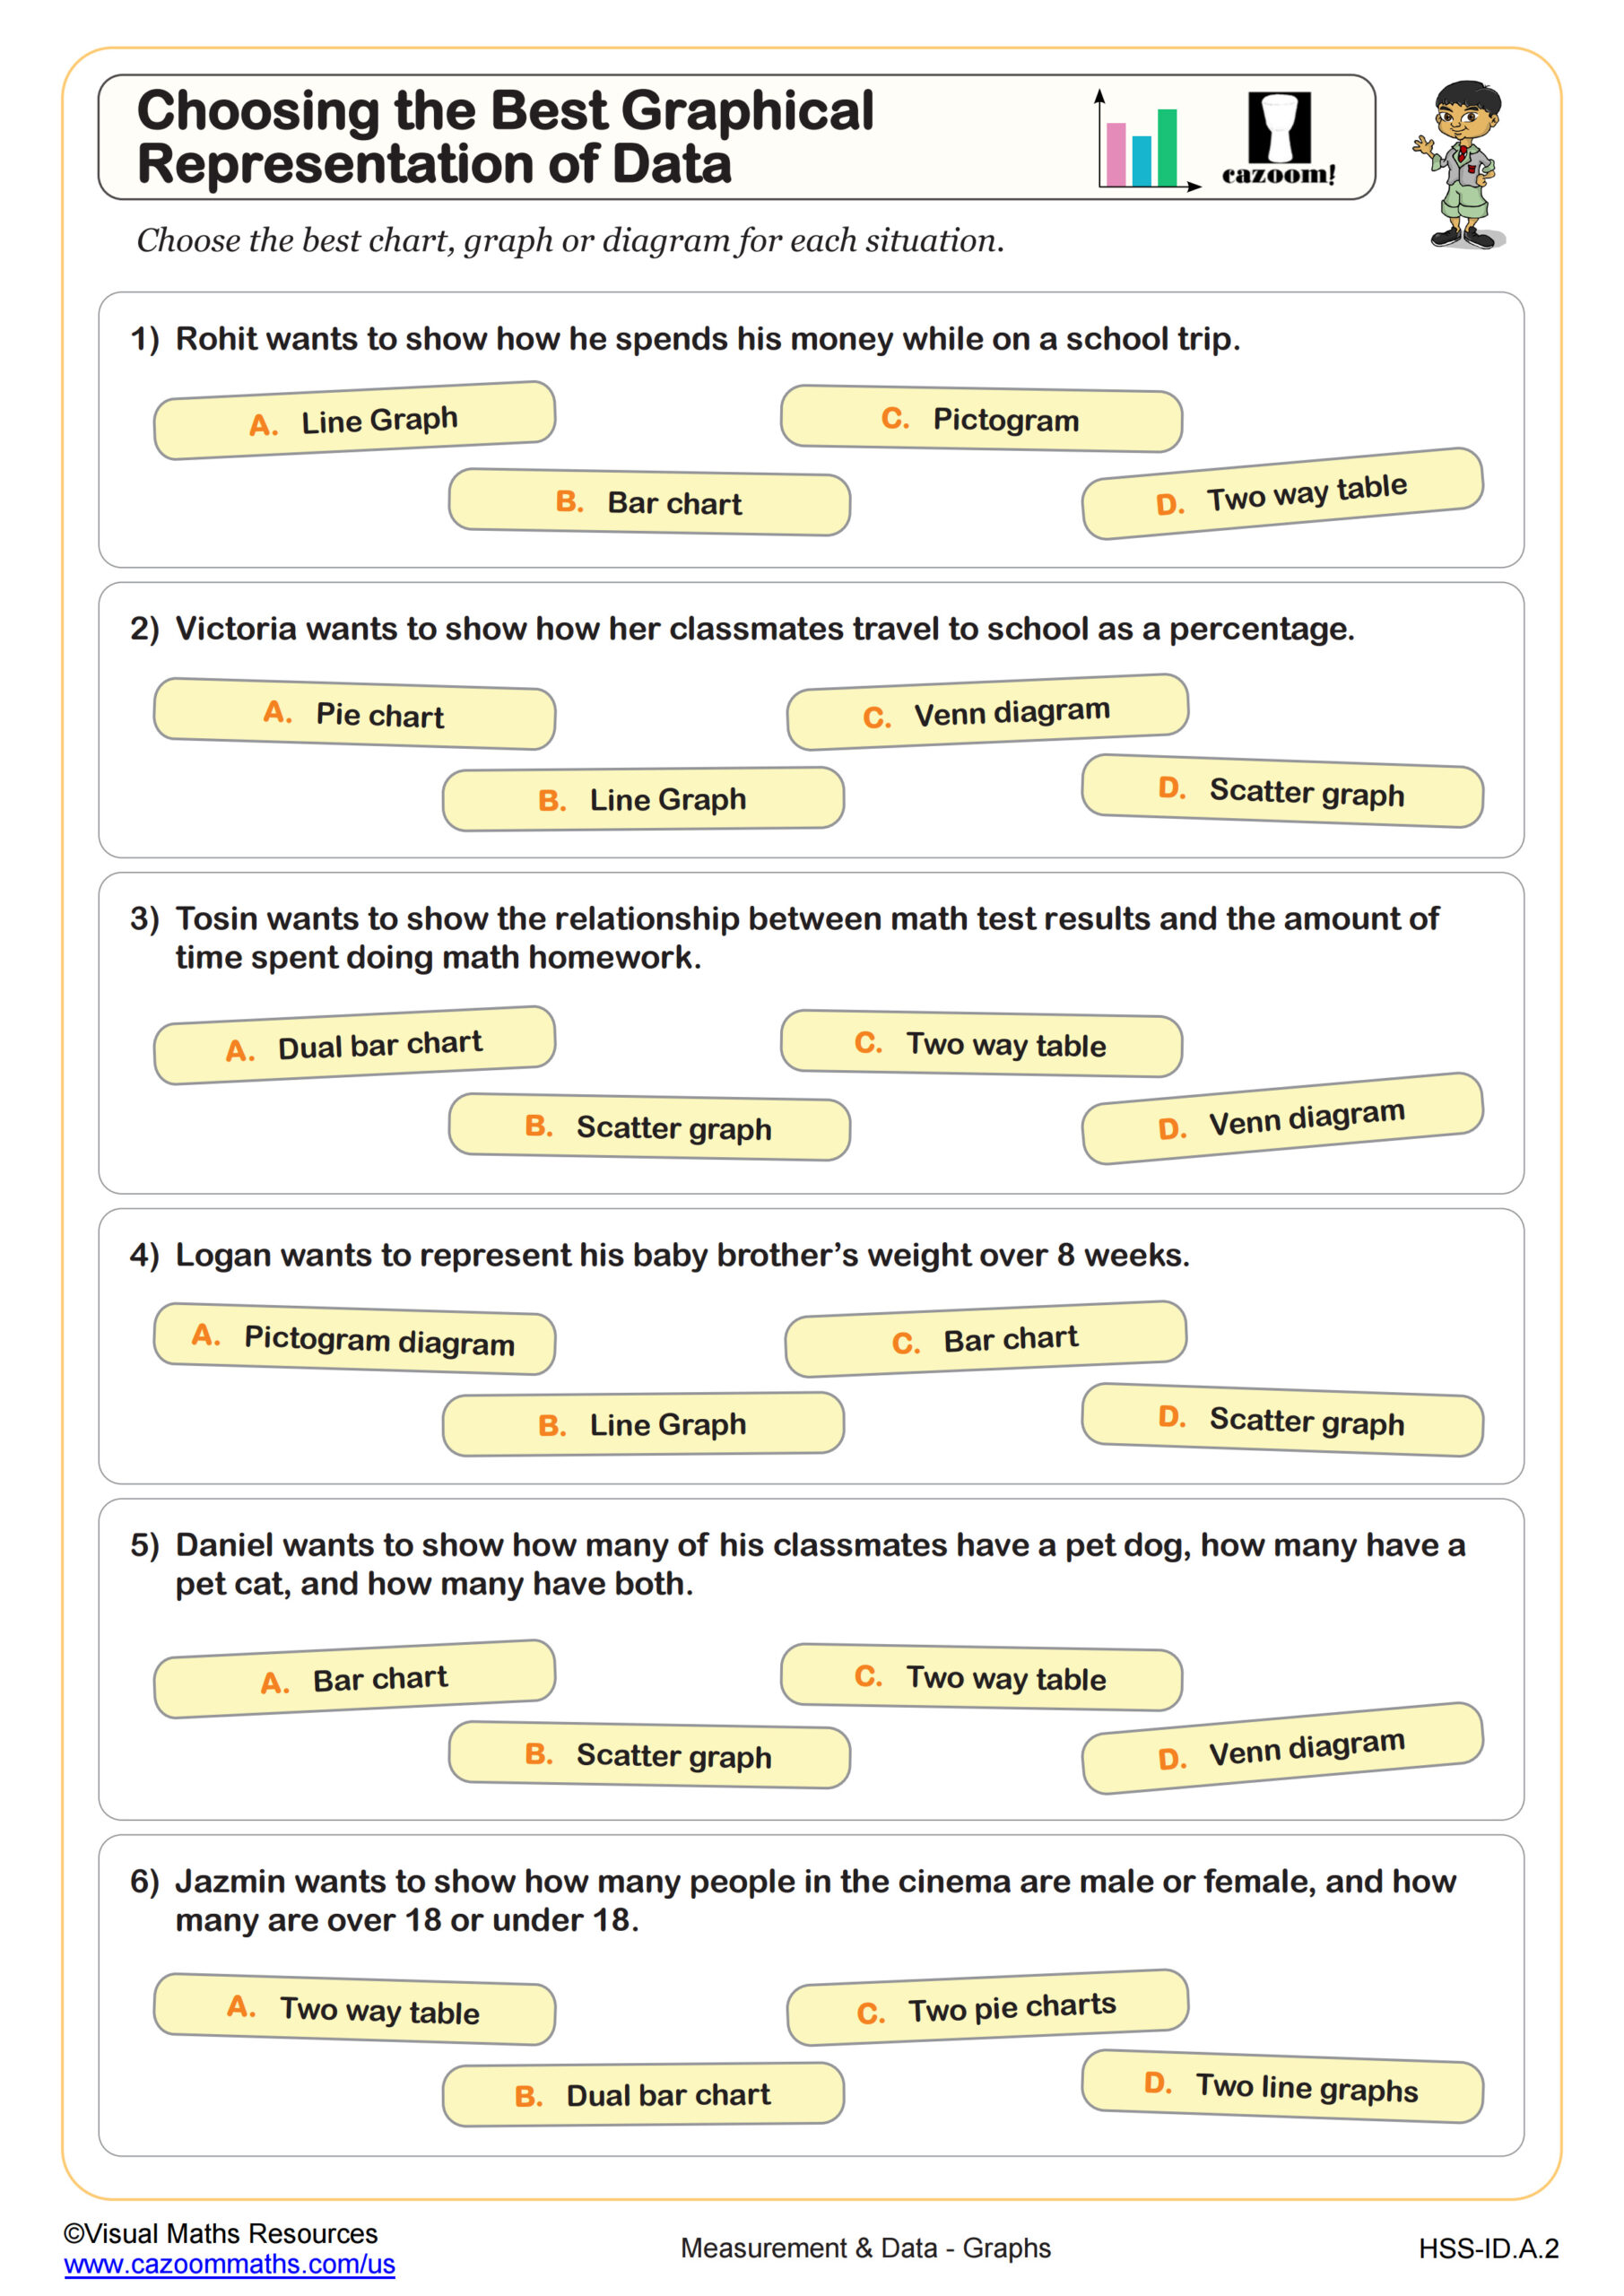
Choosing the Best Graphical Representation of Data
Grades: Algebra I
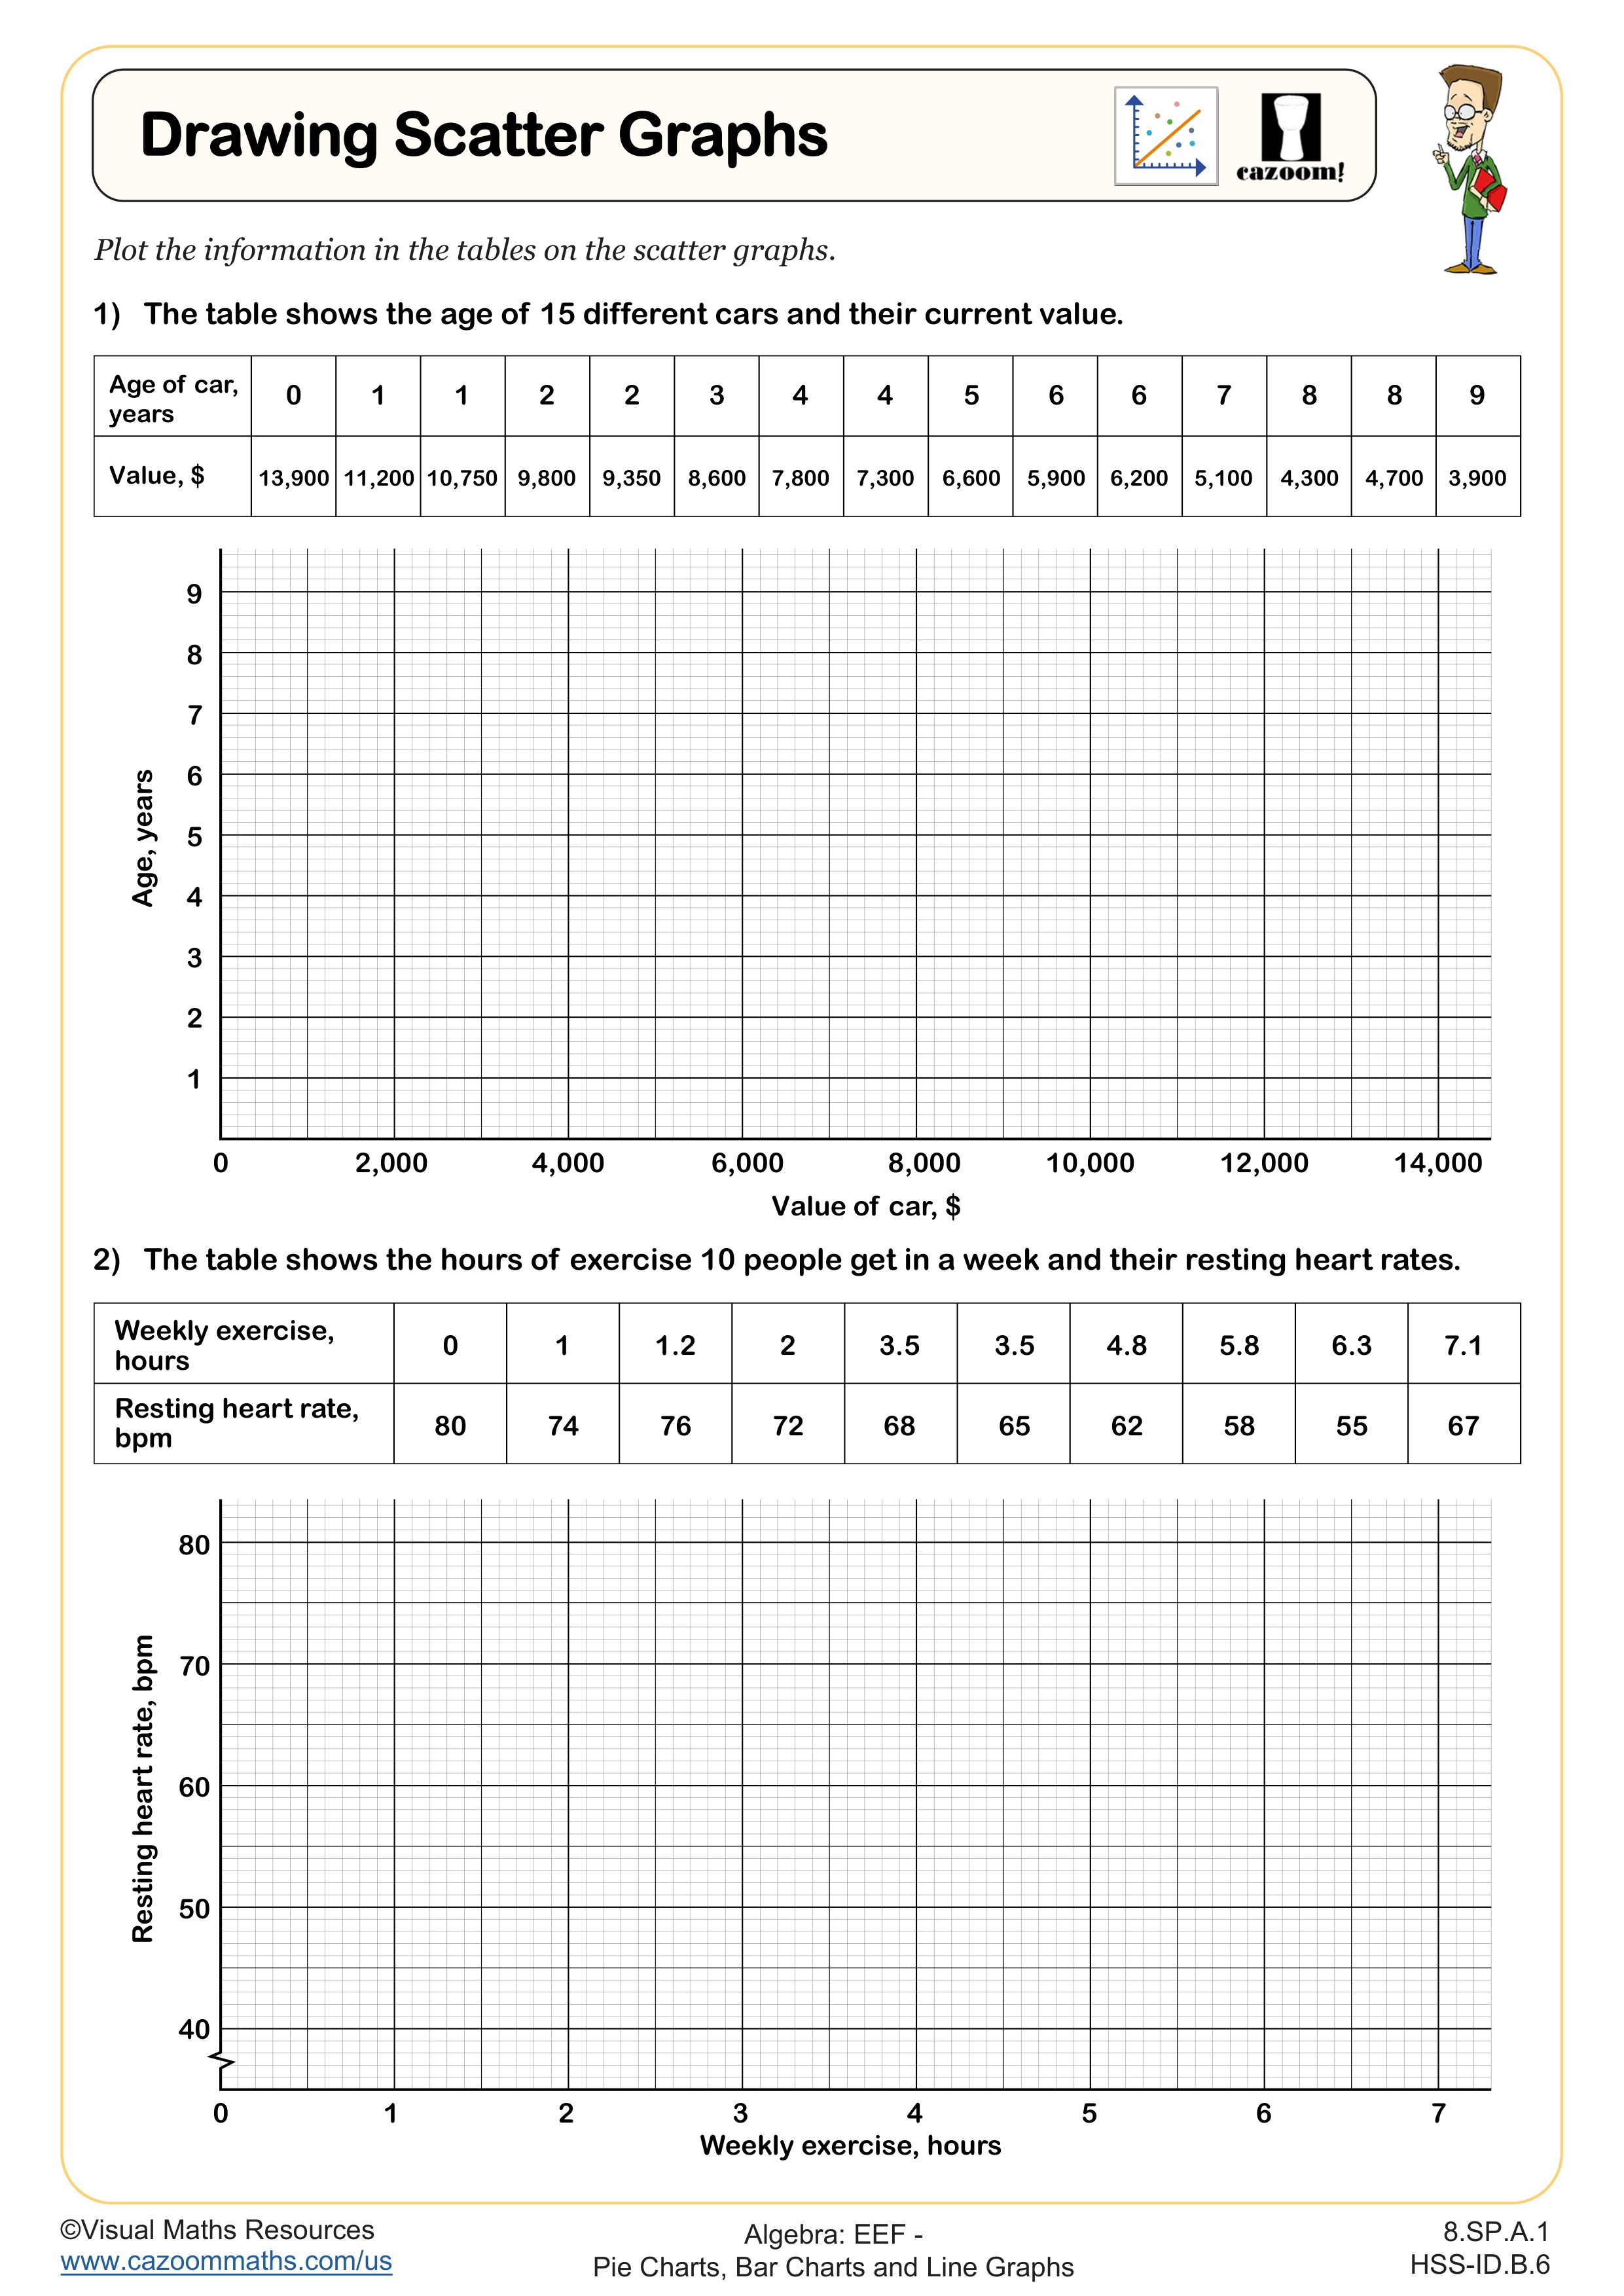
Drawing Scatter Graphs
Grades: Algebra I, IM 1
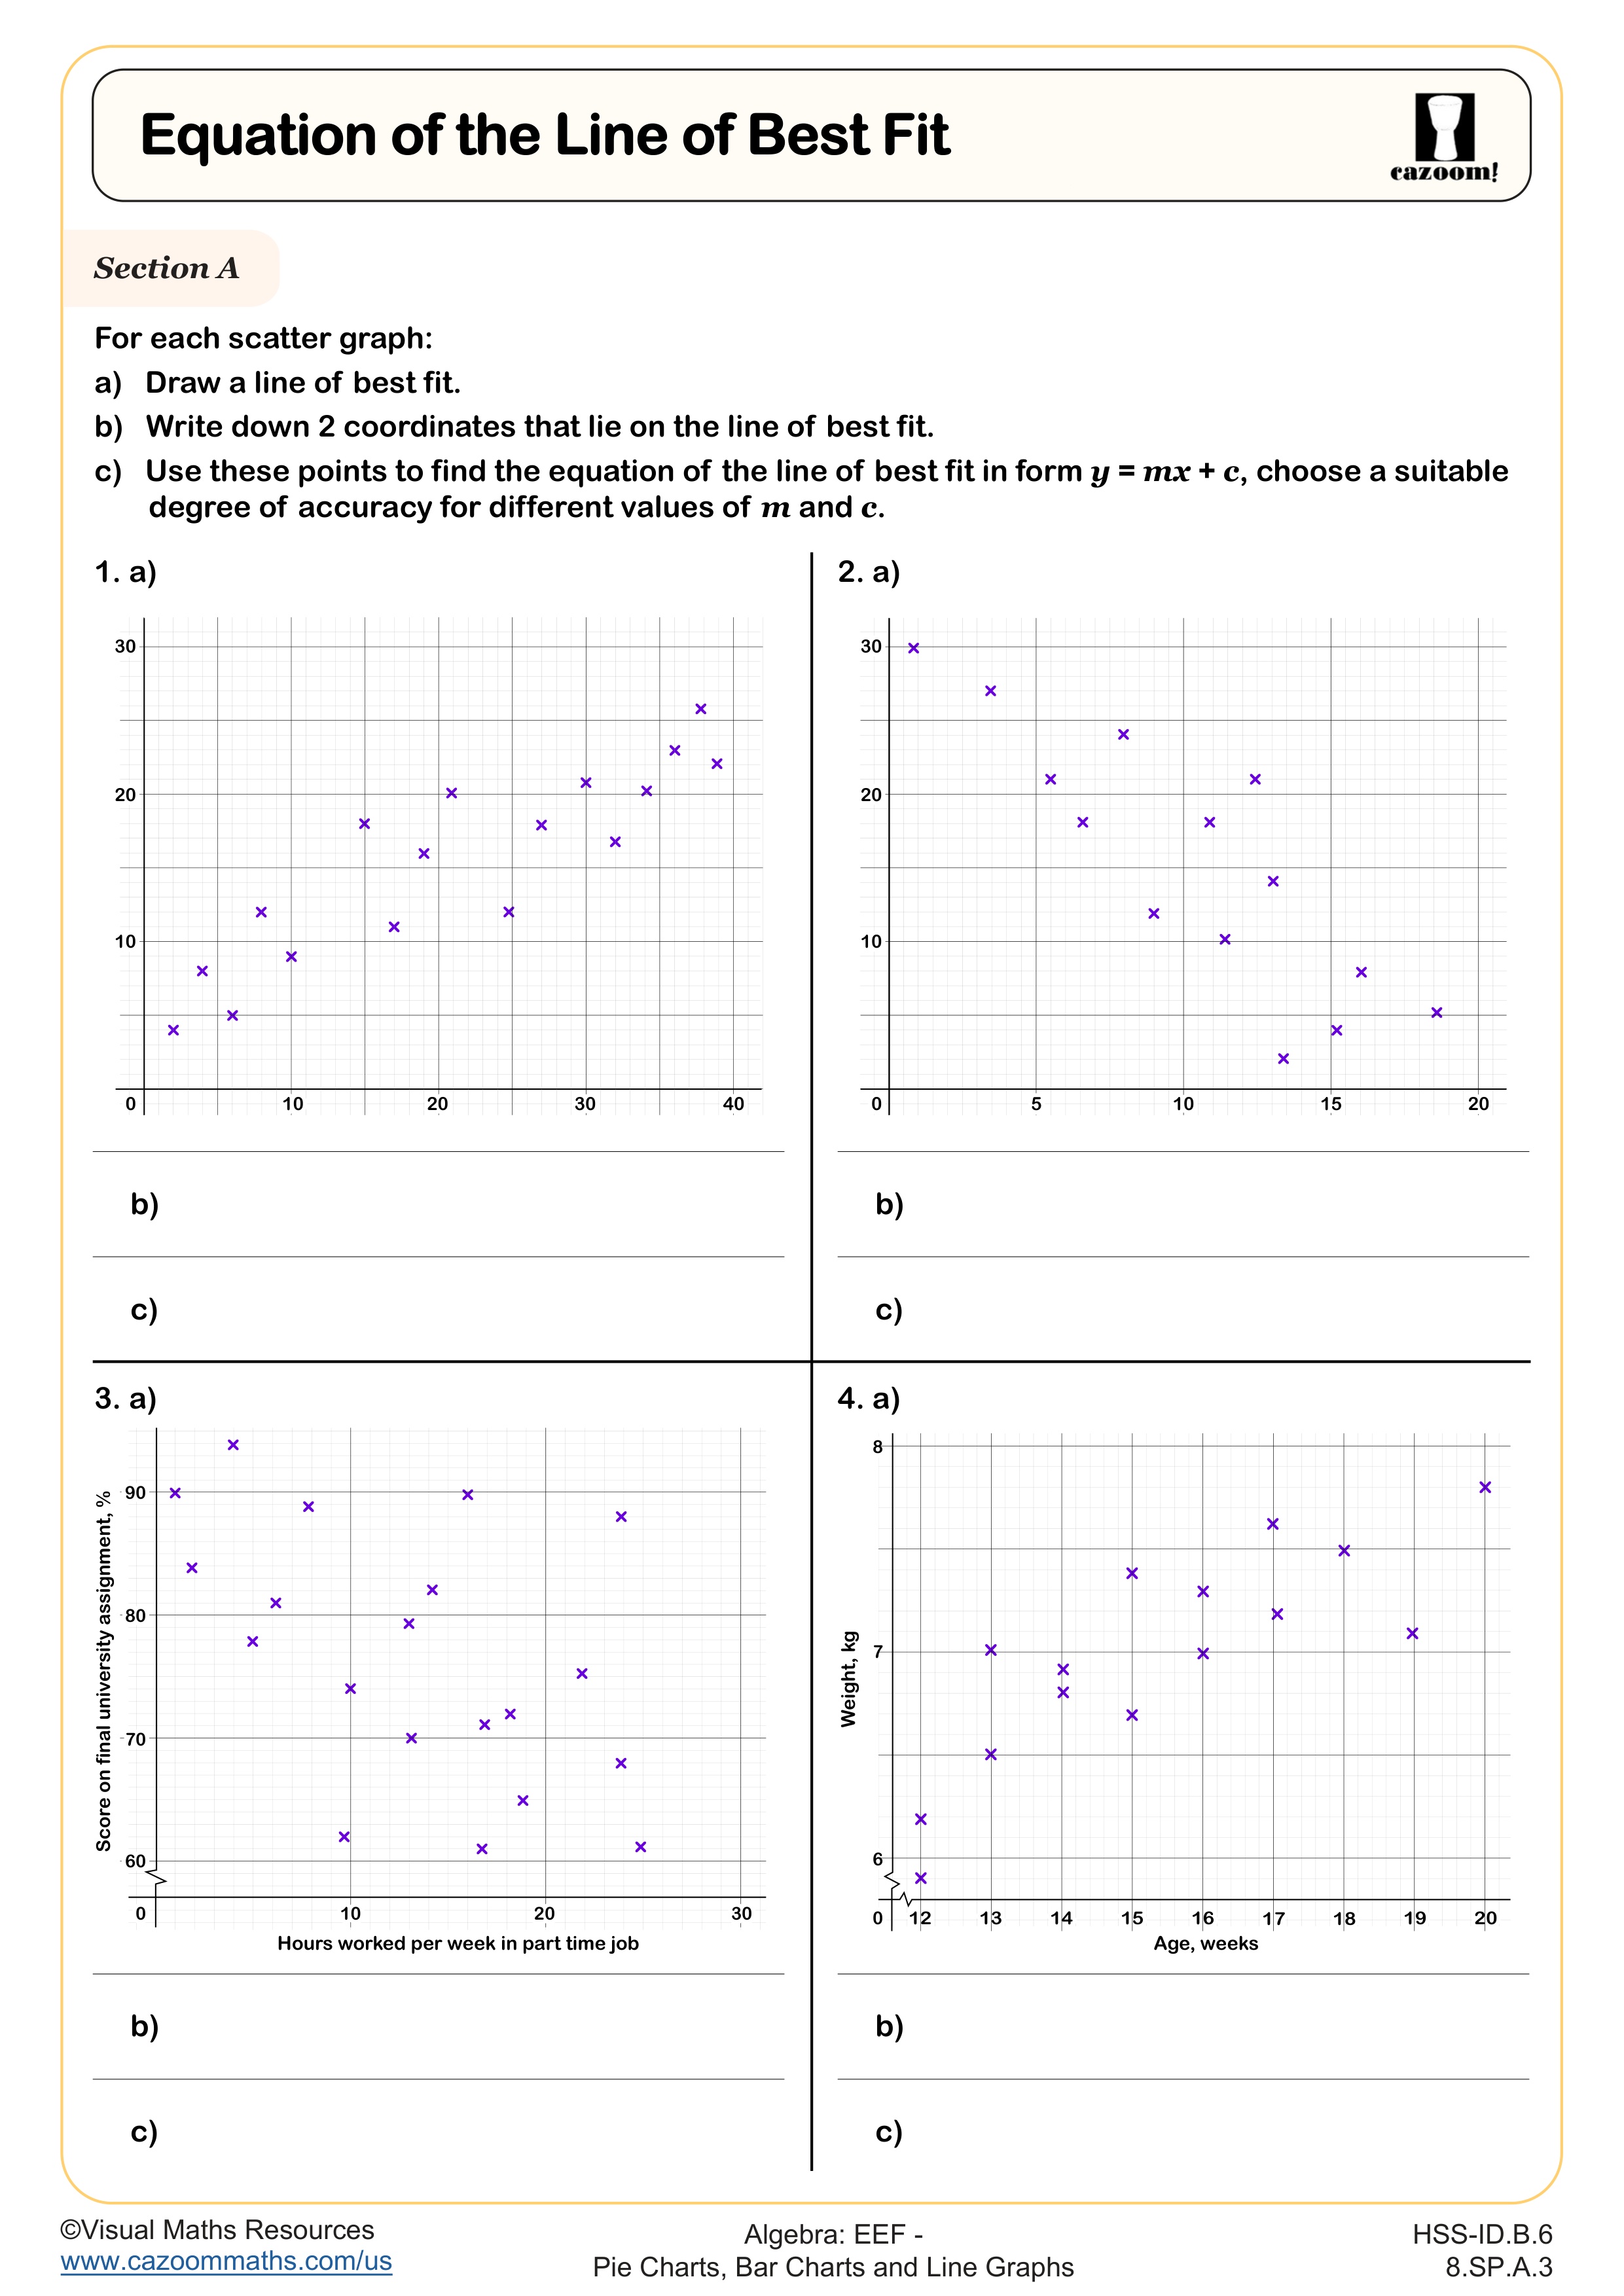
Equation of the Line of Best Fit
Grades: Algebra I, IM 1
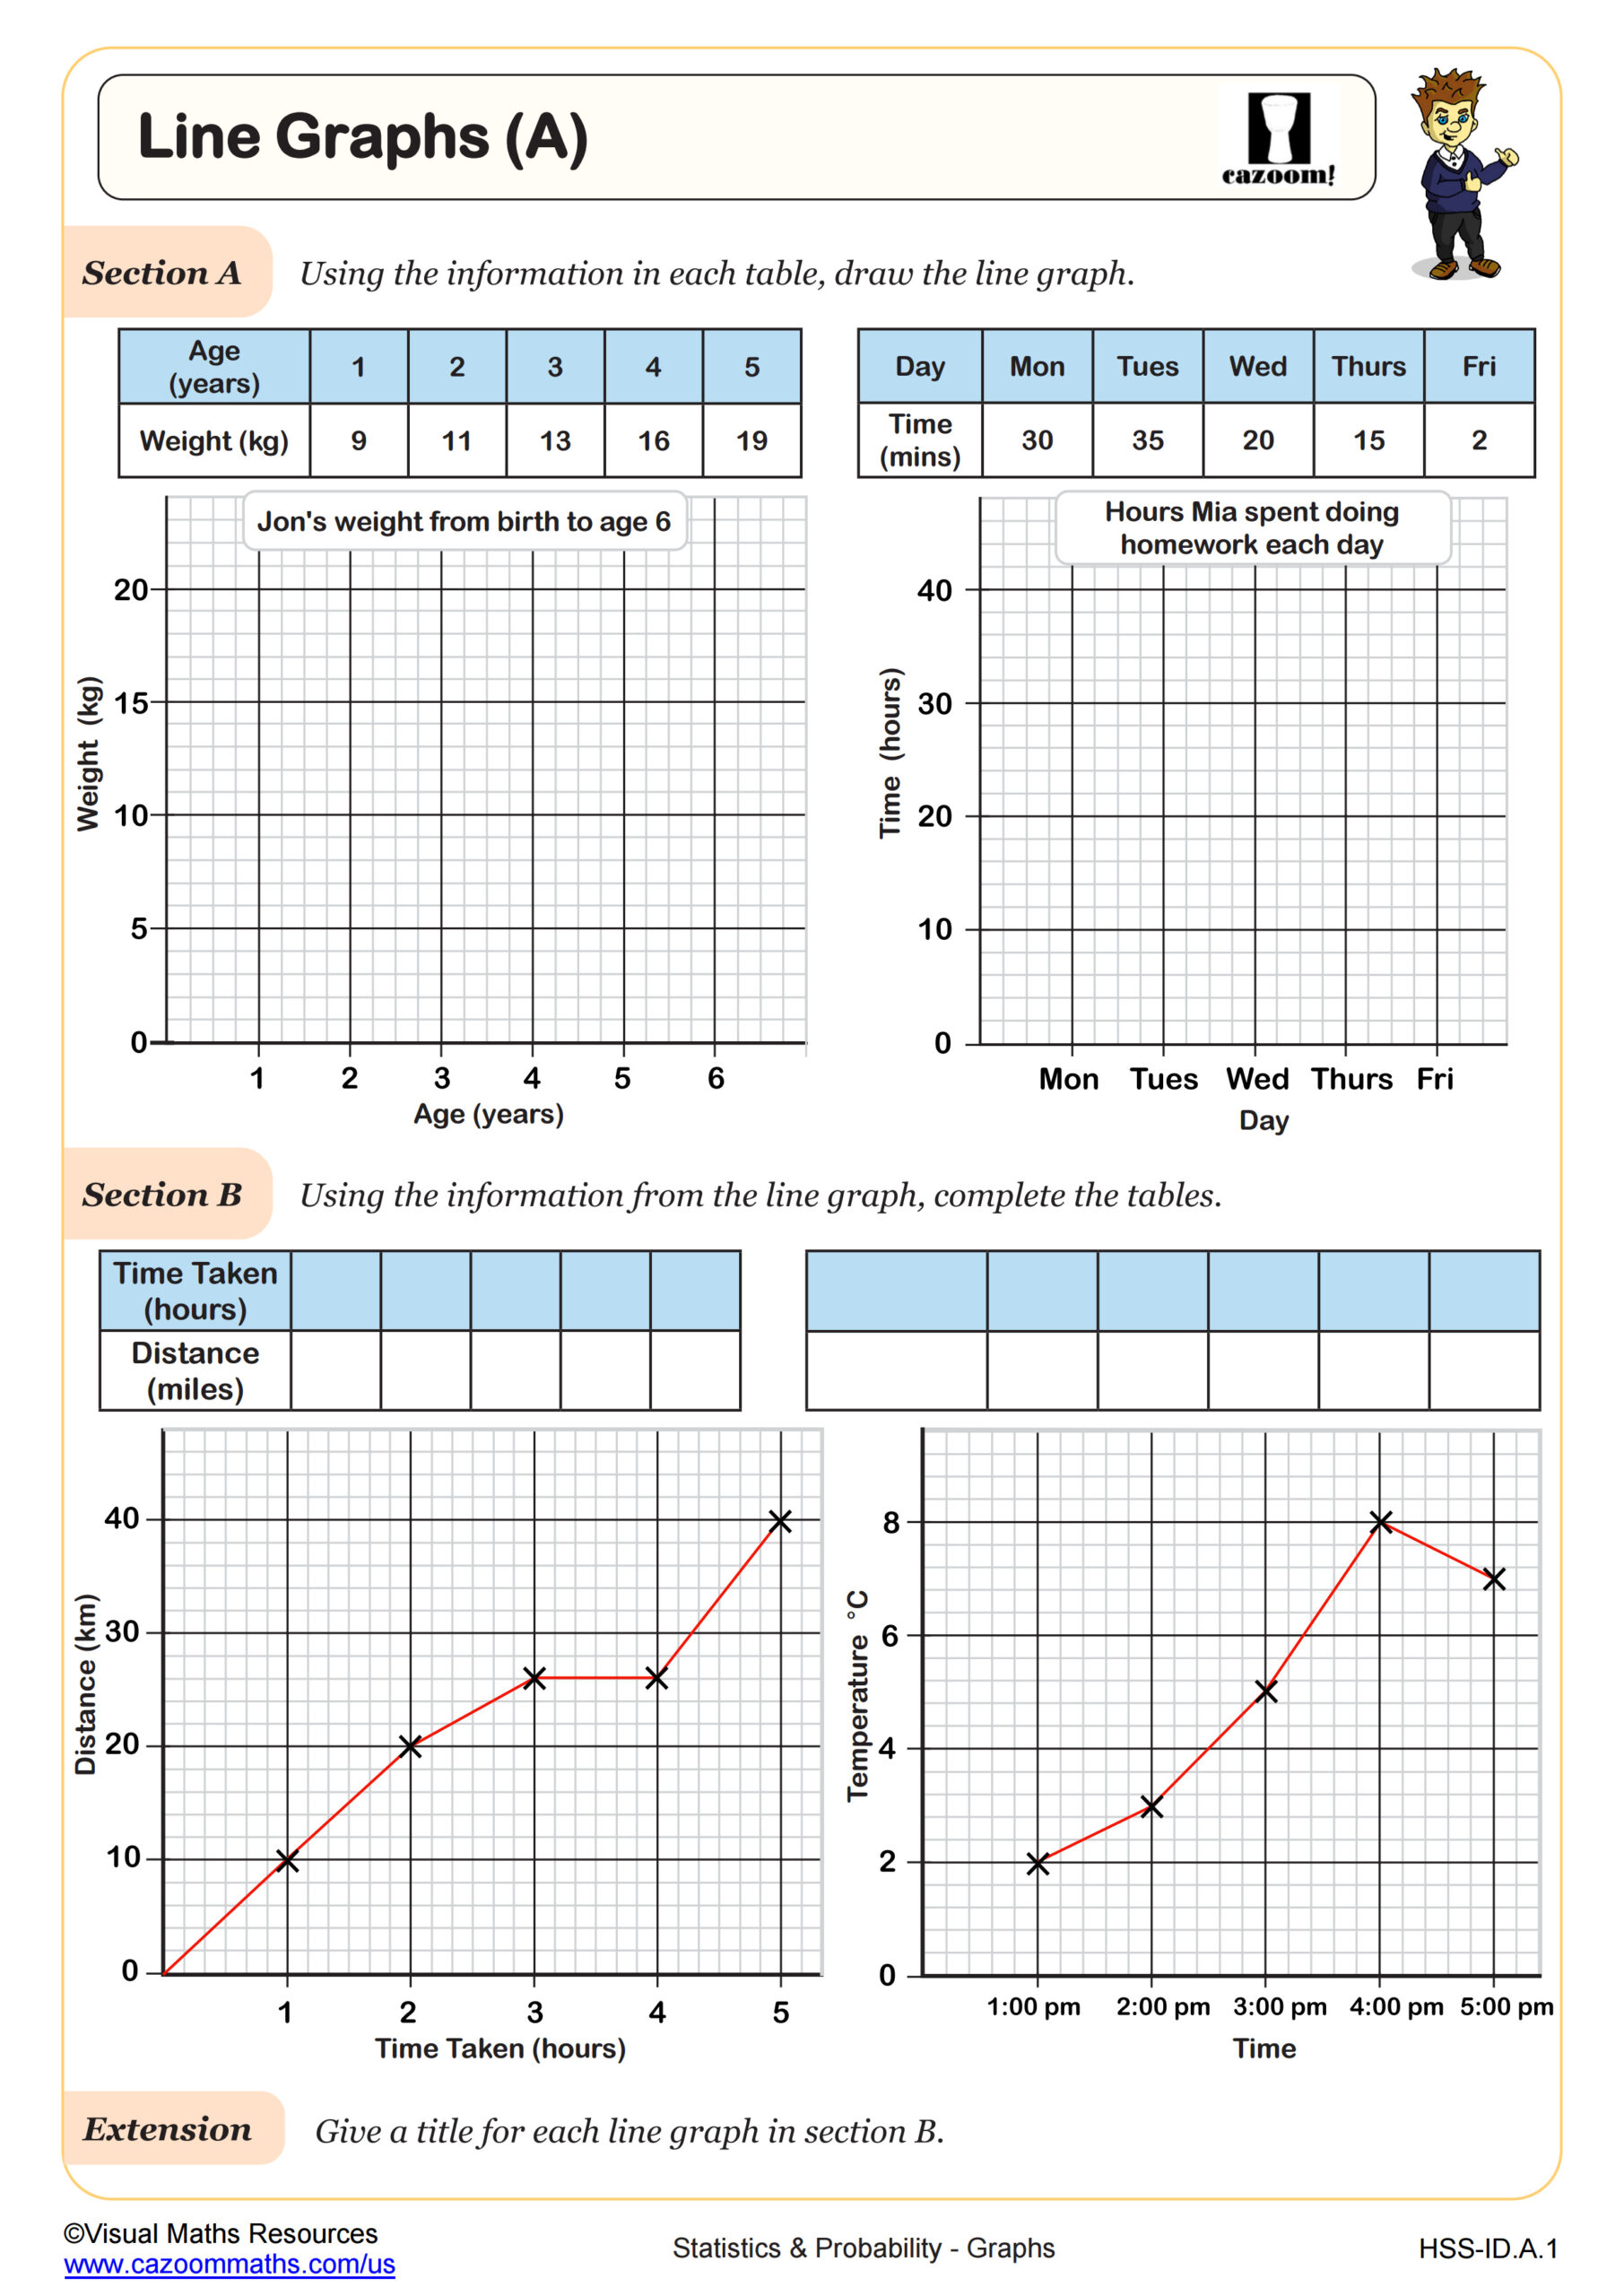
Line Graphs (A)
Grades: Geometry, IM 2
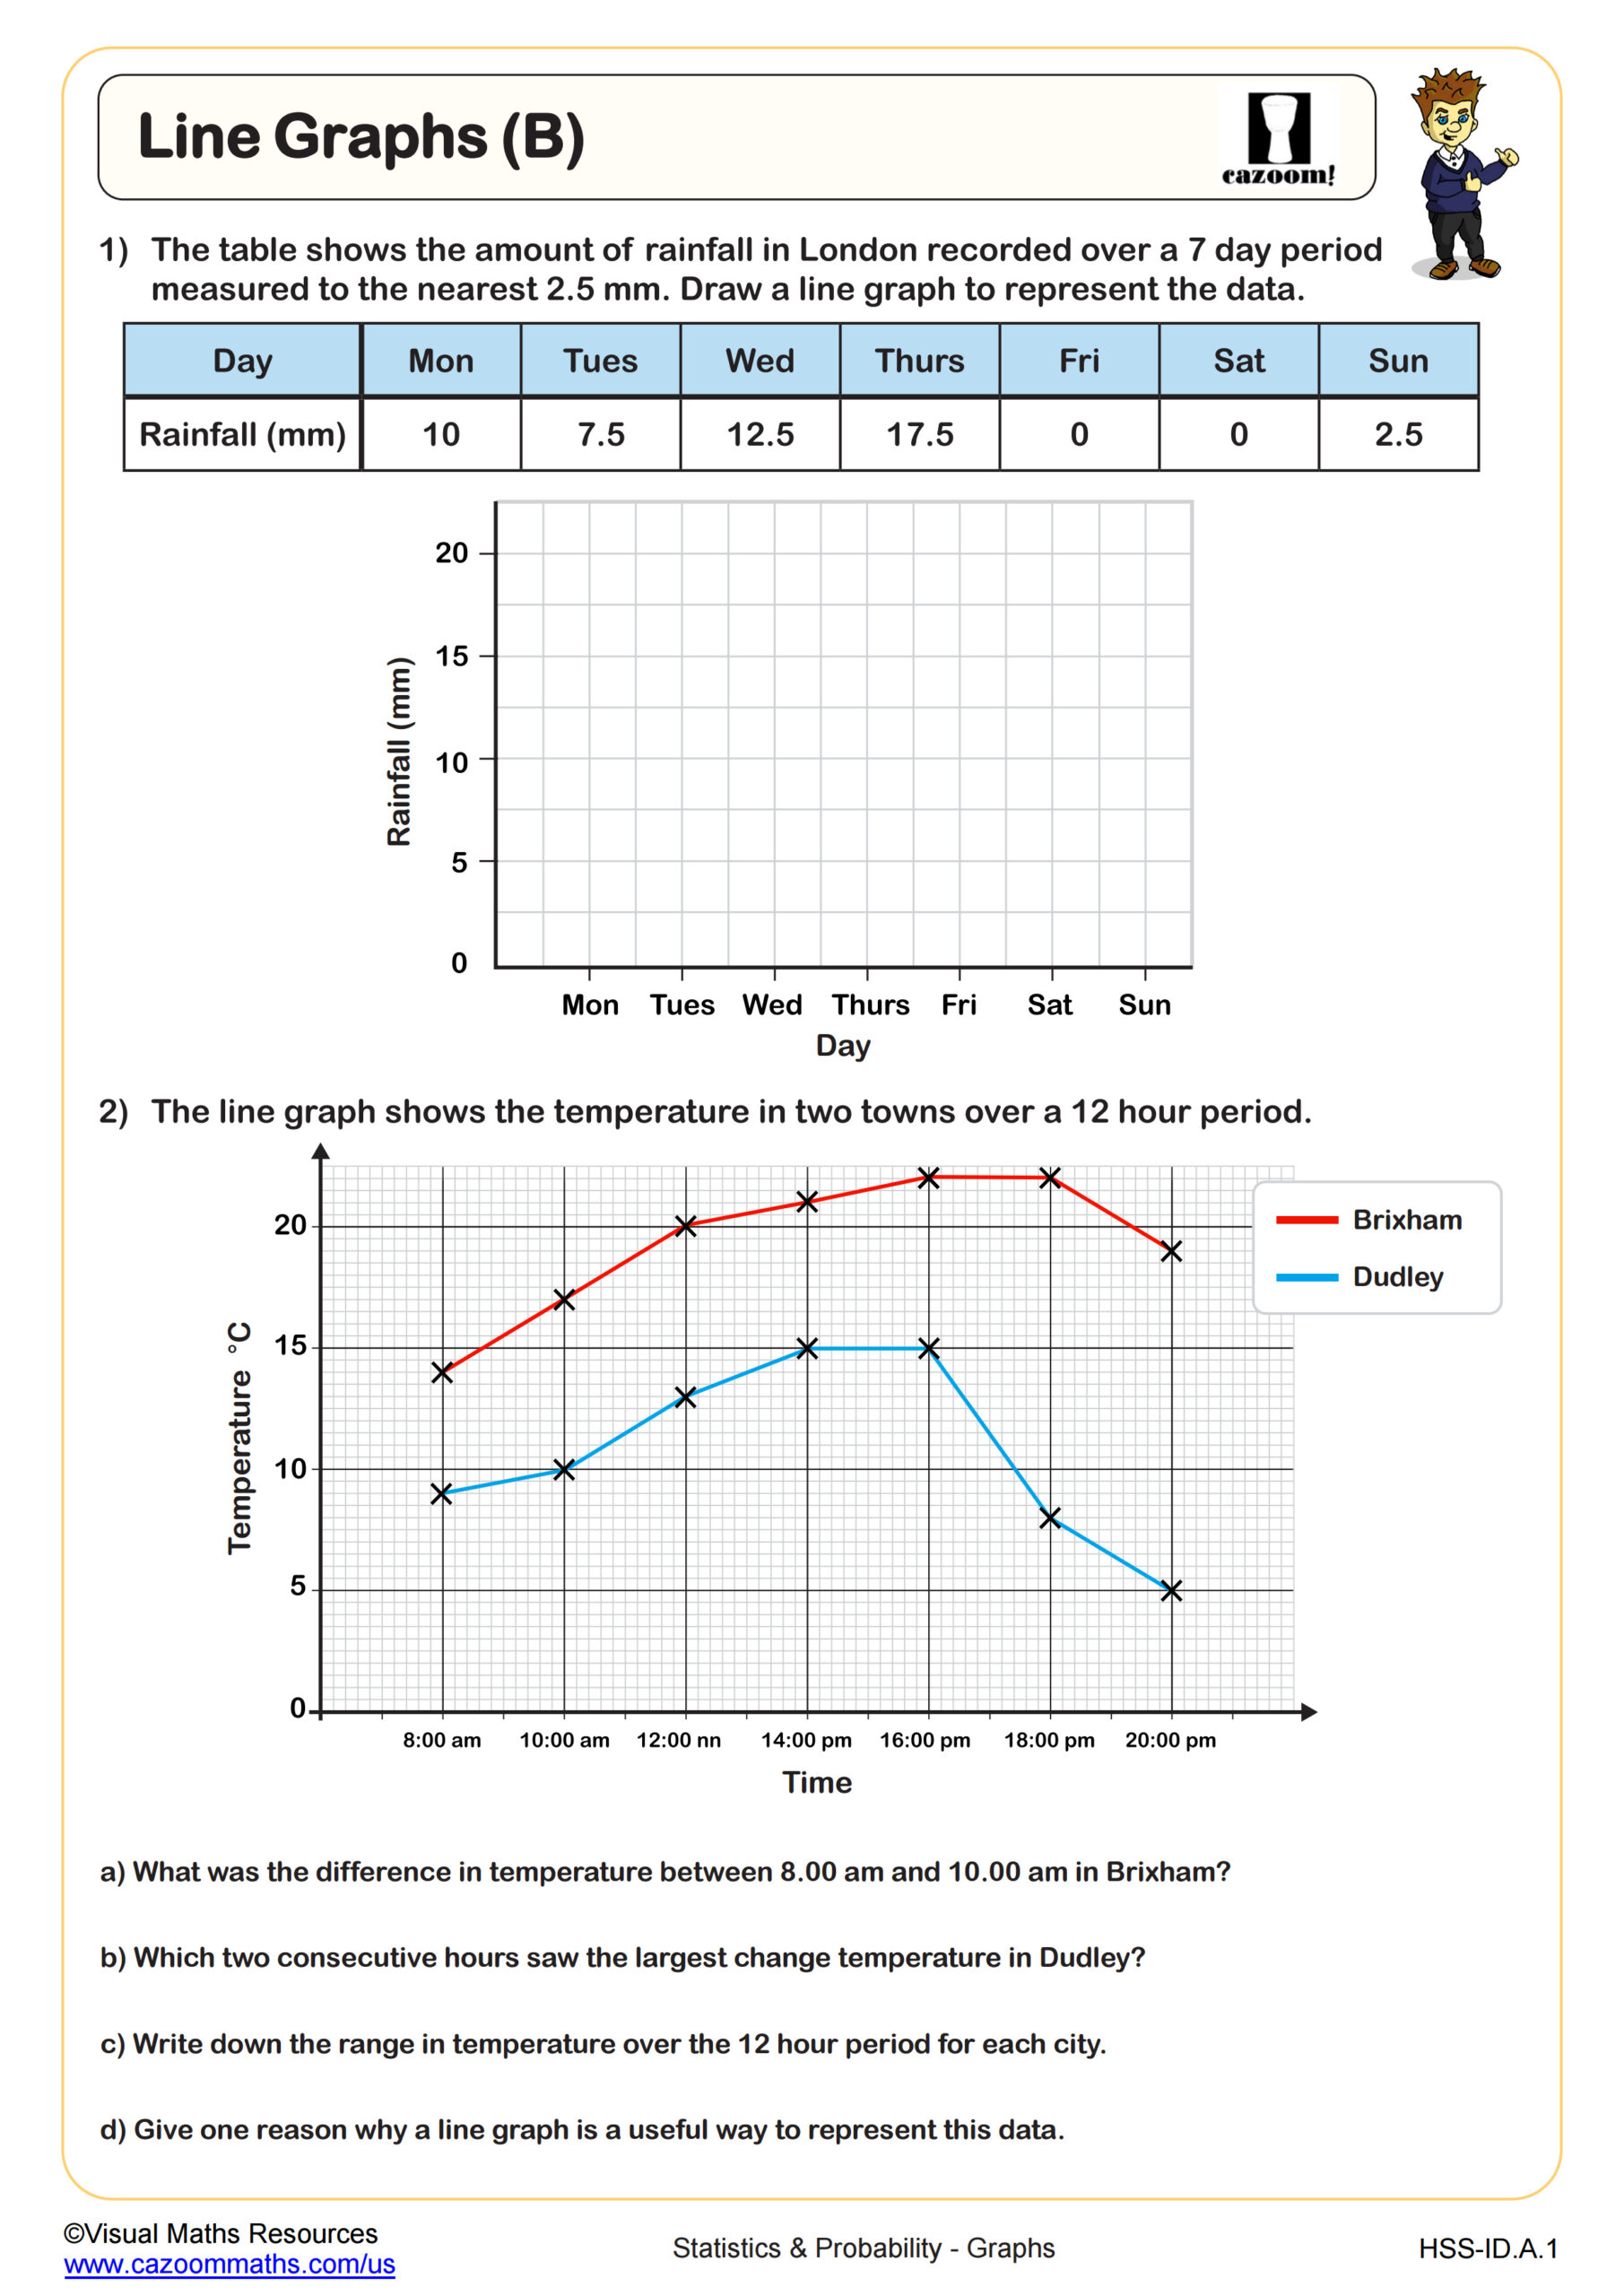
Line Graphs (B)
Grades: Geometry, IM 2
All worksheets are created by the team of experienced teachers at Cazoom Math.
What skills do 6th grade graphing worksheets develop?
6th grade graphing worksheets pdf resources develop critical data analysis skills required by Common Core State Standards 6.SP.B.4 and 6.SP.B.5. Students learn to display numerical data in plots, describe distributions, and summarize data sets using measures of center and variability. These pie chart worksheets for grade 6 with answers pdf format ensure students can practice independently while receiving immediate feedback.
Math teachers consistently observe that students initially confuse when to use each graph type. Bar graph worksheets grade 6 pdf materials help students understand that bar graphs work best for comparing categories, while line graphs show change over time. This distinction becomes crucial when students analyze real-world data in science classes or interpret statistical information in social studies contexts.
How do graphing skills progress across different grade levels?
Graphing instruction builds systematically from elementary through middle school, with 6th grade serving as a critical transition point. In grades 3-5, students create basic pictographs and simple bar graphs using whole number data. Sixth grade introduces more complex data sets, decimal values, and multiple graph types including pie charts and line graphs with non-integer coordinates.
Teachers notice that students who master 6th grade graphing concepts show stronger performance in 7th and 8th grade statistics units. The progression continues with scatter plots, trend lines, and statistical measures in later grades. Students who struggle with scale selection and data interpretation in 6th grade often need additional support with algebraic graphing concepts, making these foundational skills particularly important for long-term mathematical success.
Why do students find pie chart creation challenging?
Pie chart construction requires students to convert raw data into percentages and then translate percentages into degrees, a multi-step process that combines fractions, decimals, and geometry. Many students struggle with the concept that a complete circle represents 360 degrees, and they often make calculation errors when determining sector sizes. Teachers frequently see students create pie charts where sectors don't add up to the full circle.
The most effective approach involves teaching students to first verify that their percentages total 100% before converting to degrees. Circle graph worksheets grade 6 materials typically include step-by-step examples showing how 25% becomes 90 degrees (25% × 360° = 90°). This connection between proportional reasoning and geometric measurement helps students understand why pie charts work well for displaying parts of a whole, such as budget allocations or survey results.
How can teachers maximize the effectiveness of these worksheets?
Teachers achieve better results when they introduce graphing worksheets after students have collected real data from classroom surveys or experiments. Starting with authentic data makes the graphing process meaningful and helps students understand why different graph types suit different situations. The answer keys allow teachers to focus instruction time on interpretation and analysis rather than checking mechanical accuracy.
Math educators report that pairing worksheet practice with technology tools enhances learning outcomes. After completing paper-based graphing exercises, students can input the same data into spreadsheet programs or graphing calculators to verify their work. This dual approach reinforces both hand-drawing skills and technological literacy, preparing students for high school mathematics courses where both competencies are key for success in statistics and data analysis units.