Scatter Graphs Math Worksheets with Answers
All worksheets are created by the team of experienced teachers at Cazoom Math.
What skills do students practice with scatter plot worksheet materials?
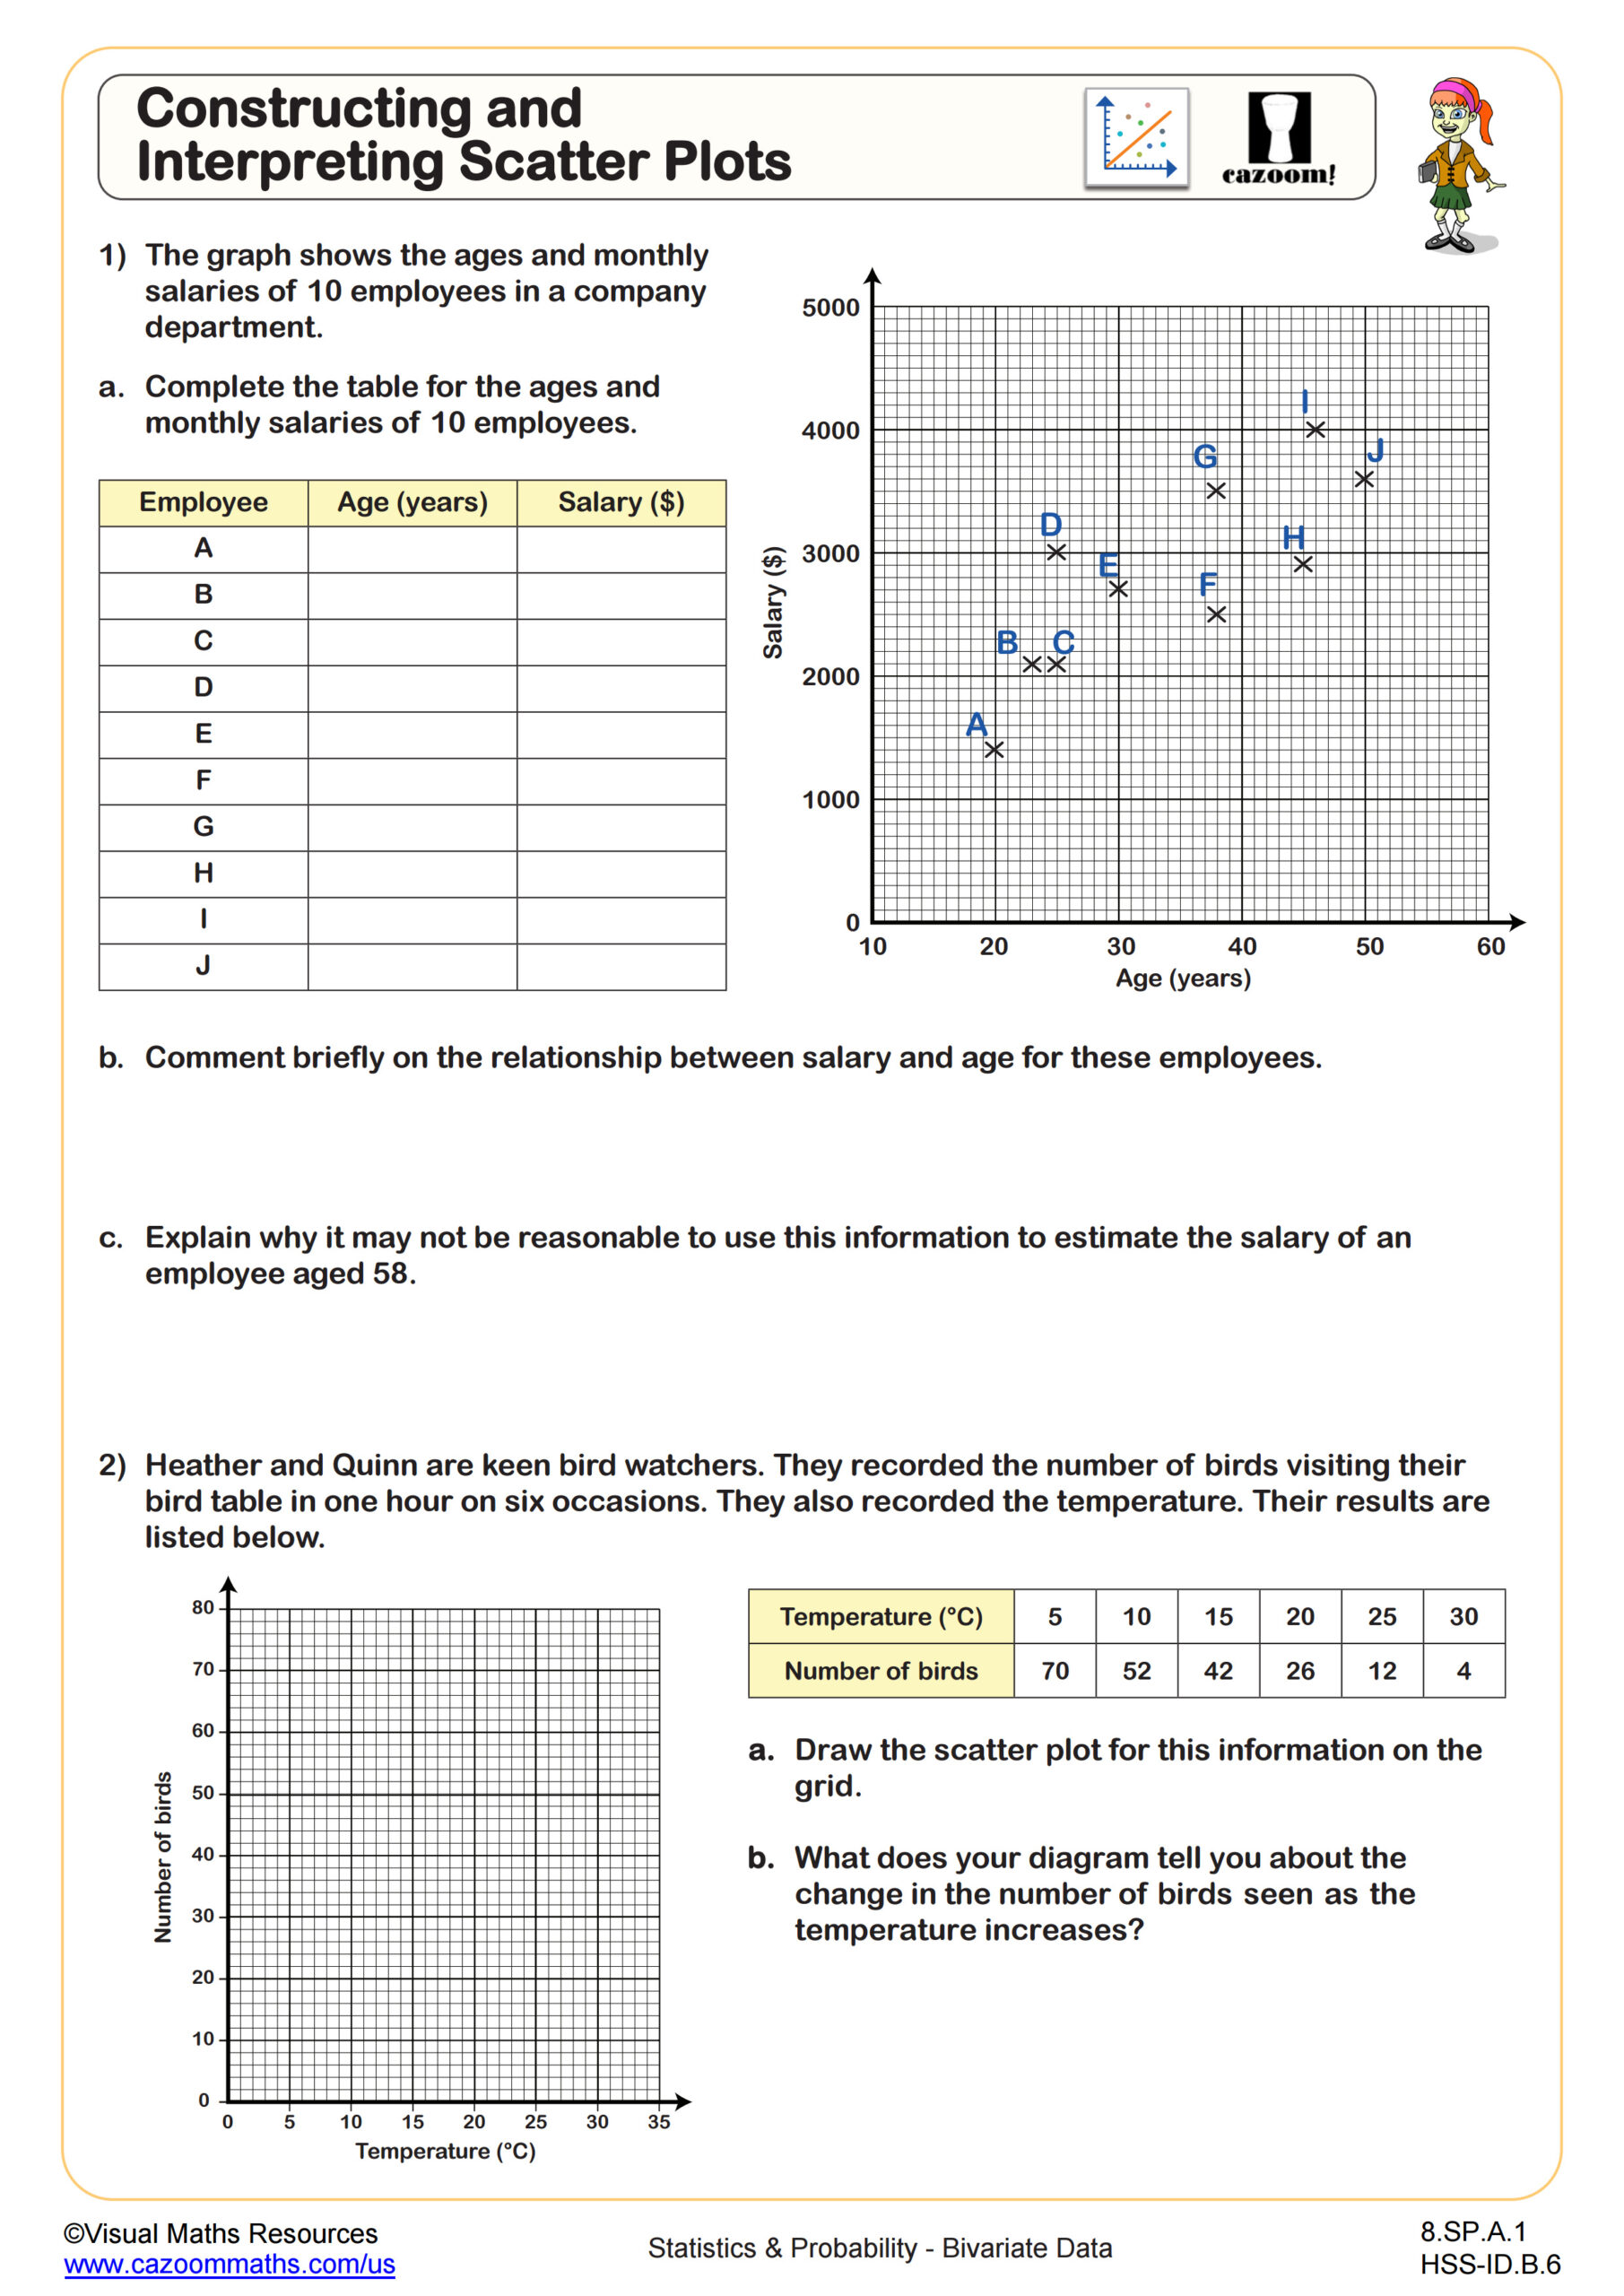
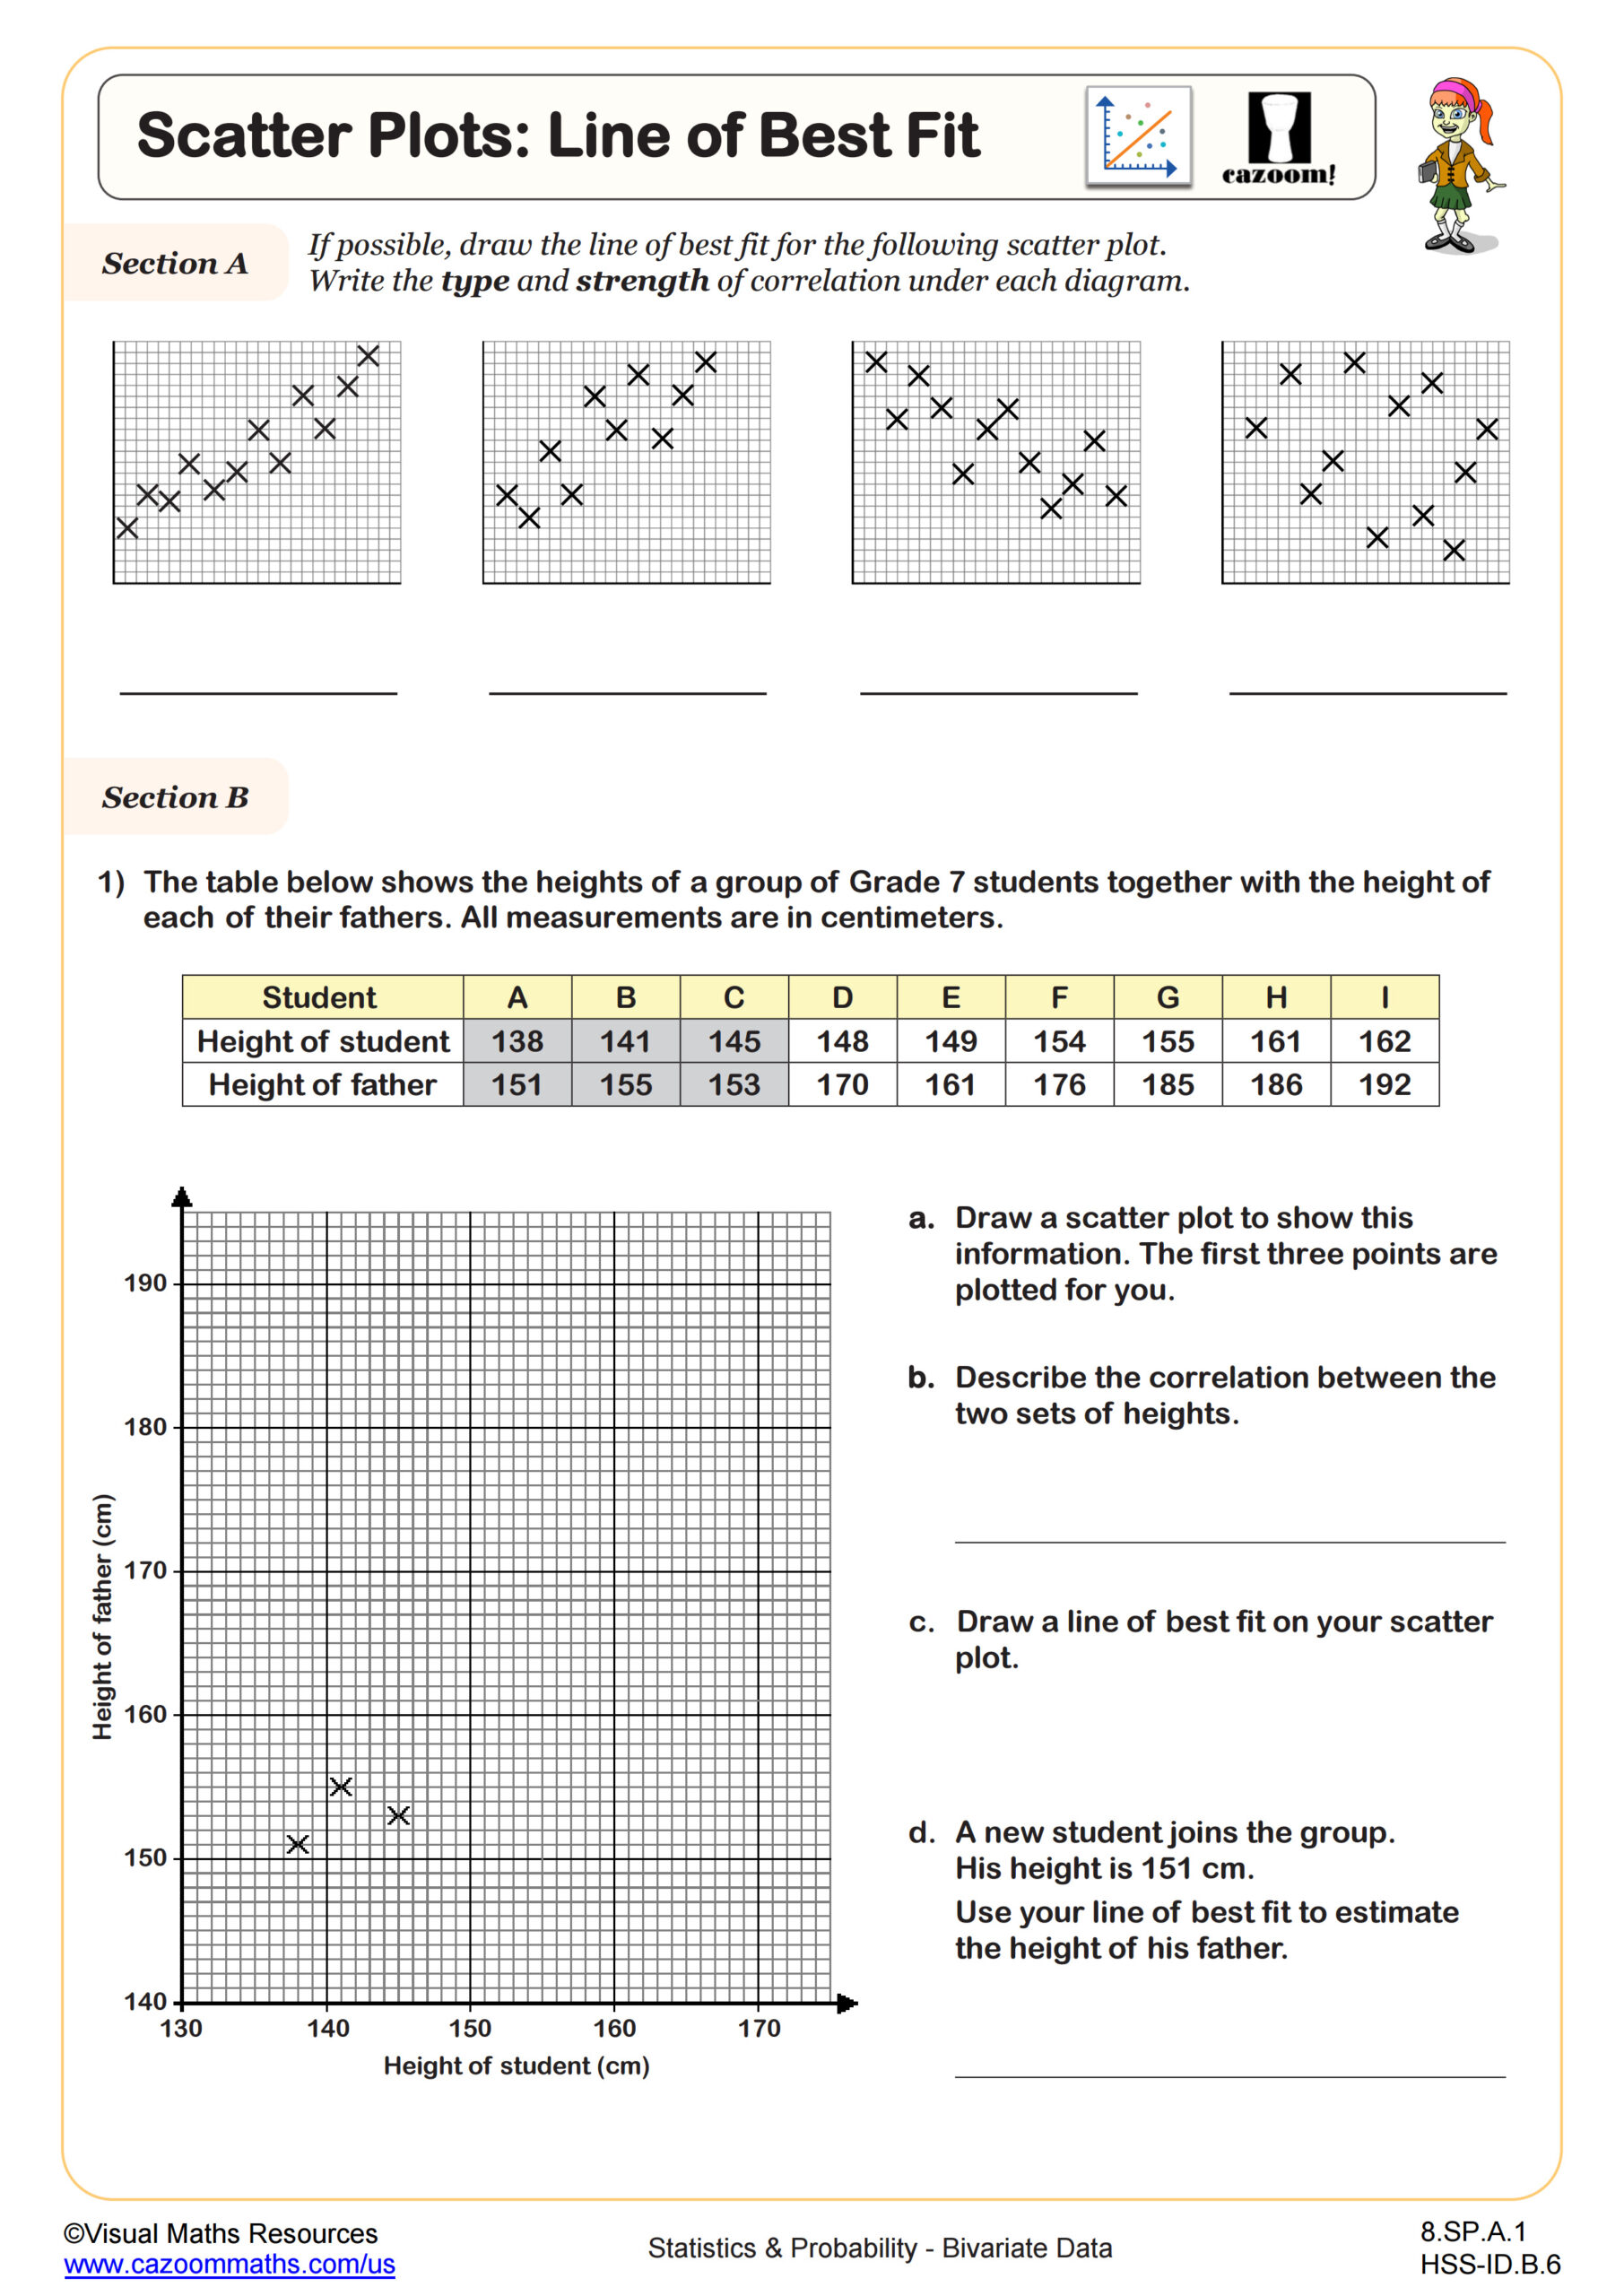
Students develop key data analysis capabilities through scatter plot worksheet activities that align with Common Core State Standards for grades 6-12. They learn to plot ordered pairs accurately, identify positive, negative, and no correlation patterns, and draw lines of best fit to make predictions from data sets.
Teachers notice that students often plot points incorrectly when working with decimal coordinates or negative values. A scatter plot practice worksheet typically includes exercises where students must carefully read data tables and transfer information to coordinate grids, helping them build precision with this fundamental skill that appears on standardized assessments.
Which grade levels benefit most from scatter plot worksheets pdf resources?
Scatter plot instruction begins in middle school, with scatter plot worksheets 8th grade pdf materials focusing on basic plotting and correlation identification. High school students work with more complex data sets and statistical analysis, including calculating correlation coefficients and using scatter plots for predictive modeling.
Teachers find that 8th graders need extensive practice with coordinate plane basics before tackling correlation concepts, while 9th and 10th graders can handle interpreting scatter plots worksheet activities that connect to algebra and real-world applications. The progression from simple plotting to statistical inference requires carefully scaffolded practice across multiple grade levels.
How do interpreting scatter plots worksheet activities build statistical reasoning?
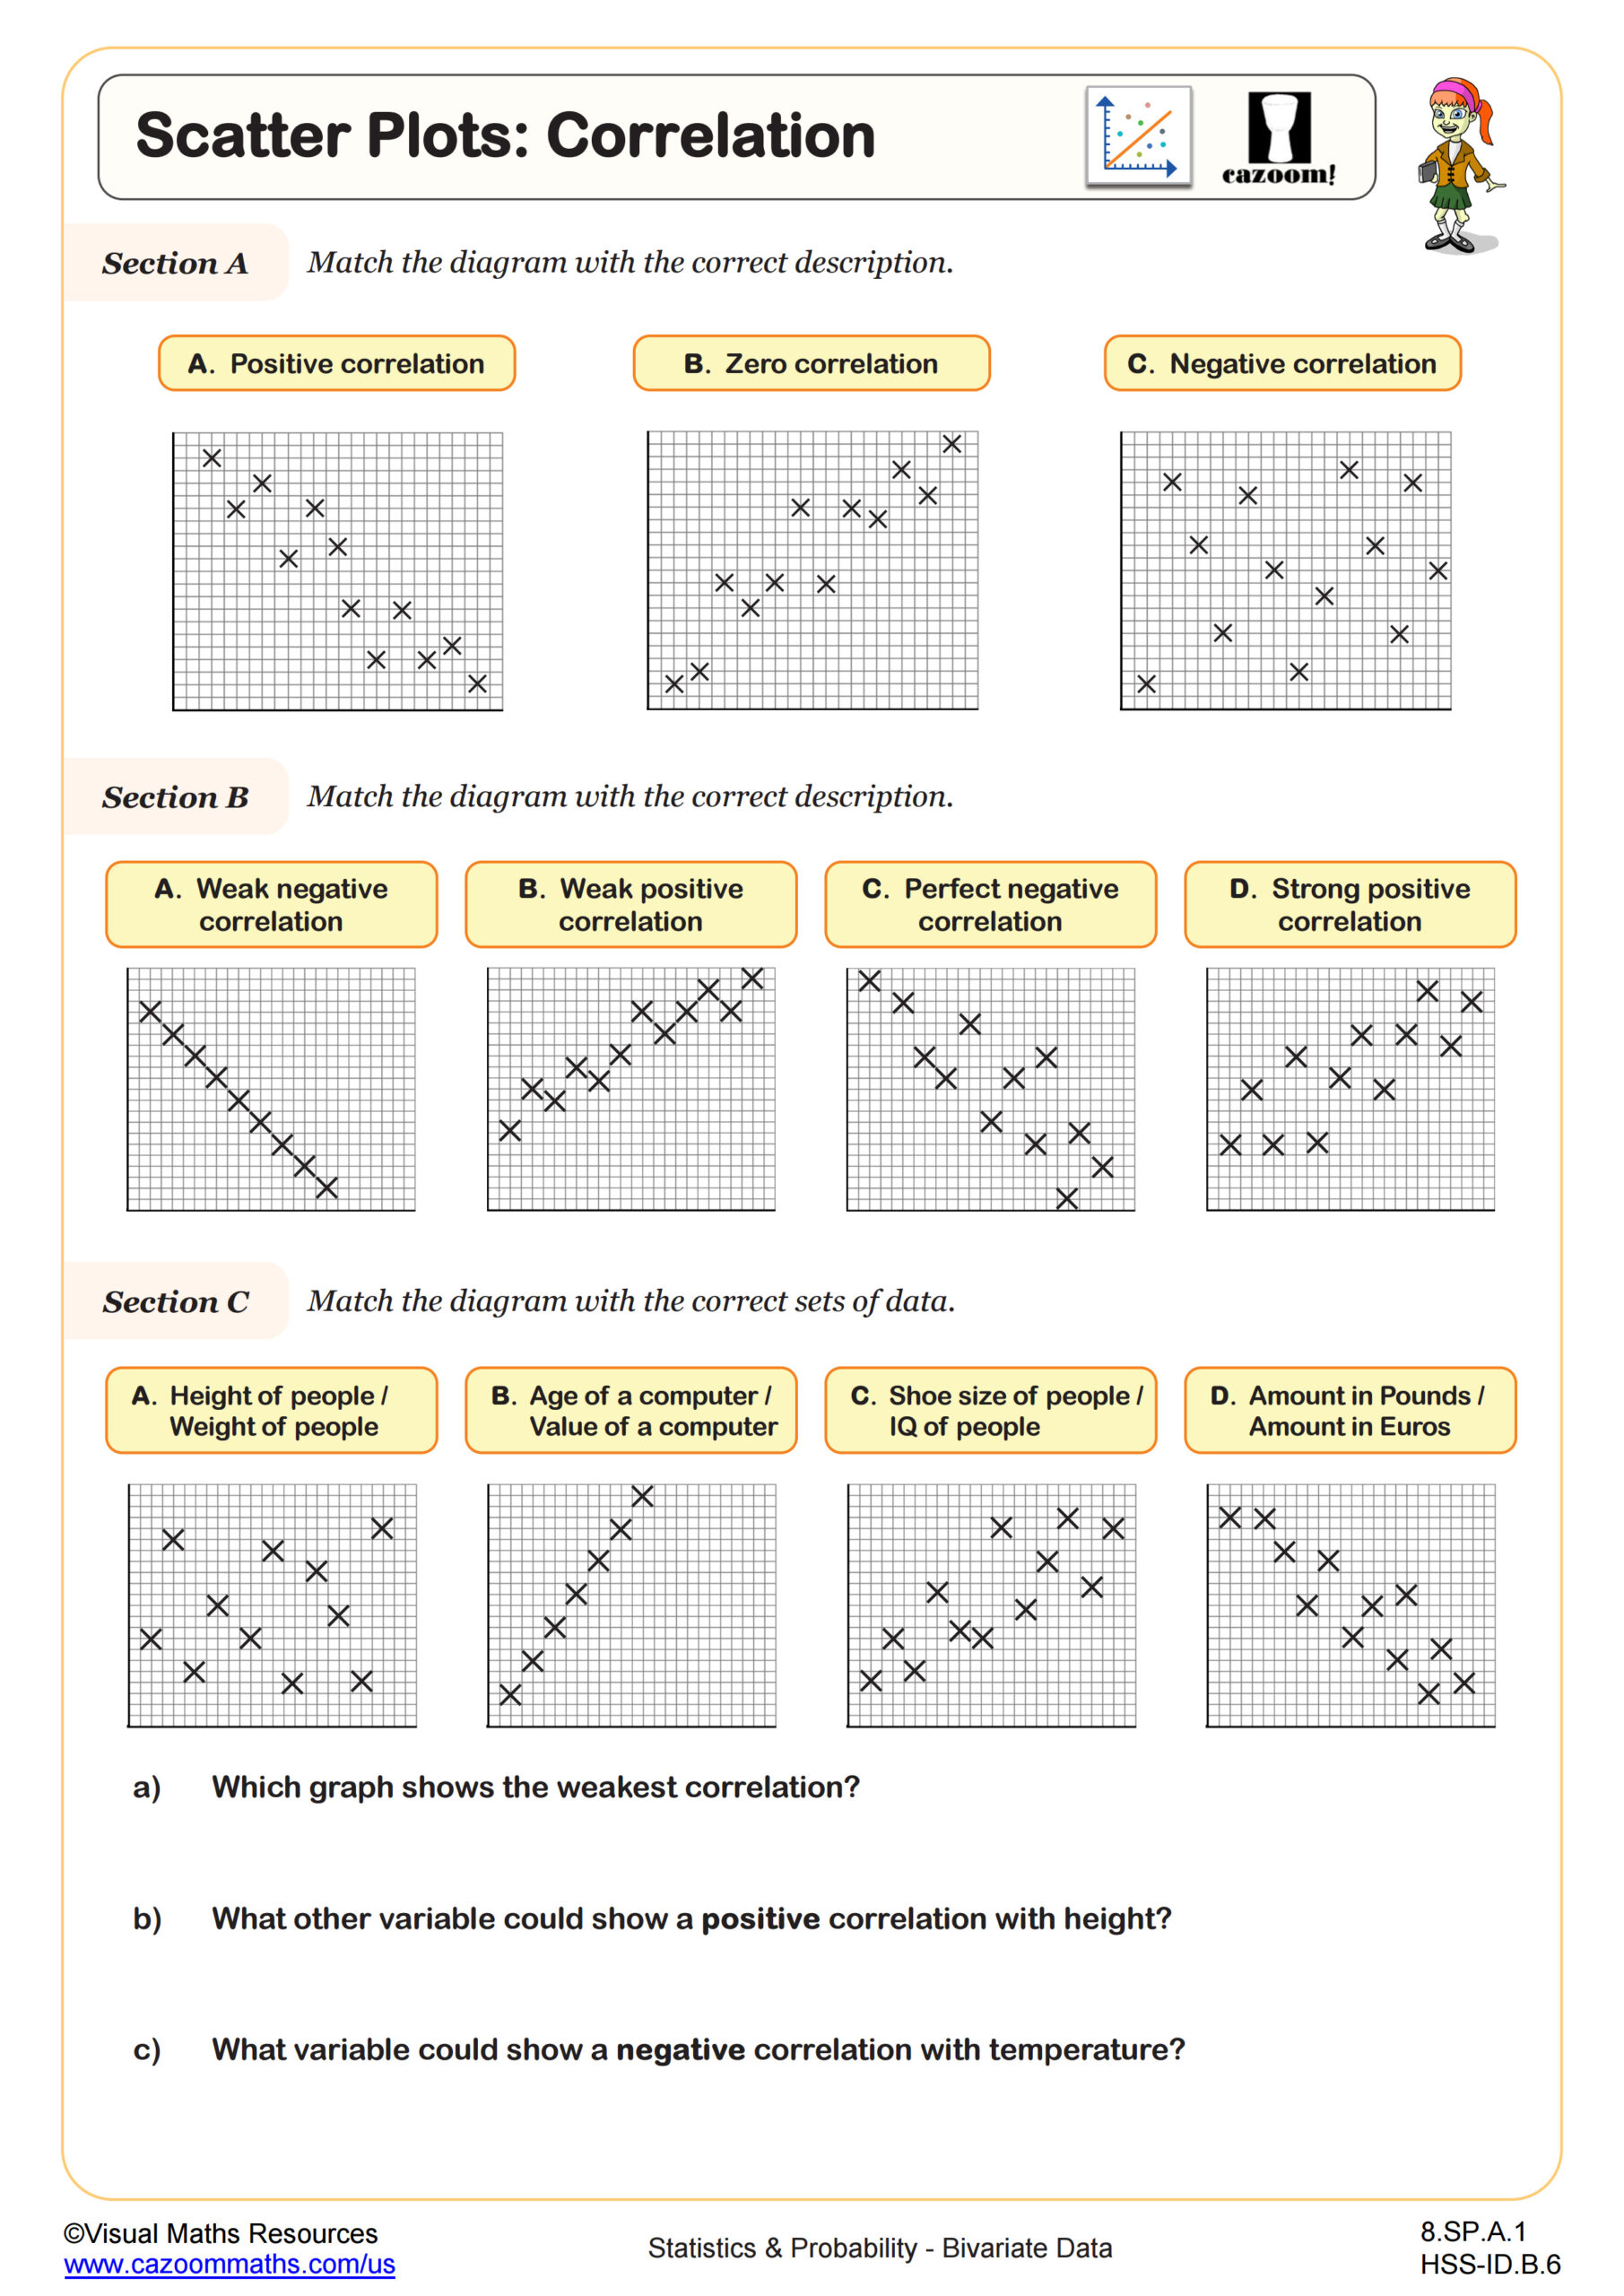
Interpreting scatter plots worksheet materials teach students to analyze data patterns and make evidence-based conclusions, skills that transfer directly to scientific inquiry and data-driven decision making. Students learn to identify outliers, describe correlation strength, and explain what scatter plot patterns suggest about relationships between variables.
Many teachers observe that students initially focus only on whether points go "up or down" without considering correlation strength or outlier impact. Quality scatterplot worksheet pdf resources include questions that push students beyond basic pattern recognition to deeper analysis of what the data relationships actually mean in context.
What makes scatter plot questions and answers pdf materials effective for classroom use?
Effective scatter plot worksheet with answers pdf materials provide immediate feedback that helps students identify misconceptions before they become ingrained. Answer keys should include not just final answers but explanation of correlation types and reasoning behind trend interpretations.
Teachers report that having scatter plot practice materials with detailed answer explanations saves significant grading time while improving student understanding. The pdf format allows teachers to project answers for whole-class discussion or provide individual copies for self-assessment, making these resources adaptable to different instructional approaches and classroom management styles.
Real-Life Uses of Scatter Graphs
Scatter plots are used in many fields—from sports and fitness to business and science. For example, tracking hours spent exercising and calories burned helps people see if one affects the other. Students might also explore data like height vs. shoe size, or study time vs. grades. Our worksheets show how these skills apply in everyday life and help students become better problem solvers.
What Should Students Know Before Learning Scatter Graphs?
Before using scatter graphs, students should:
• Know how to plot points on a coordinate grid
• Understand x- and y-axes
• Be able to read data tables
• Recognize number patterns
These foundational skills prepare students to explore how two variables relate in a graph.