Two-Way Tables and Pictograms Math Worksheets
All worksheets are created by the team of experienced teachers at Cazoom Math.
What topics are covered in two-way tables worksheets with answers?
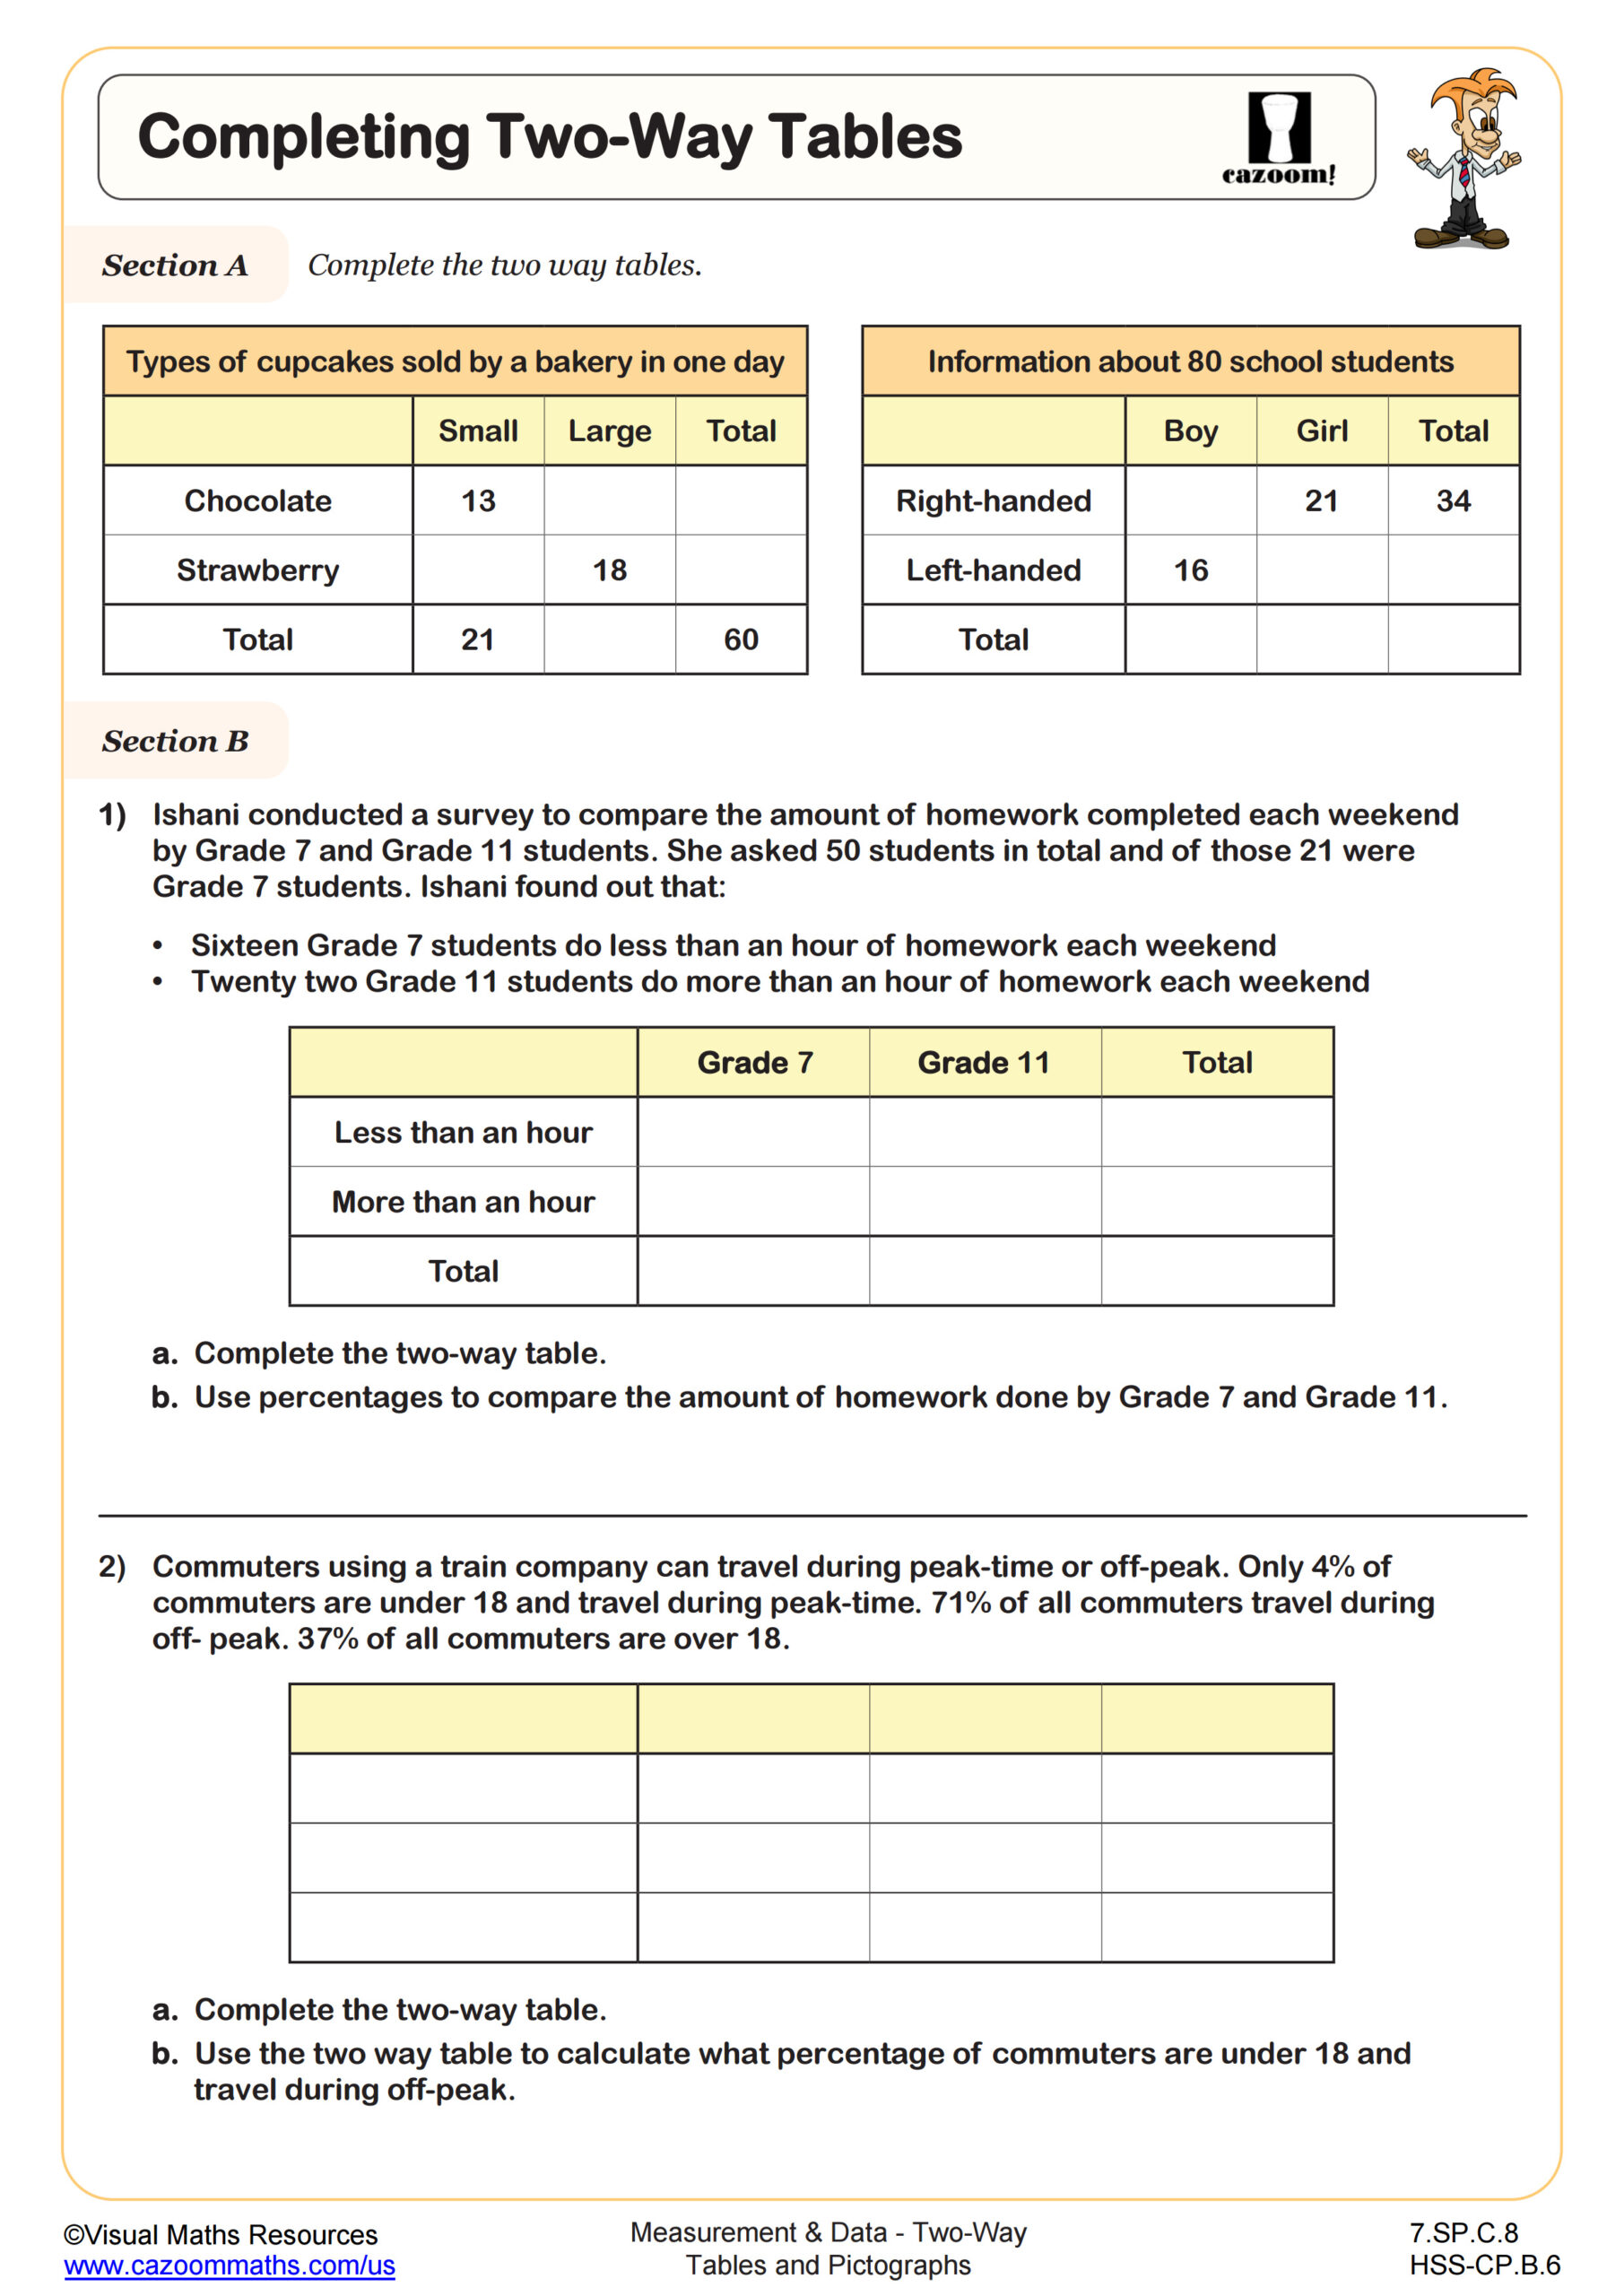
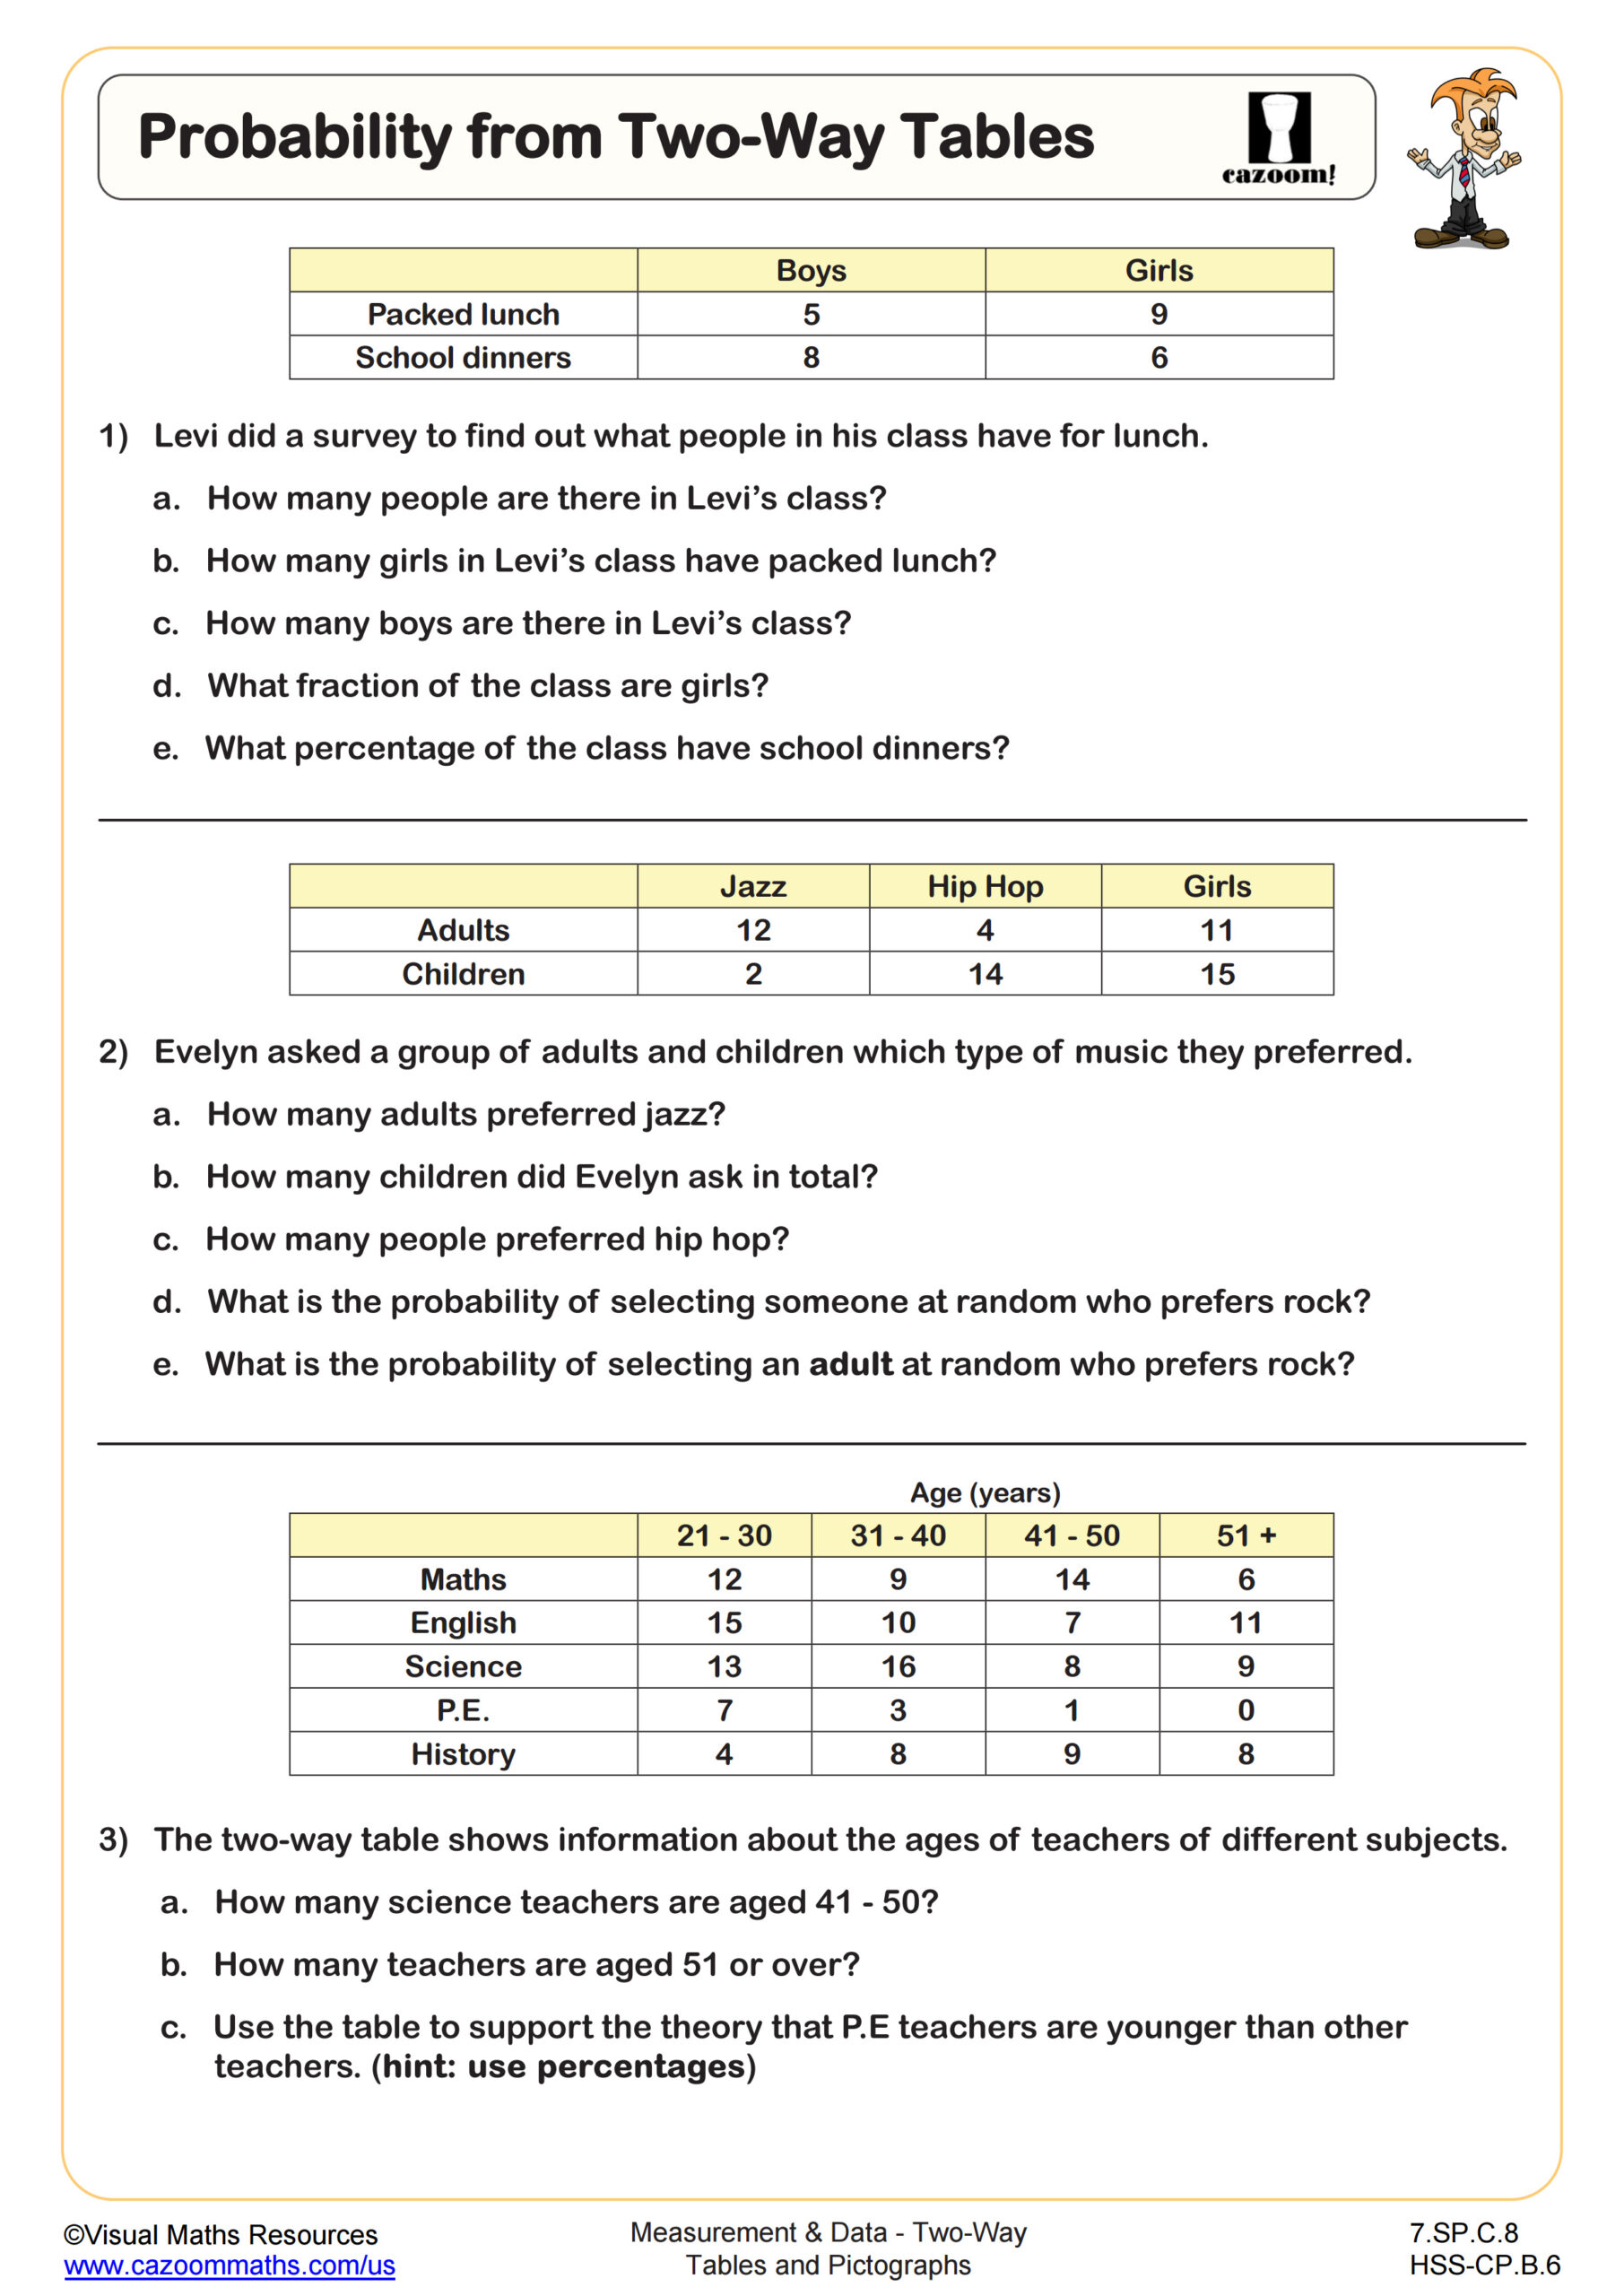
Two-way tables worksheets with answers typically cover constructing frequency tables, calculating marginal and joint frequencies, determining conditional probabilities, and analyzing independence between categorical variables. These align with Common Core standards for statistics and probability across middle and high school grade levels, particularly focusing on data representation and interpretation skills.
Teachers frequently observe that students need extensive practice distinguishing between P(A|B) and P(B|A) when working with conditional probability problems. The answer keys help students identify where they've confused the order of conditions, which is particularly common when interpreting survey data or experimental results involving two categorical variables.
Which grade levels use two-way tables probability worksheets?
Two-way tables probability worksheets typically appear in middle school (grades 6-8) for basic data organization and extend through high school statistics courses. Elementary introduction may occur in upper grades when students work with simple pictograms and frequency charts, while advanced applications involving chi-square tests appear in AP Statistics or dual enrollment courses.
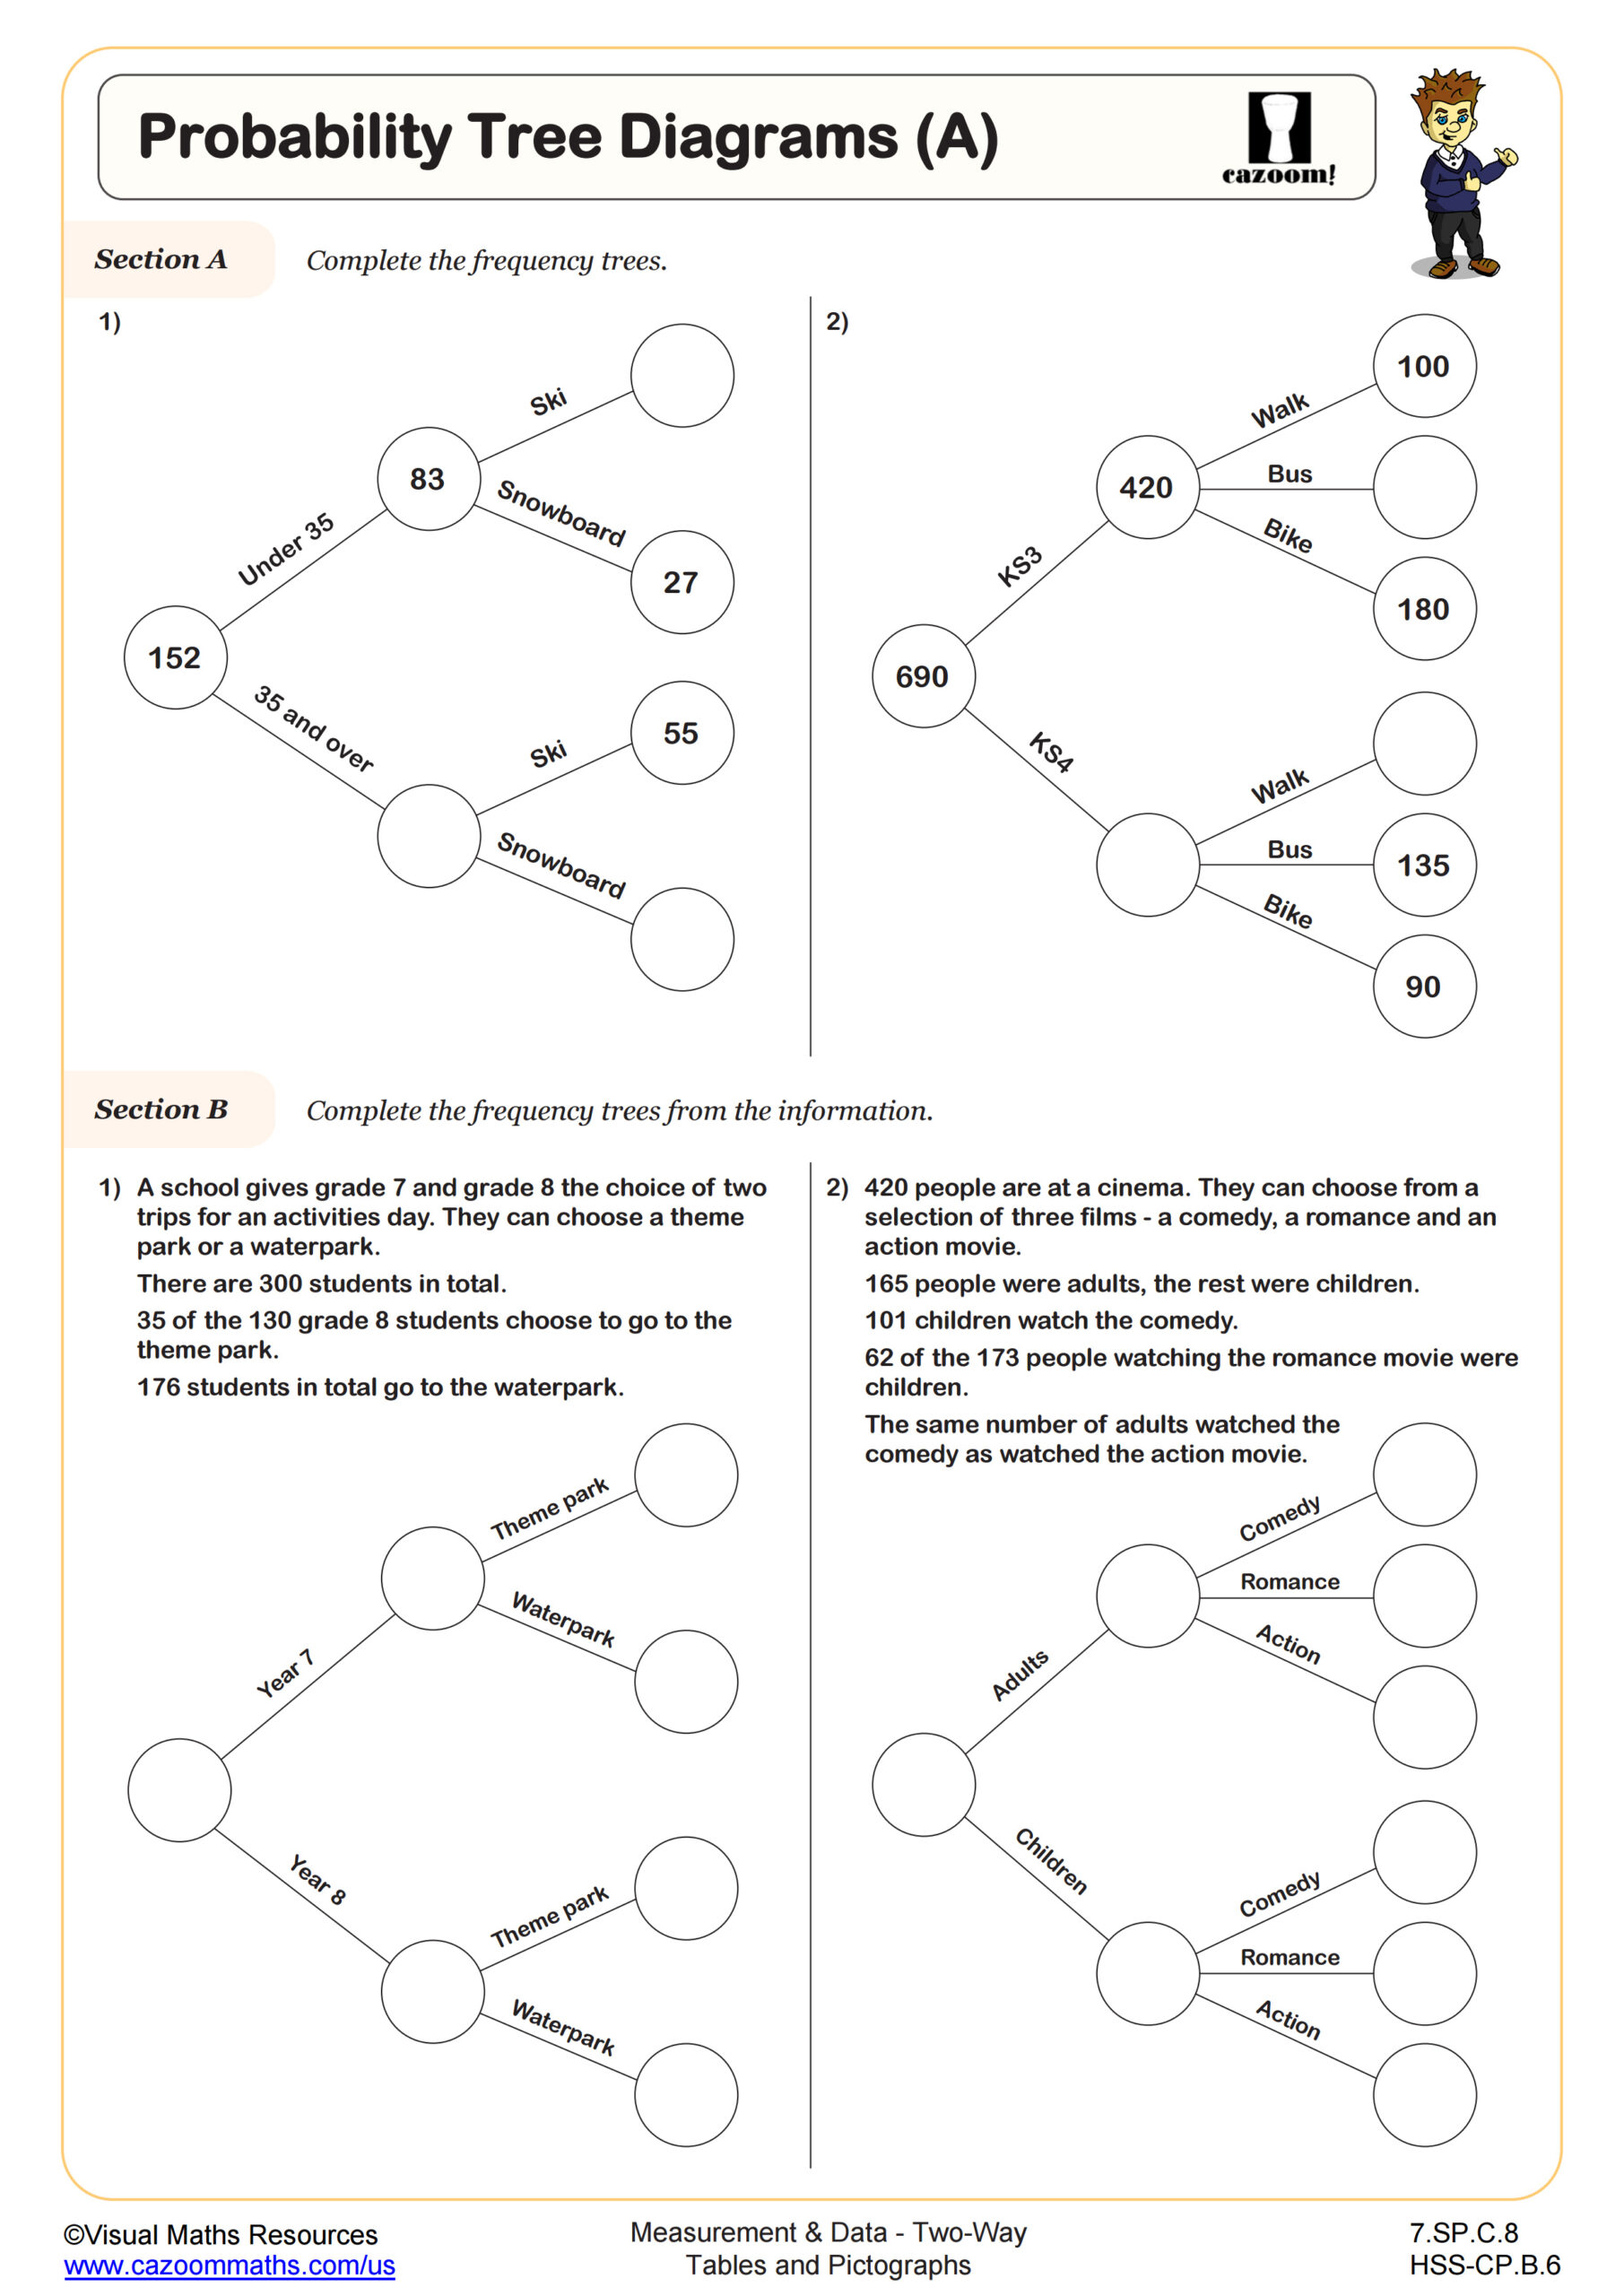
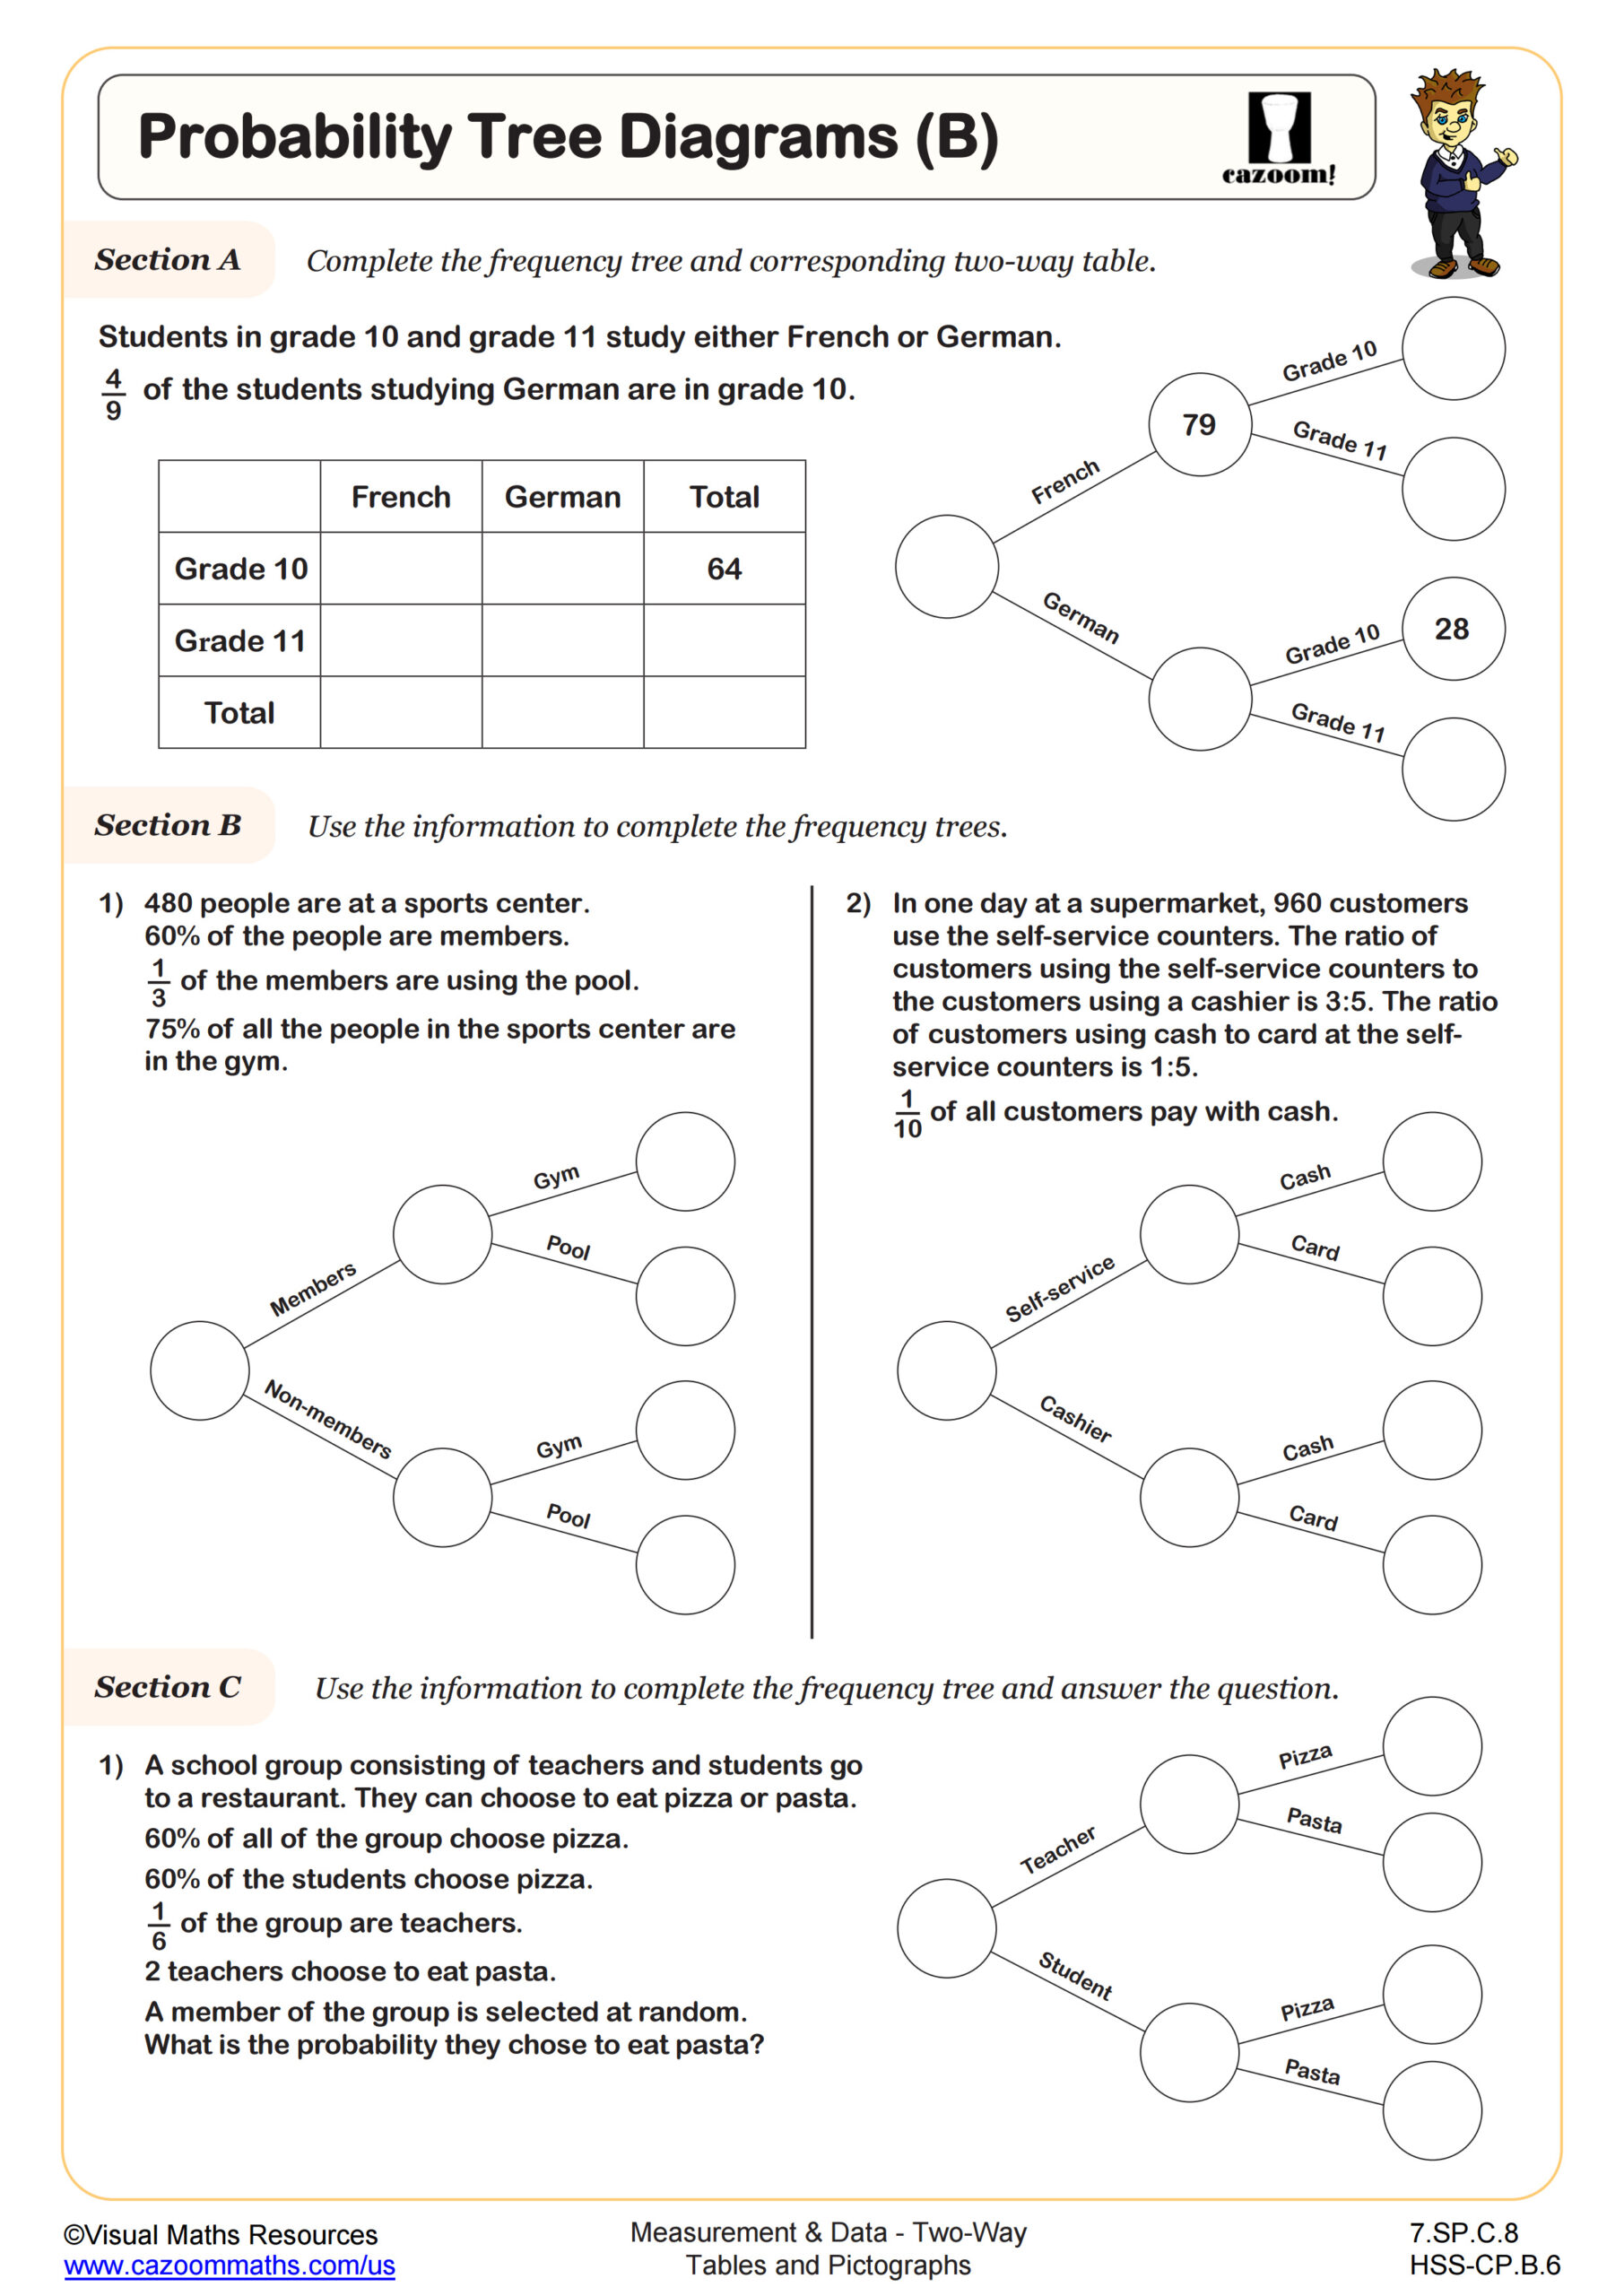
The progression moves from concrete examples using familiar contexts like favorite sports or pet preferences in middle grades to abstract probability scenarios in high school. Teachers notice that students who master basic two-way table construction in grade 8 show stronger performance in high school statistics, particularly when analyzing experimental data or conducting hypothesis tests.
How do pictograms connect to two-way tables instruction?
Pictograms serve as visual stepping stones toward understanding two-way tables by representing categorical data using symbols or images. Students often find pictograms more accessible initially because the visual elements help them grasp the concept of organizing data by two different characteristics before transitioning to numerical frequency tables.
Many teachers use pictograms as scaffolding tools, having students convert pictogram data into two-way tables to reinforce the connection between visual and numerical data representation. This approach helps students who struggle with abstract number relationships by providing concrete visual anchors, particularly effective for students who benefit from visual learning strategies when analyzing categorical data relationships.
How can teachers use these worksheets for independent practice effectively?
Teachers find success using two way tables independent practice worksheets by implementing a gradual release model, starting with guided examples before assigning independent work. The answer keys allow for immediate feedback, which is crucial since errors in early steps compound throughout multi-step probability calculations.
Effective implementation involves having students work through problems in pairs initially, then progressing to individual practice once they demonstrate understanding of basic concepts. Teachers recommend using the PDF format for homework assignments since students can easily reference completed examples while working independently, and parents can support learning using the provided answer keys.
What Should Students Know Before Starting?
Before using these worksheets, students should be able to count and group items, read and compare numbers, understand simple tables and visual data, and use tally marks or symbols to represent values. These basic skills provide a strong foundation for working with two-way tables and pictograms. Our worksheets build on this prior knowledge with clear, structured, and engaging activities that help students organize and interpret data with confidence.