Back to:
Shading Regions Examples RESOURCE (FREE DOWNLOAD)
Shading Regions Examples RESOURCE DESCRIPTION
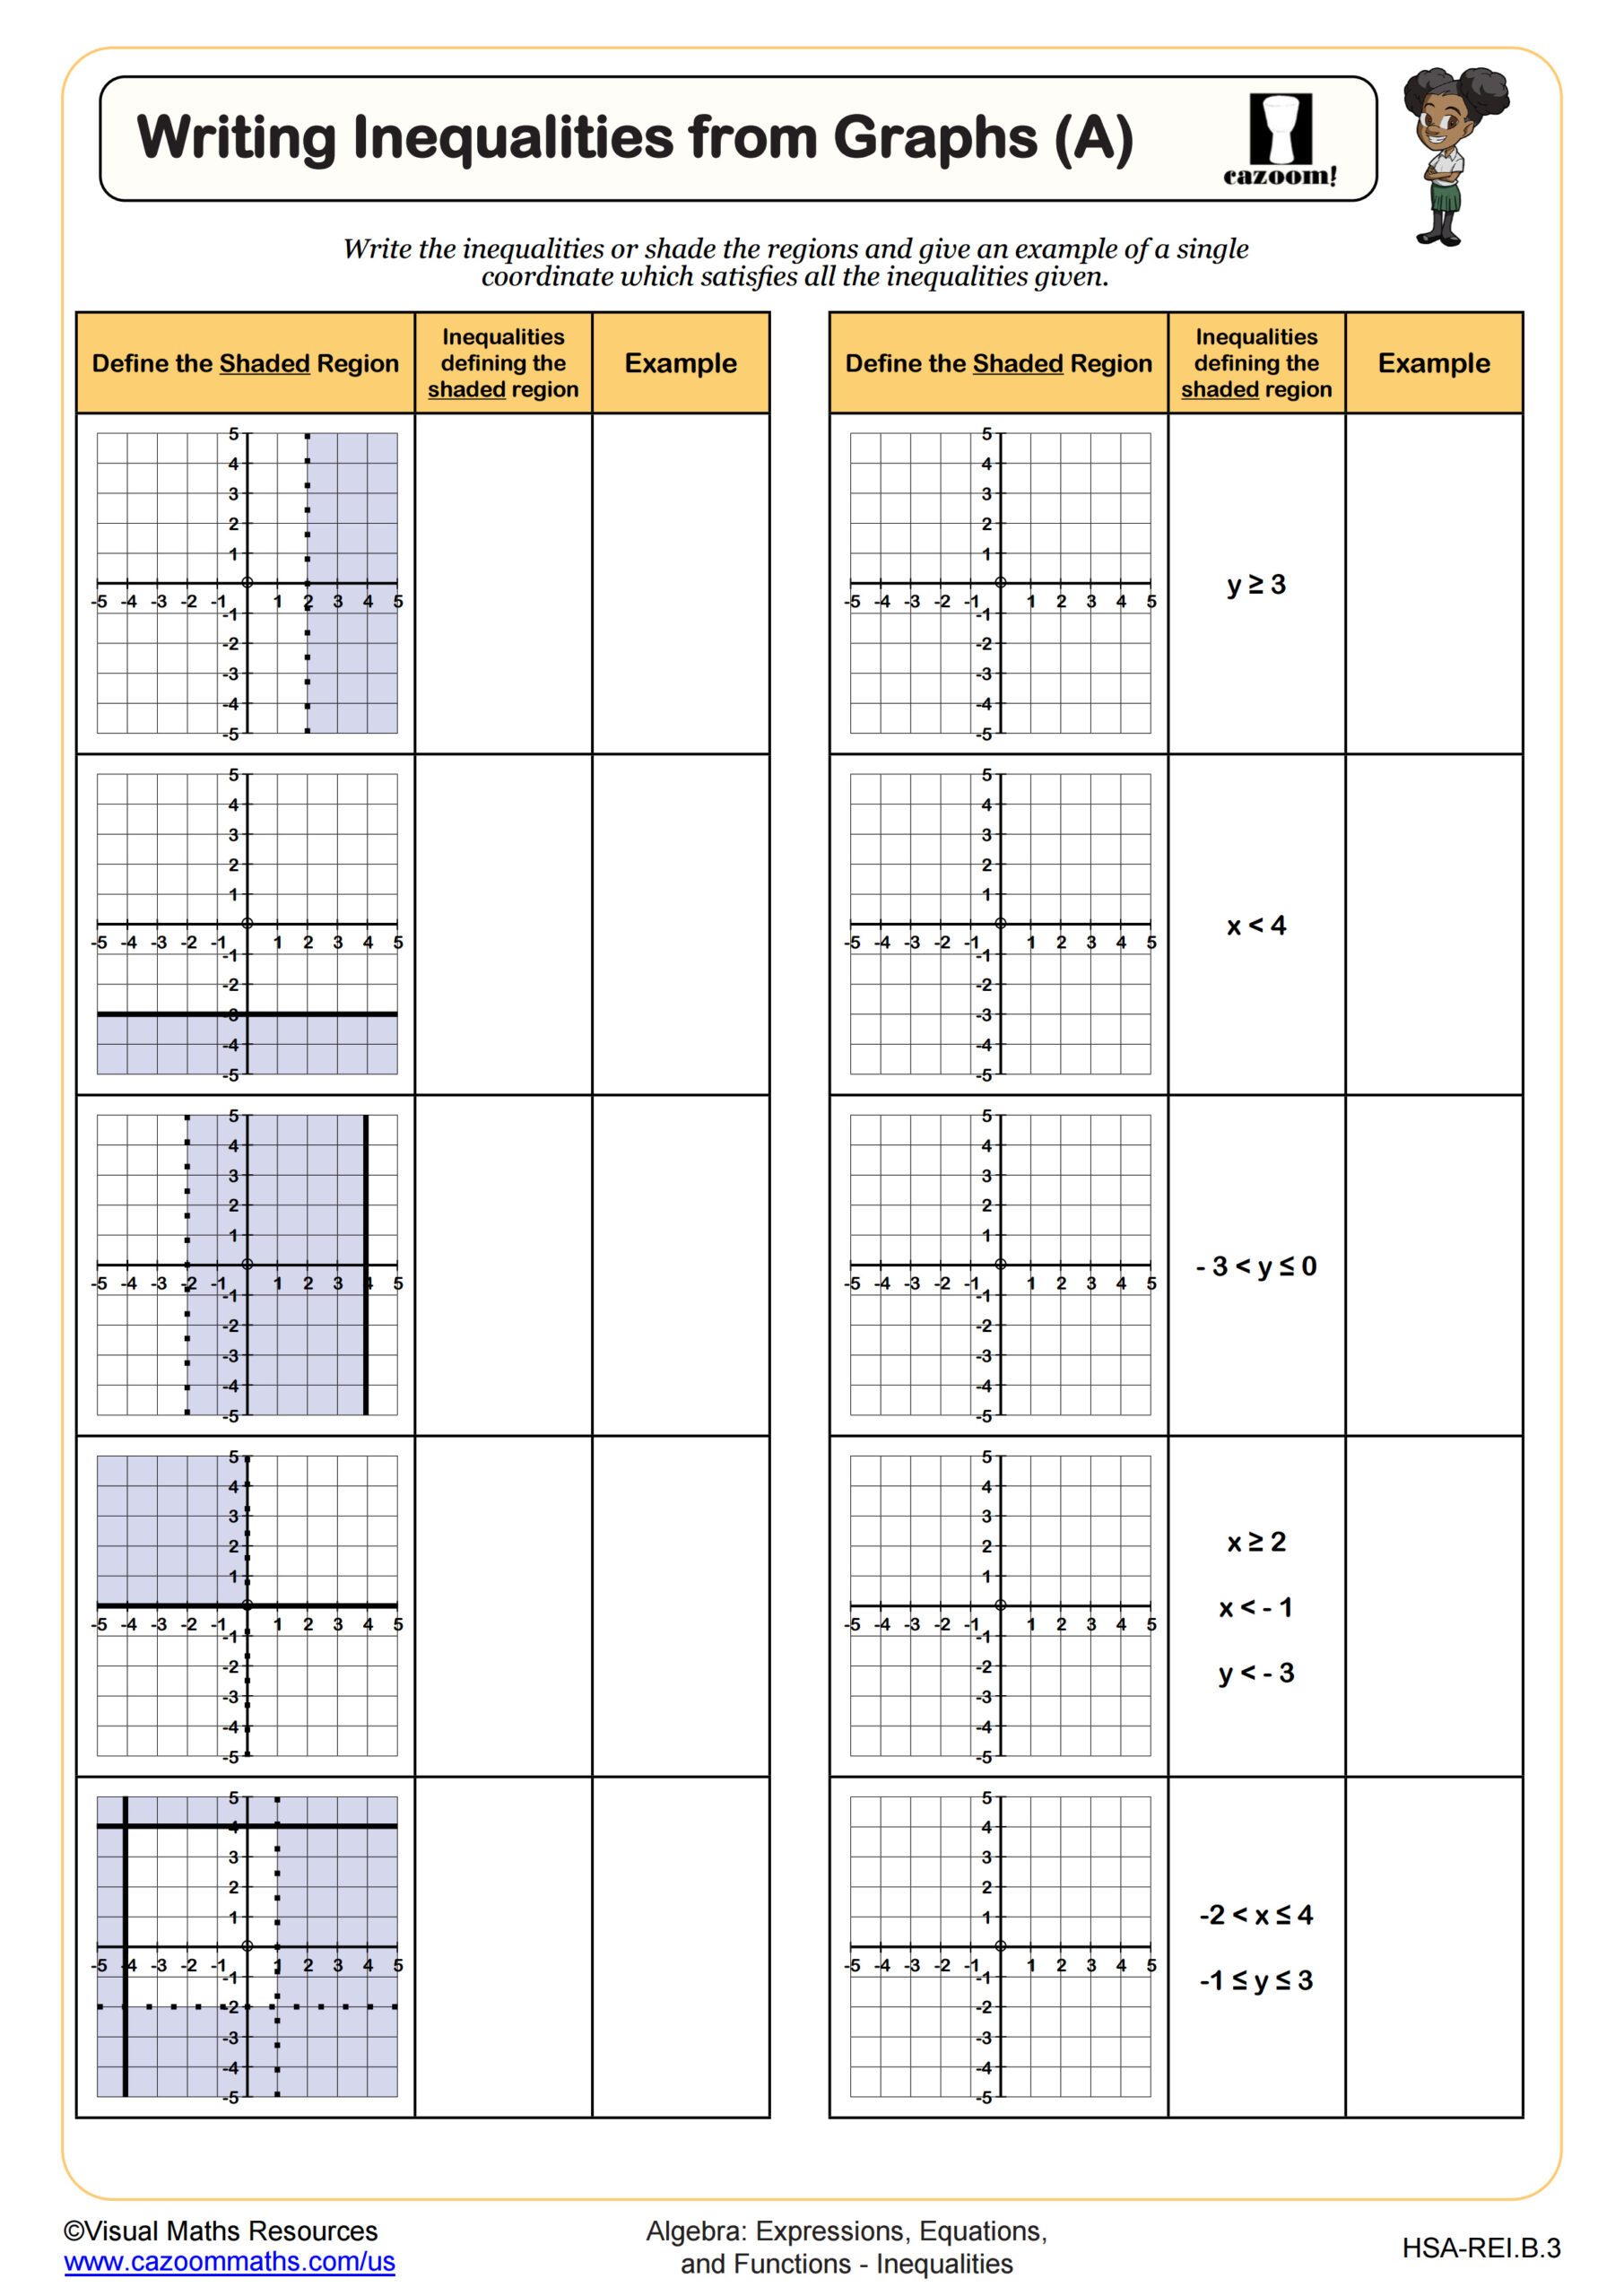
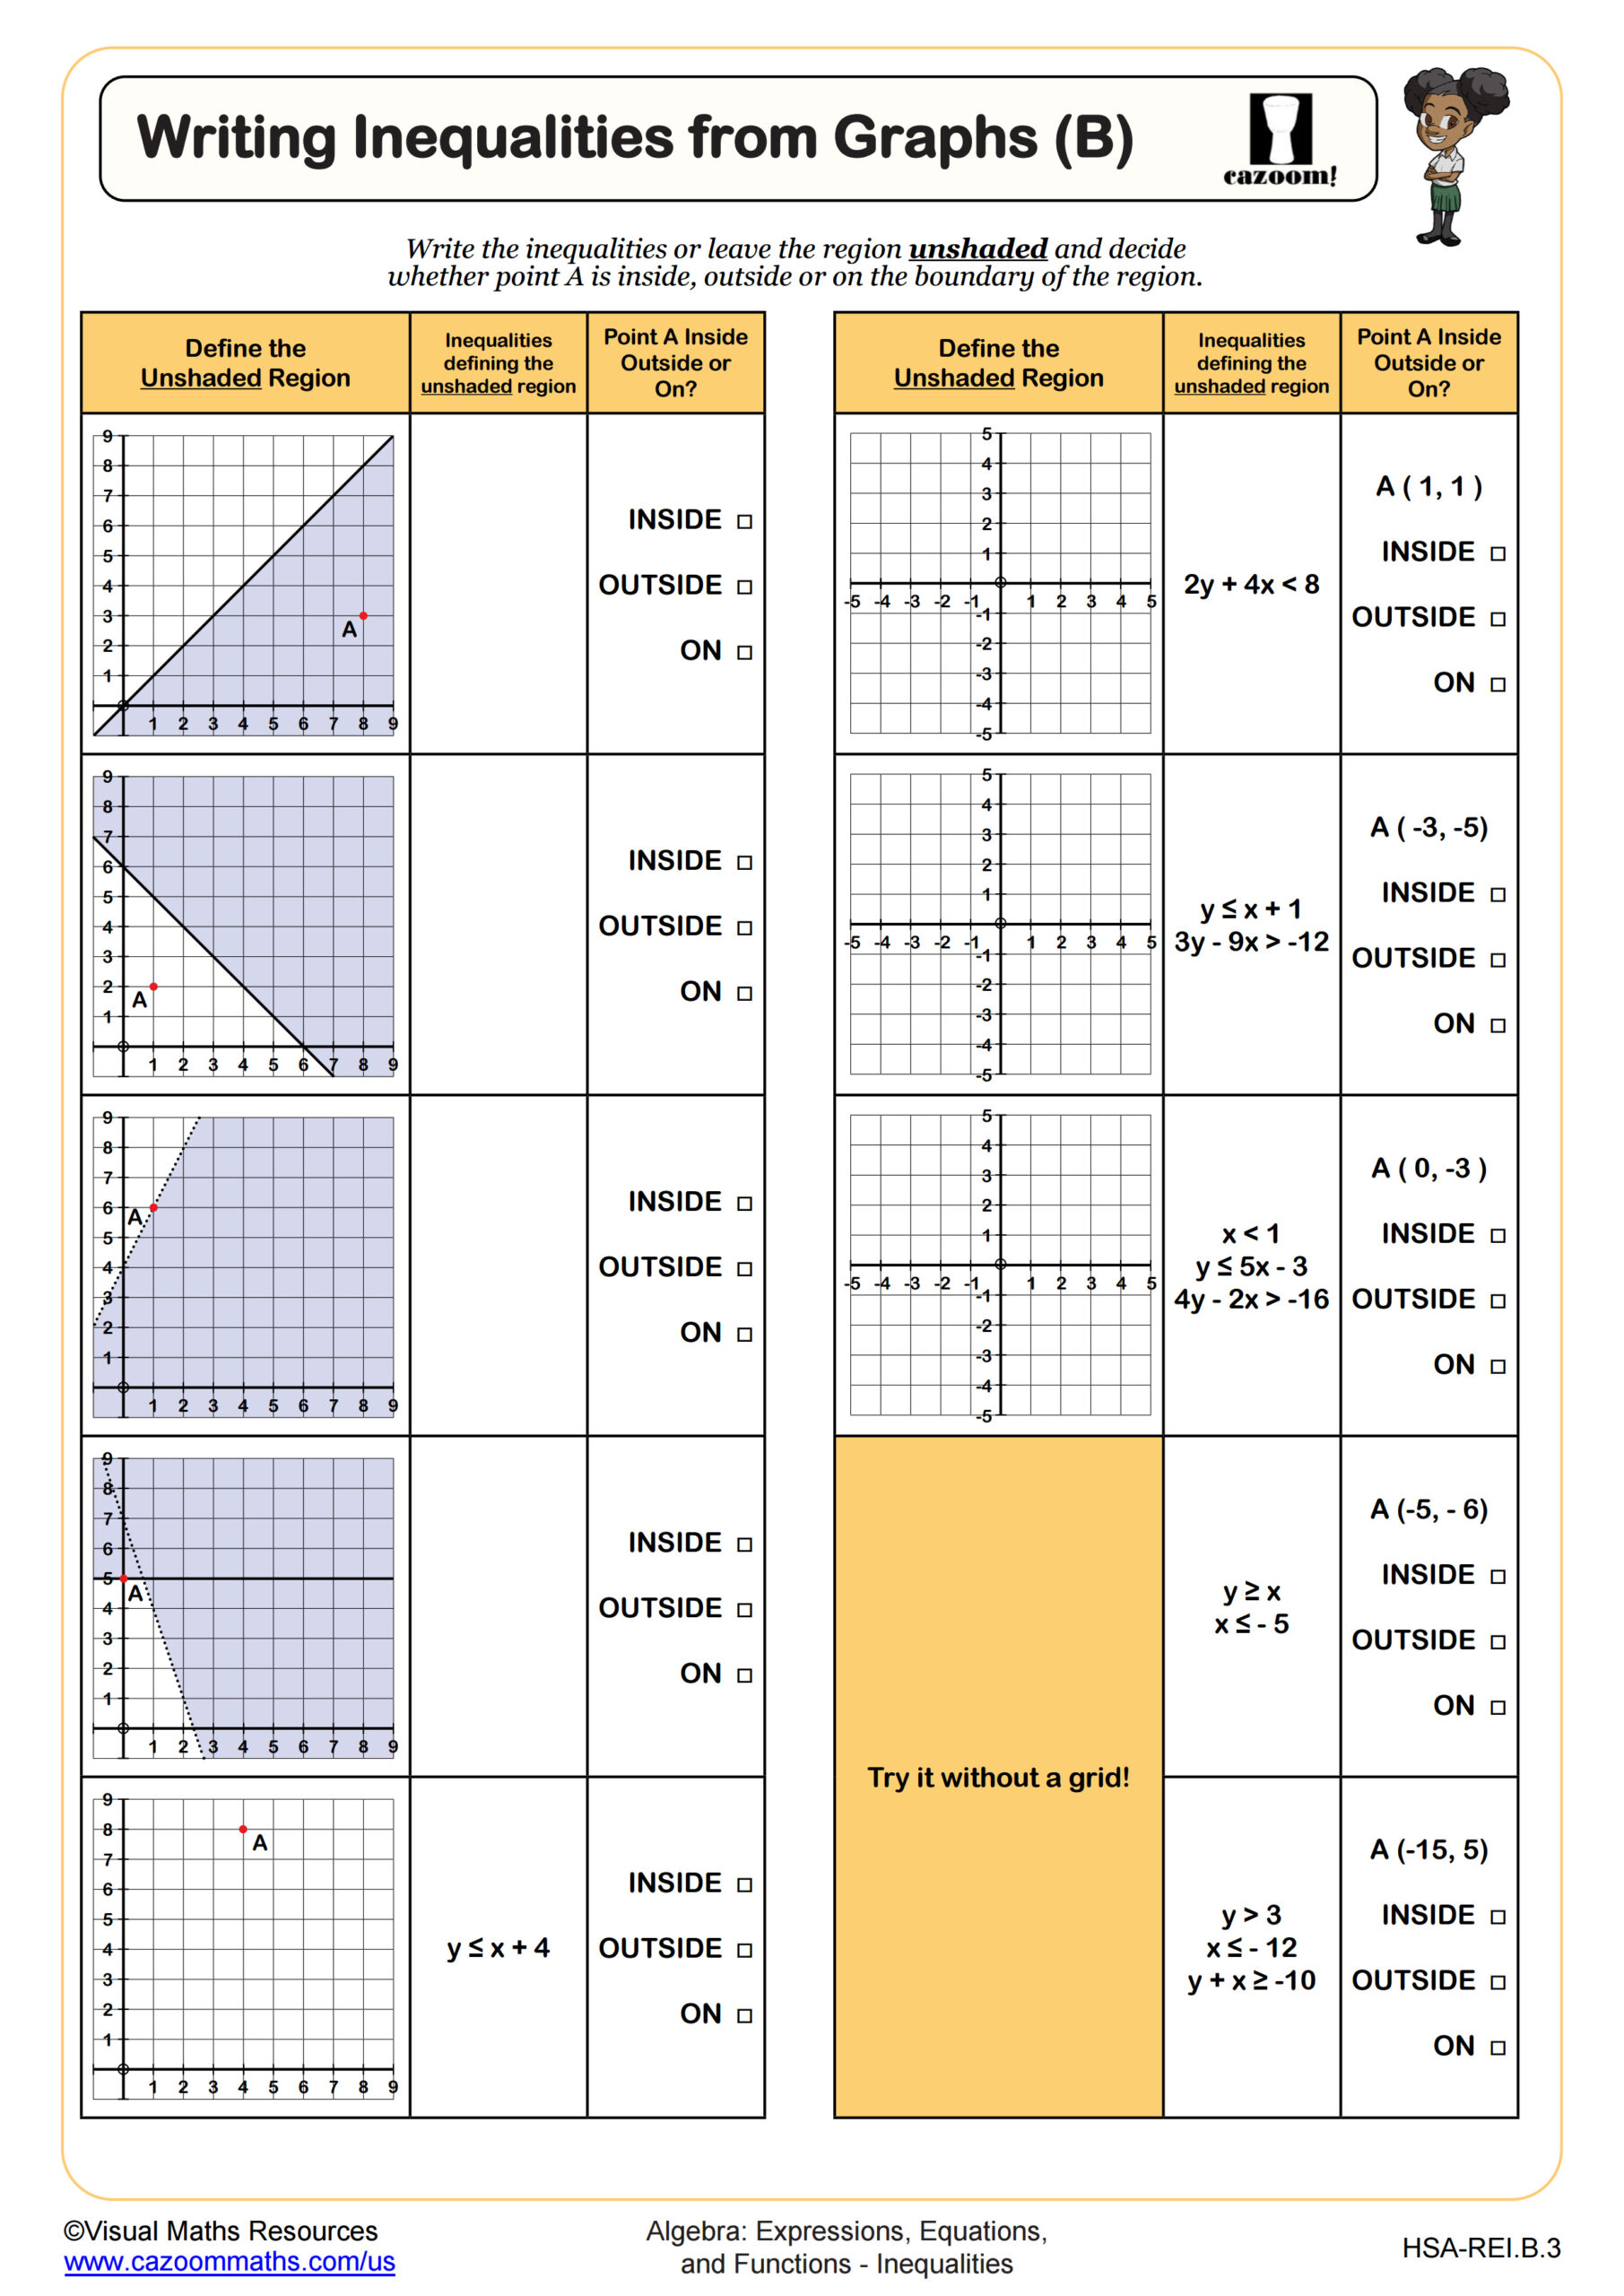
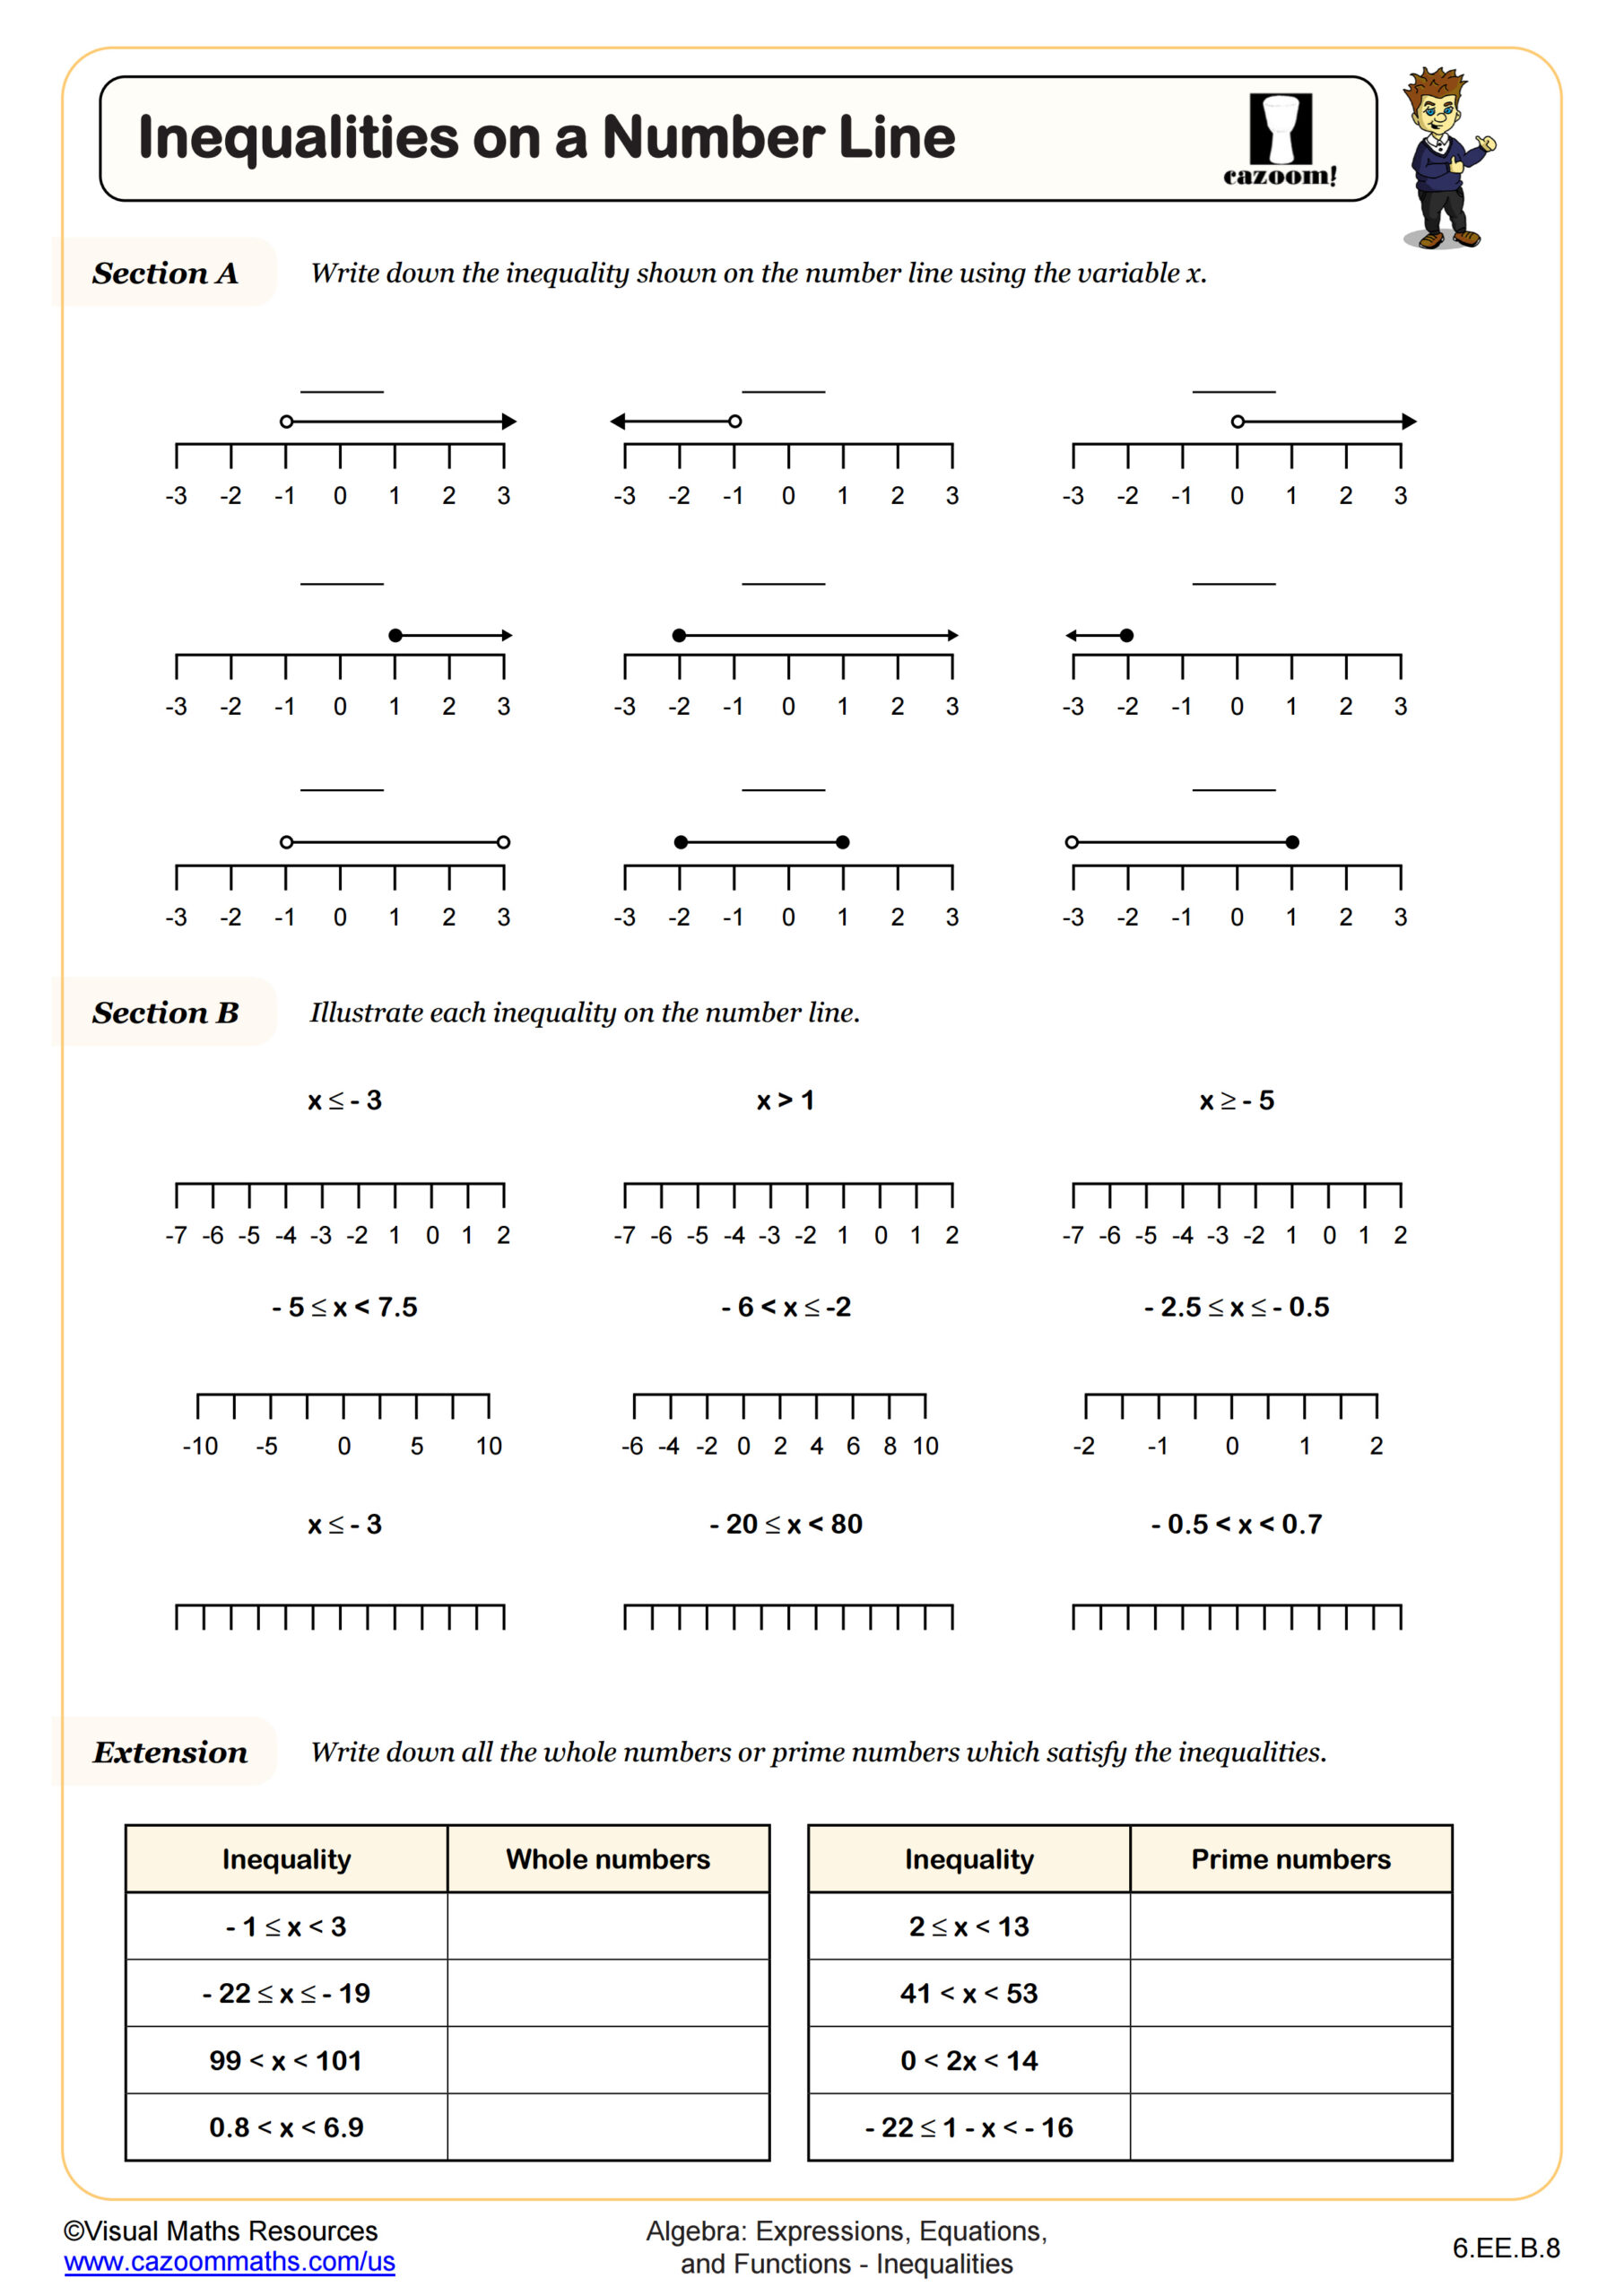
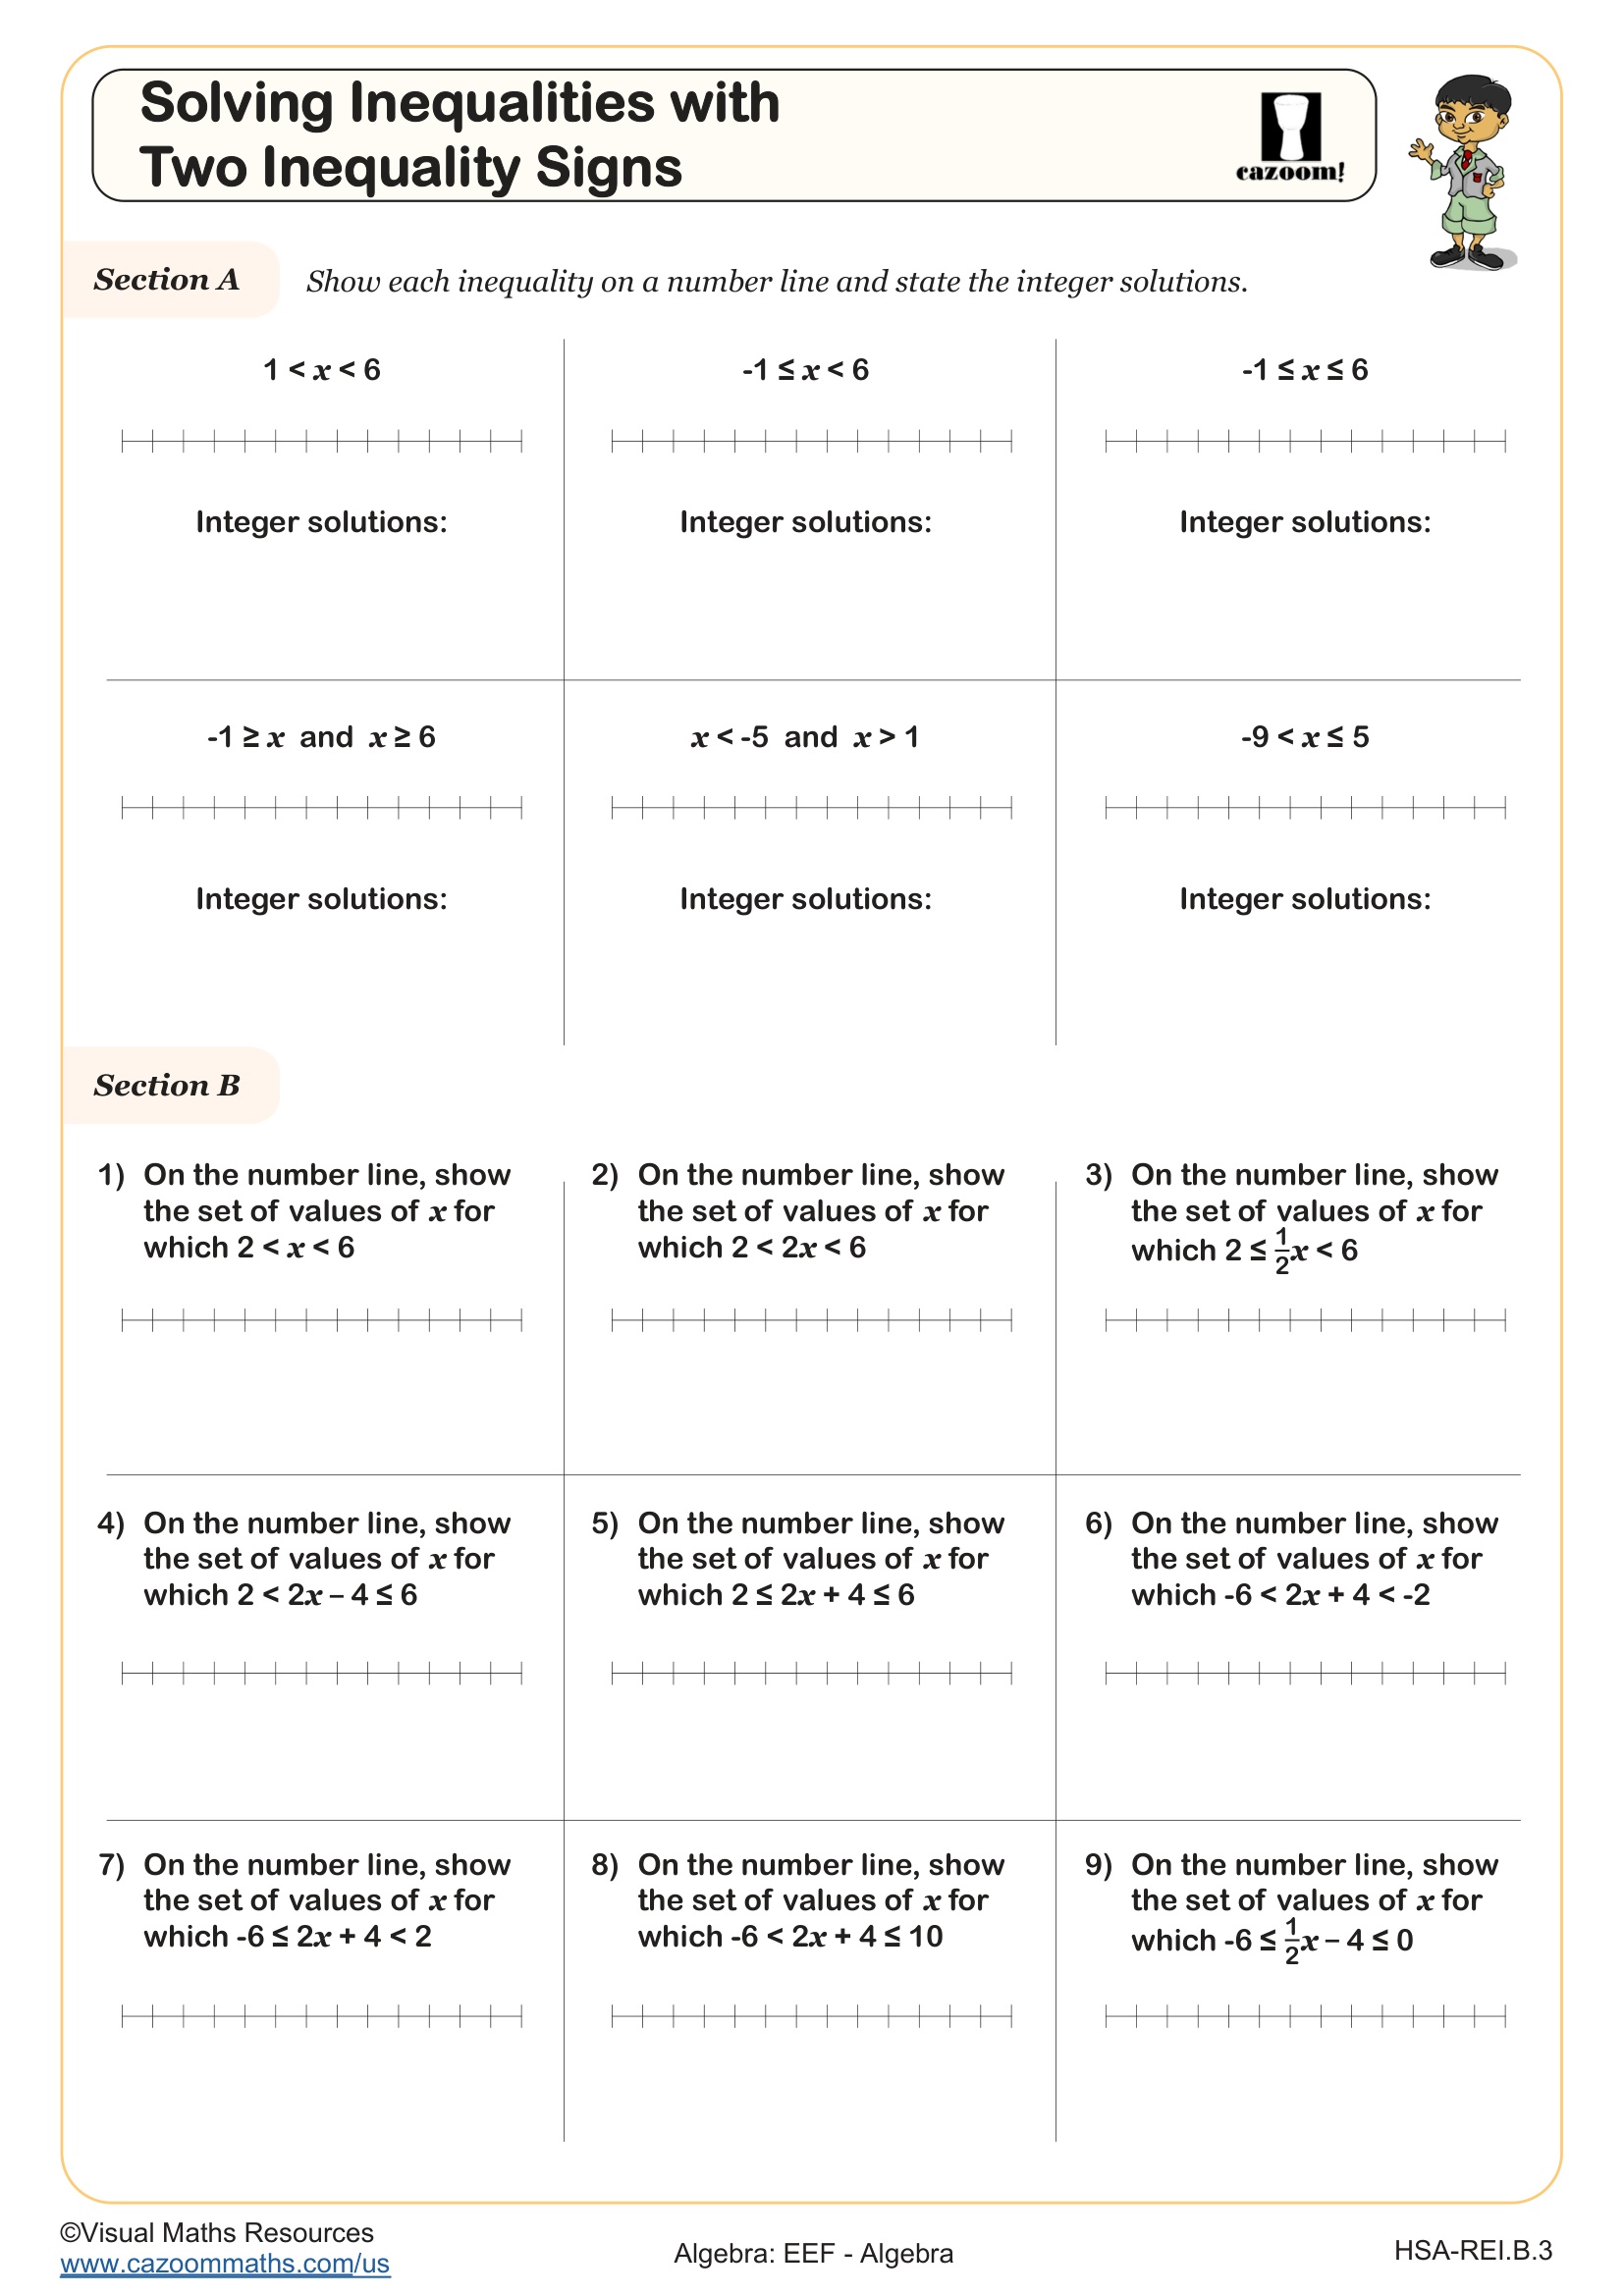
This resource provides examples of shading regions for inequalities in two dimensions, showing different line styles for strict and non-strict inequalities.
All worksheets are created by the team of experienced teachers at Cazoom Math.

RELATED TO Shading Regions Examples
Shading Regions Examples
What is the resource?
This PDF focuses on representing inequalities as shaded areas on graphs. This skill is best for middle and high school learners.
Why are shading regions important?
Inequalities often model real-life situations with various possible solutions:
- Acceptable ranges: Think of quality control – measurements within a 'good' range.
- Costs & budgets: You might graph price options that meet a maximum cost.
- Data comparison: Showing multiple restrictions at once is clearer on a graph.
Why is the resource helpful?
This resource goes beyond textbook problems. It offers:
- Clear visuals: Step-by-step examples build from single to multiple inequalities.
- Real-life links: Connect shaded regions to scenarios students can grasp.
- Practice variety: Different kinds of questions keep students engaged.
- Visual problem-solving: Offers a tool for tackling tough word problems.
- Printable PDF: Ideal for consolidating skills in class or during Review.
This resource helps bridge the gap between the abstract math of inequalities and their practical applications.
Explore our extensive range of worksheets designed to help your students practice their skills. These resources, available in PDF format, cover a variety of math topics and are easy to download. Check them out here: Math Worksheets.