WORKSHEET OF THE WEEK
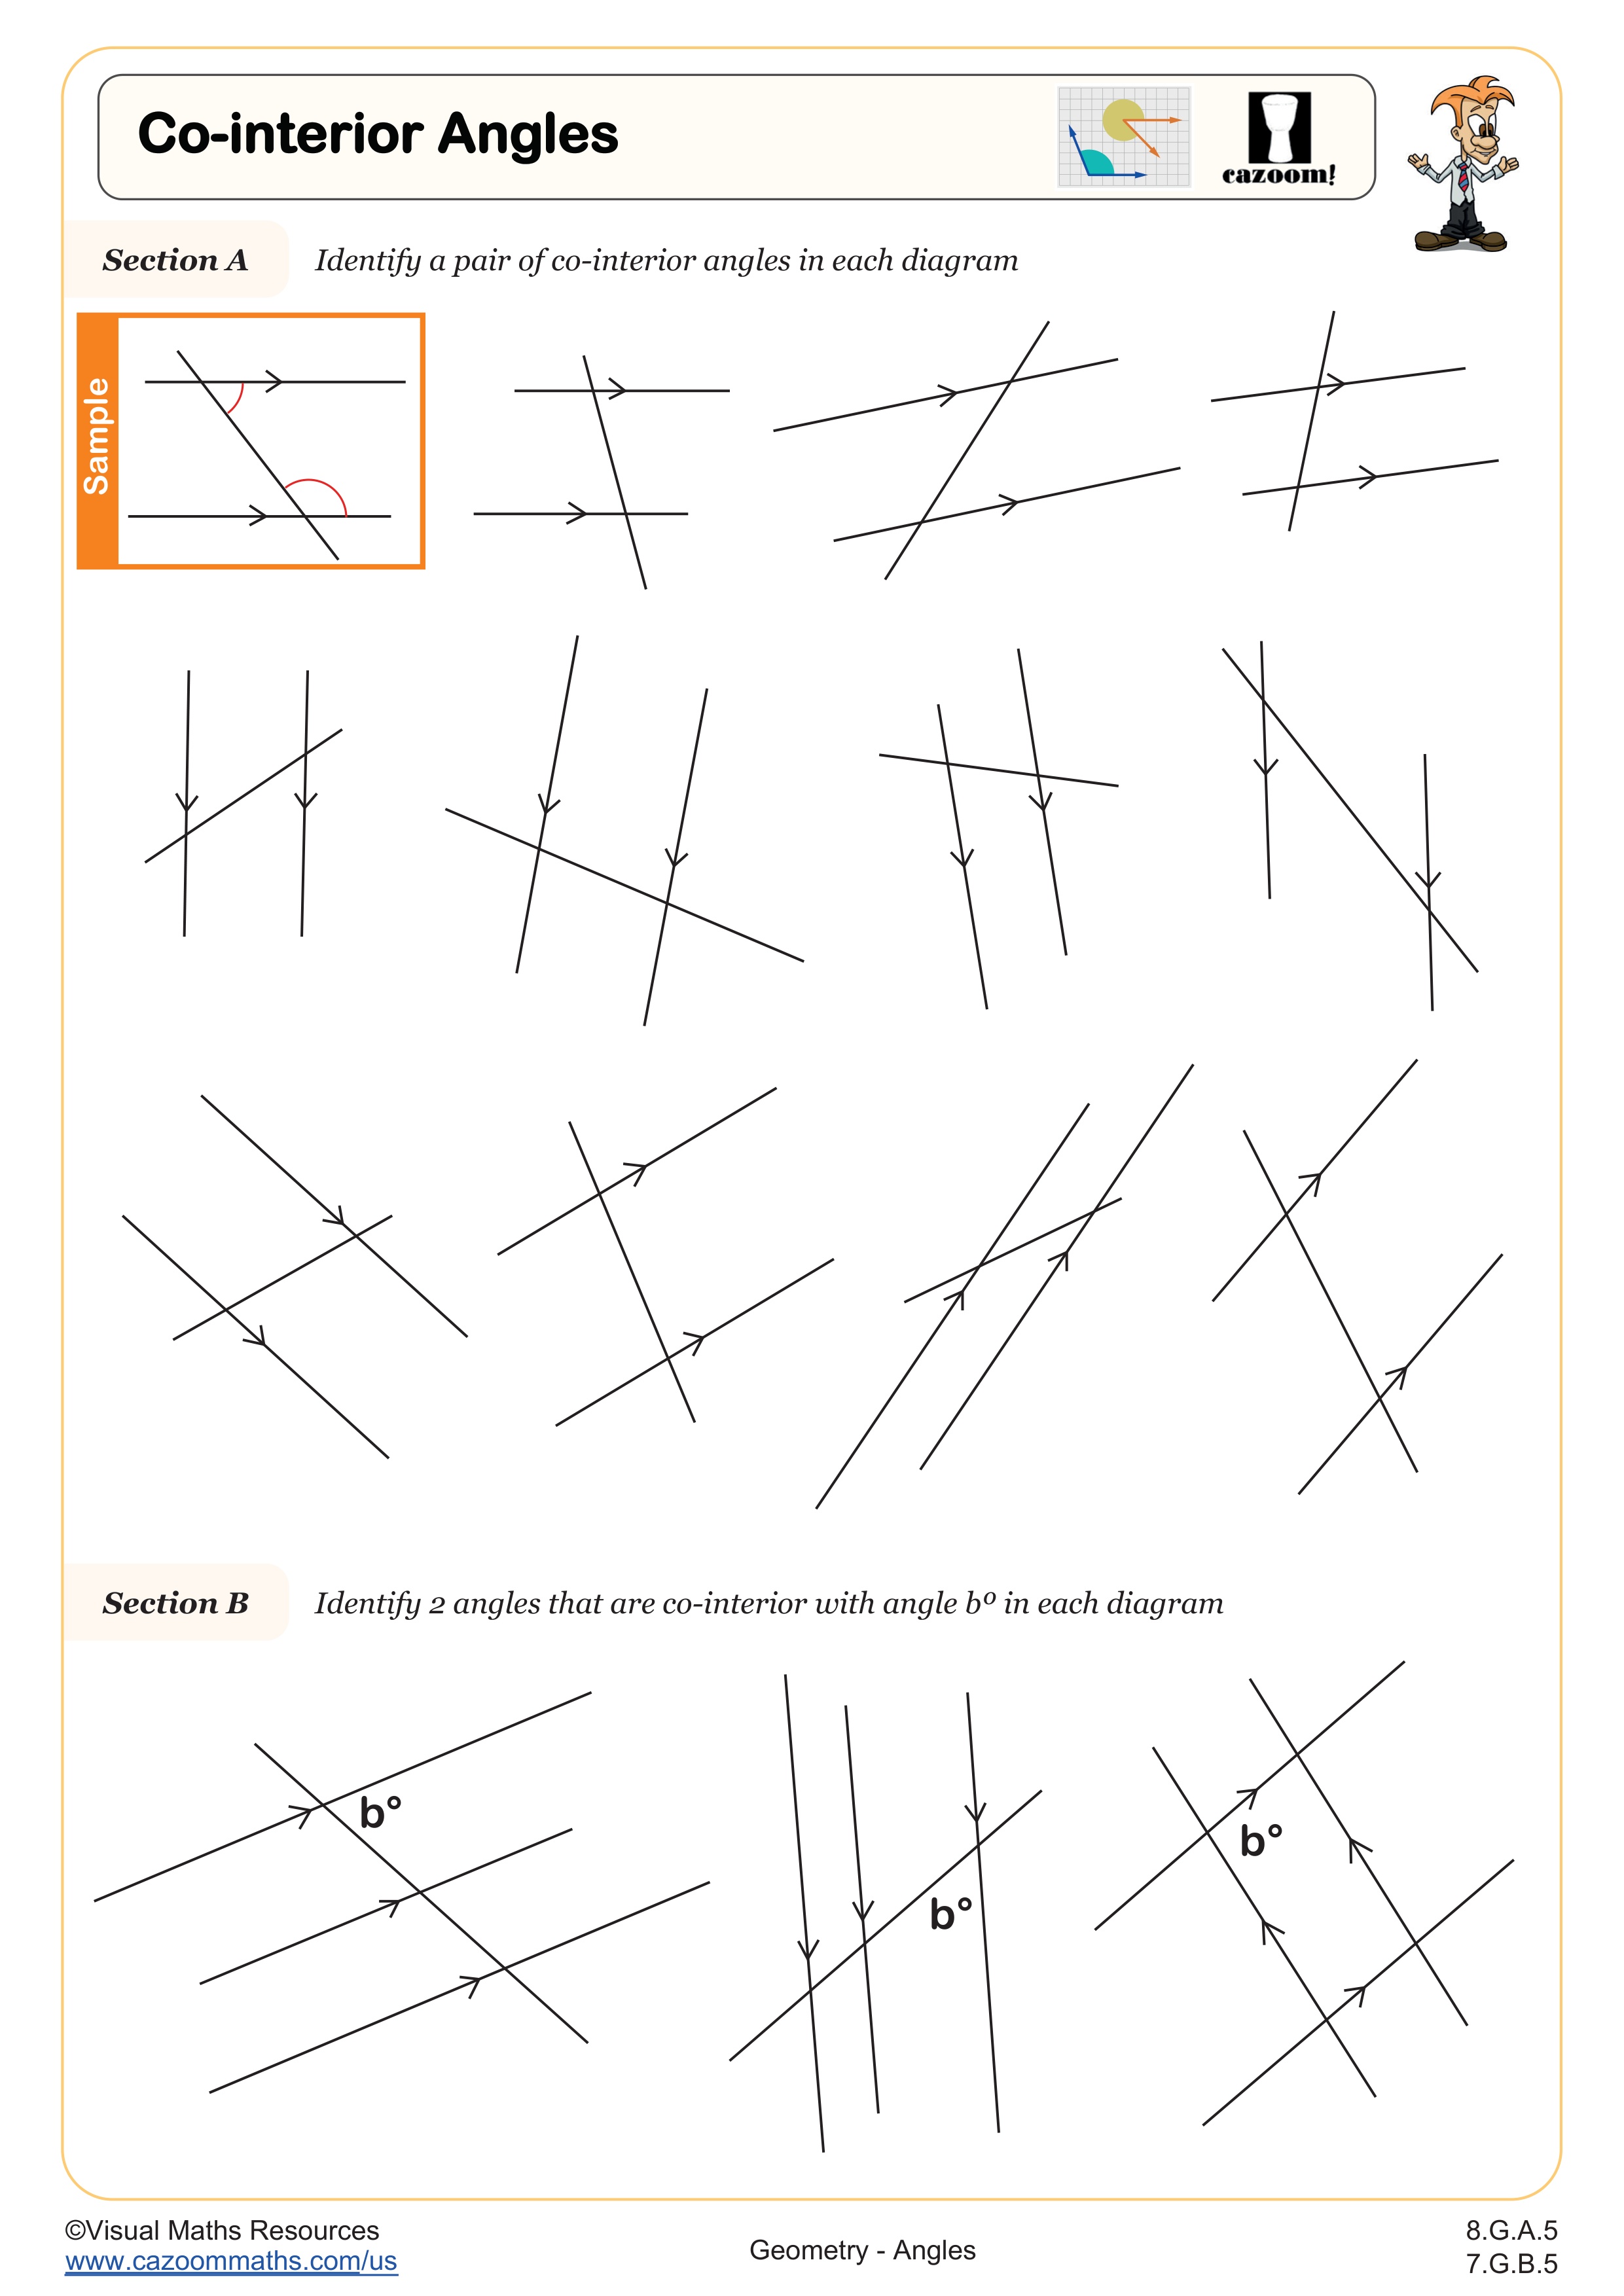
This week's free worksheet focuses on Angles. This brand-new resource is suitable for your middle school students. The Co-interior Angles worksheet helps students identify and calculate co-interior angles formed between parallel lines and a transversal. Students work through recognising co-interior angle pairs, understanding that they add up to 180°, and applying this to find missing angles in increasingly complex diagrams.
DOWNLOAD THE WORKSHEET OF THE WEEK

Are You Ready to save hours of lesson planning time?
Then try a 7 day free trial of Cazoom Premium. Try our full range of resources out for 7 days and then pay just $5 a month (annual plan) for continued access.
With Premium Membership, you'll get access to everything else on our platform, including:
- A range of over 1,000 K-12 Mathematics worksheets and resources.
- Uniquely designed, fun, and engaging worksheets.
- An ever-growing collection – new resources added regularly.
- Differentiated Lessons – every time. Guaranteed.
- Research-led proven strategies.
- Both UK and US Math curriculums covered.
List of Topics
Our printable math worksheets cover the full range of topics. See below the list of topics covered. All our math worksheets can be accessed here.
Algebra
- Order of Operations
- Expanding Expressions
- Factoring
- Exponents
- Inequalities
- Linear Functions
- Real World Graphs
- Solving for Variables
- Sequences
- Simplification
- Solving Equations
- Substitution
Number
- Calculator Methods
- Decimals
- Fractions
- Fractions Decimals Percents
- Mental Math
- Negative Numbers
- Percents
- Place Value
- Powers
- Proportion
- Ratios
- Rounding
- Time
- Types of Numbers
- Written Methods
Geometry
- 2D Shapes
- 3D Shapes
- Area and Perimeter
- Scale and Loci
- Circles
- Compound Measures
- Constructions
- Coordinates
- Lines and Angles
- Polygons
- Pythagorean Theorem
- Similarity and Congruence
- Transformations
- Volume and Surface Area
Statistics
- Histograms and Frequency Polygons
- Mean Median Mode
- Pie Charts and Bar Graphs
- Probability
- Scatter Plots
- Stem-and-Leaf Plots
- Two-Way Tables and Pictographs