Linear Functions: y = mx WORKSHEET
Construct a function to model a linear relationship between two quantities. Determine the rate of change and initial value of the function from a description of a relationship or from two (x, y) values, including reading these from a table or from a graph. Interpret the rate of change and initial value of a linear function in terms of the situation it models, and in terms of its graph or a table of values.
Linear Functions: y = mx WORKSHEET DESCRIPTION
This worksheet is divided into four key sections, each designed to progressively build students' understanding.
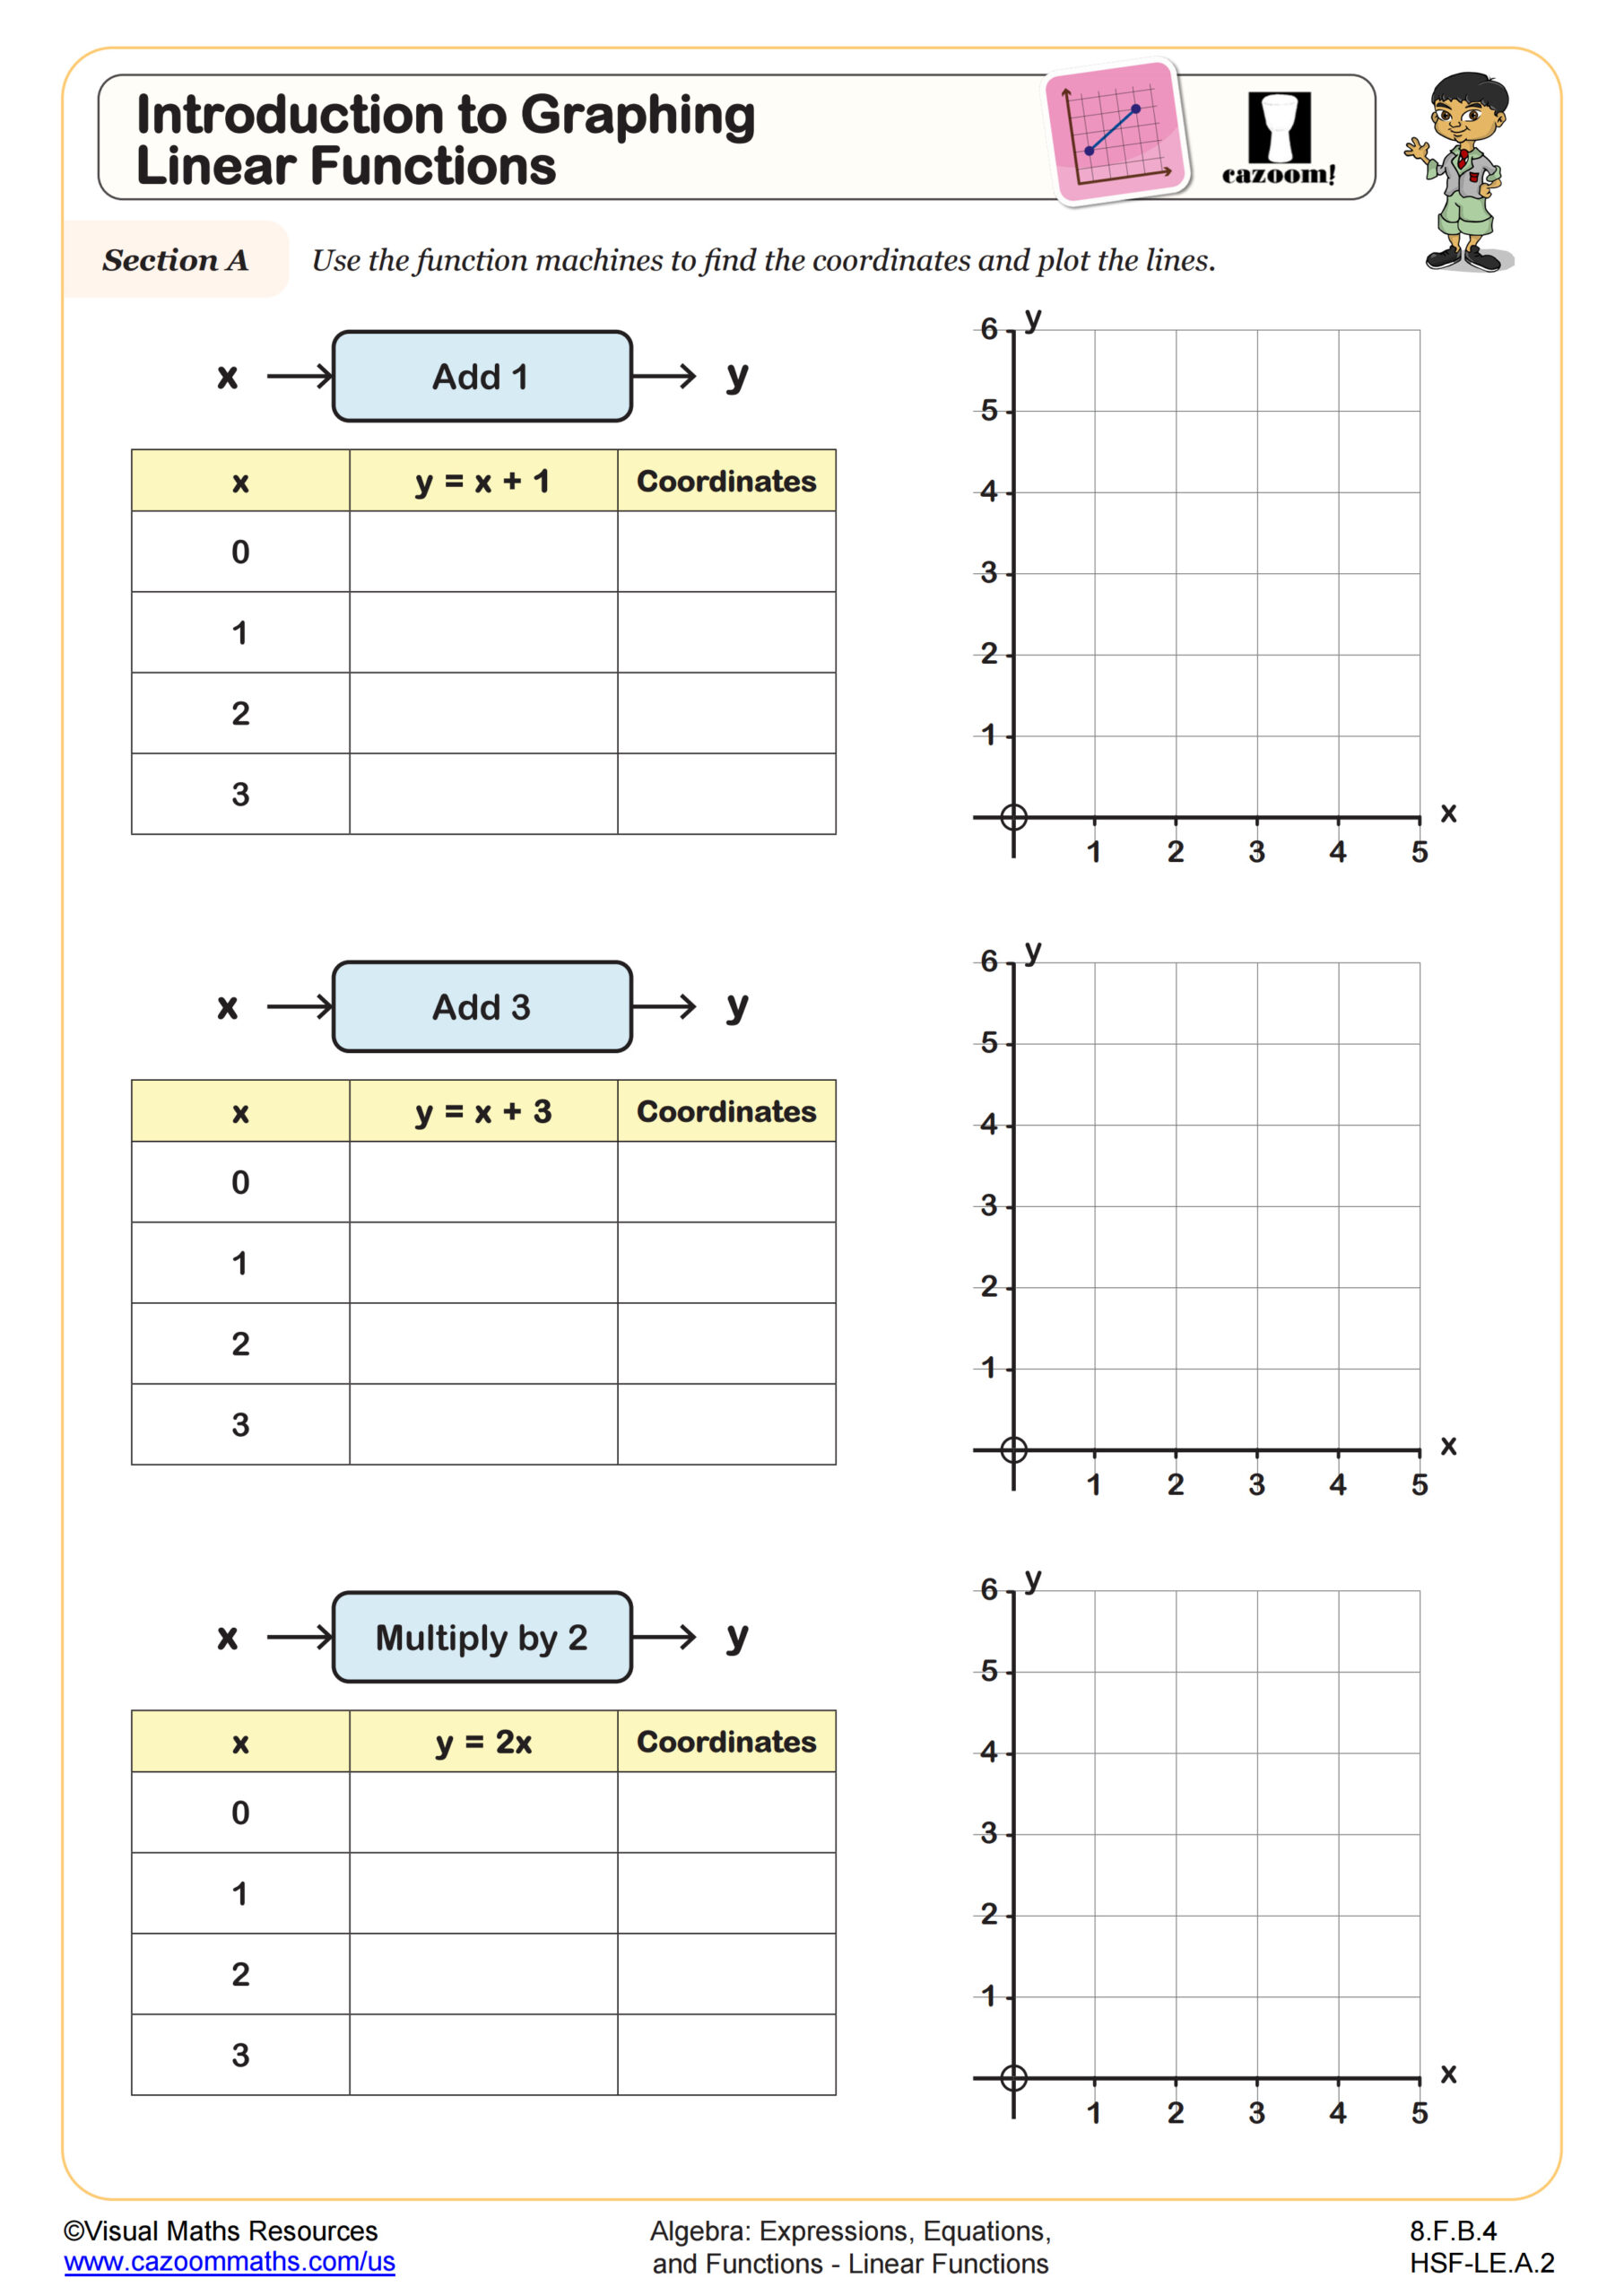
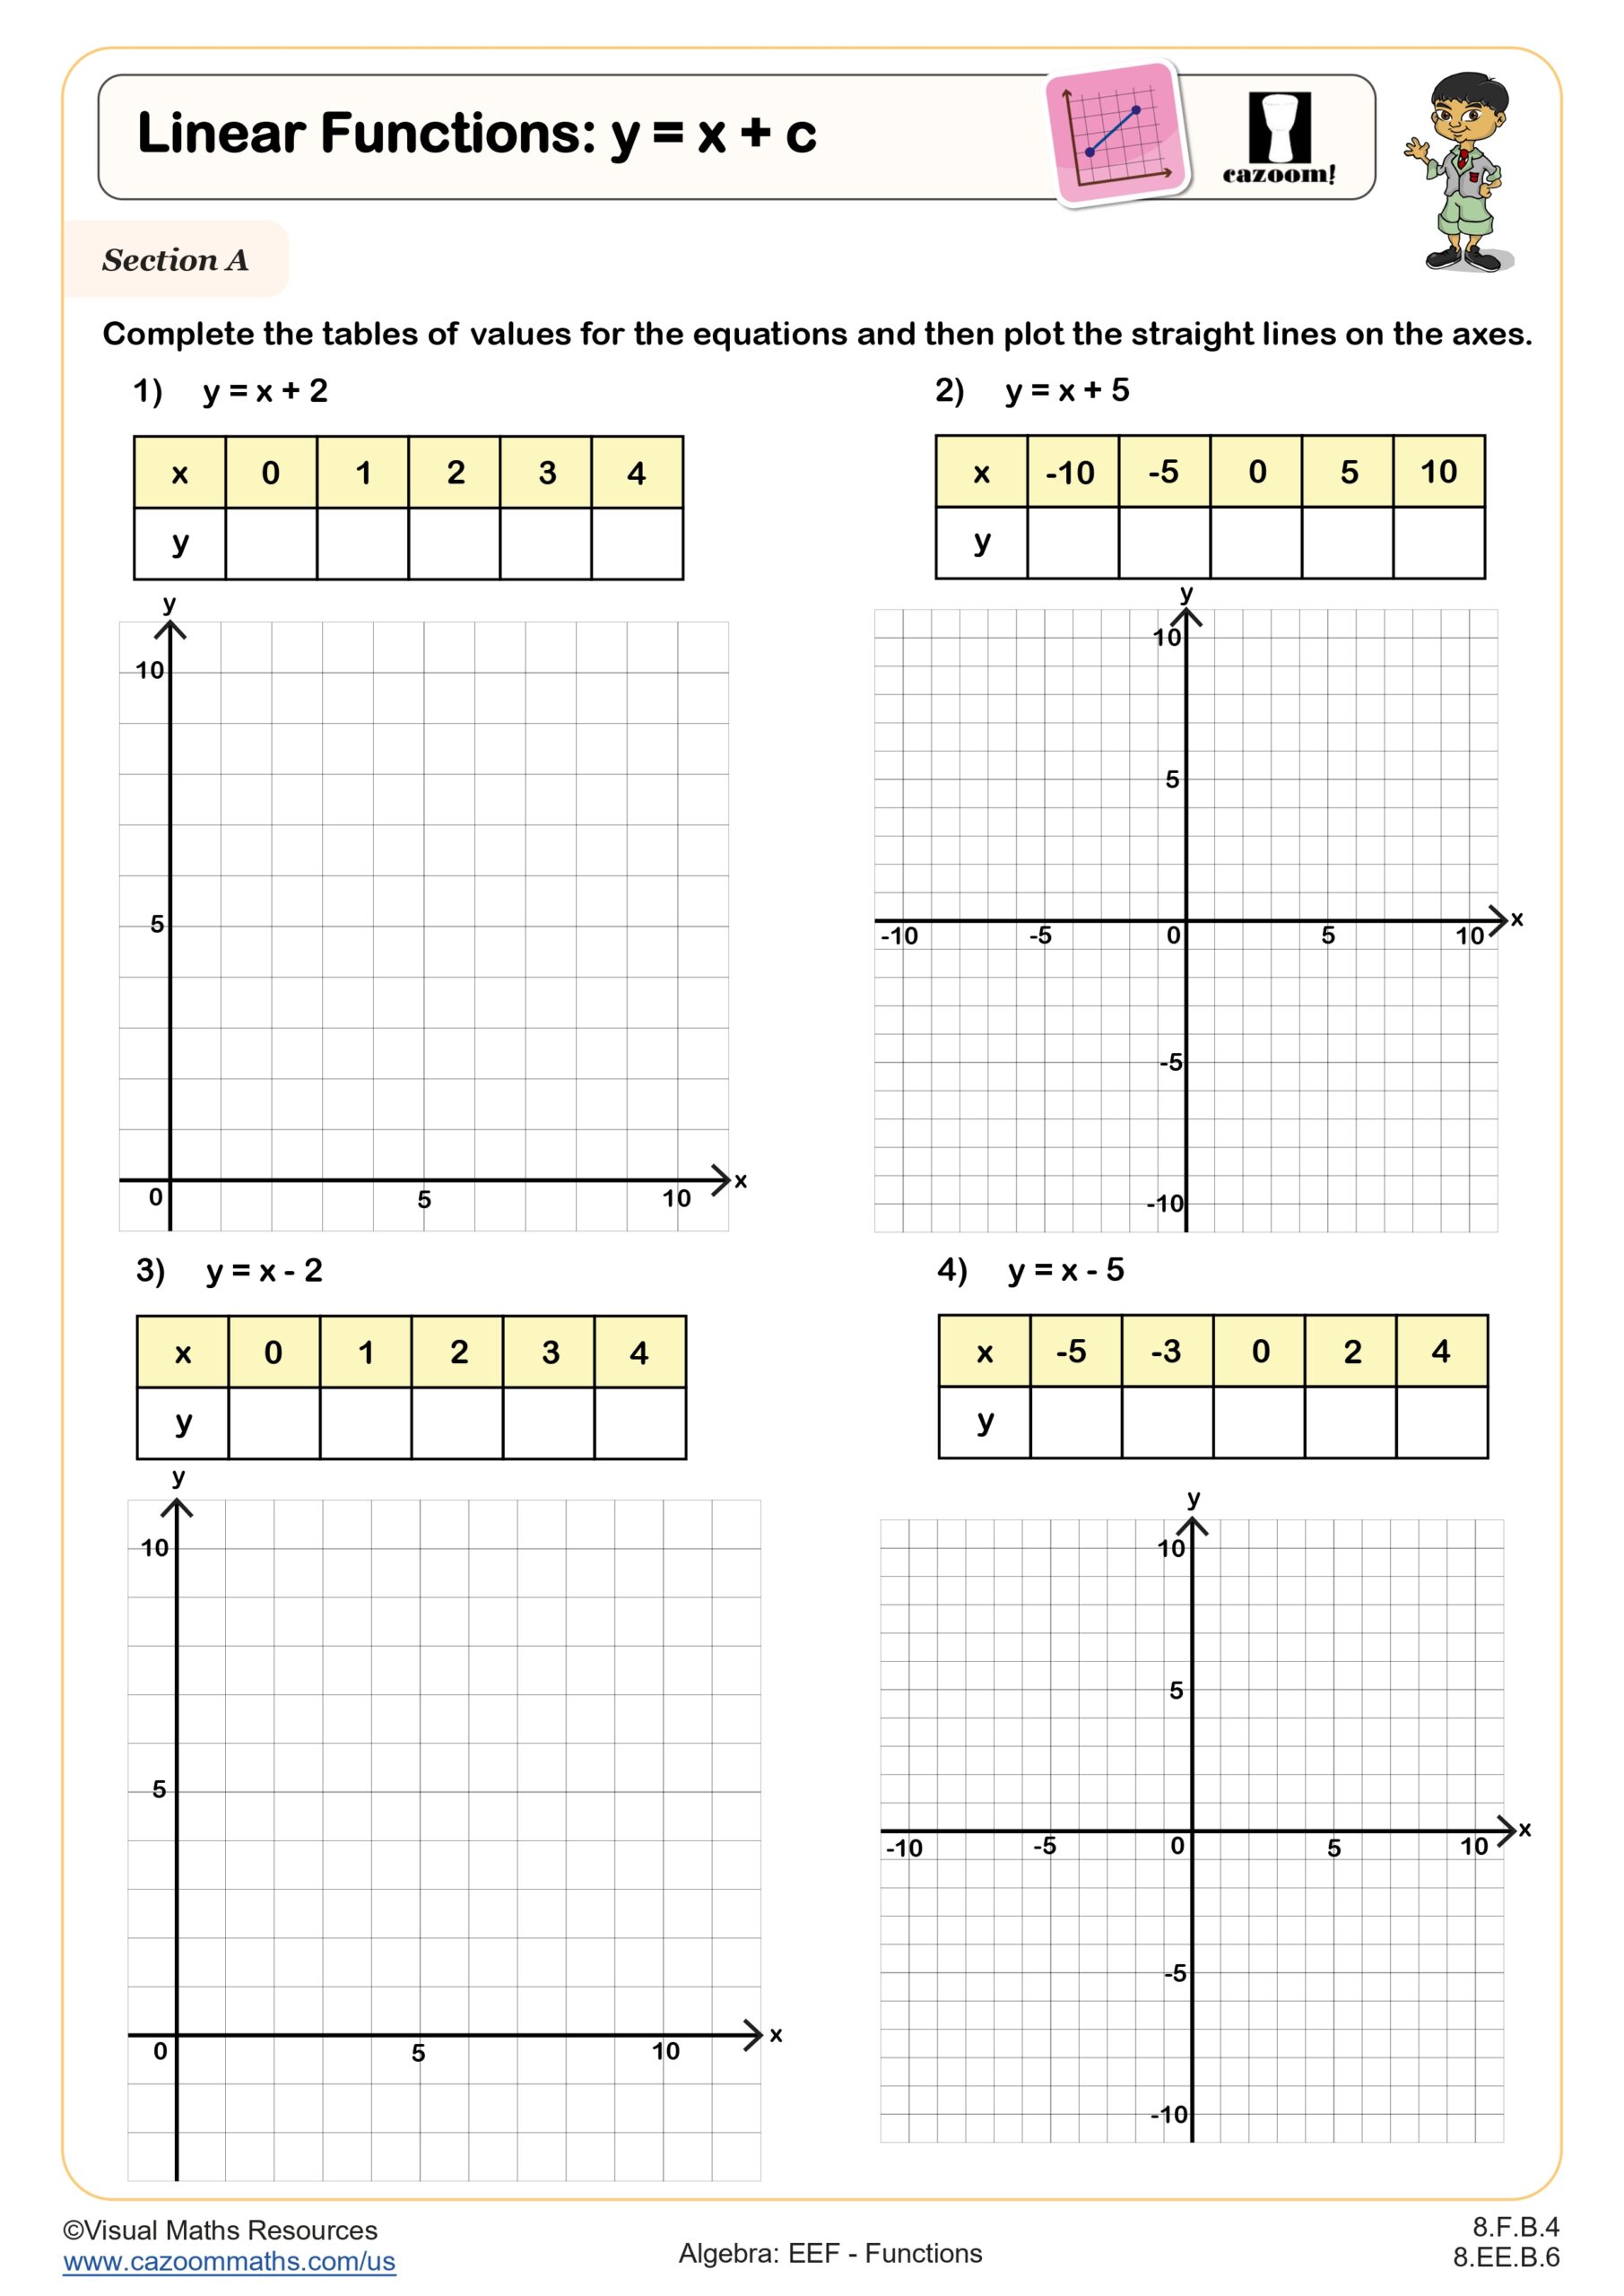
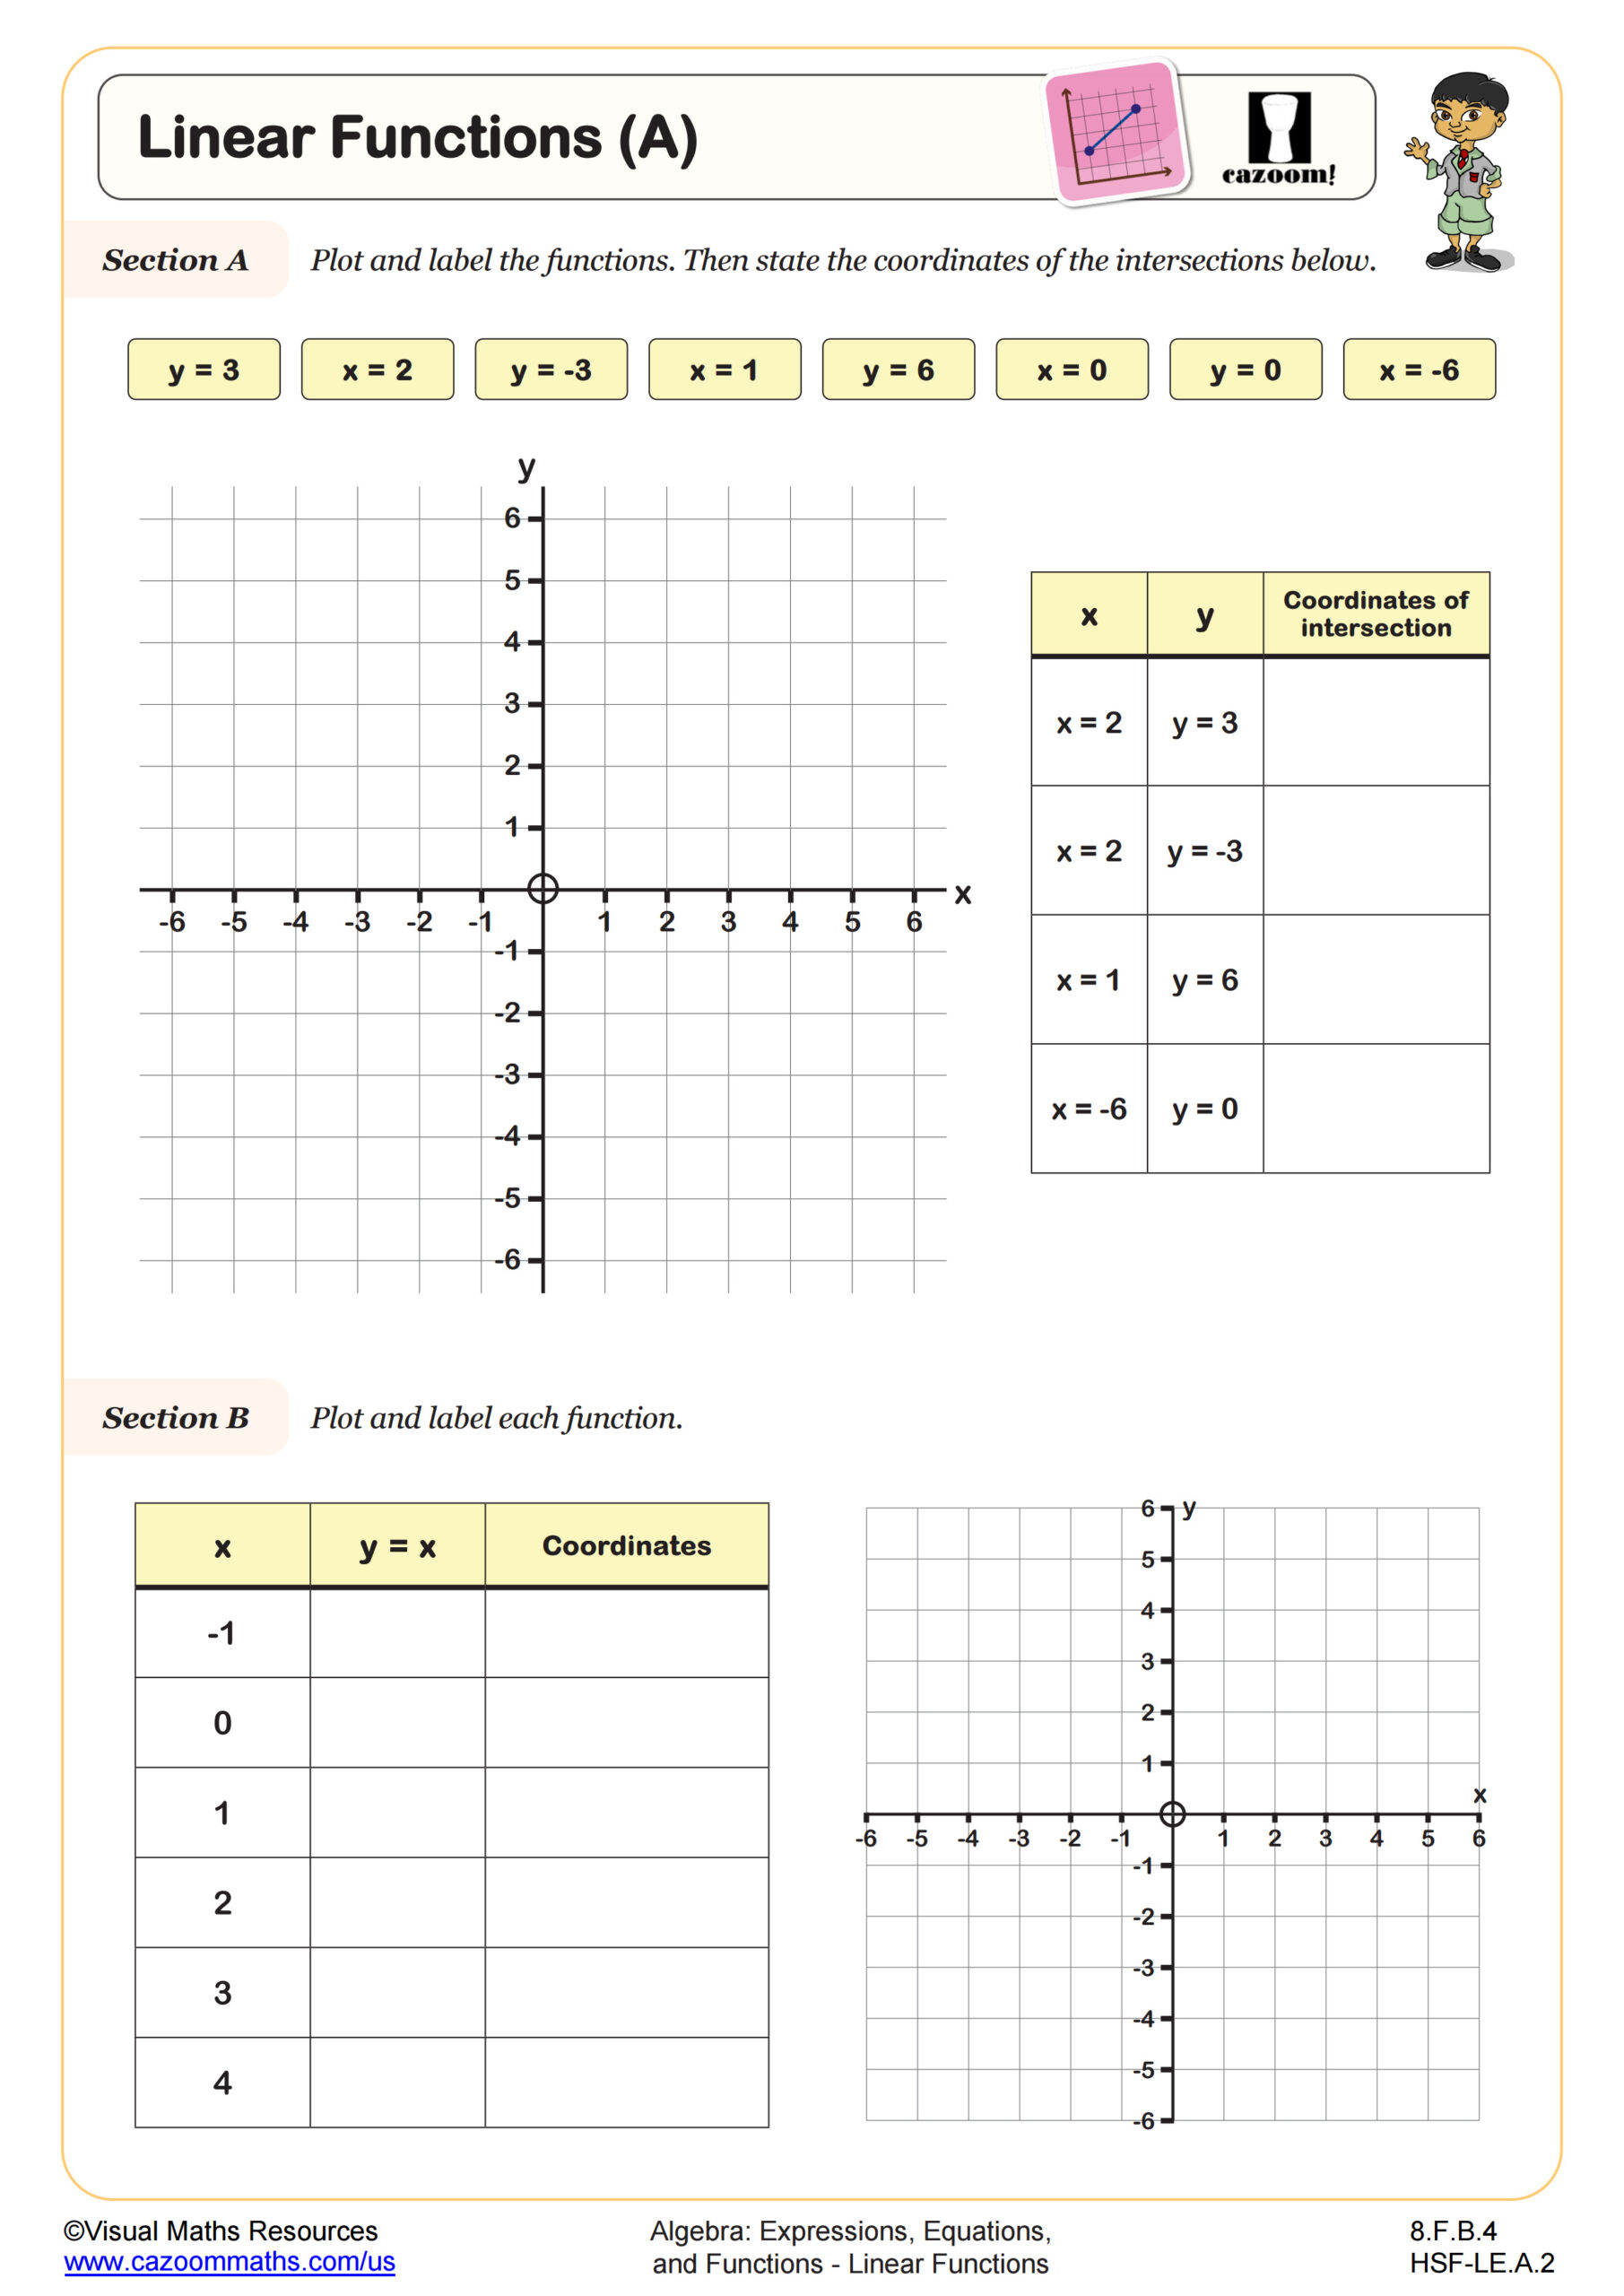
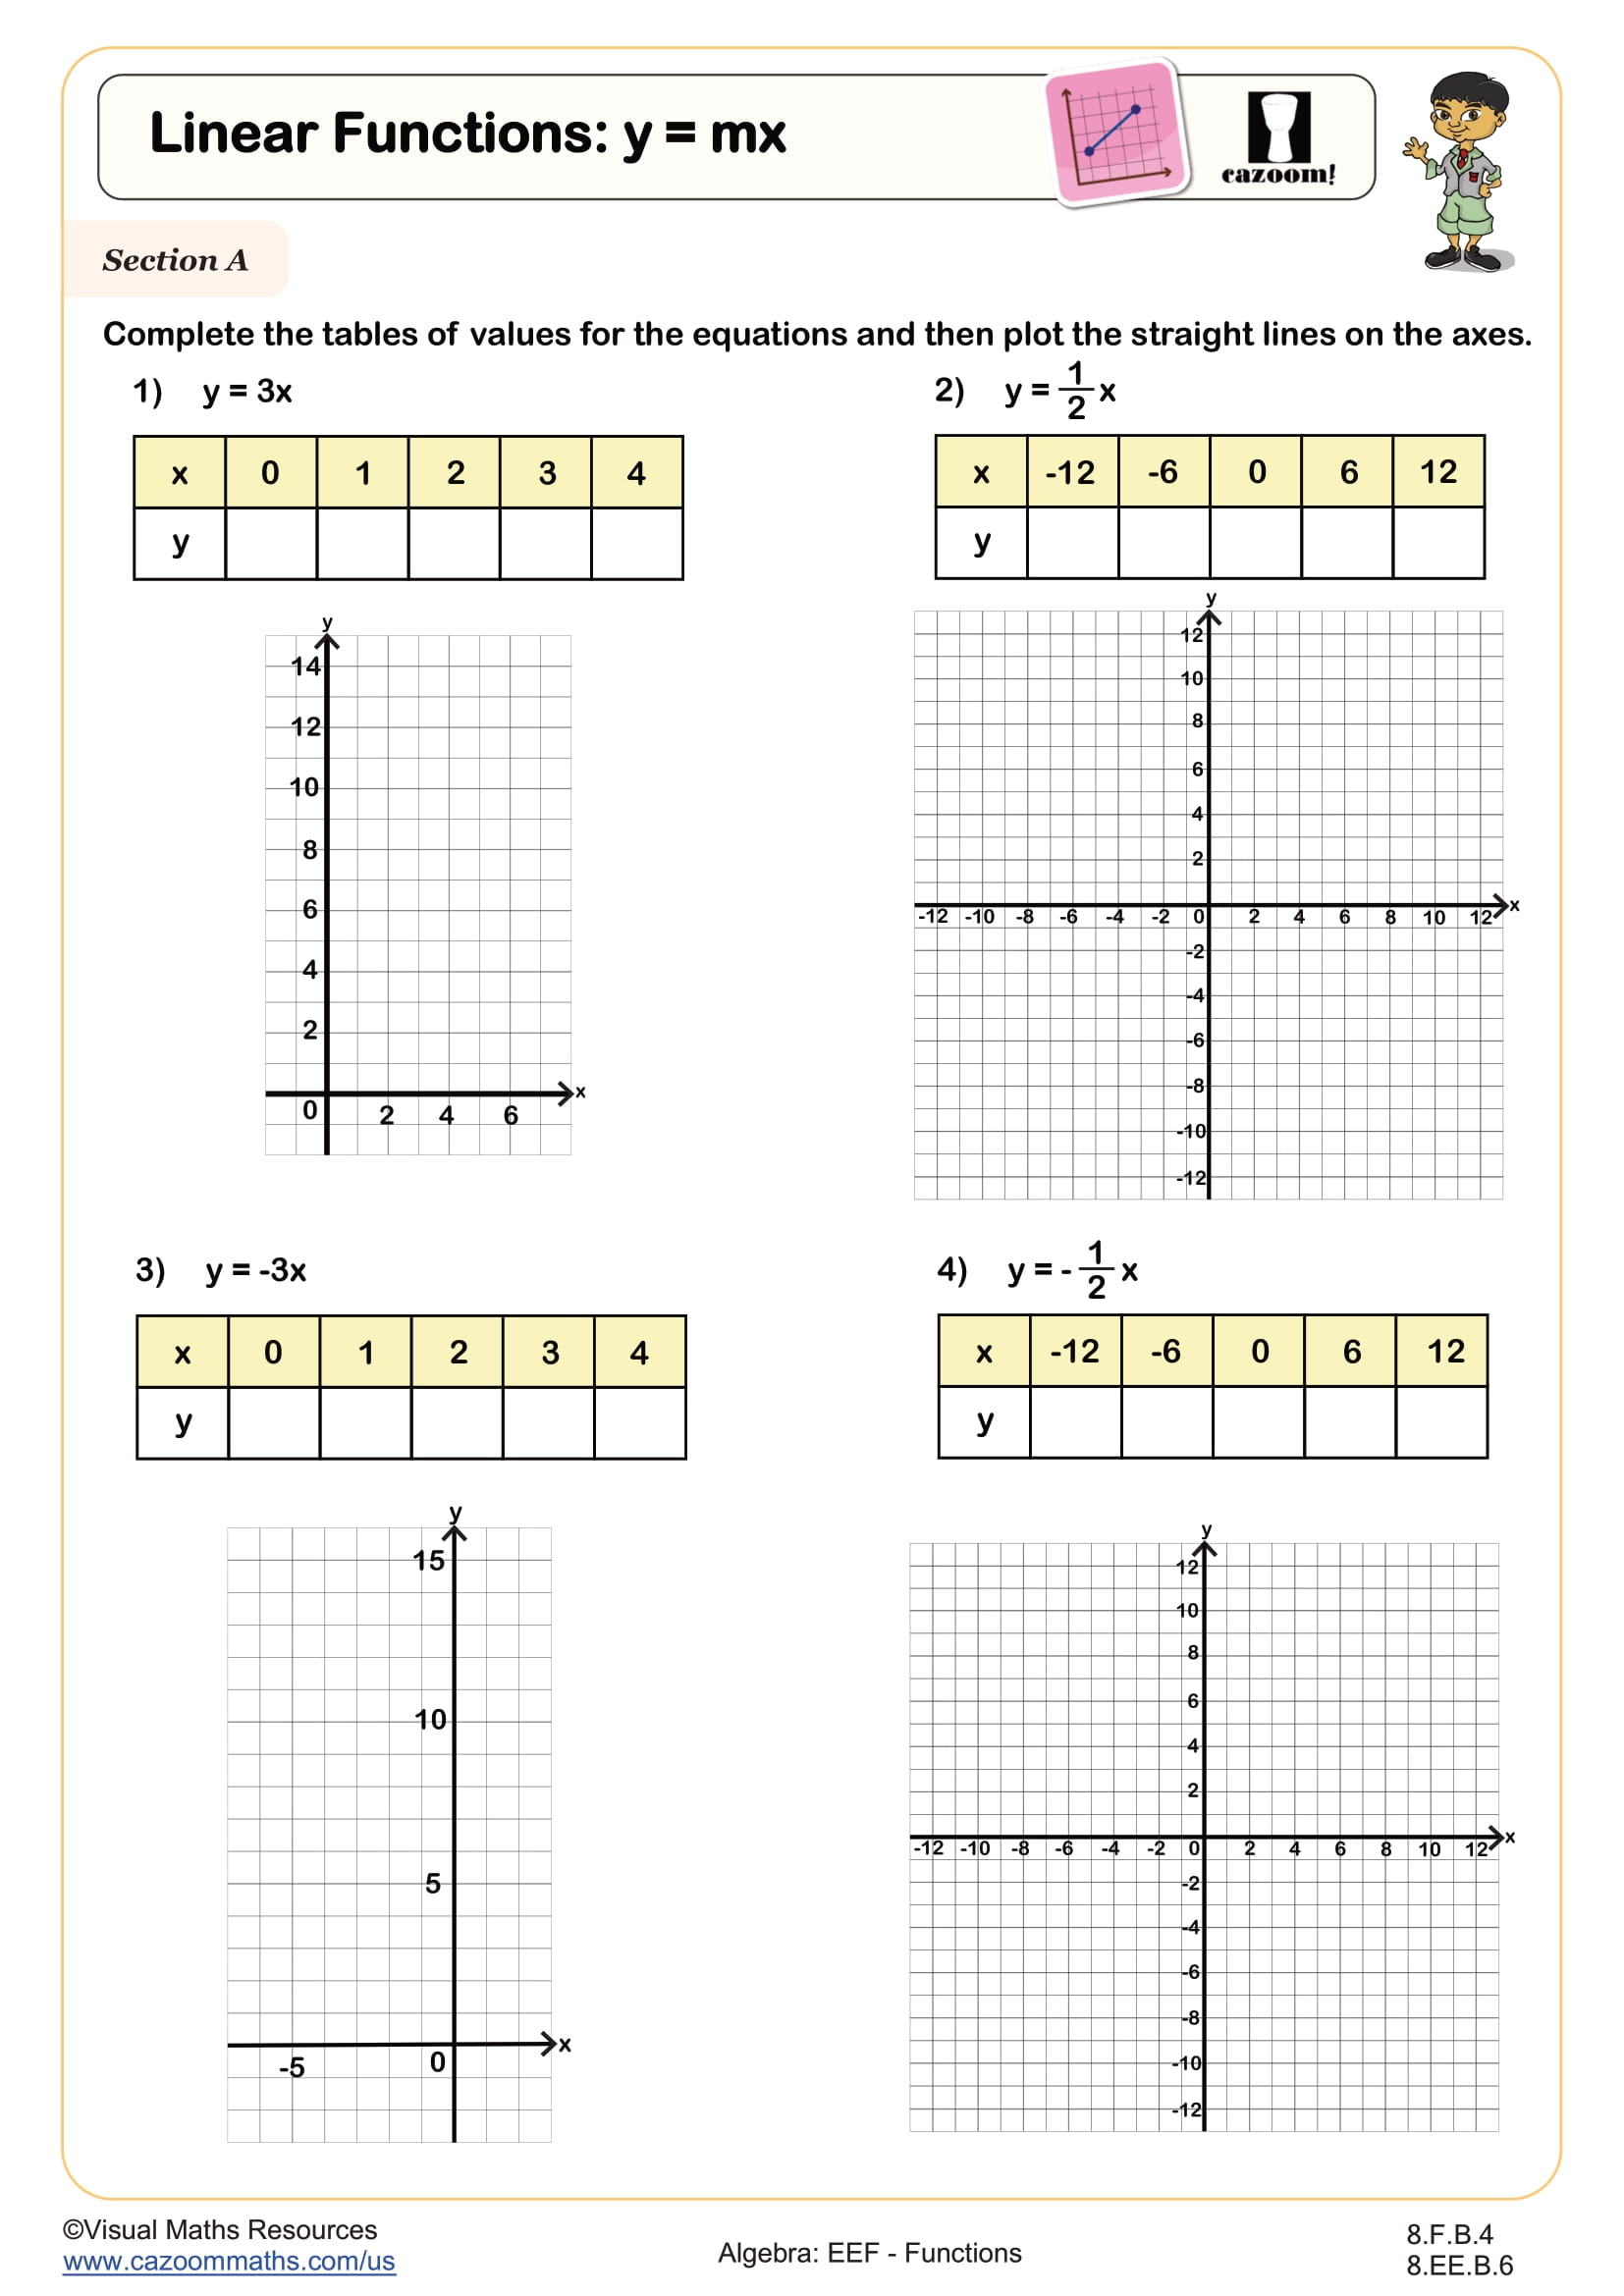
In Section A, learners complete tables of values for given linear equations and then plot the corresponding straight lines on provided axes. This section helps students visualize how changes in x affect y and strengthen their graph-plotting skills.
Section B shifts focus to gradients, asking students to find the slope of each line and deduce the equation. This reinforces the relationship between gradient and linear equations.
In Section C, learners find the equation of straight lines directly from given tables of values, providing further practice in recognising linear patterns.
Finally, Section D presents pairs of points through which students are tasked to find the equations of the lines. This section enhances problem-solving skills and consolidates understanding of linear equations in different contexts.
RELATED TO Linear Functions: y = mx WORKSHEET
Frequently Asked Questions
This linear functions: y = mx worksheet is designed for students in 8th Grade and aligns with Common Core State Standards.
