Statistics Teaching Resources
Bar Chart Templates
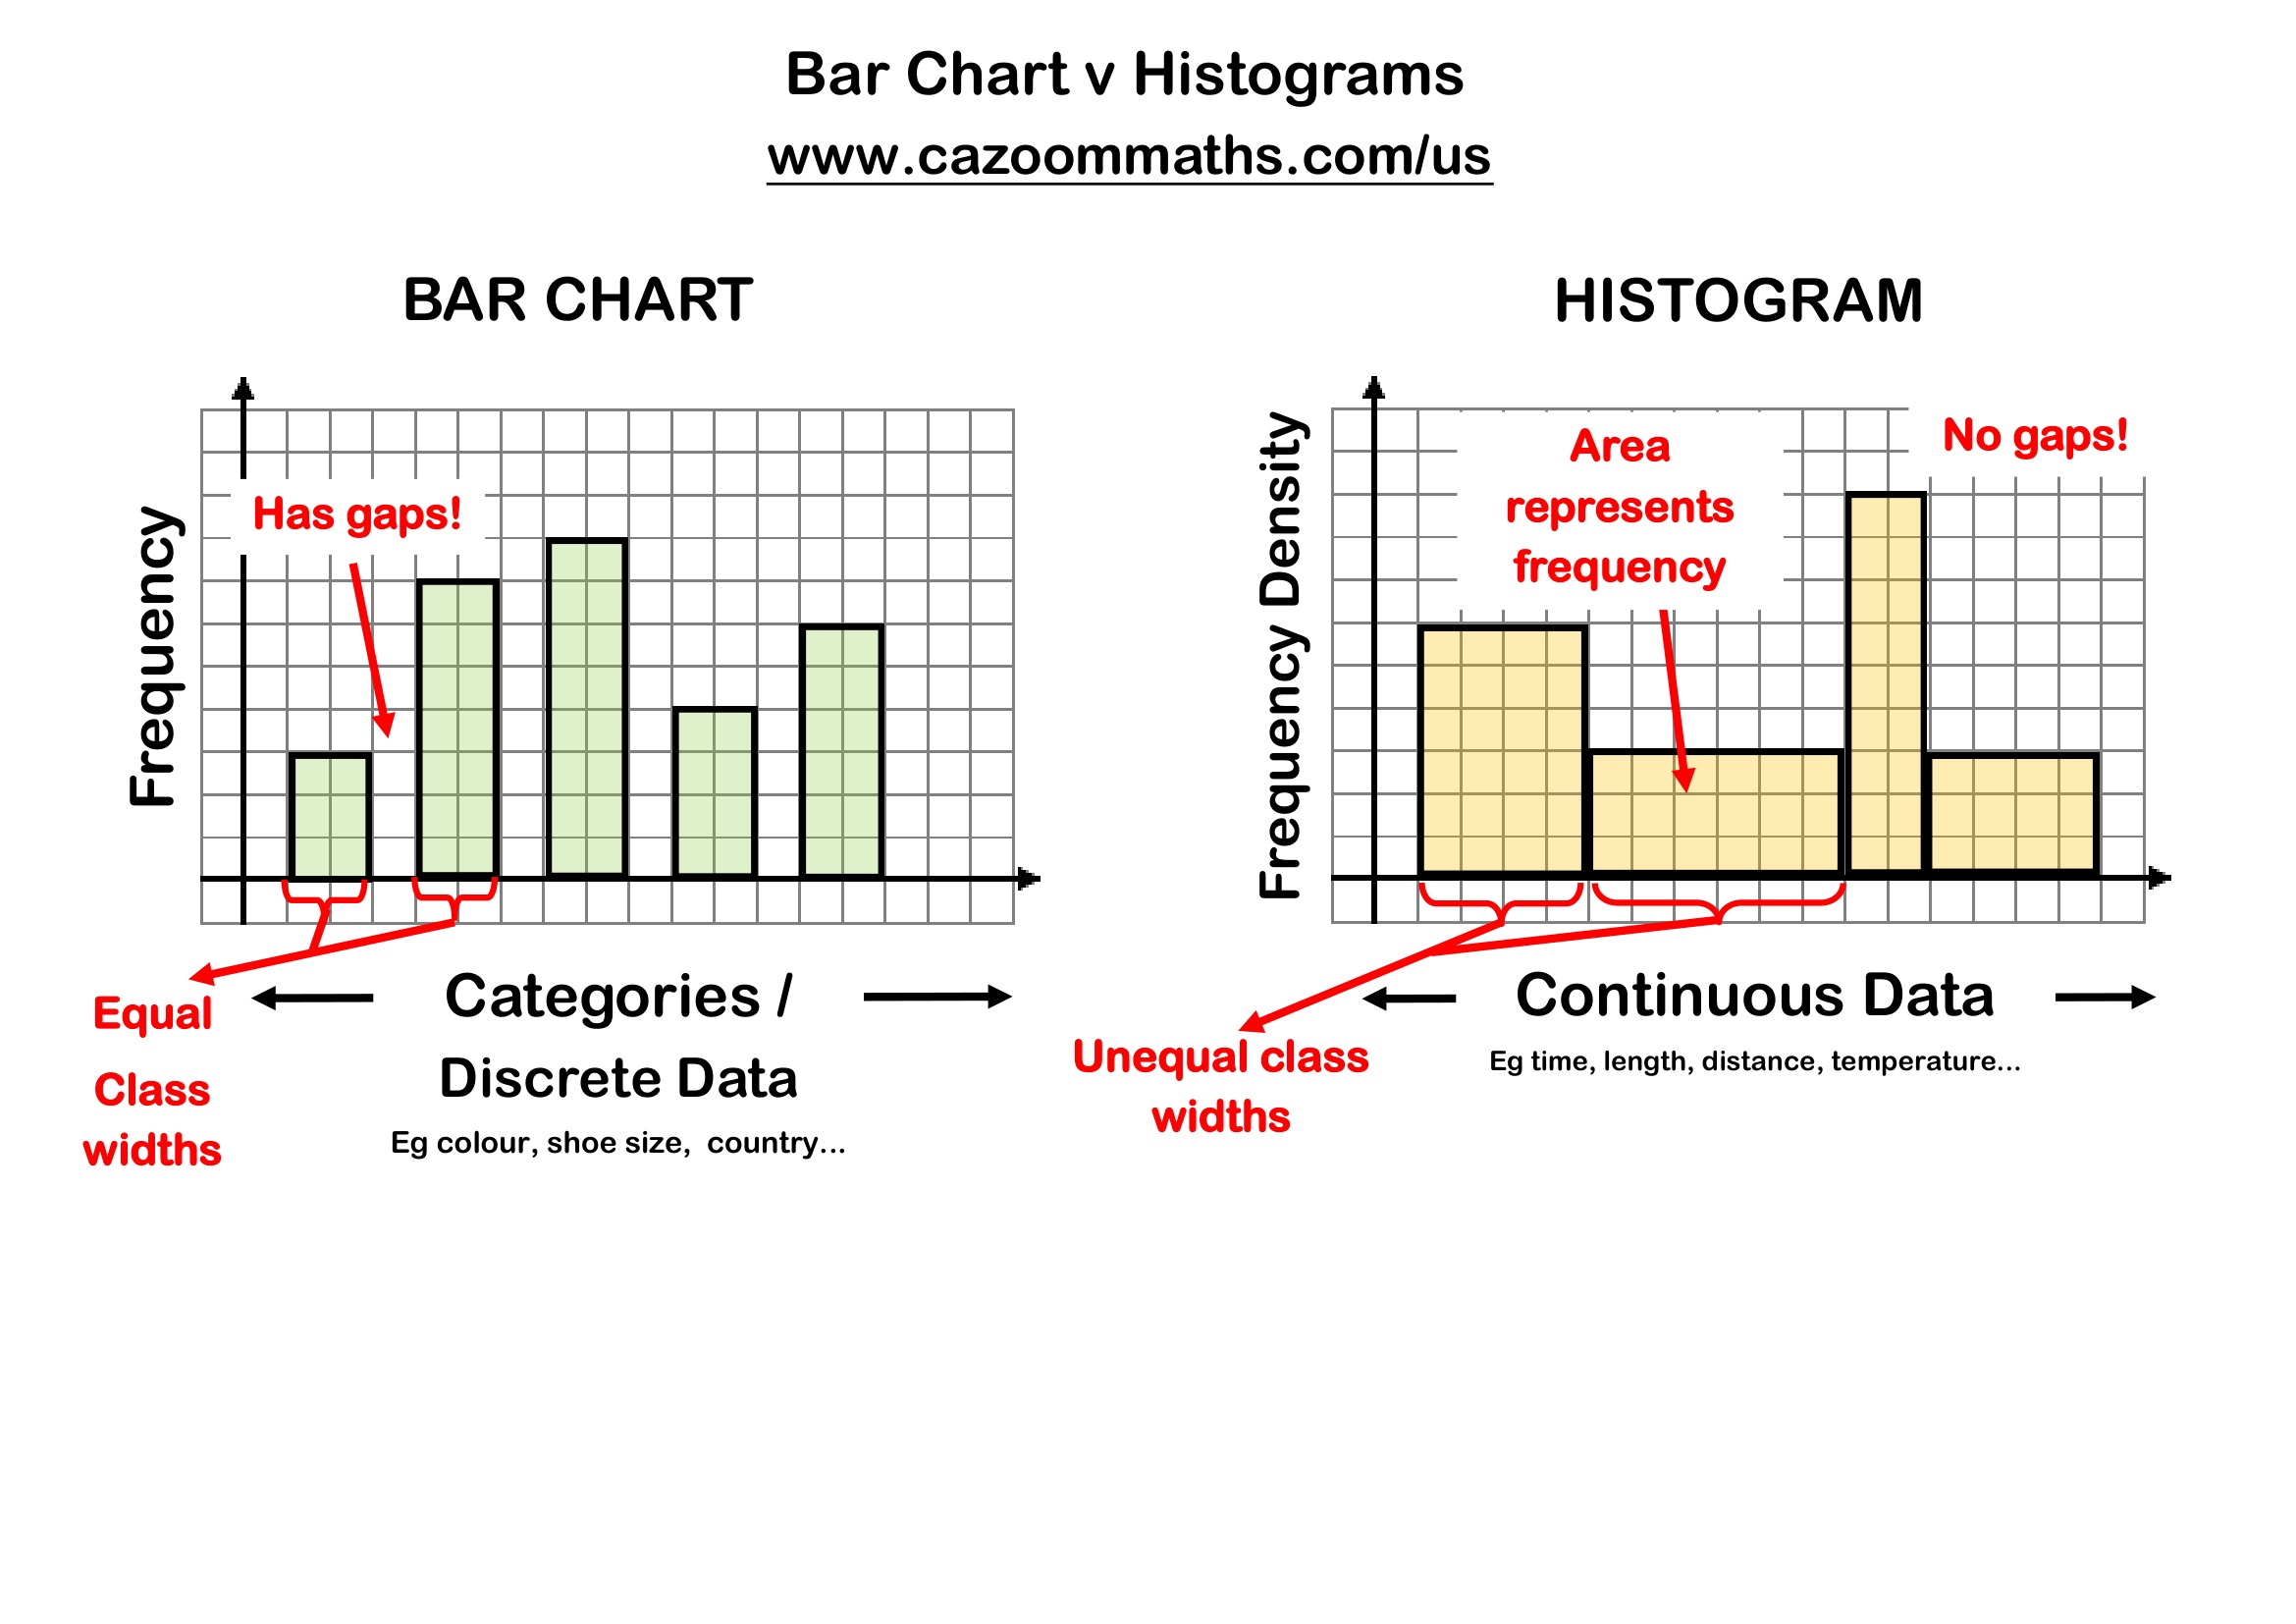
Bar Charts vs Histograms
Blank Pie Charts
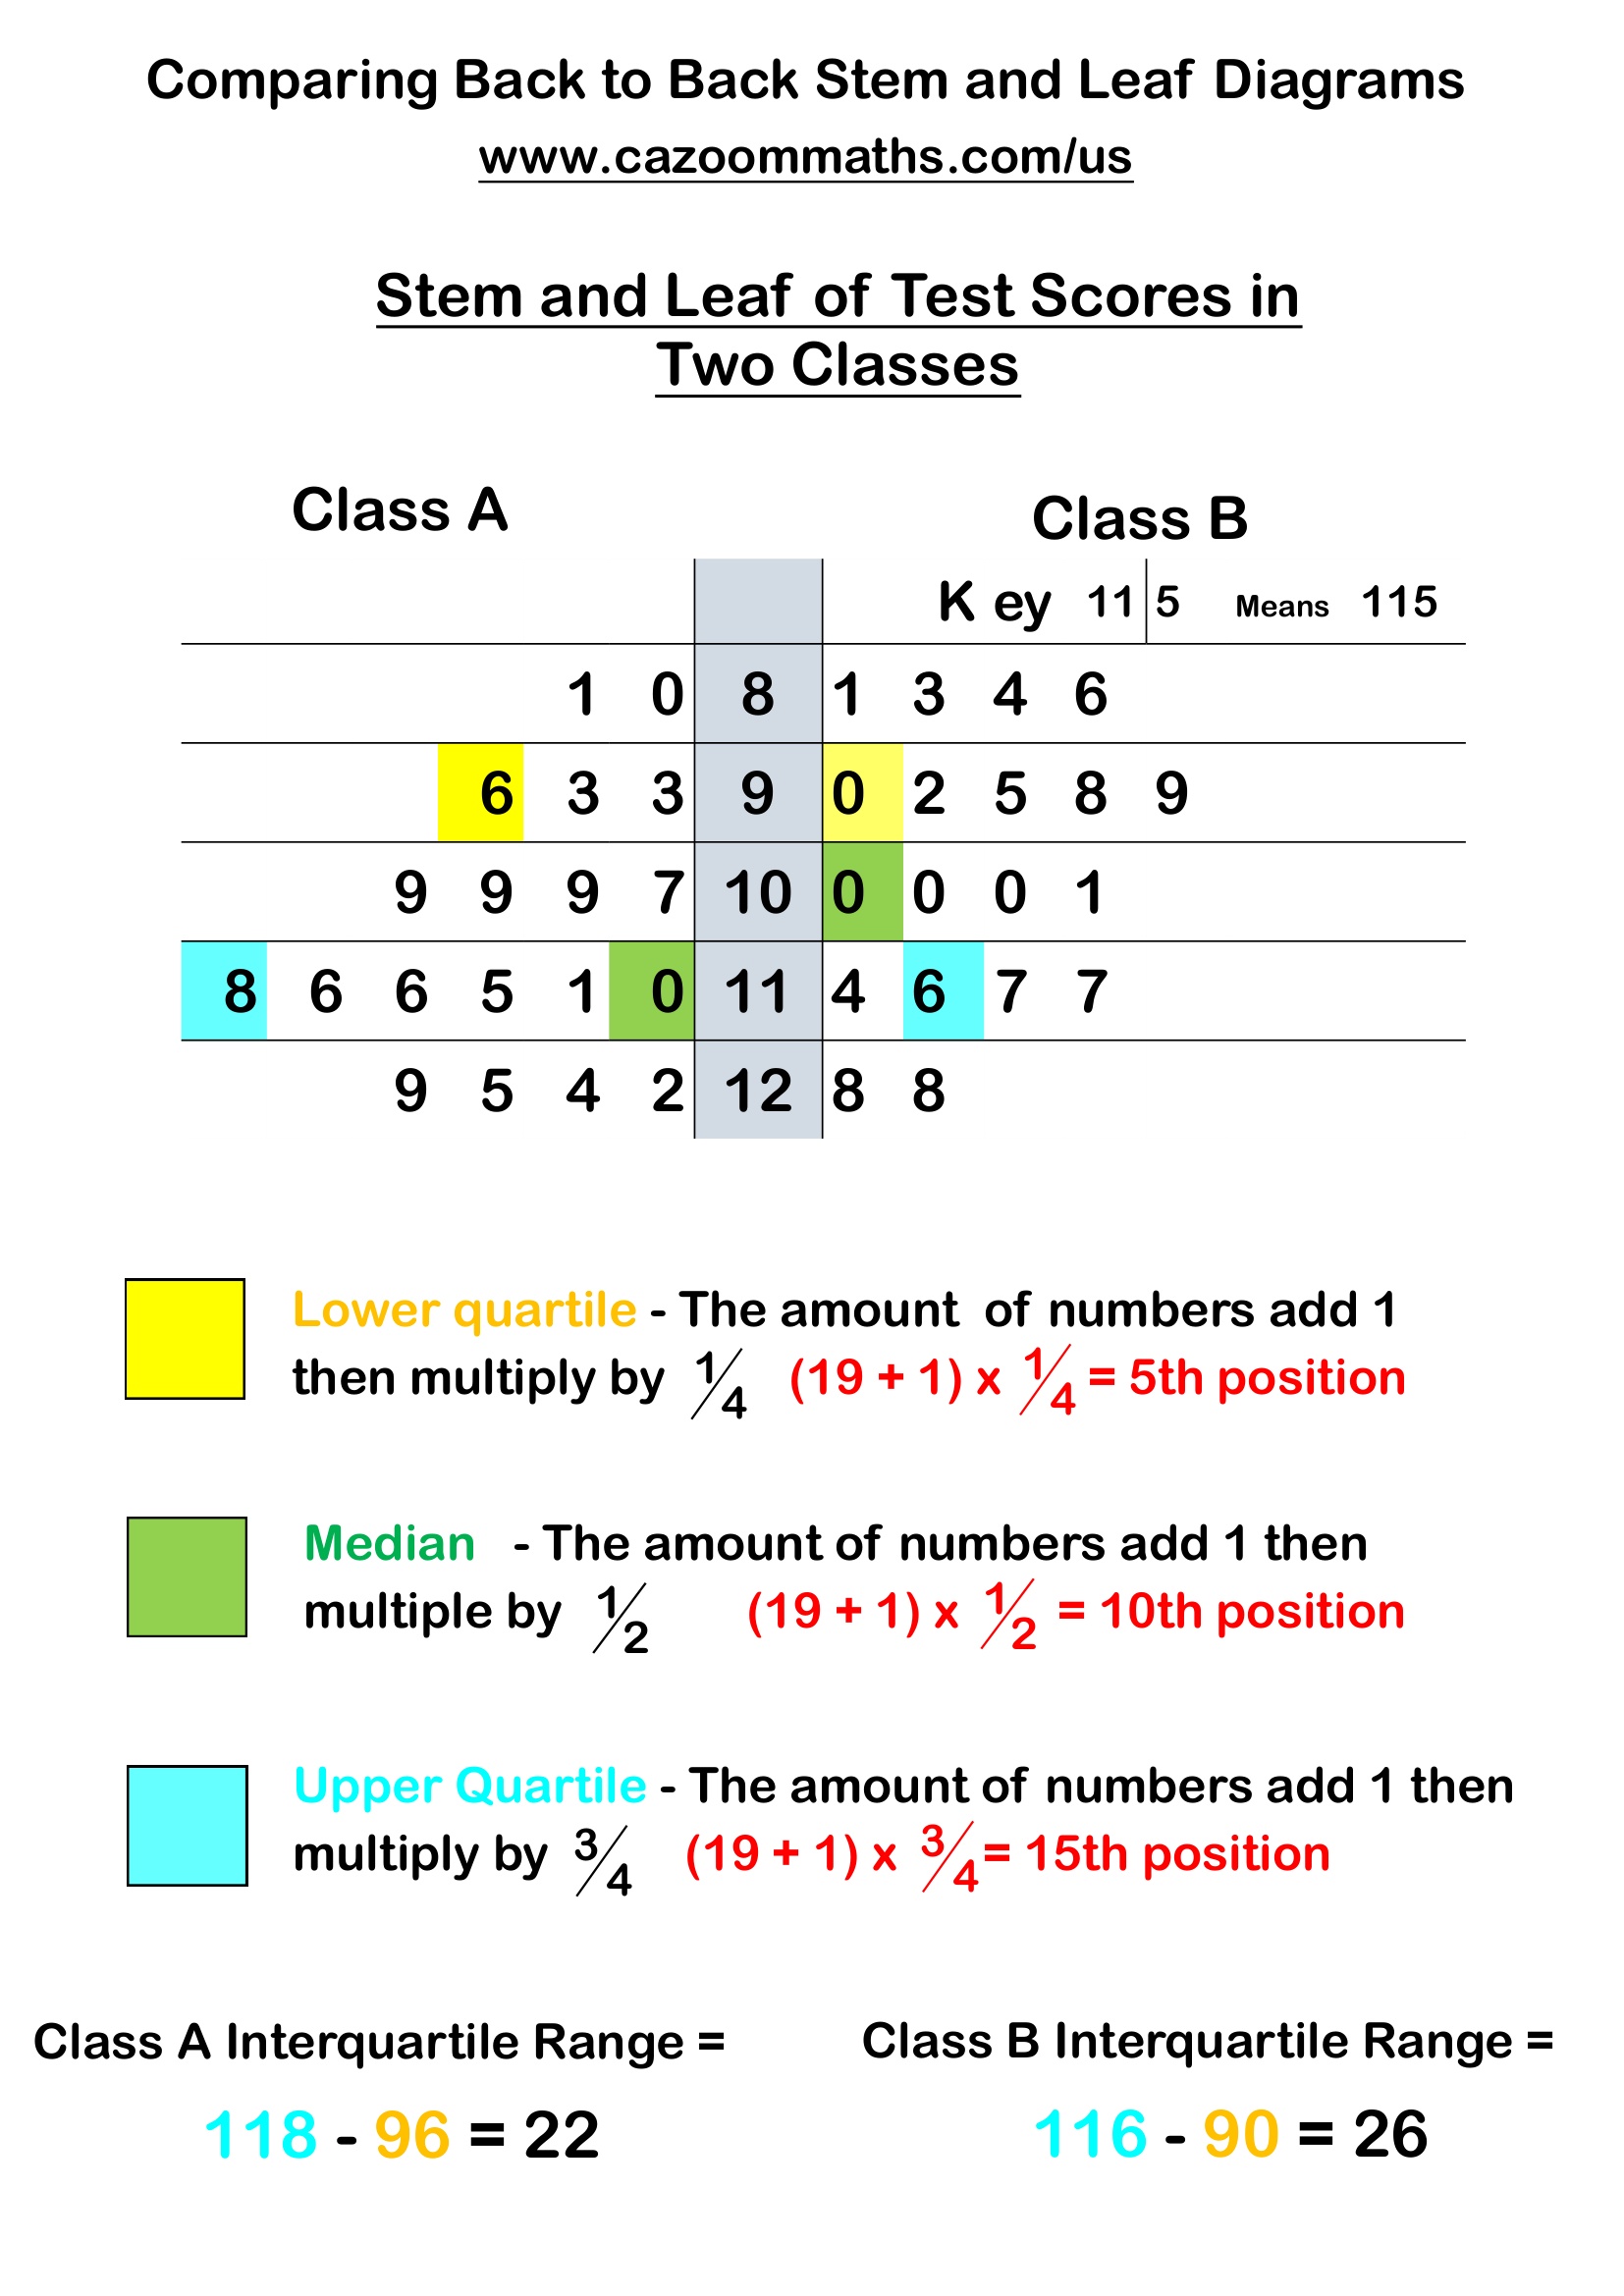
Comparing Back to Back Stem and Leaf Diagrams
Frequency Table Templates
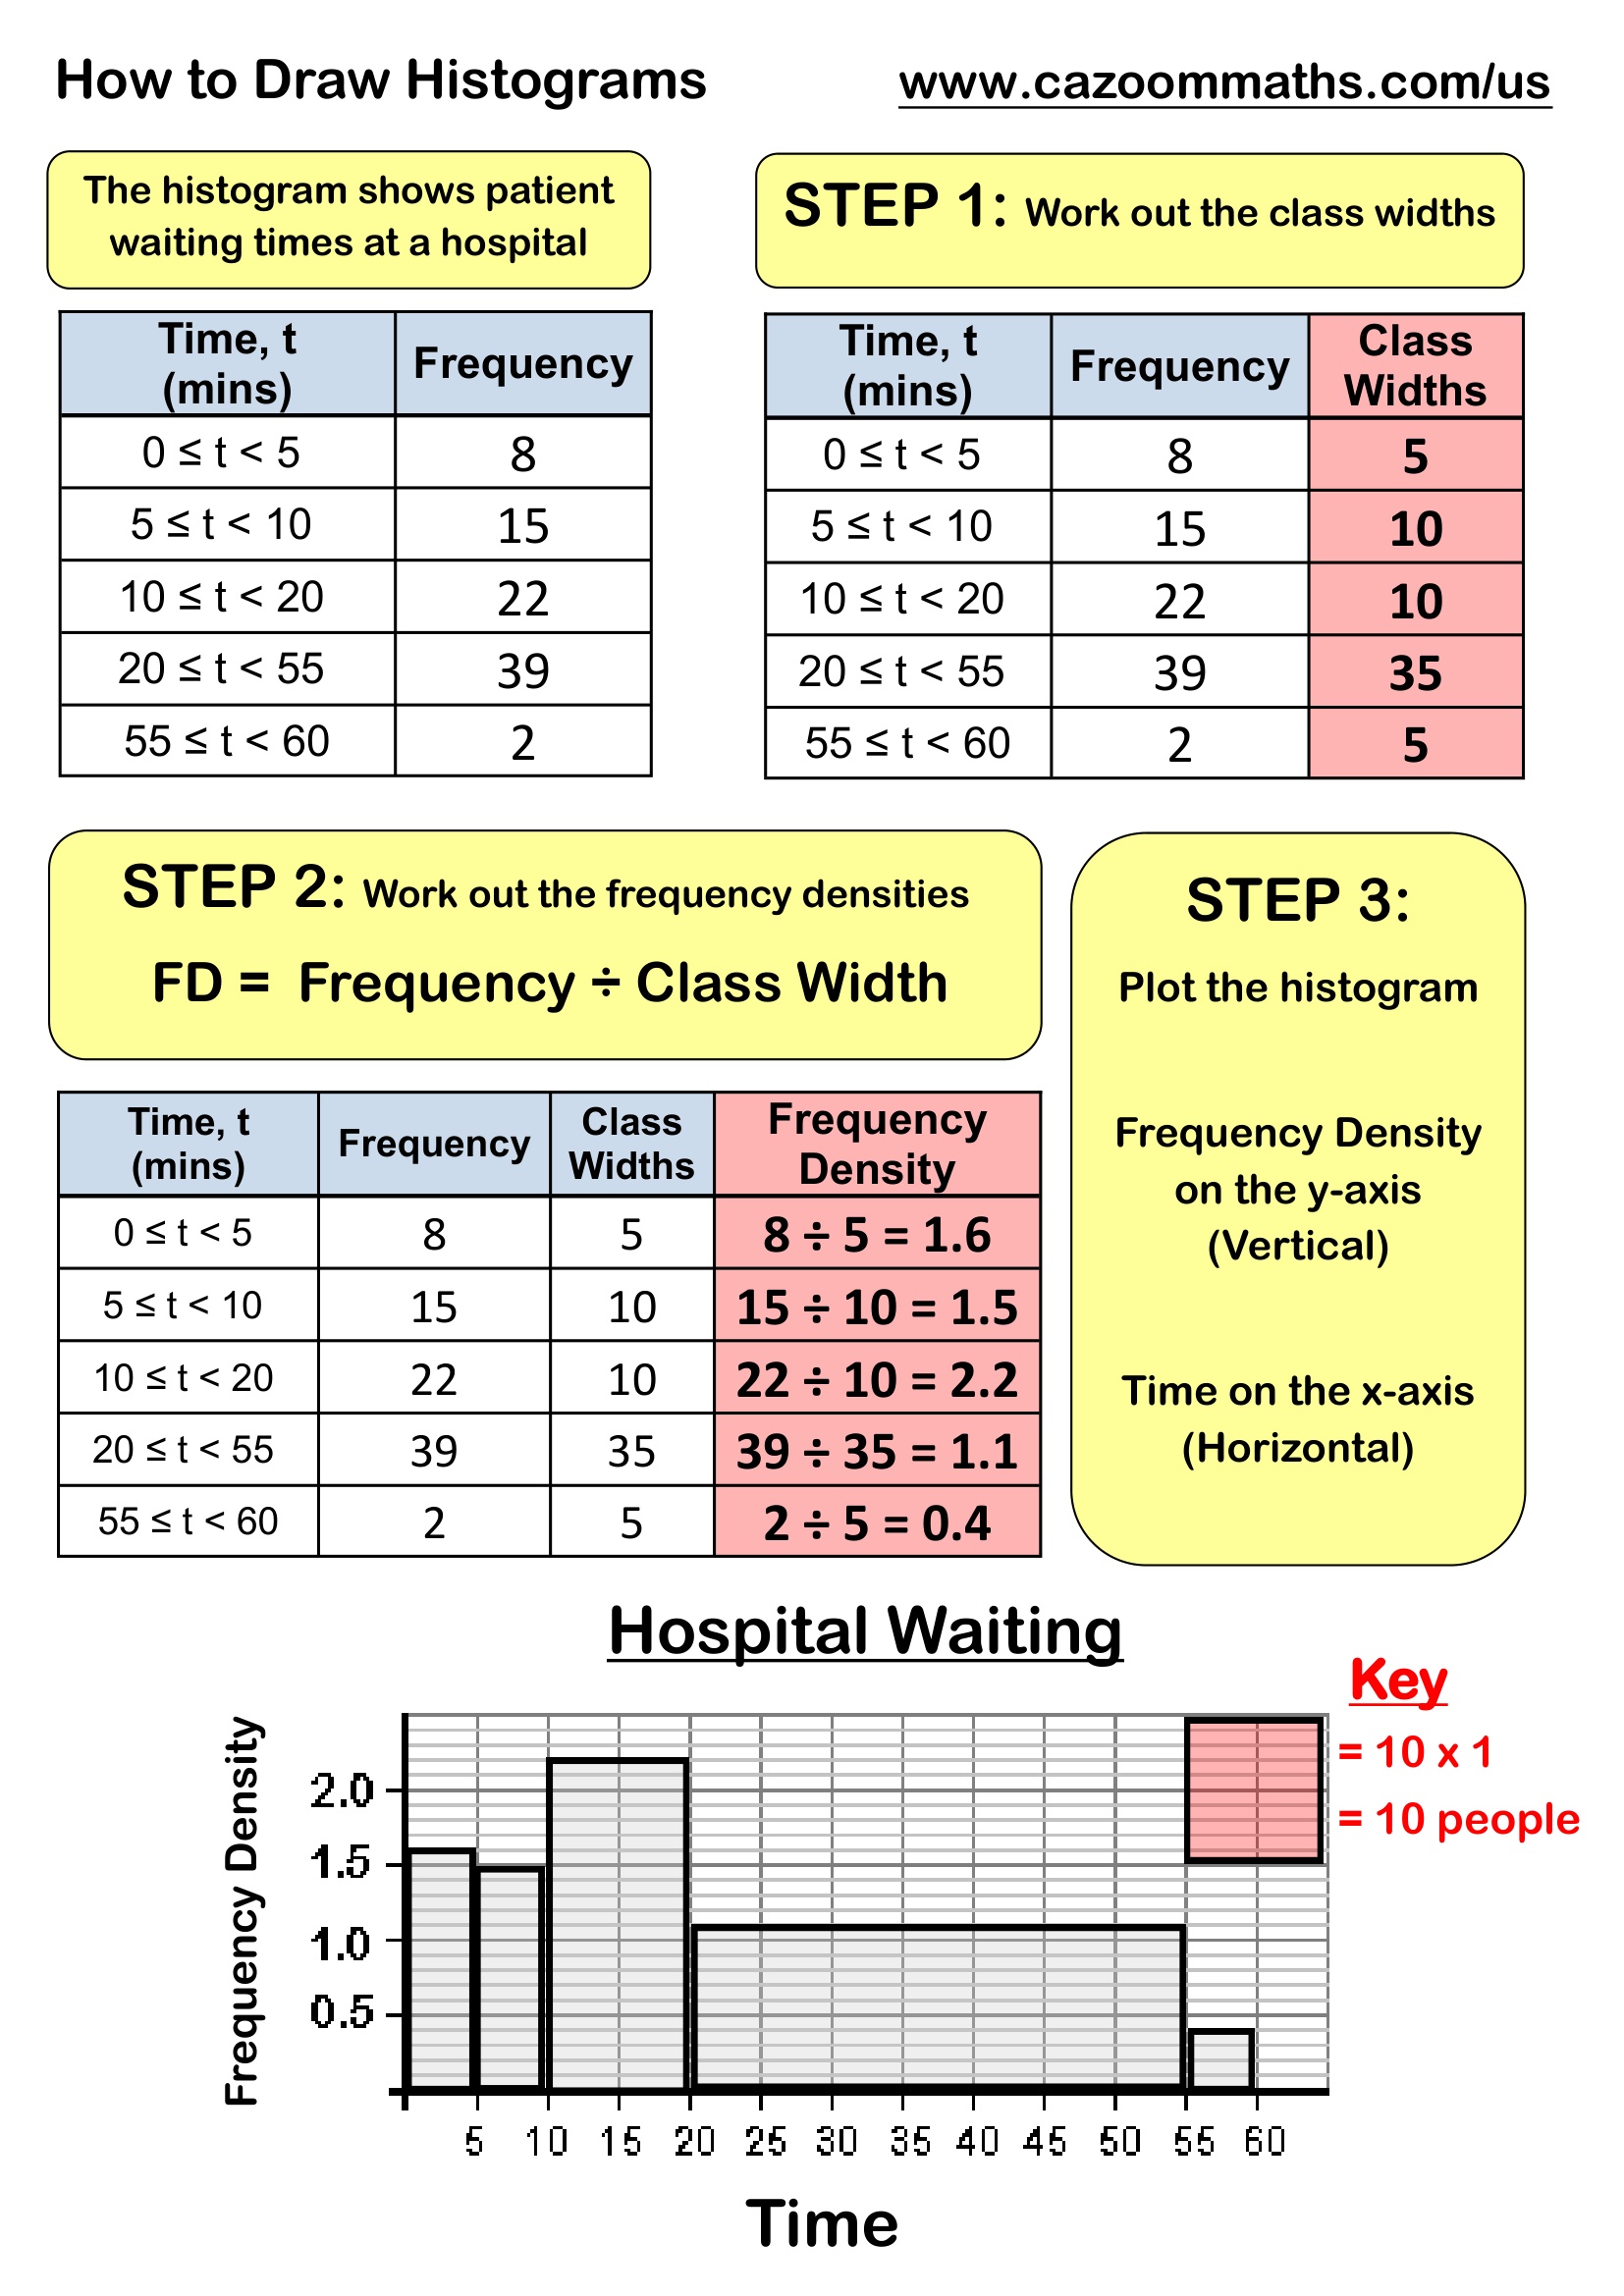
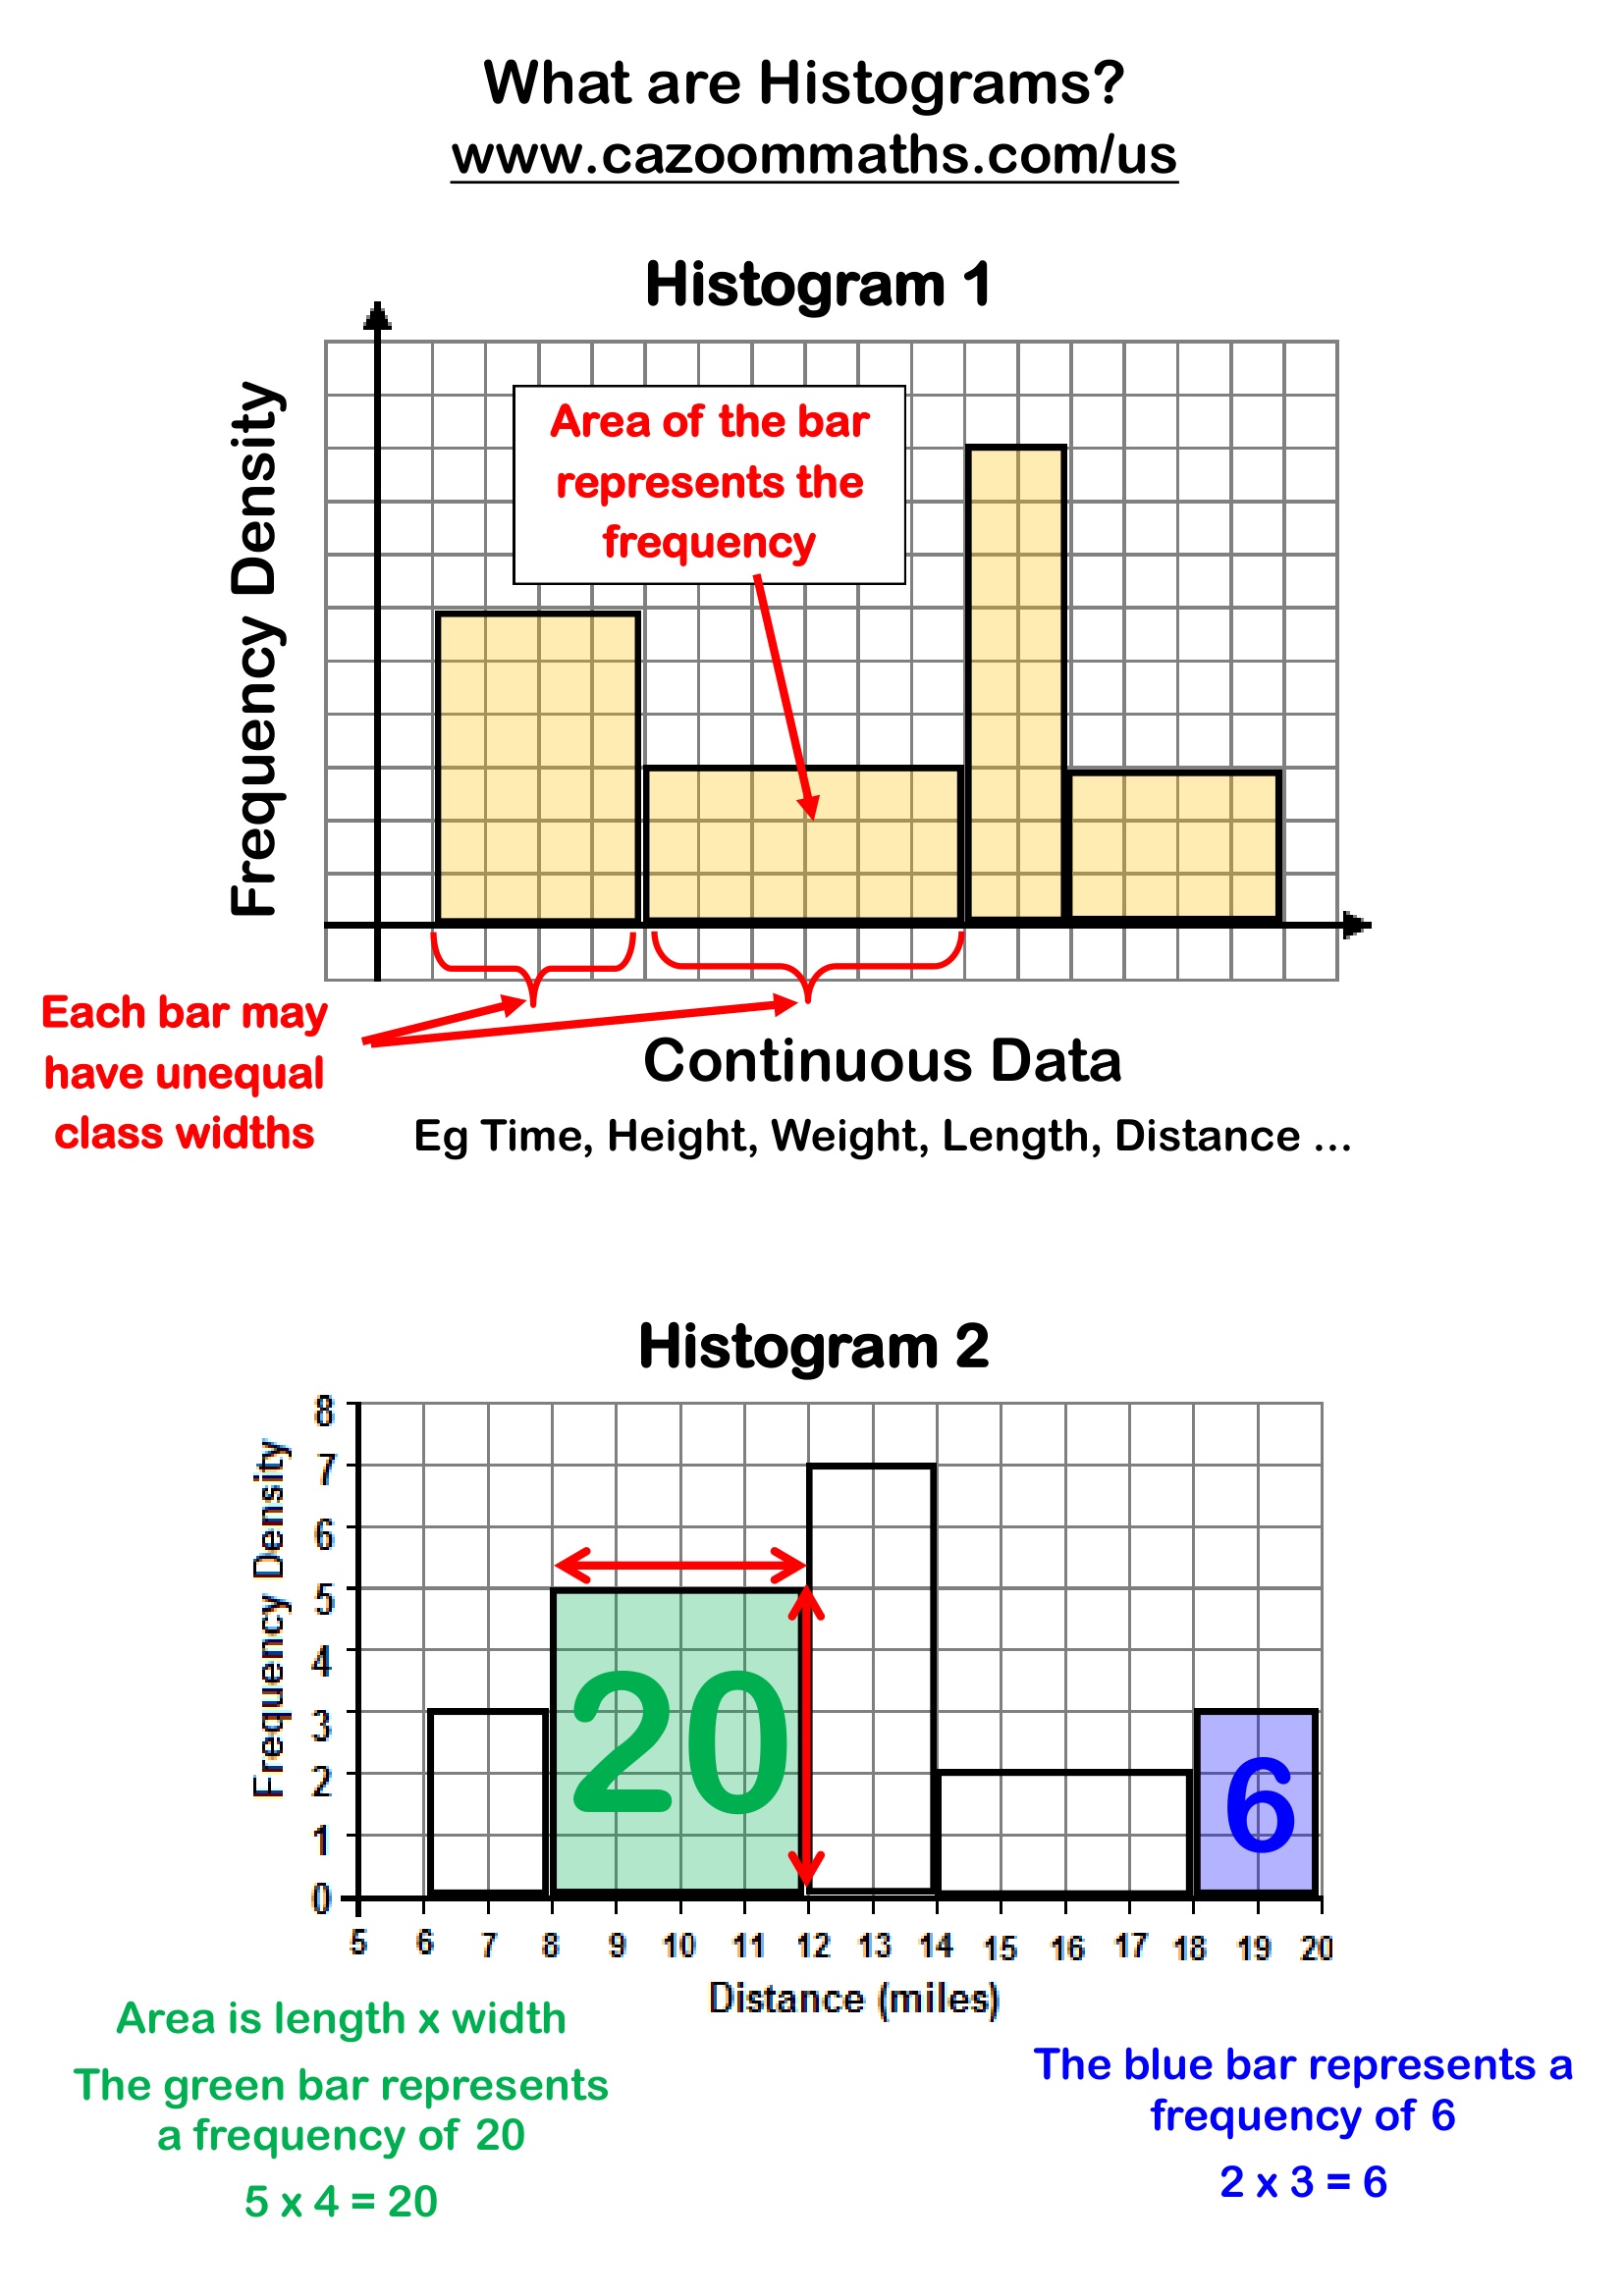
How to Draw Histograms
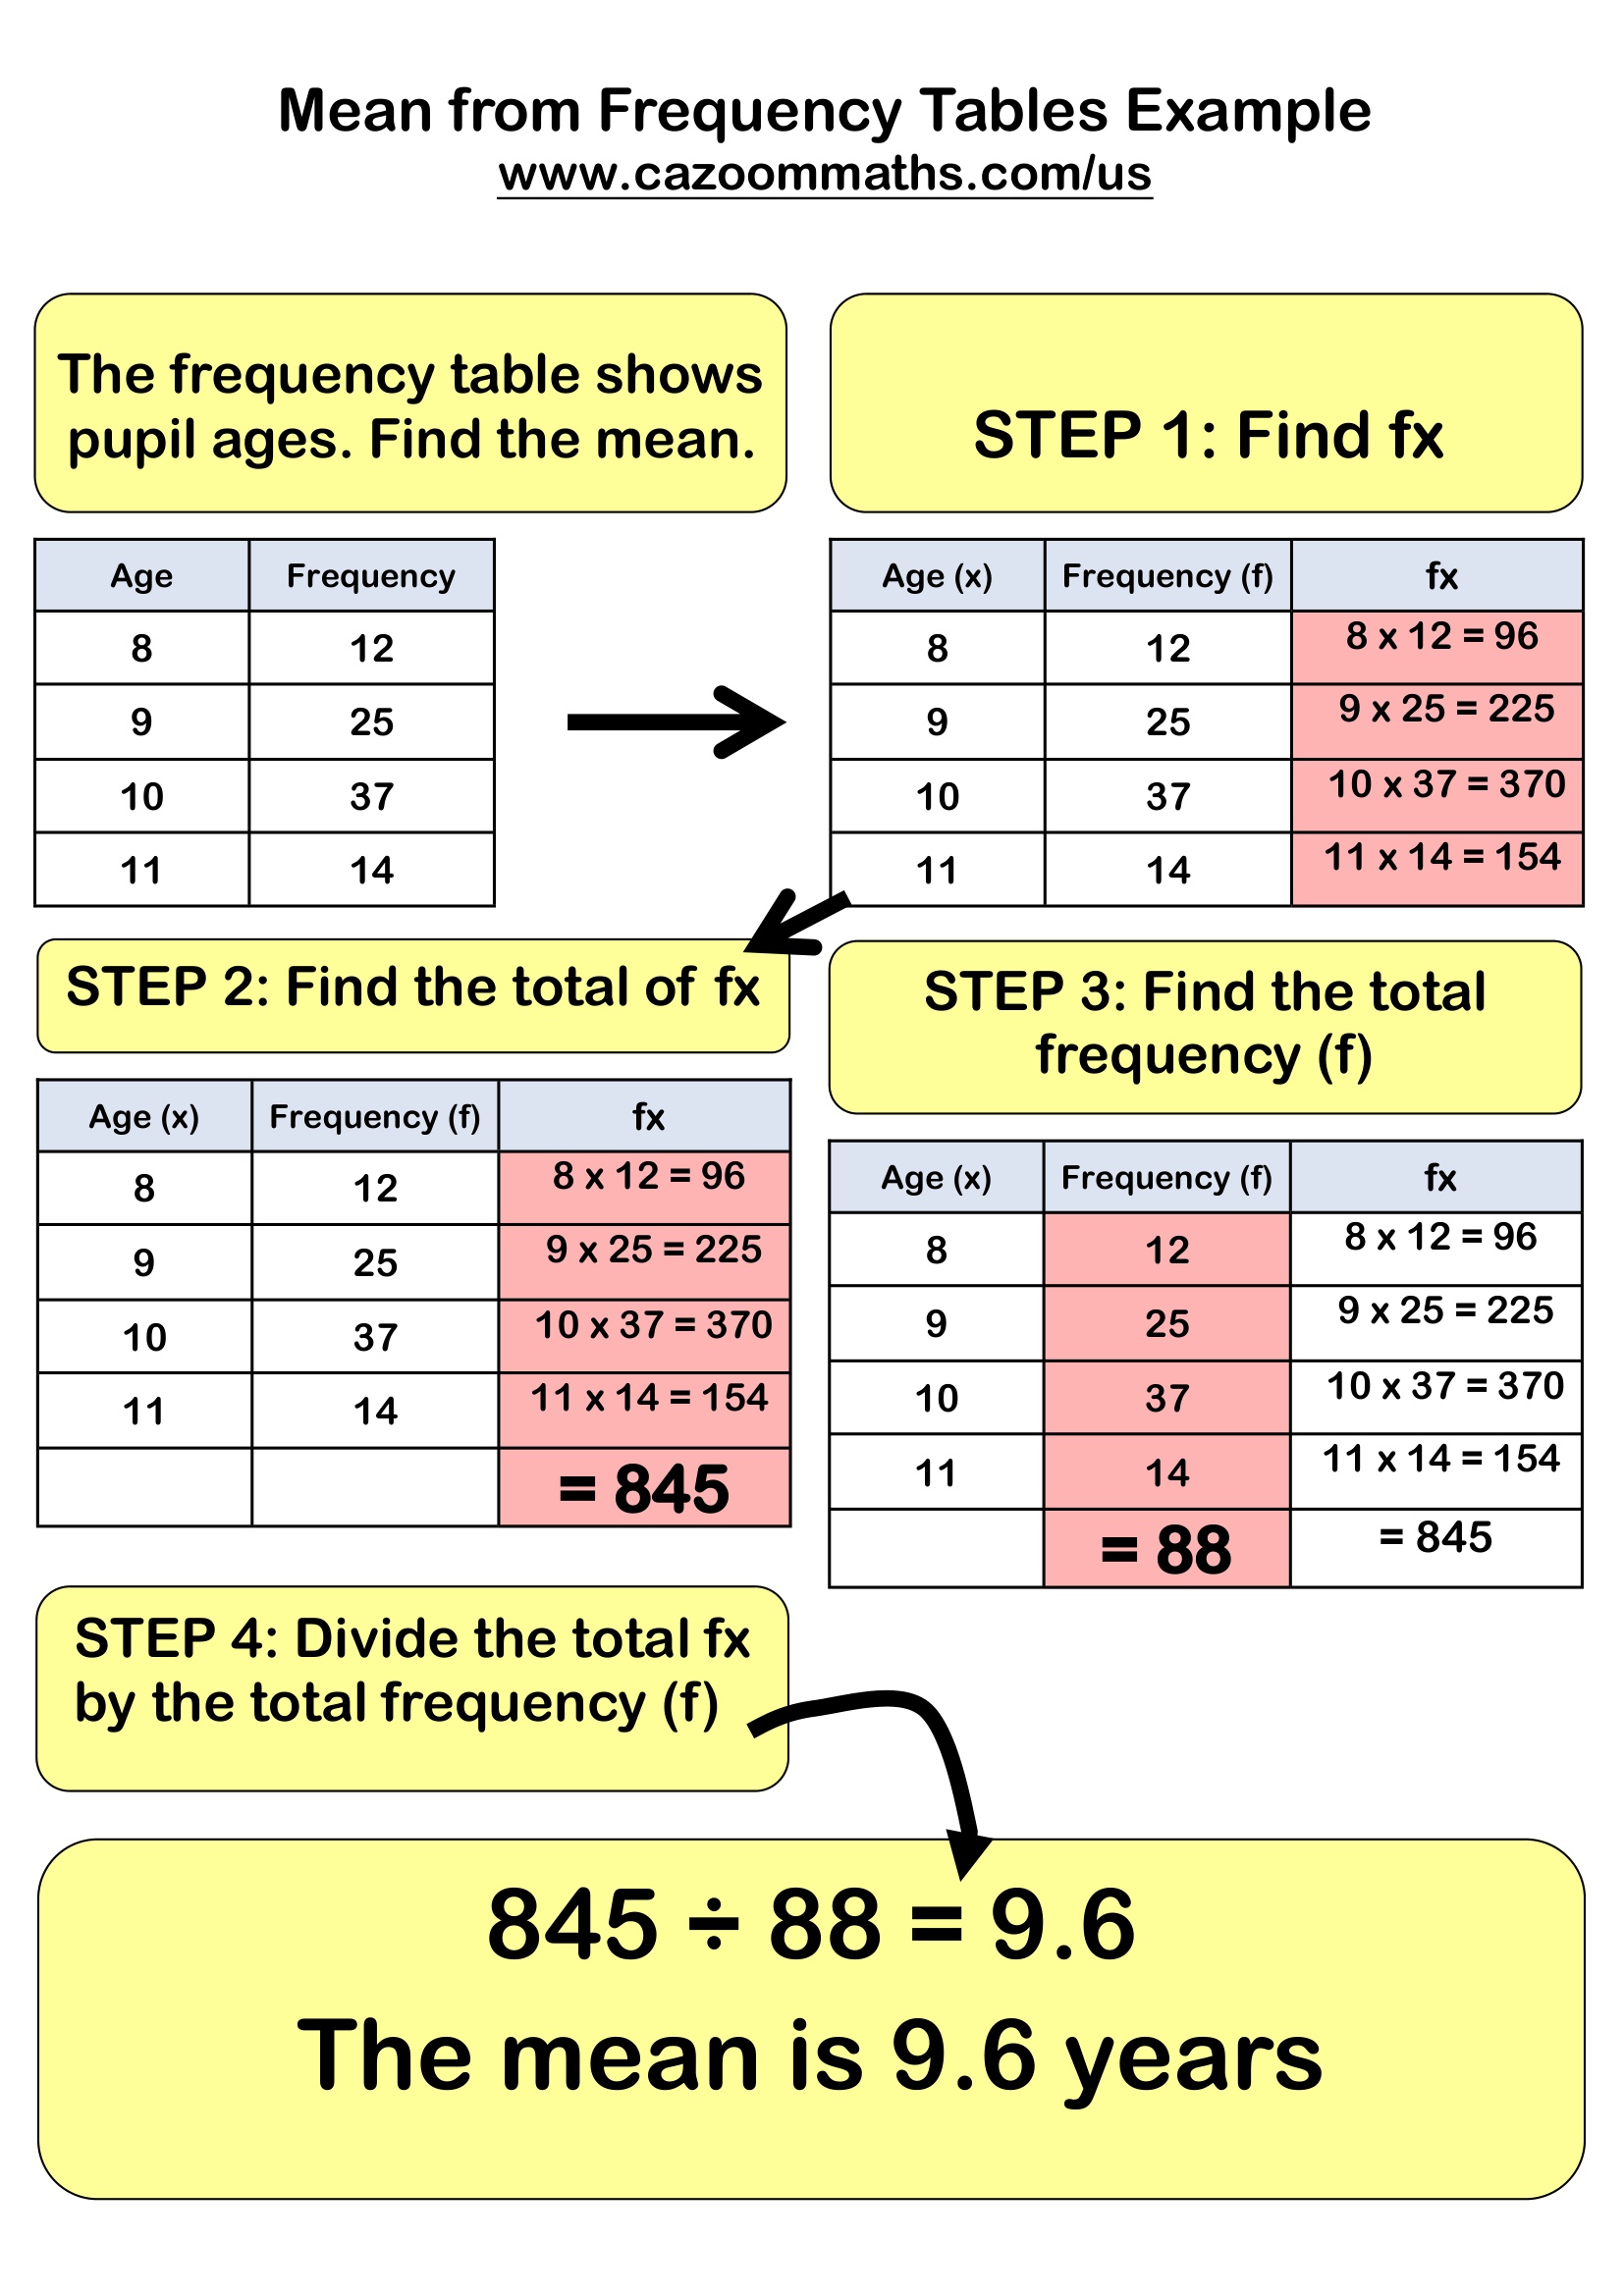
Mean From Frequency Table Example
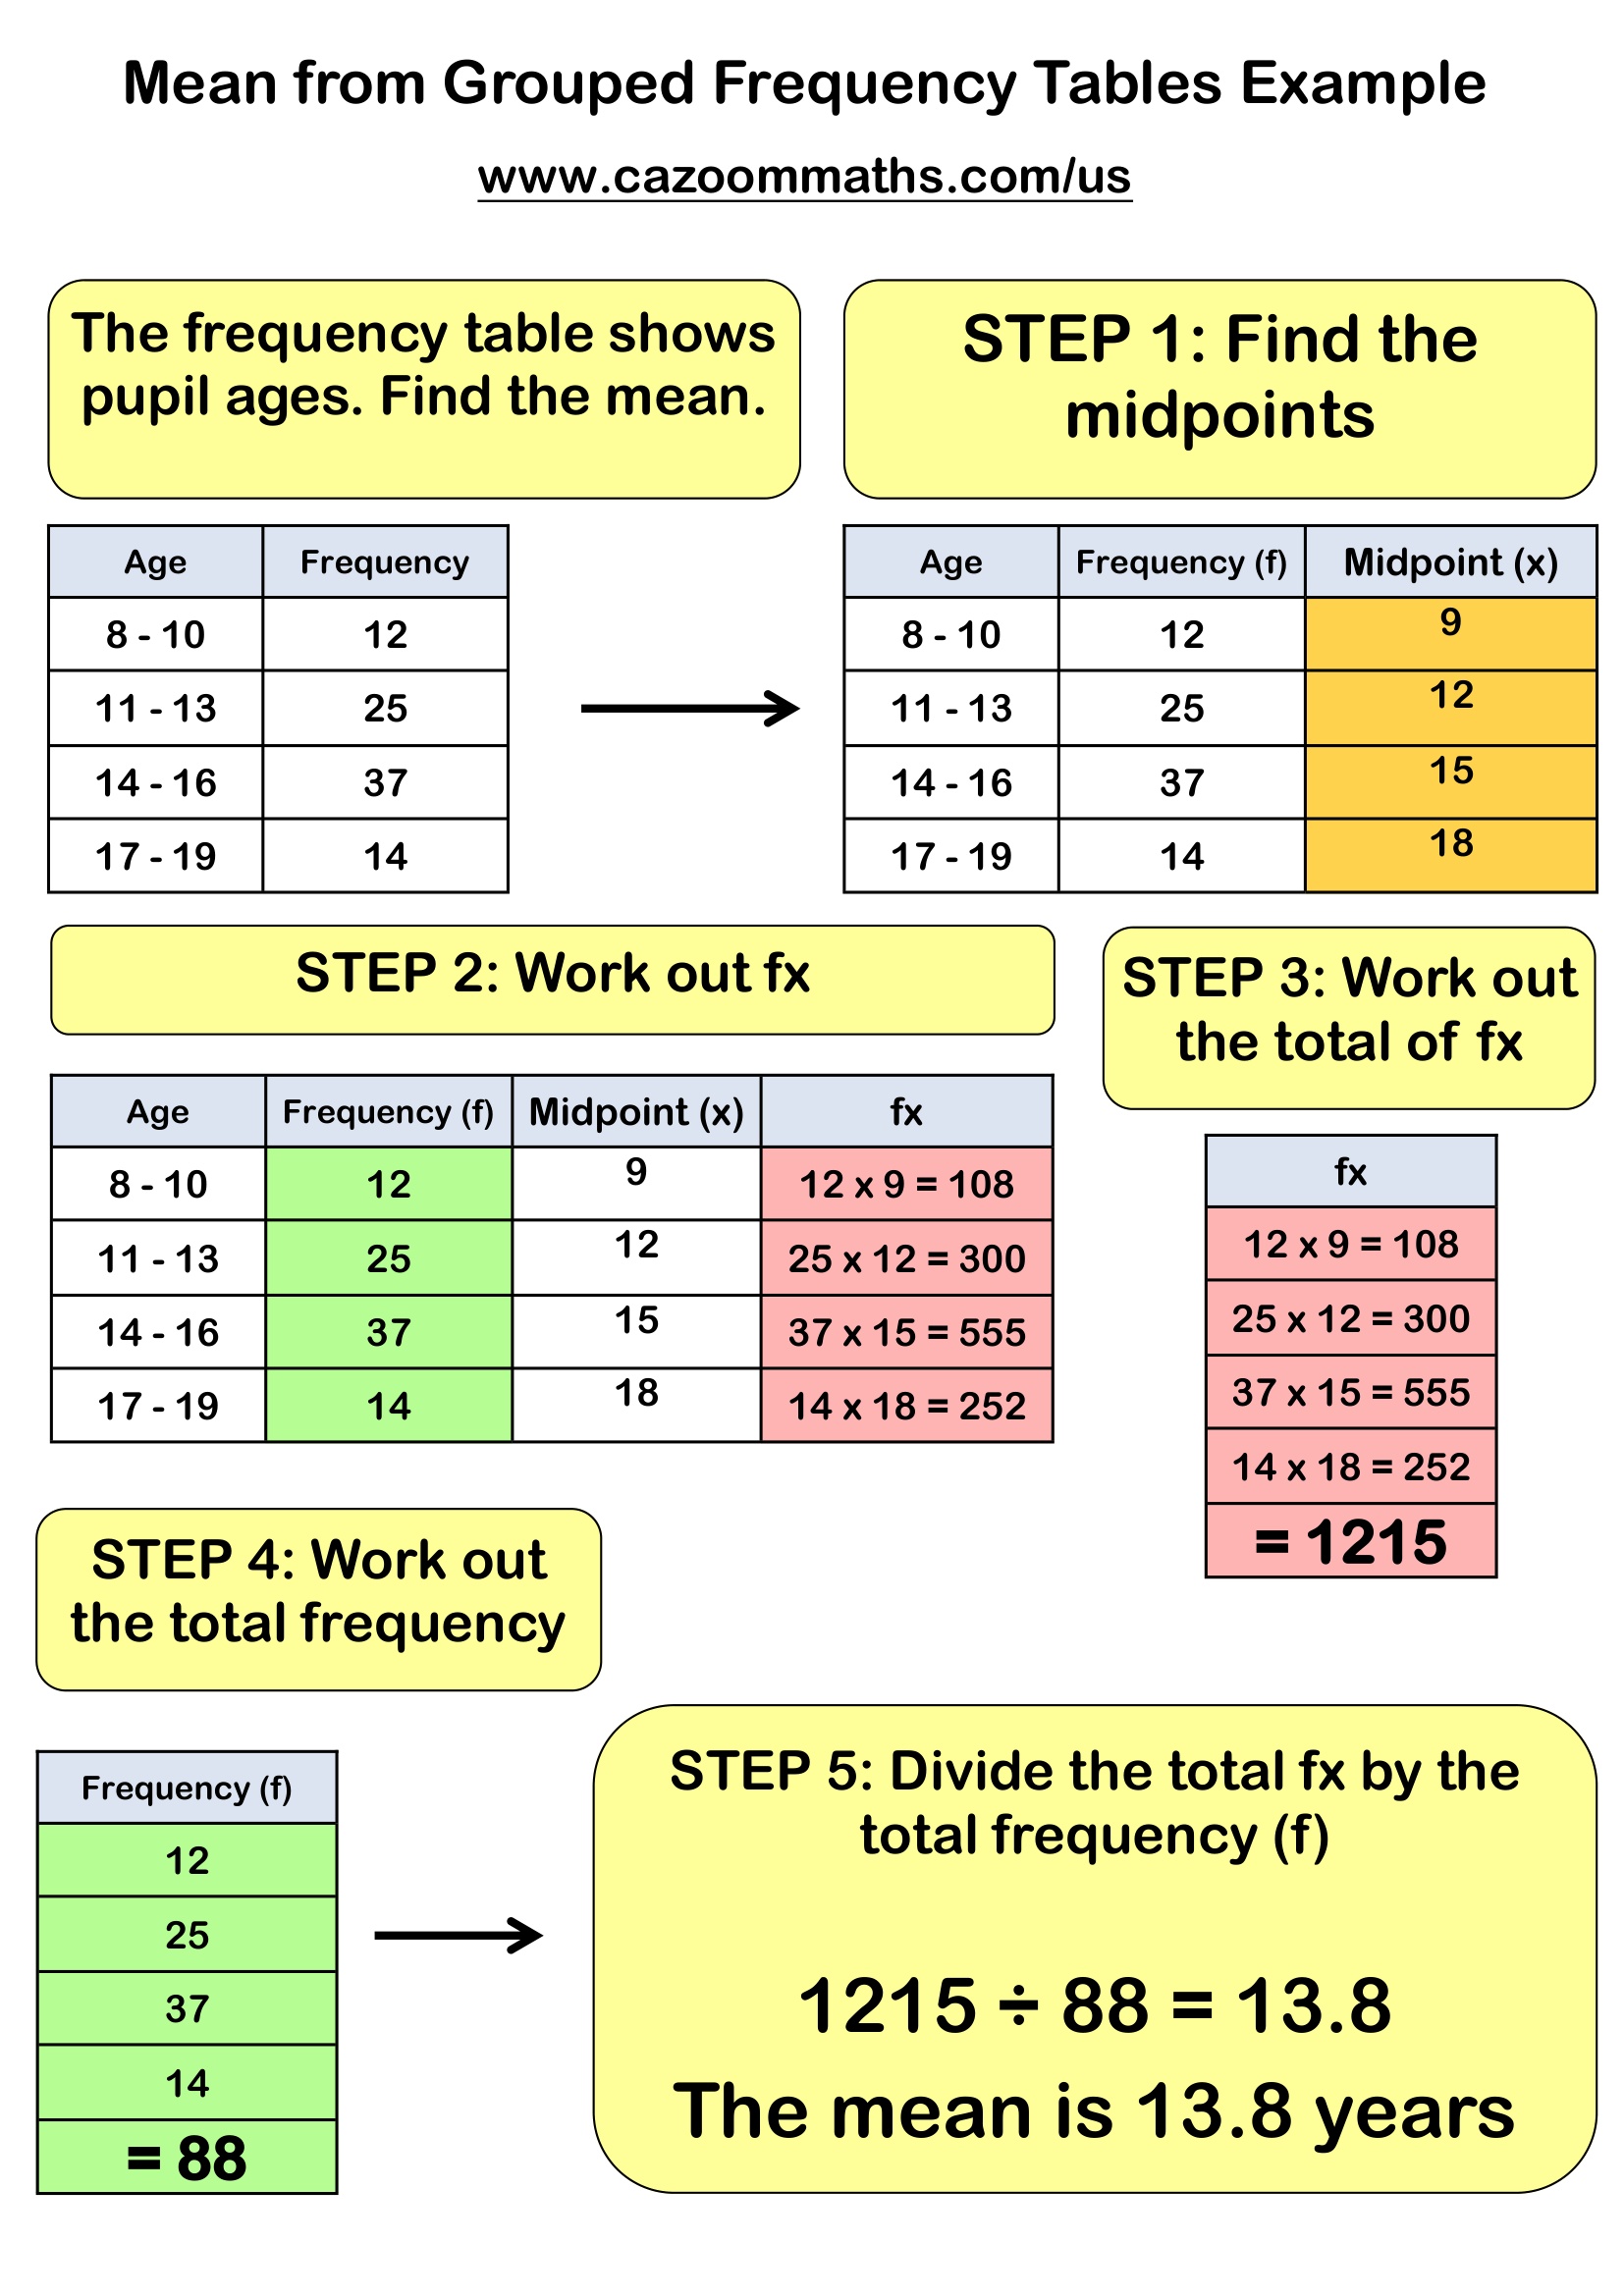
Mean From Grouped Frequency Table Example
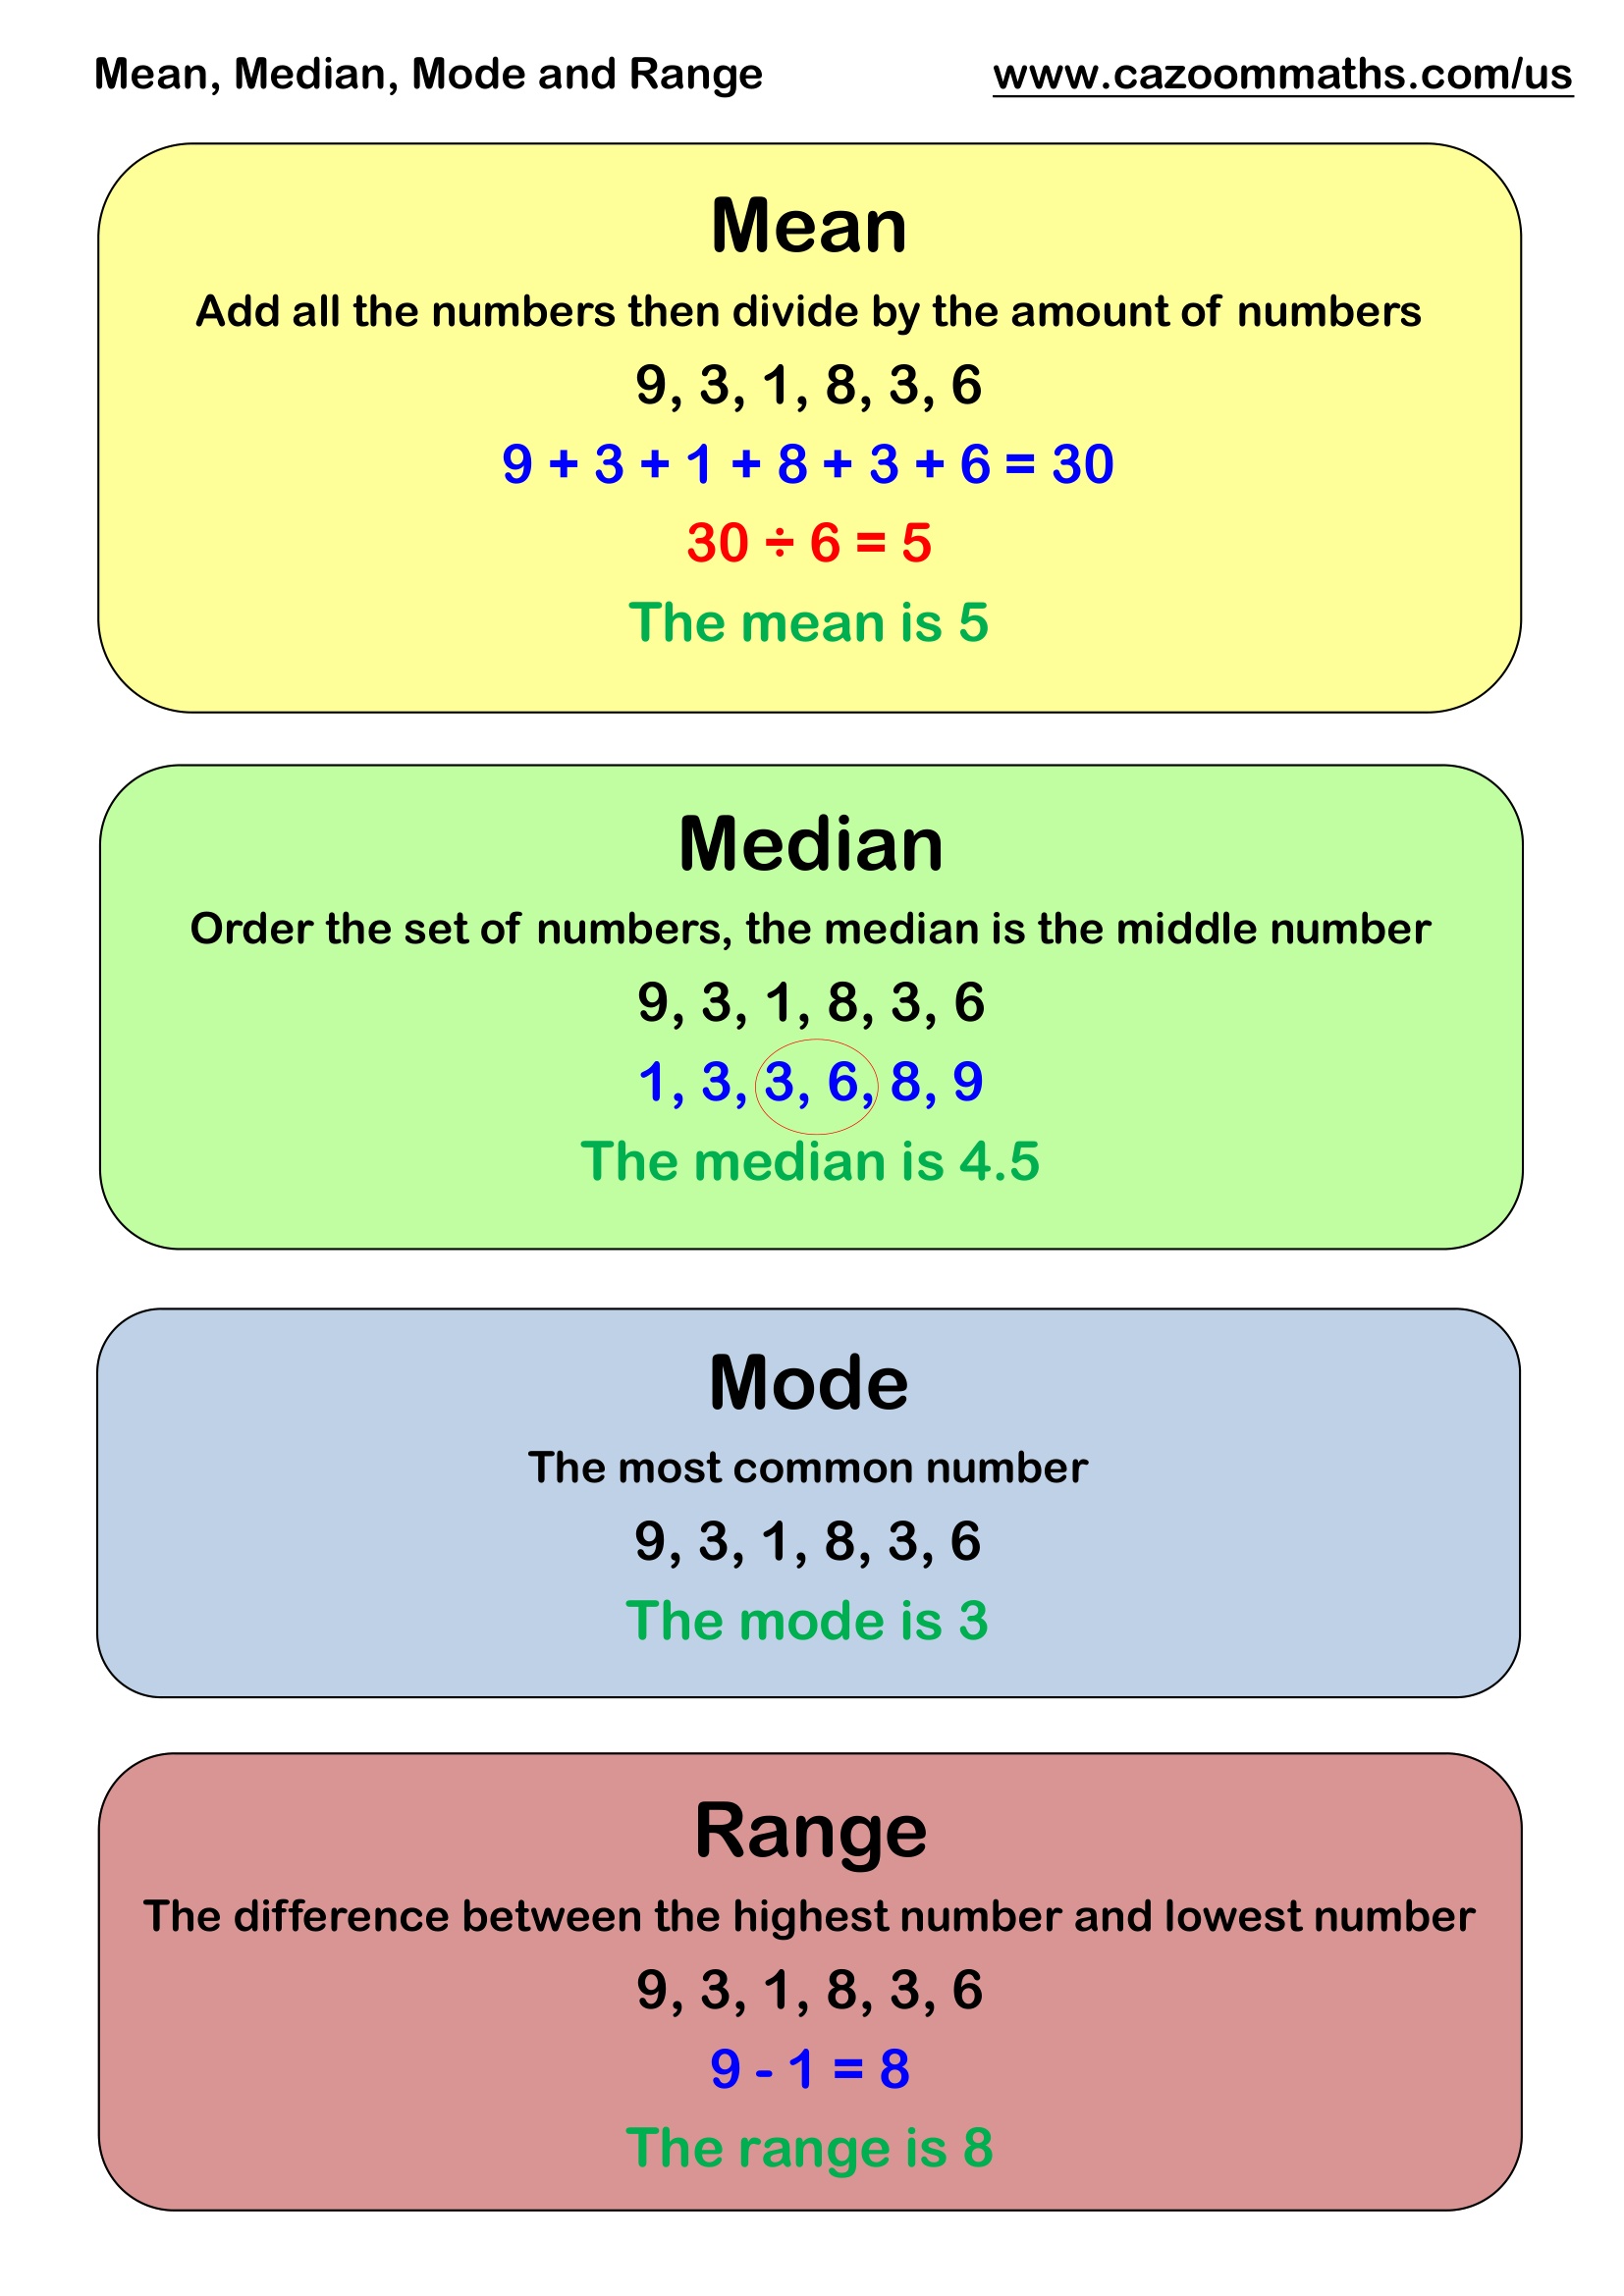
Mean, Median Mode and Range
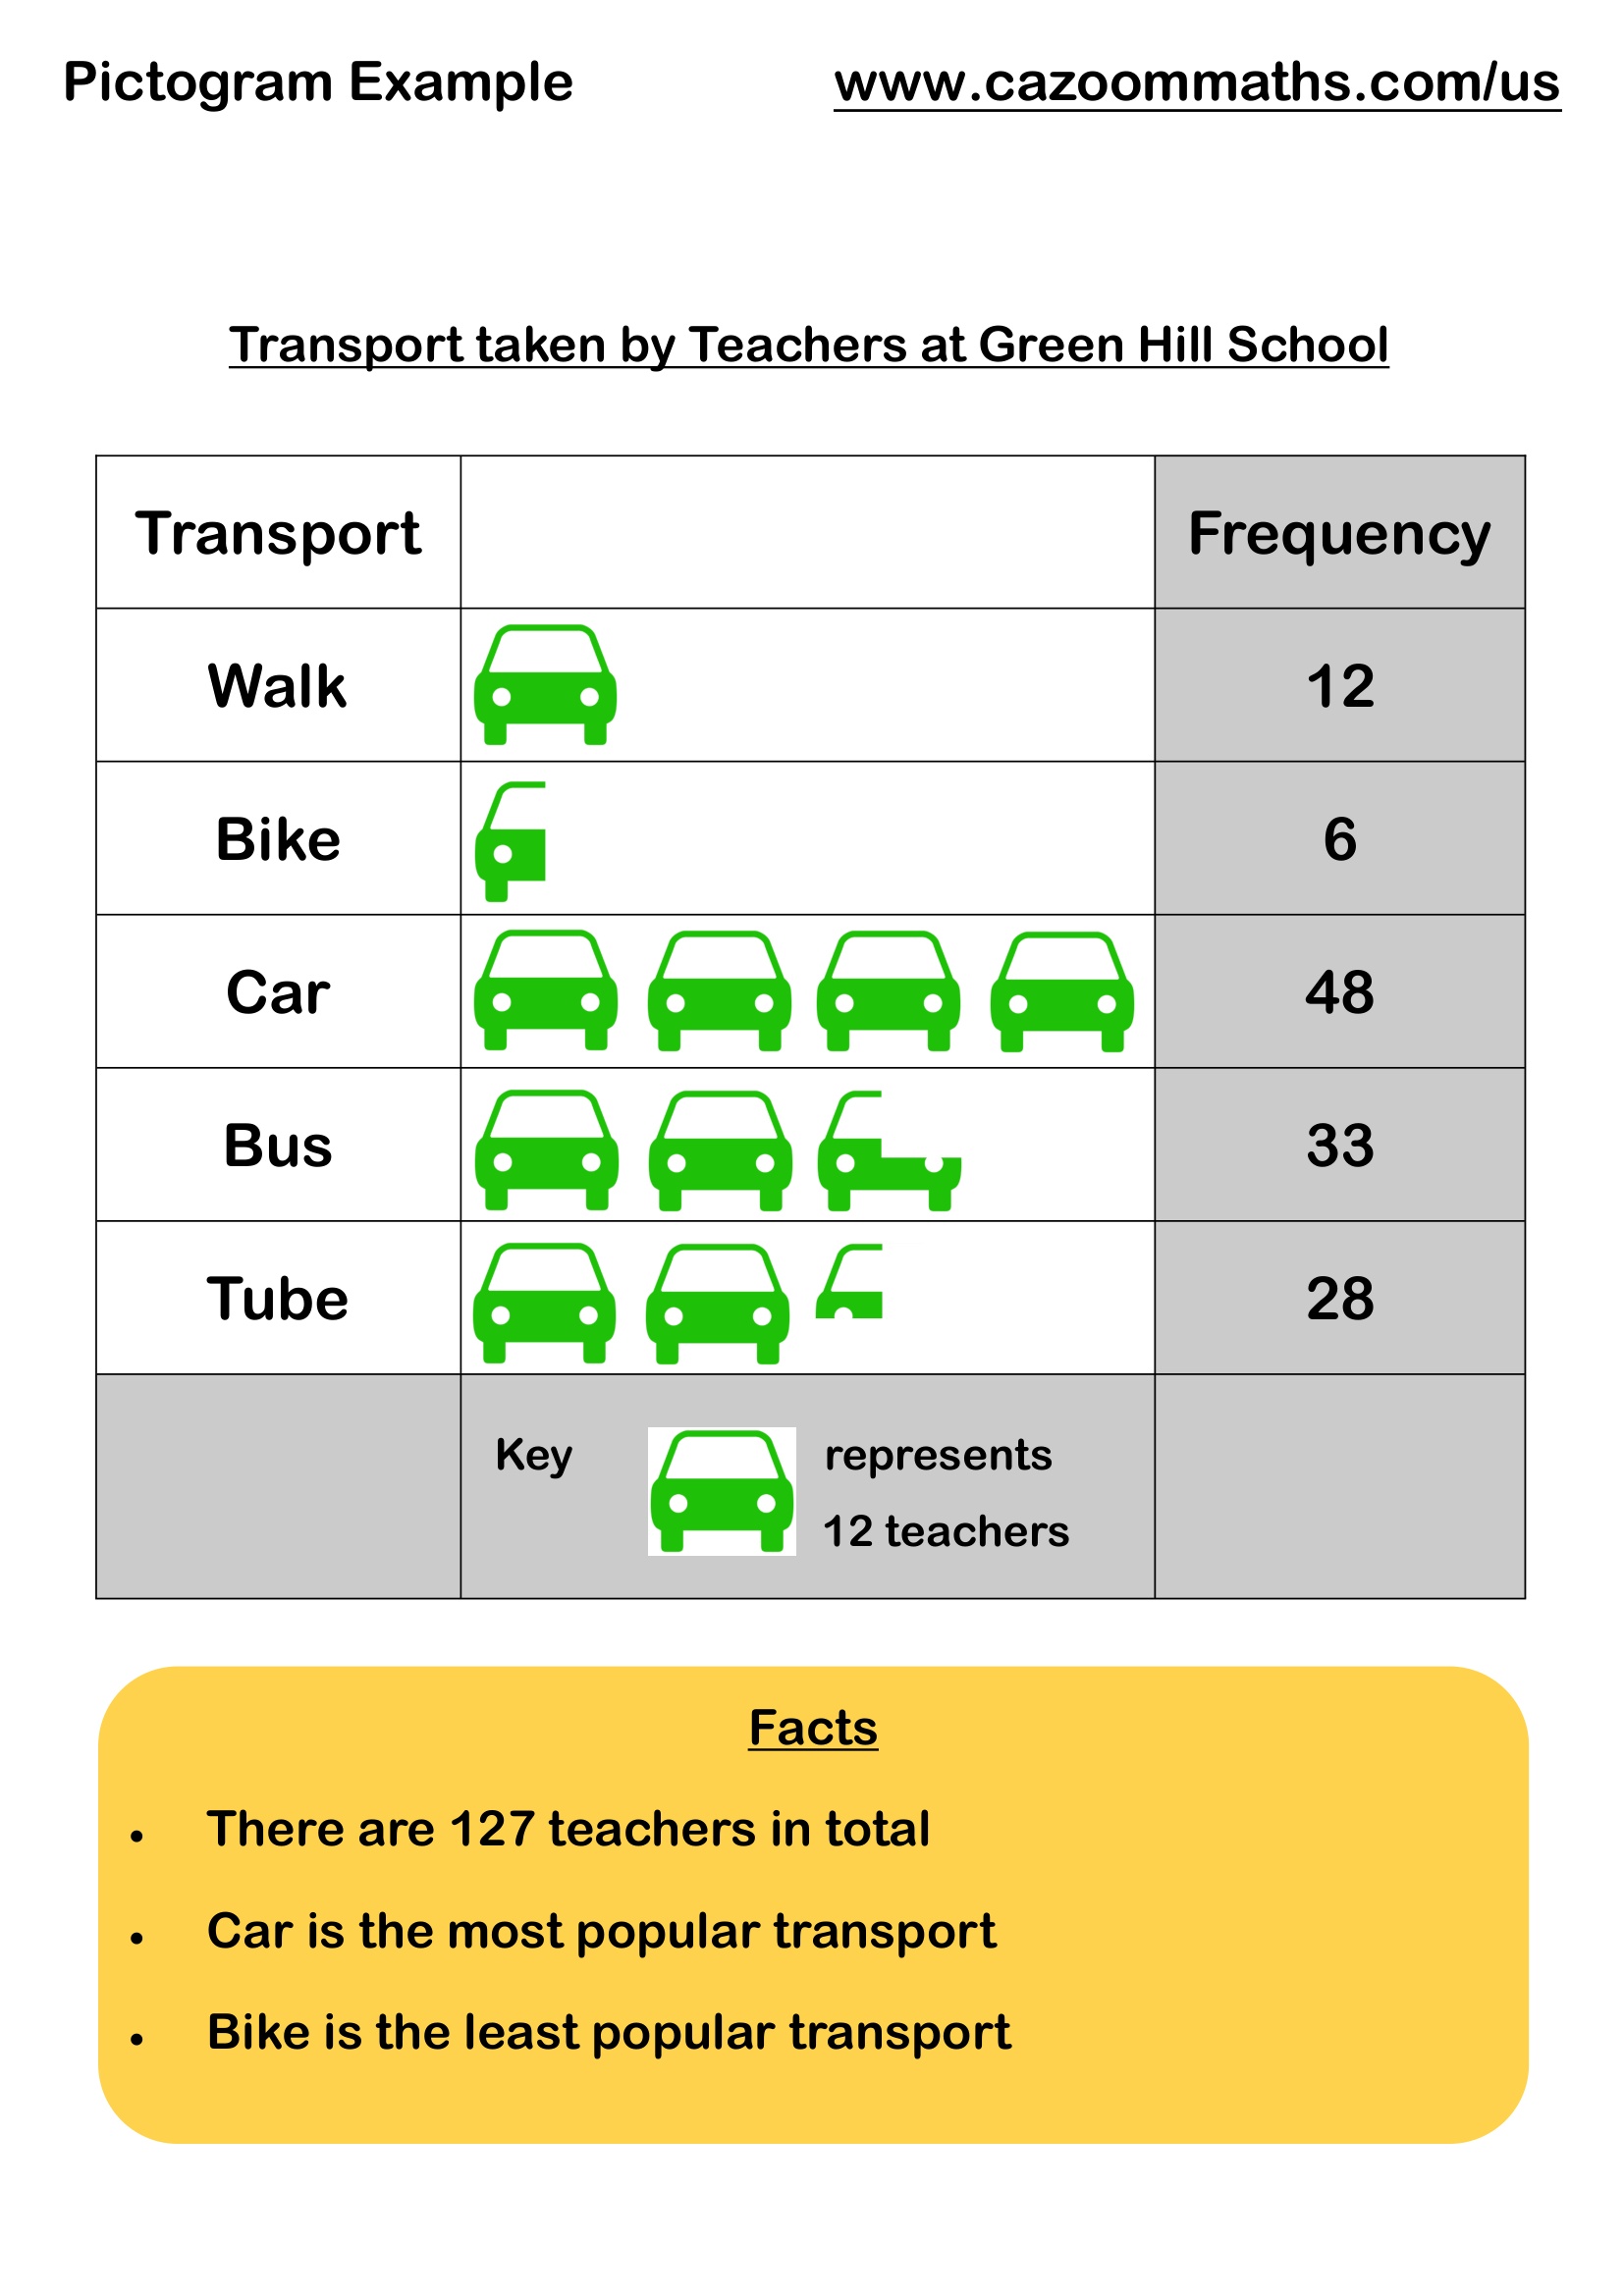
Pictogram Example
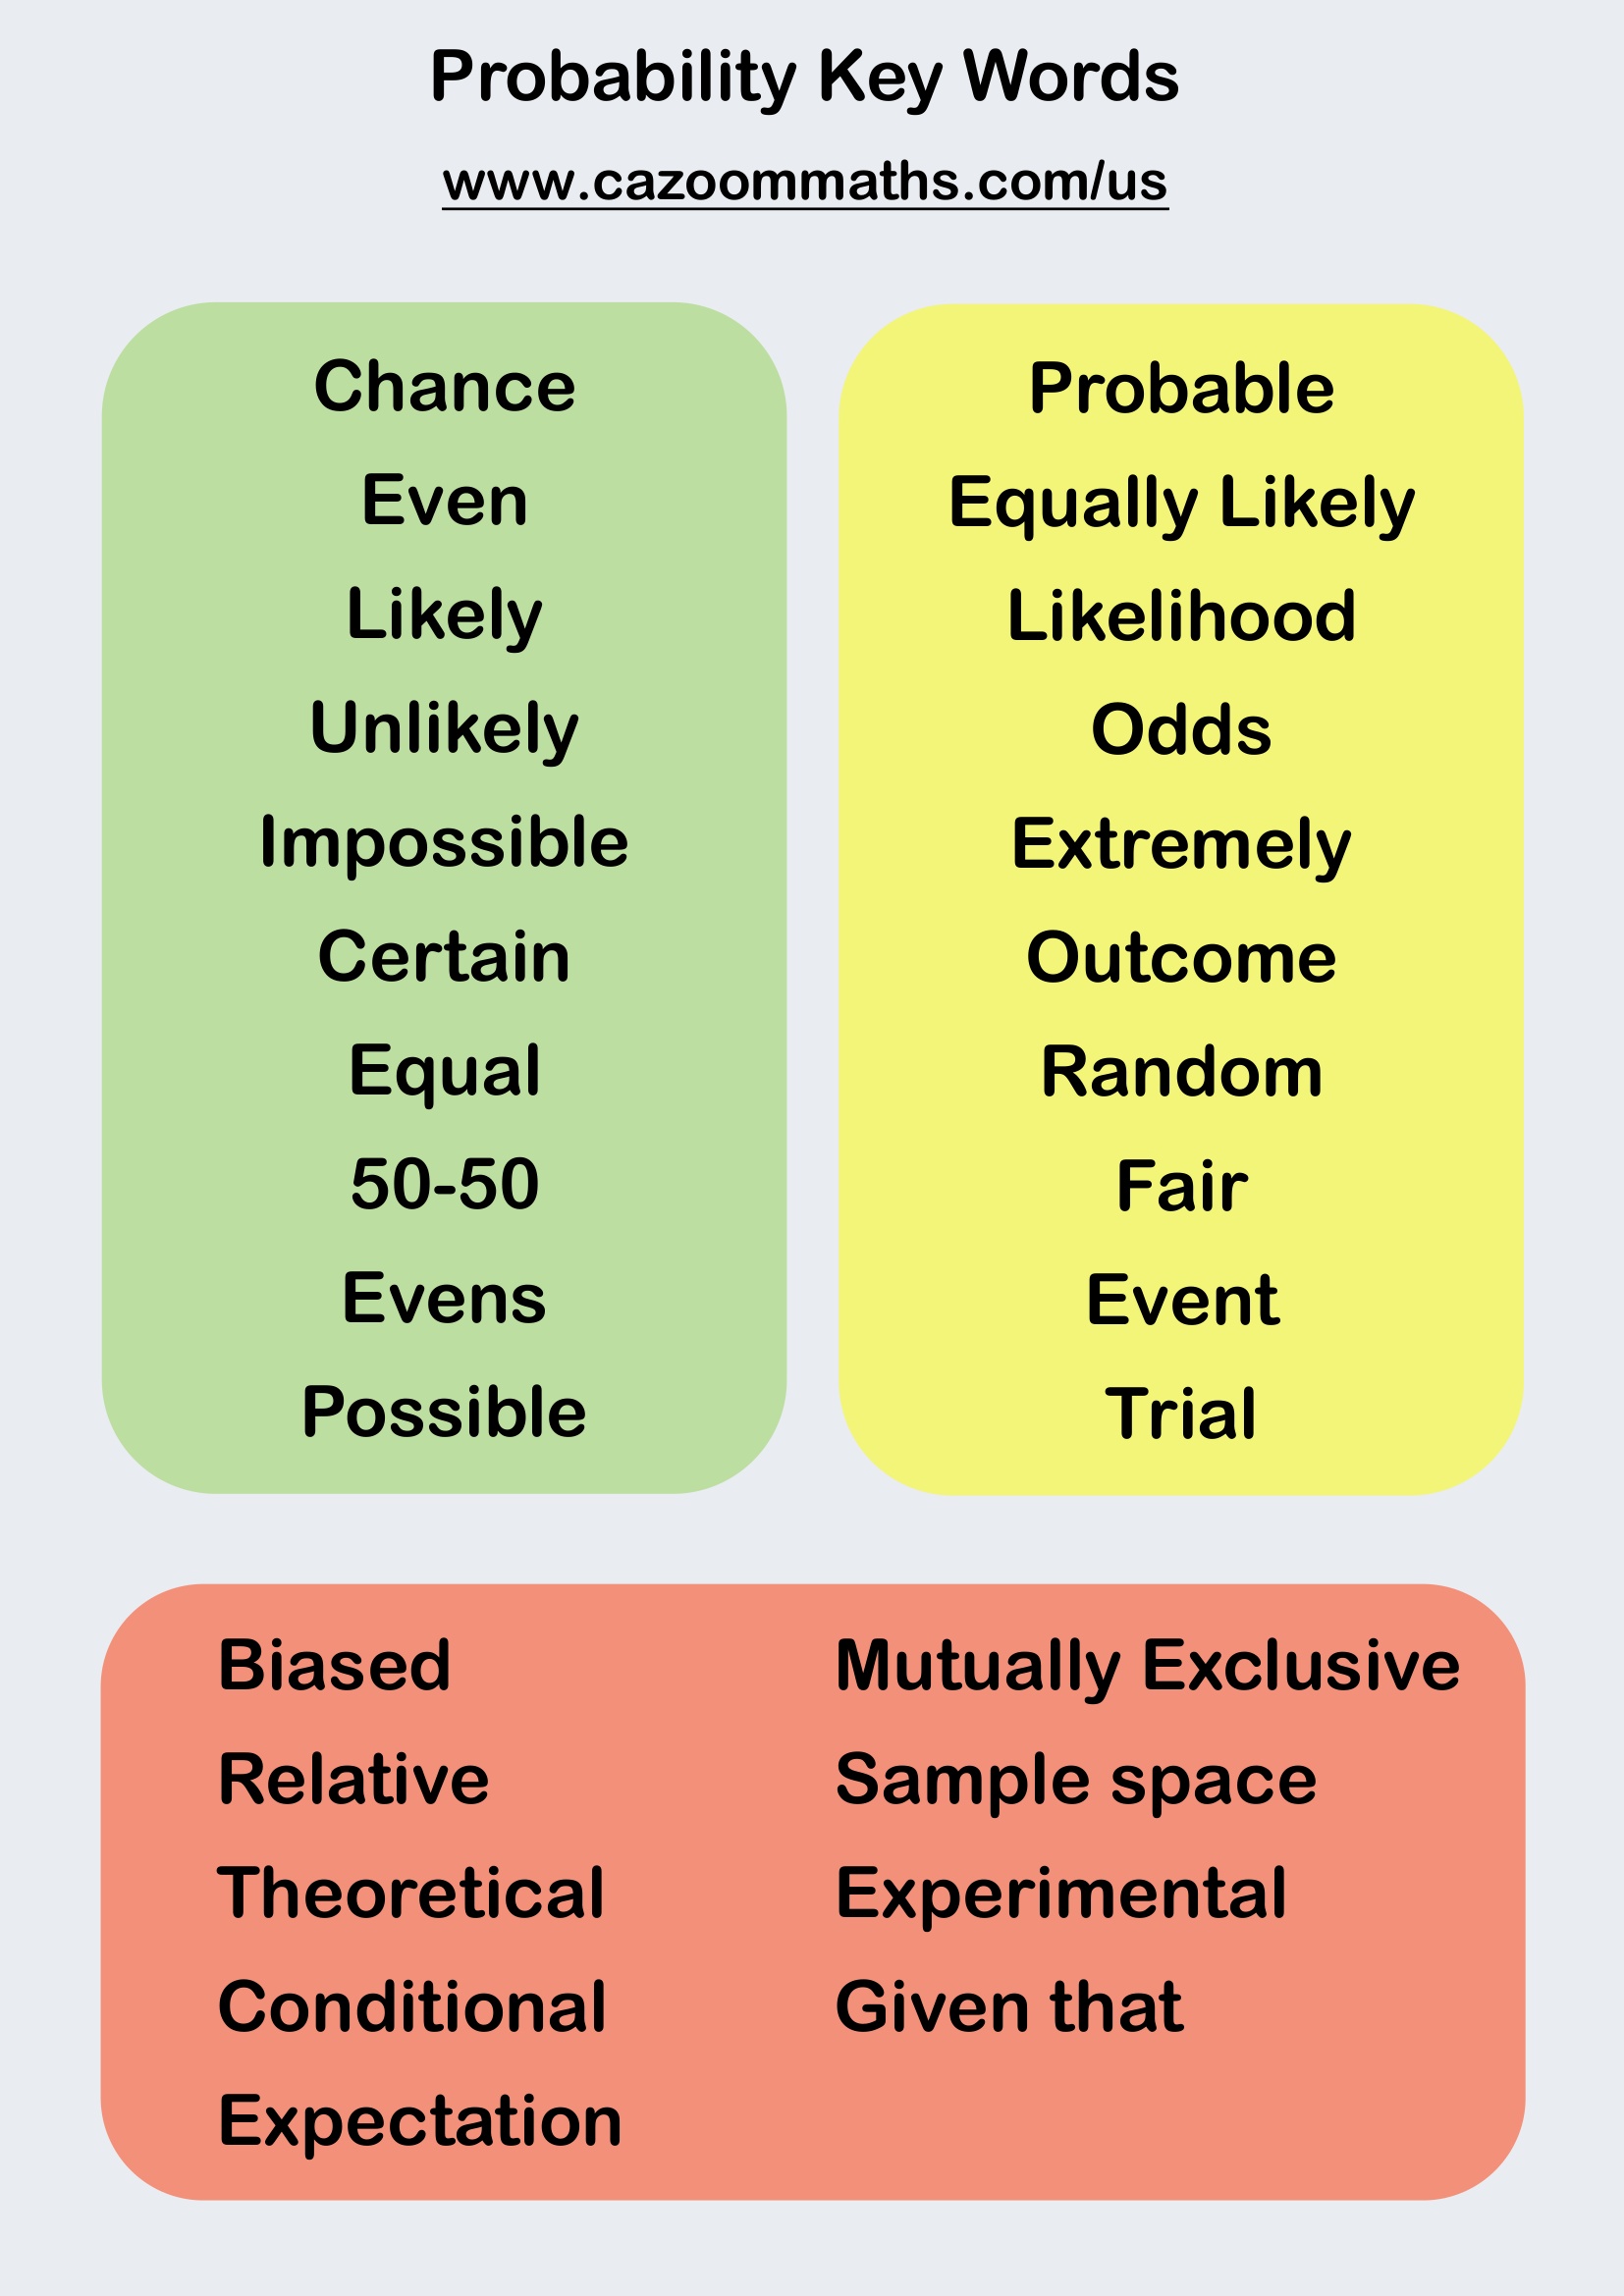
Probability Key Words
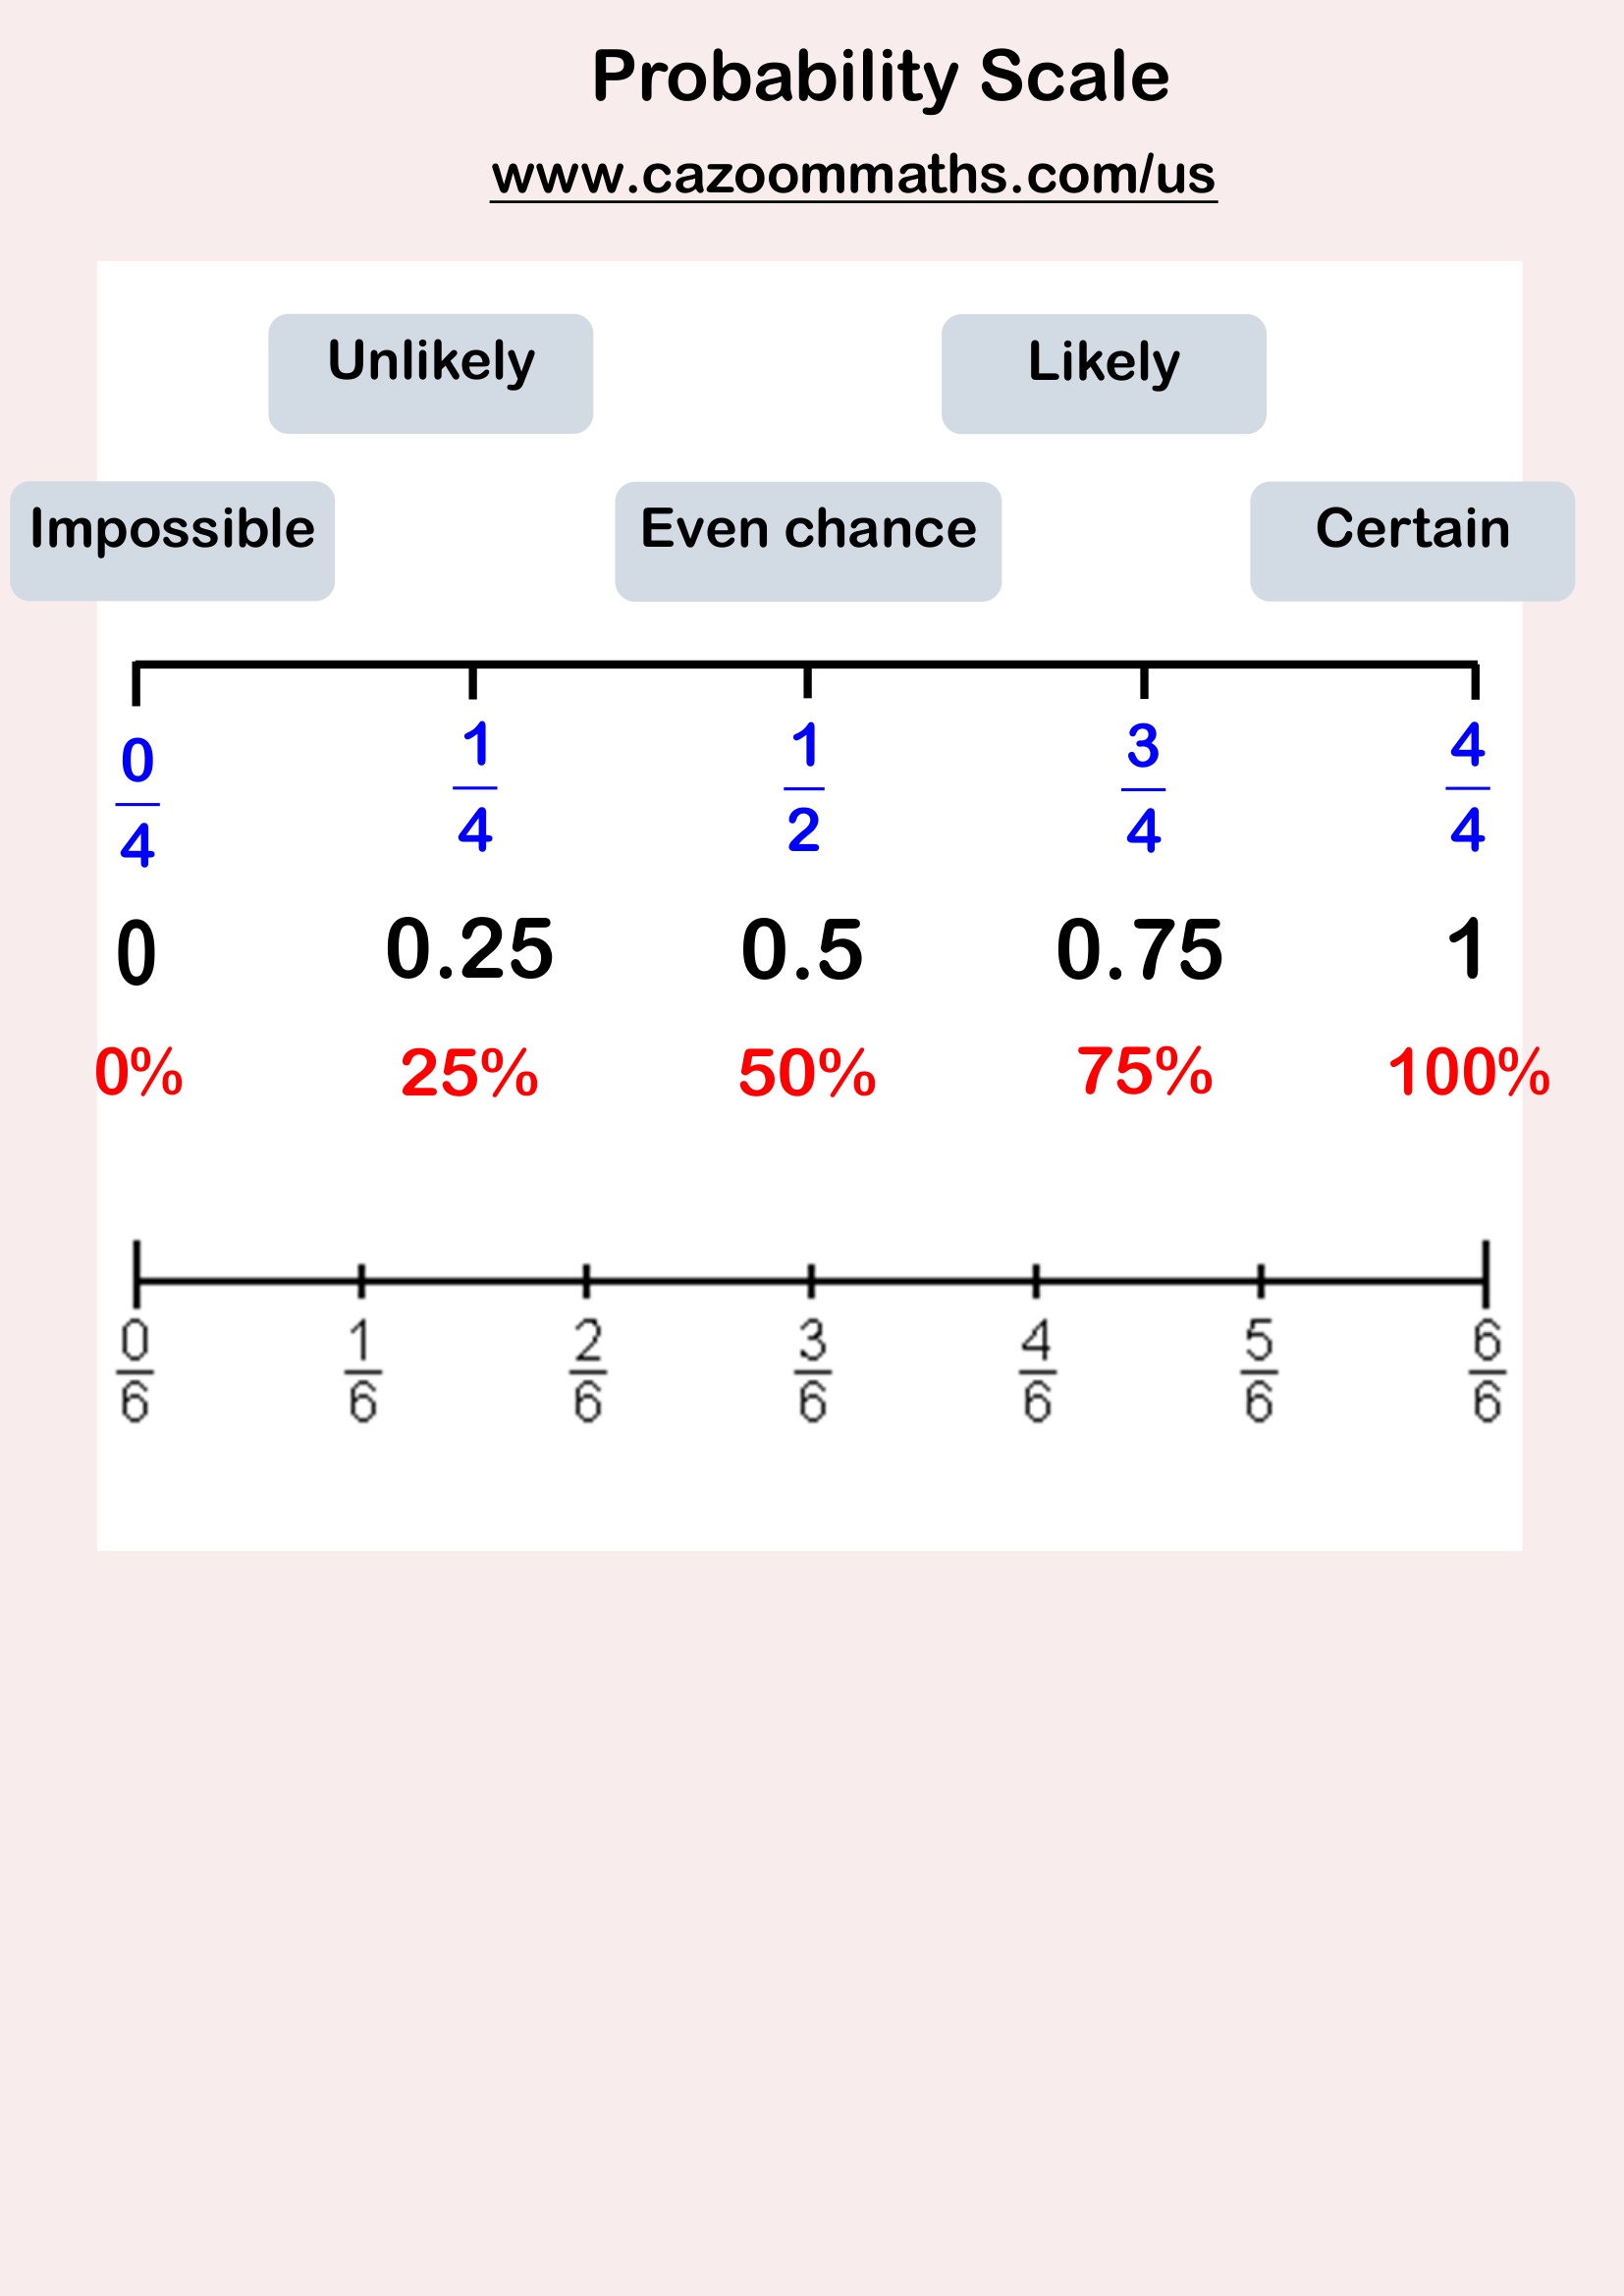
Probability Scale
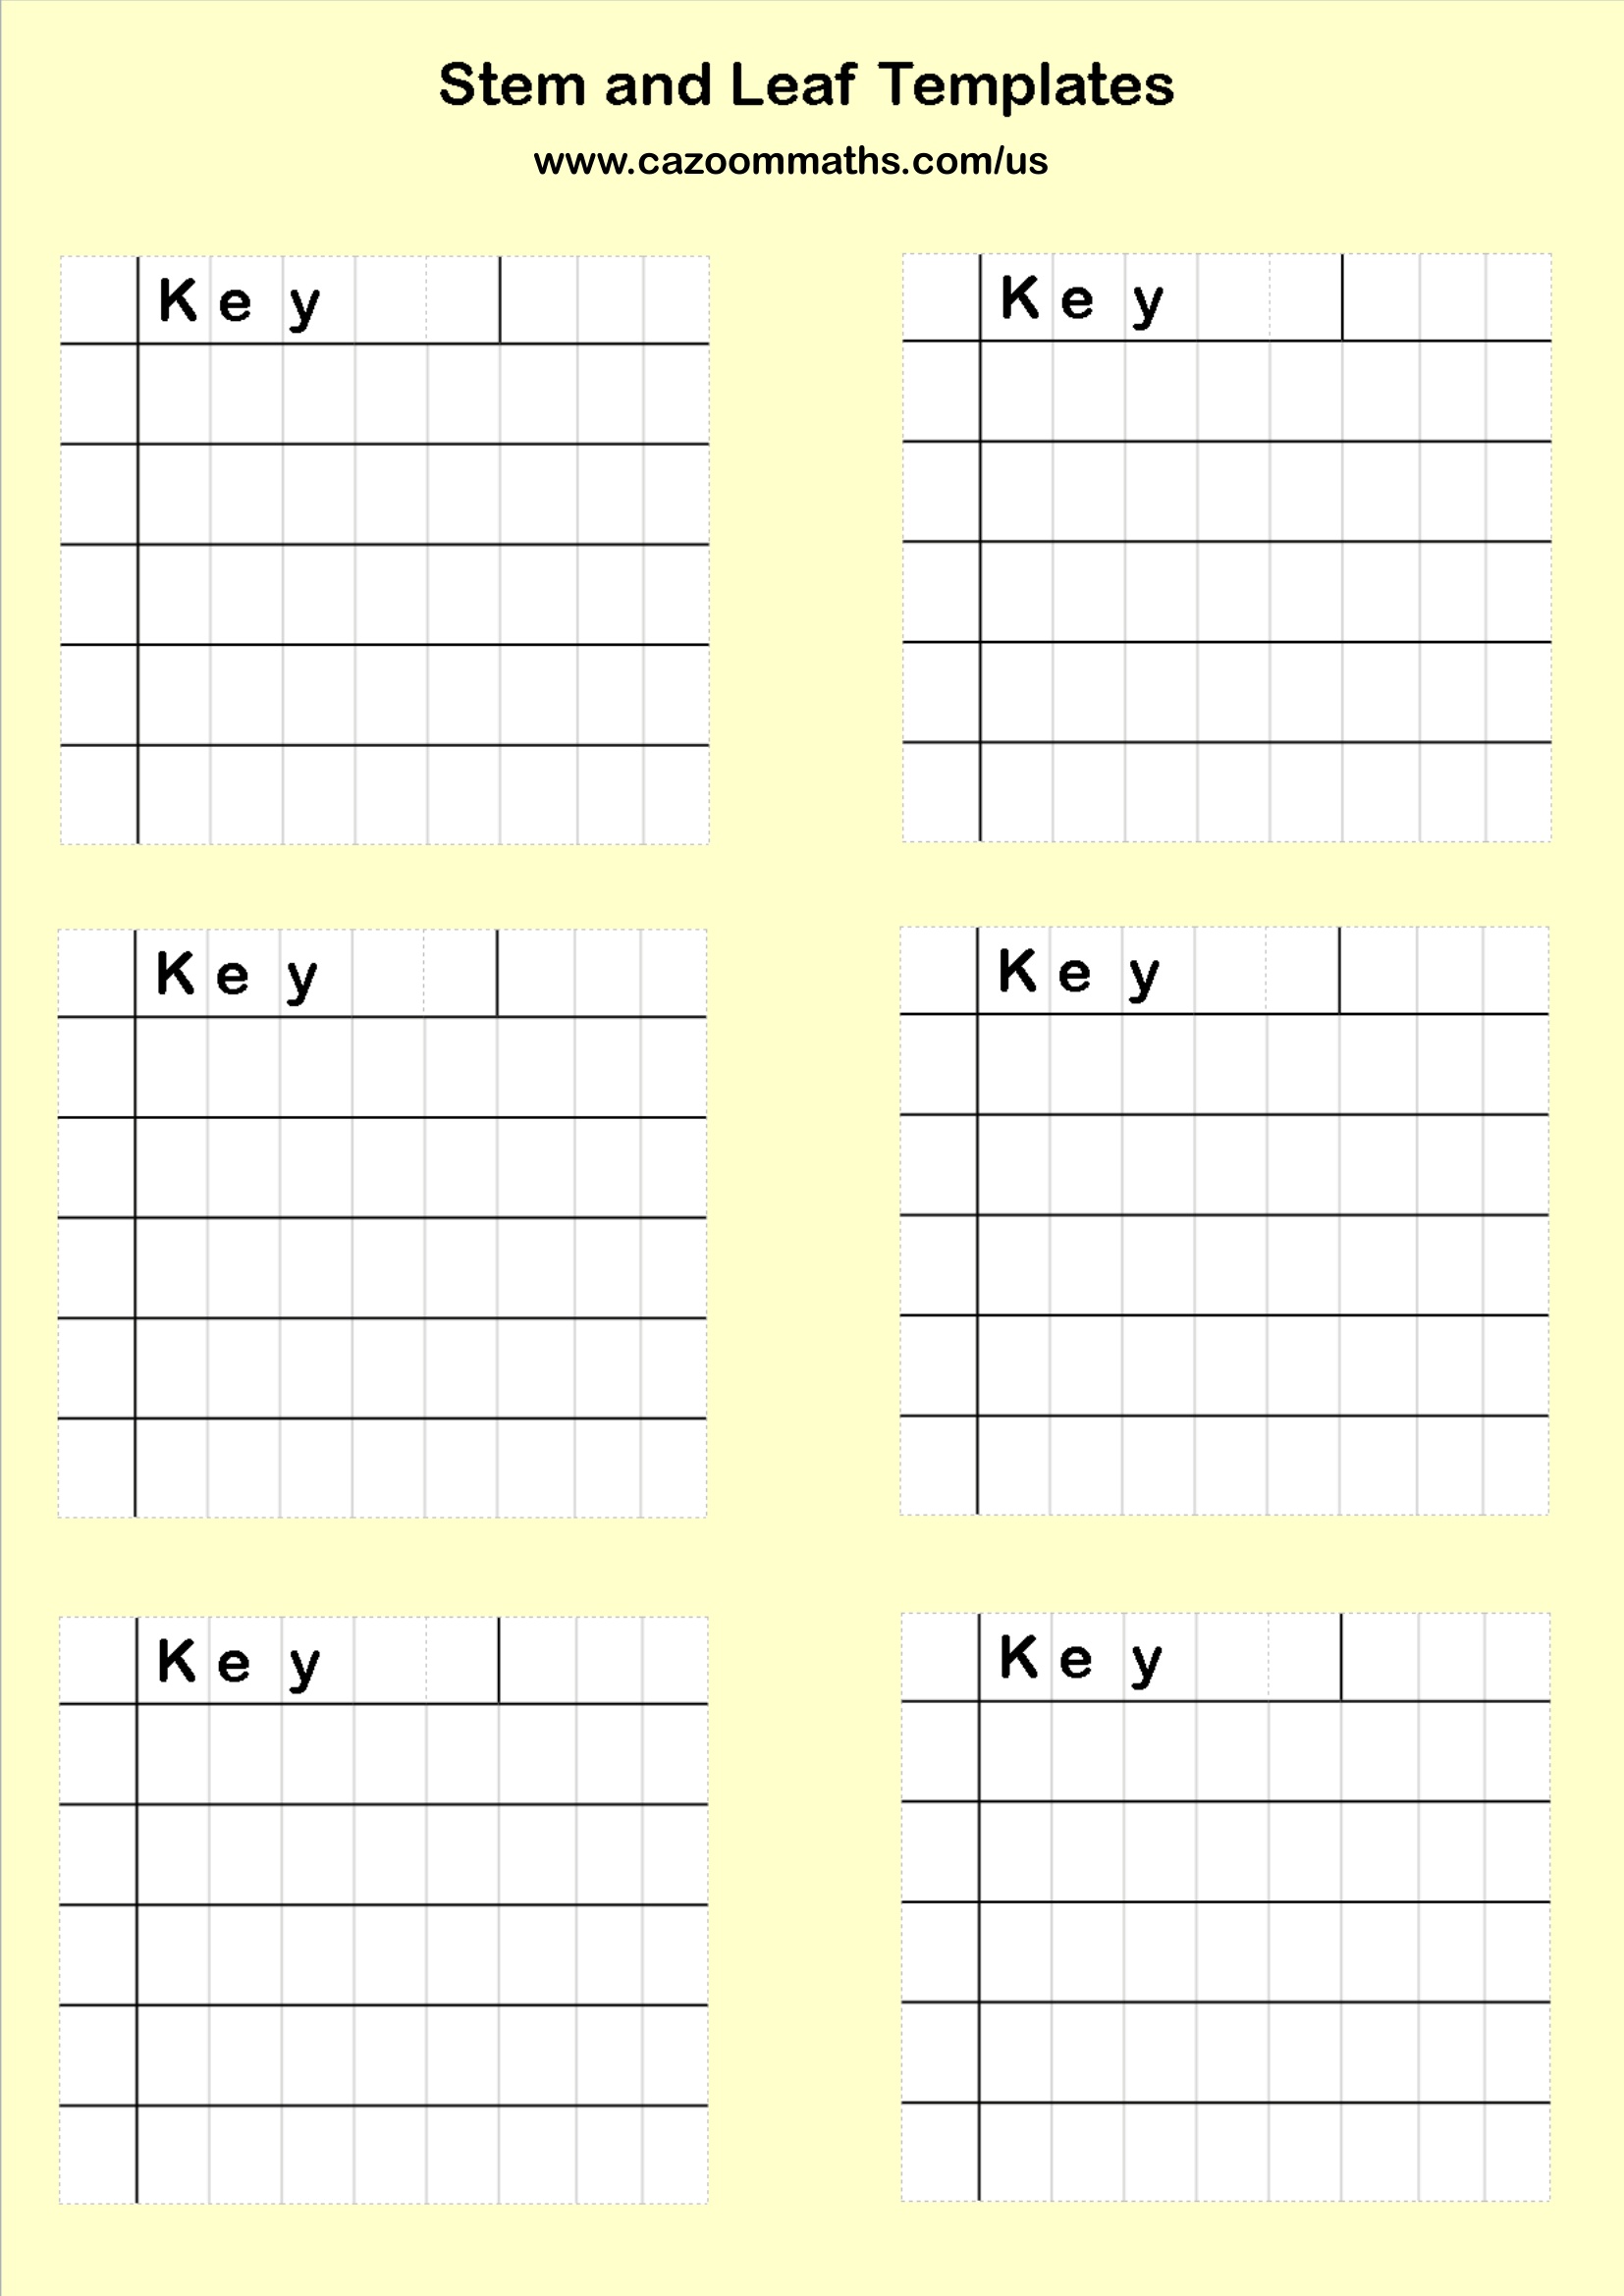
Stem and Leaf Diagrams Templates
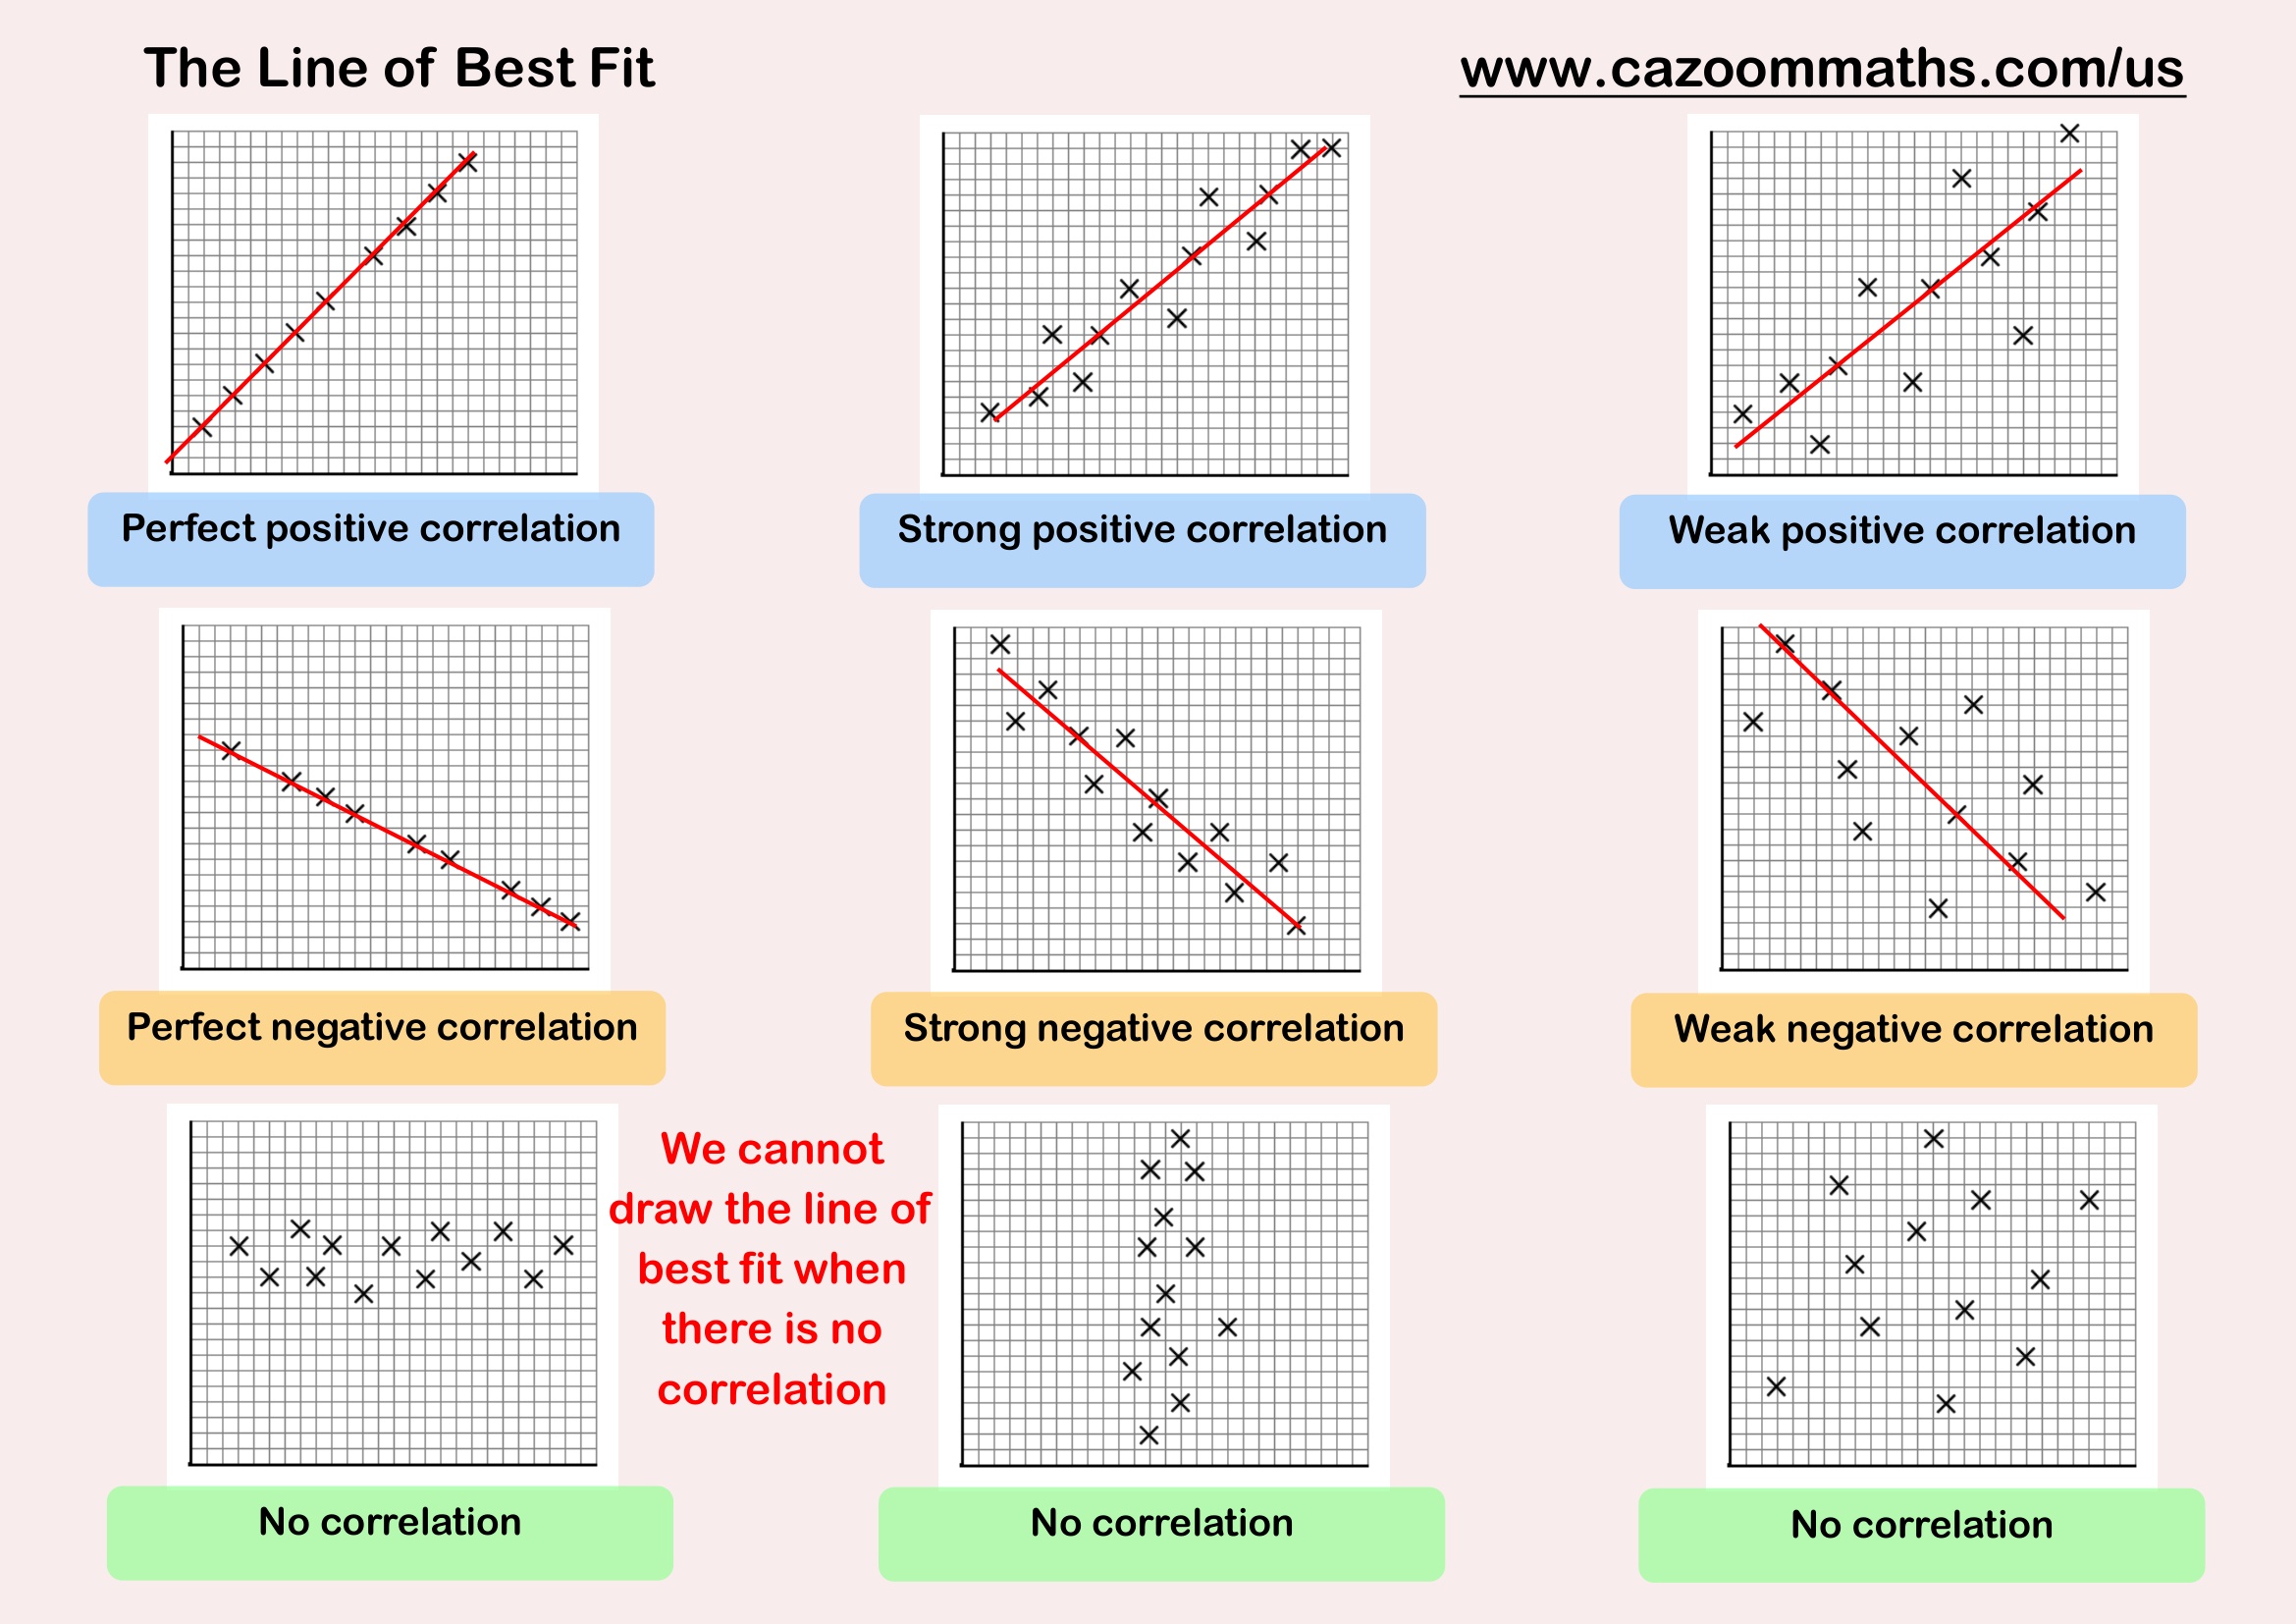
The Line of Best Fit
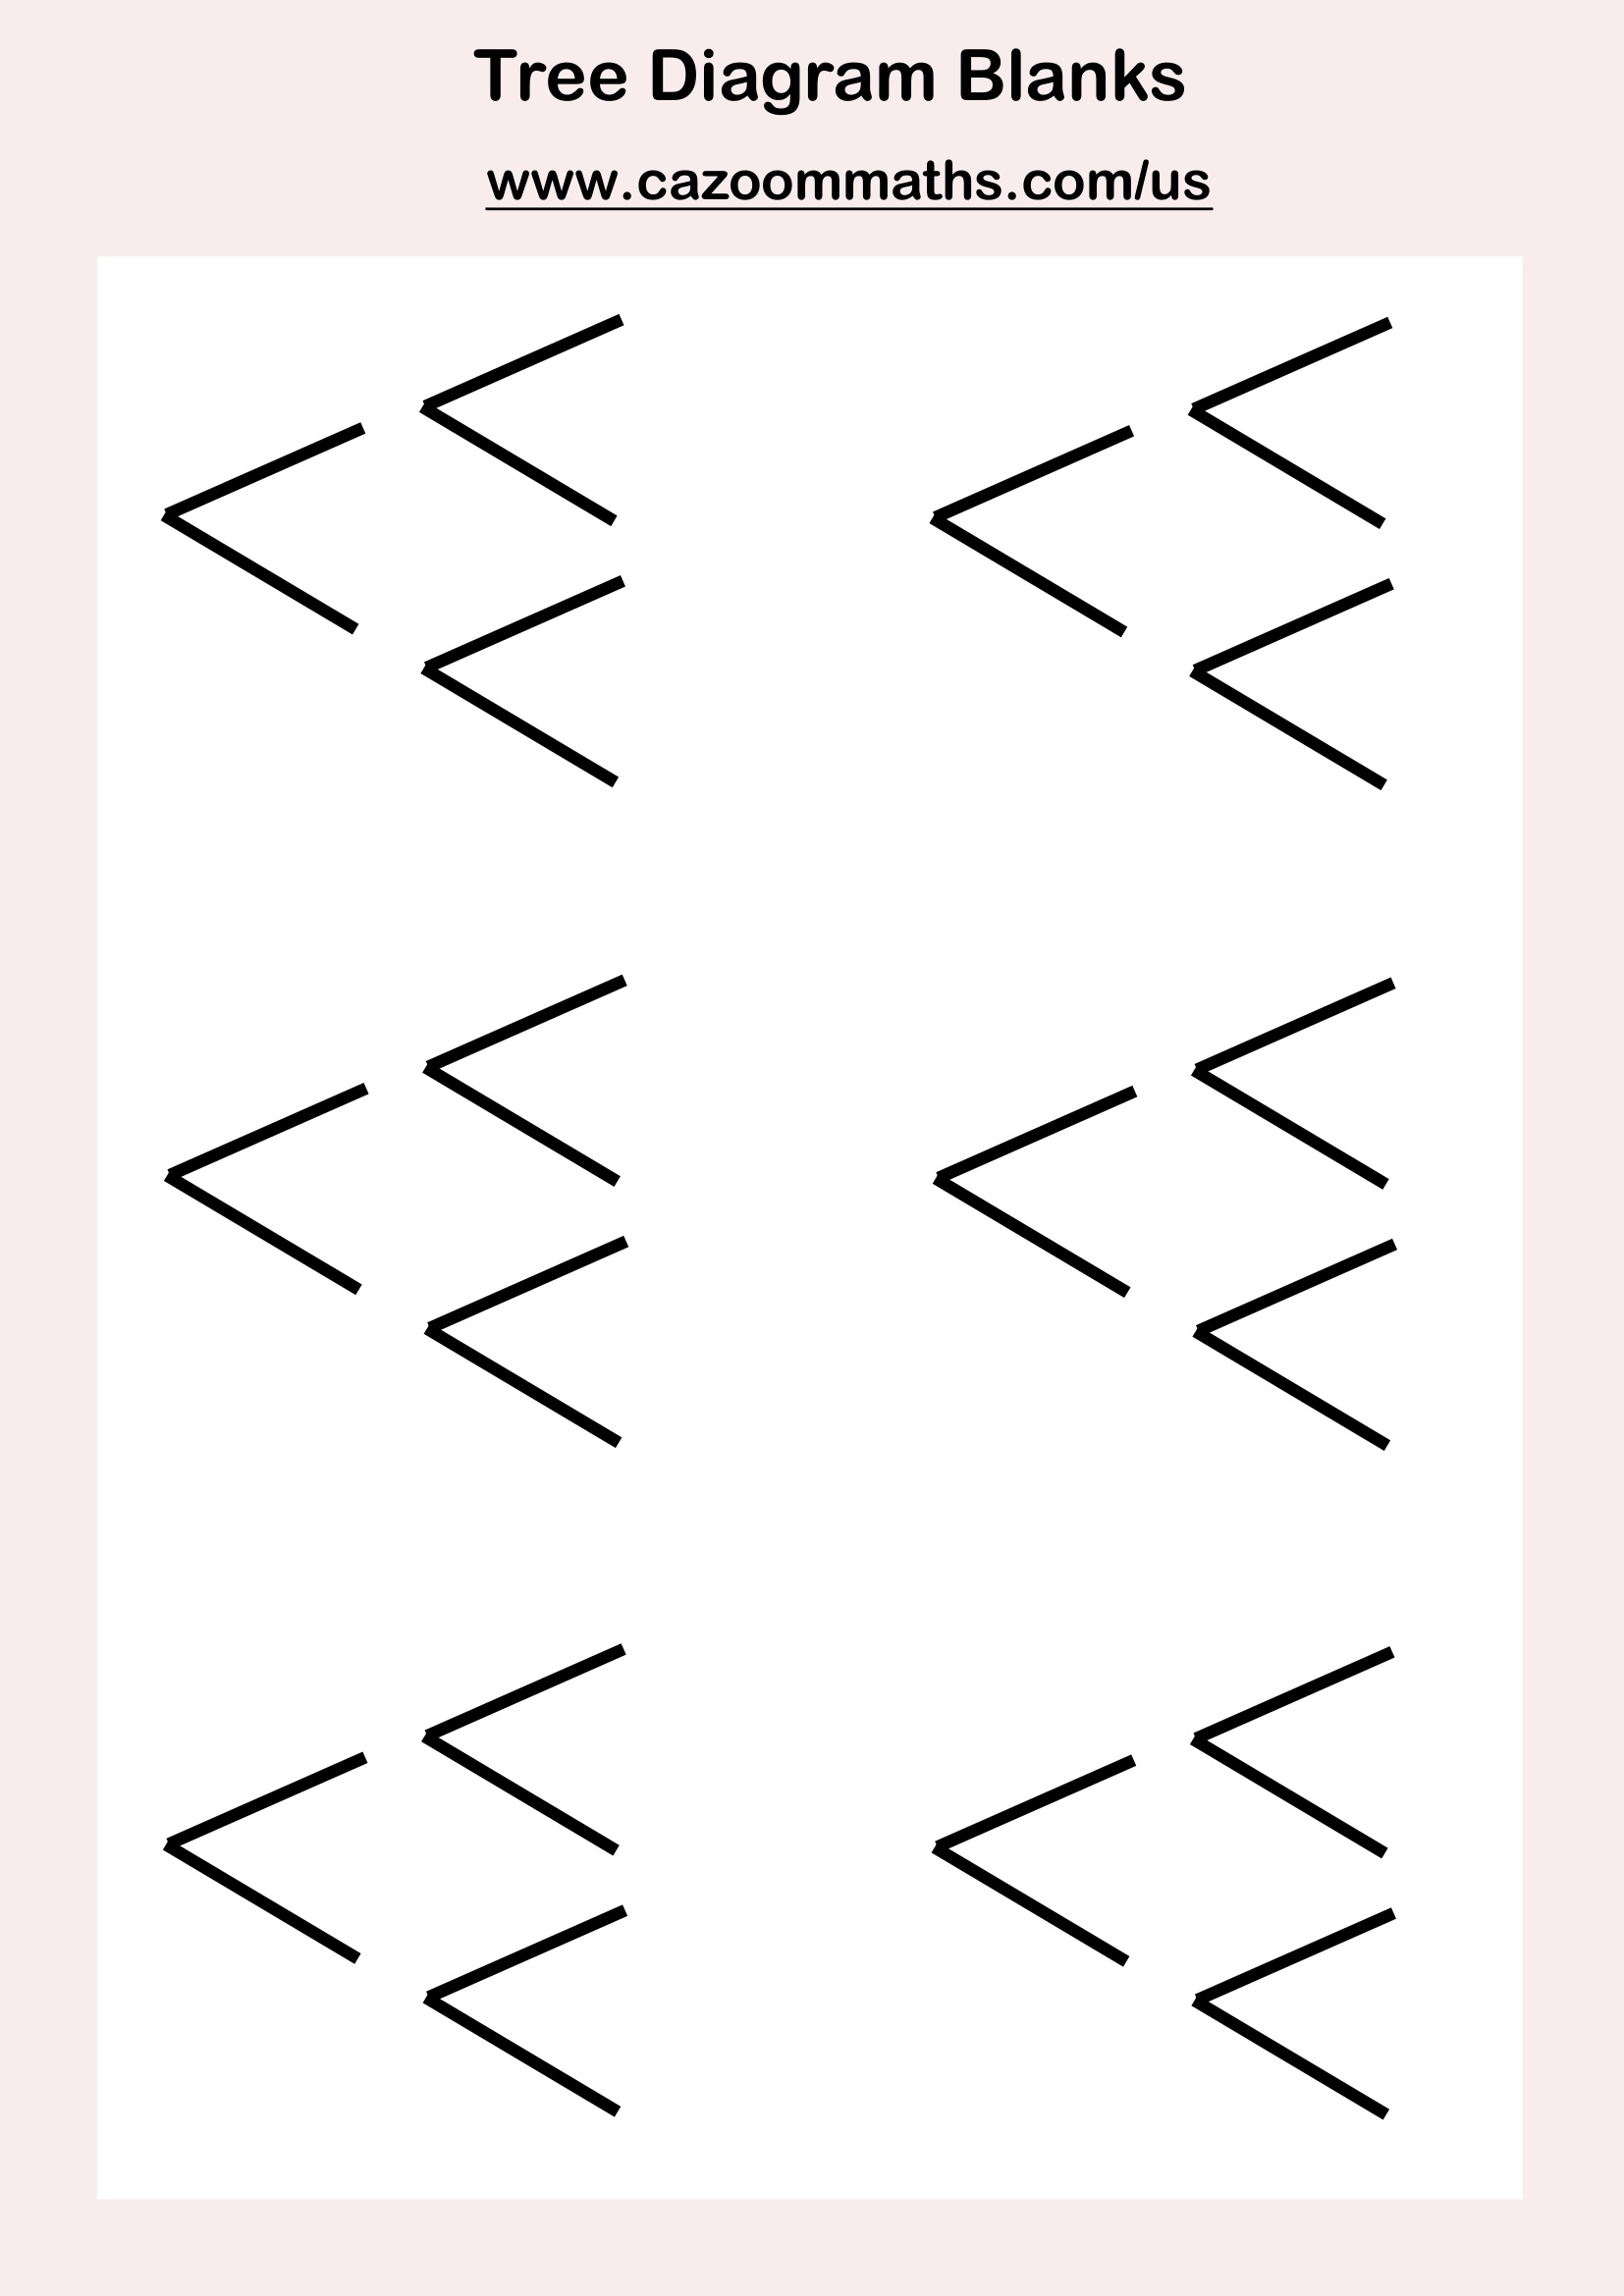
Tree Diagram Blanks
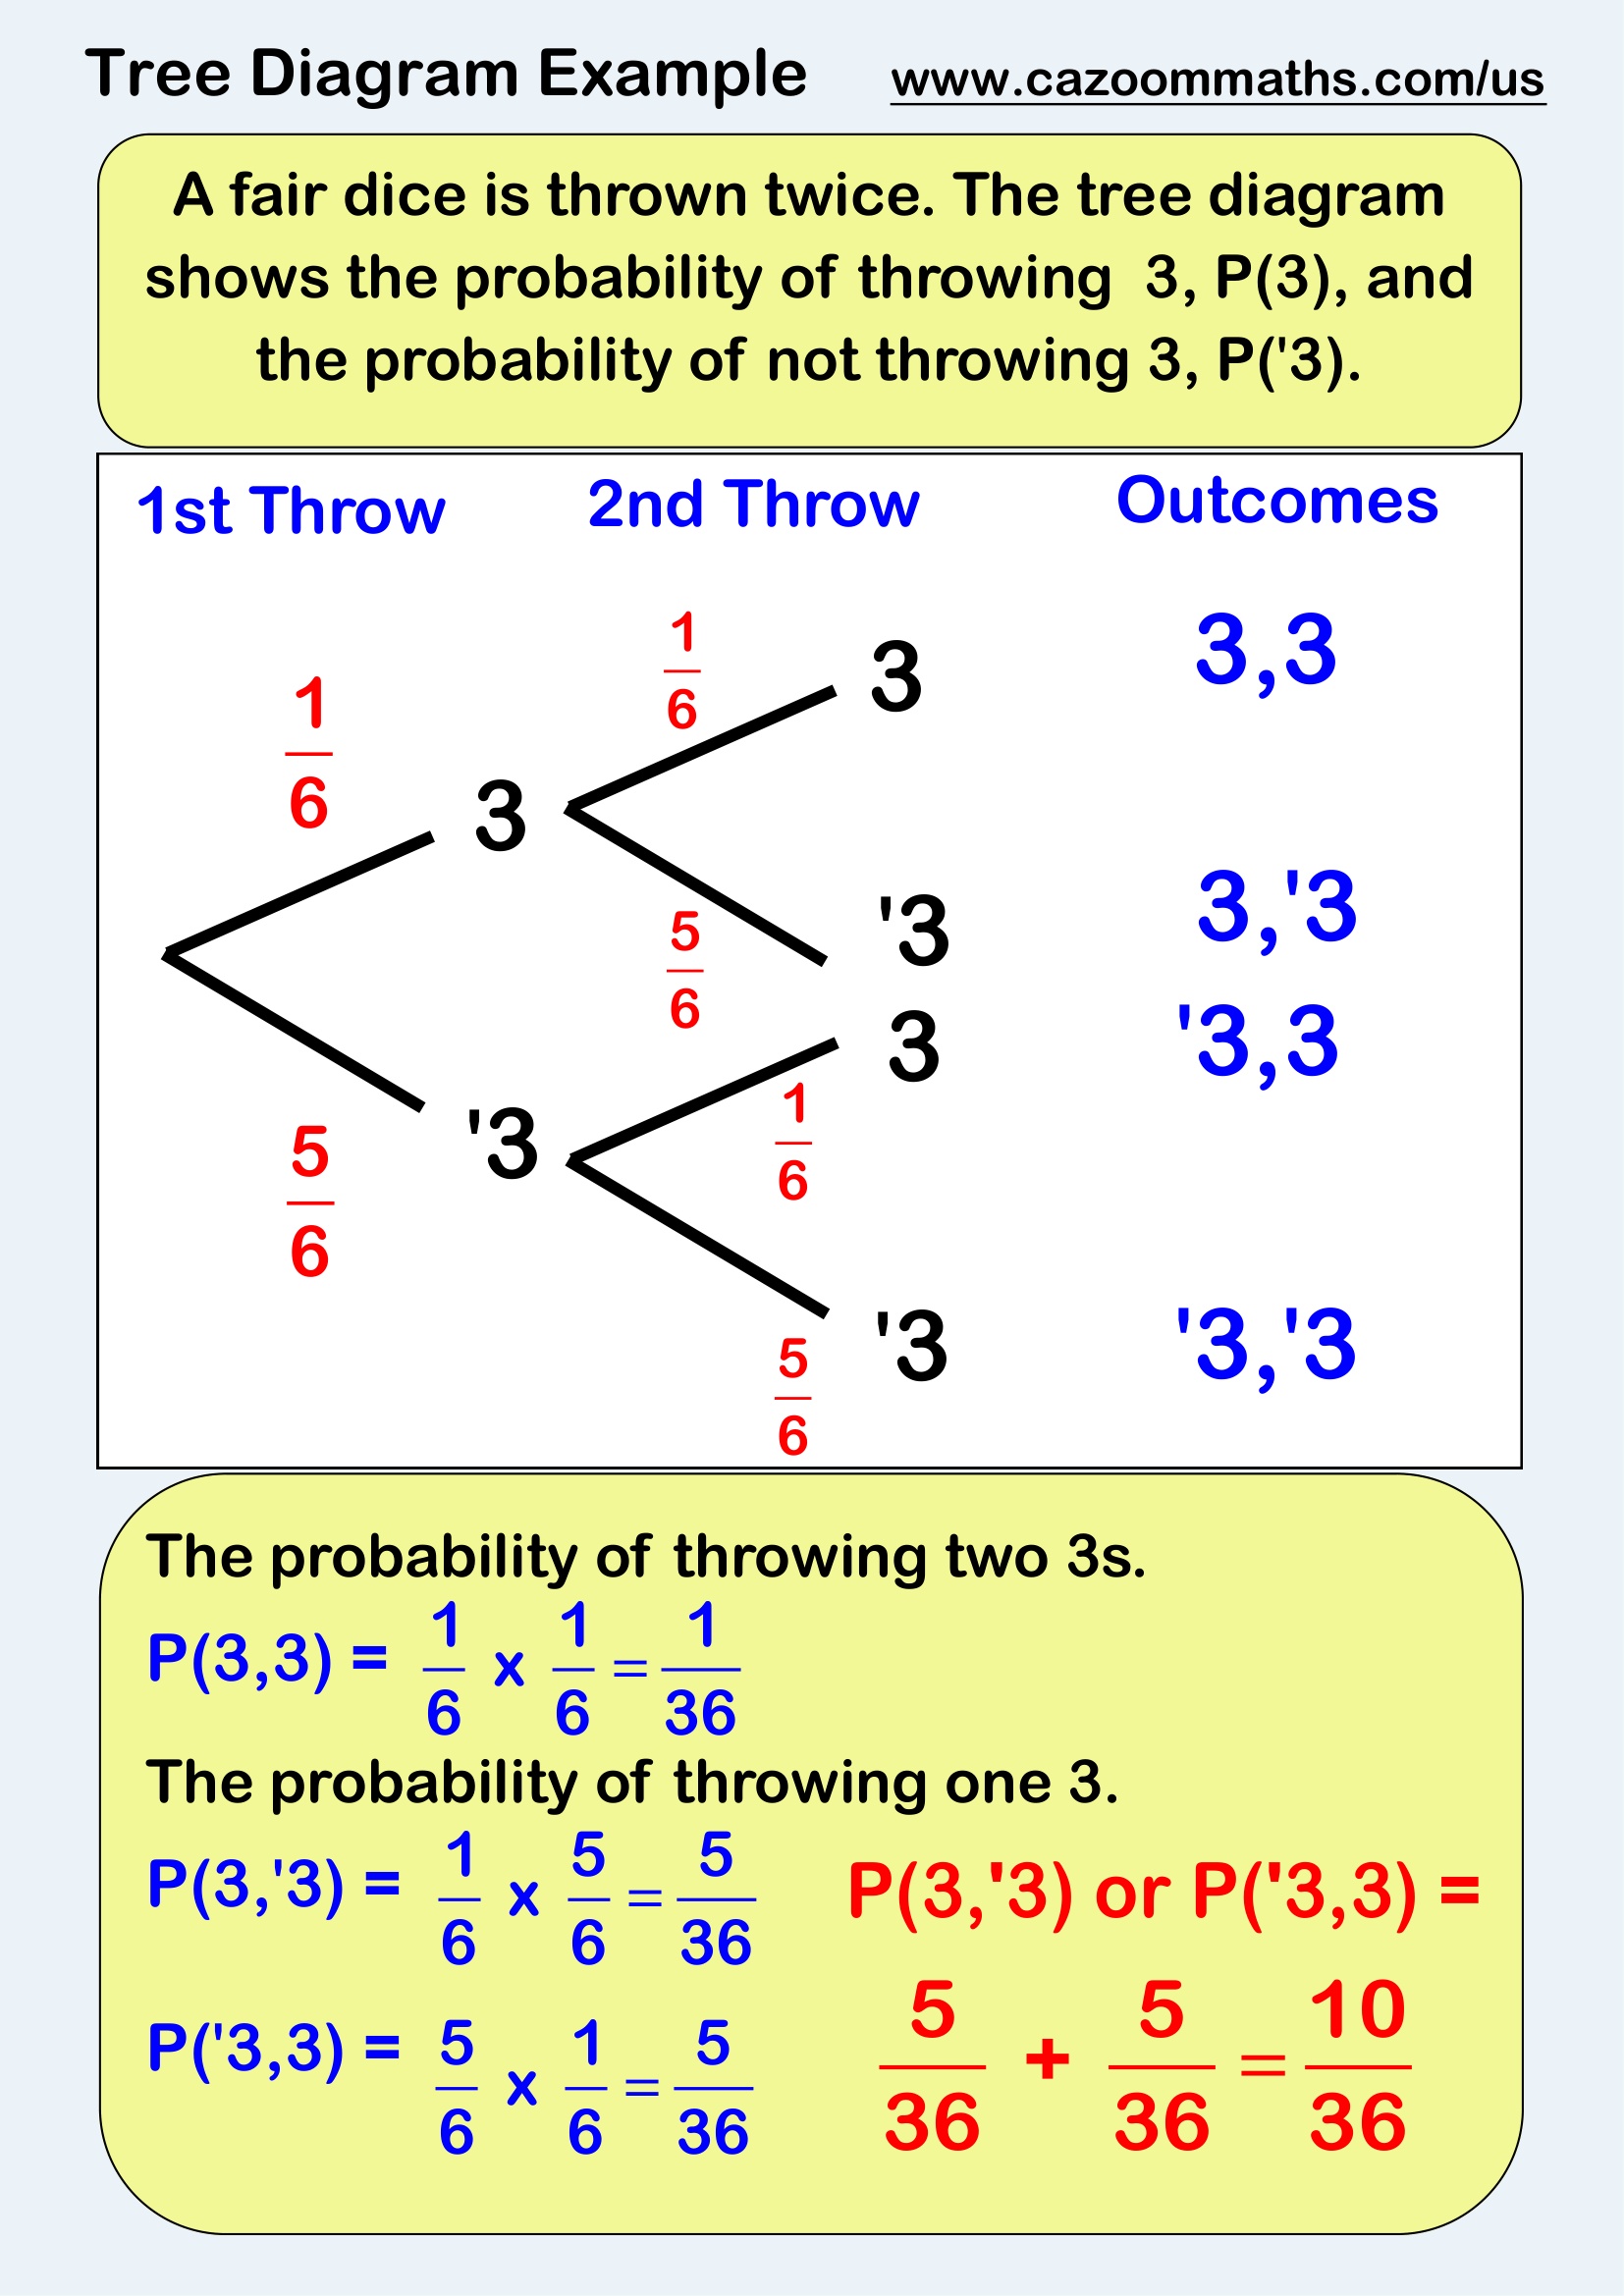
Tree Diagram Example
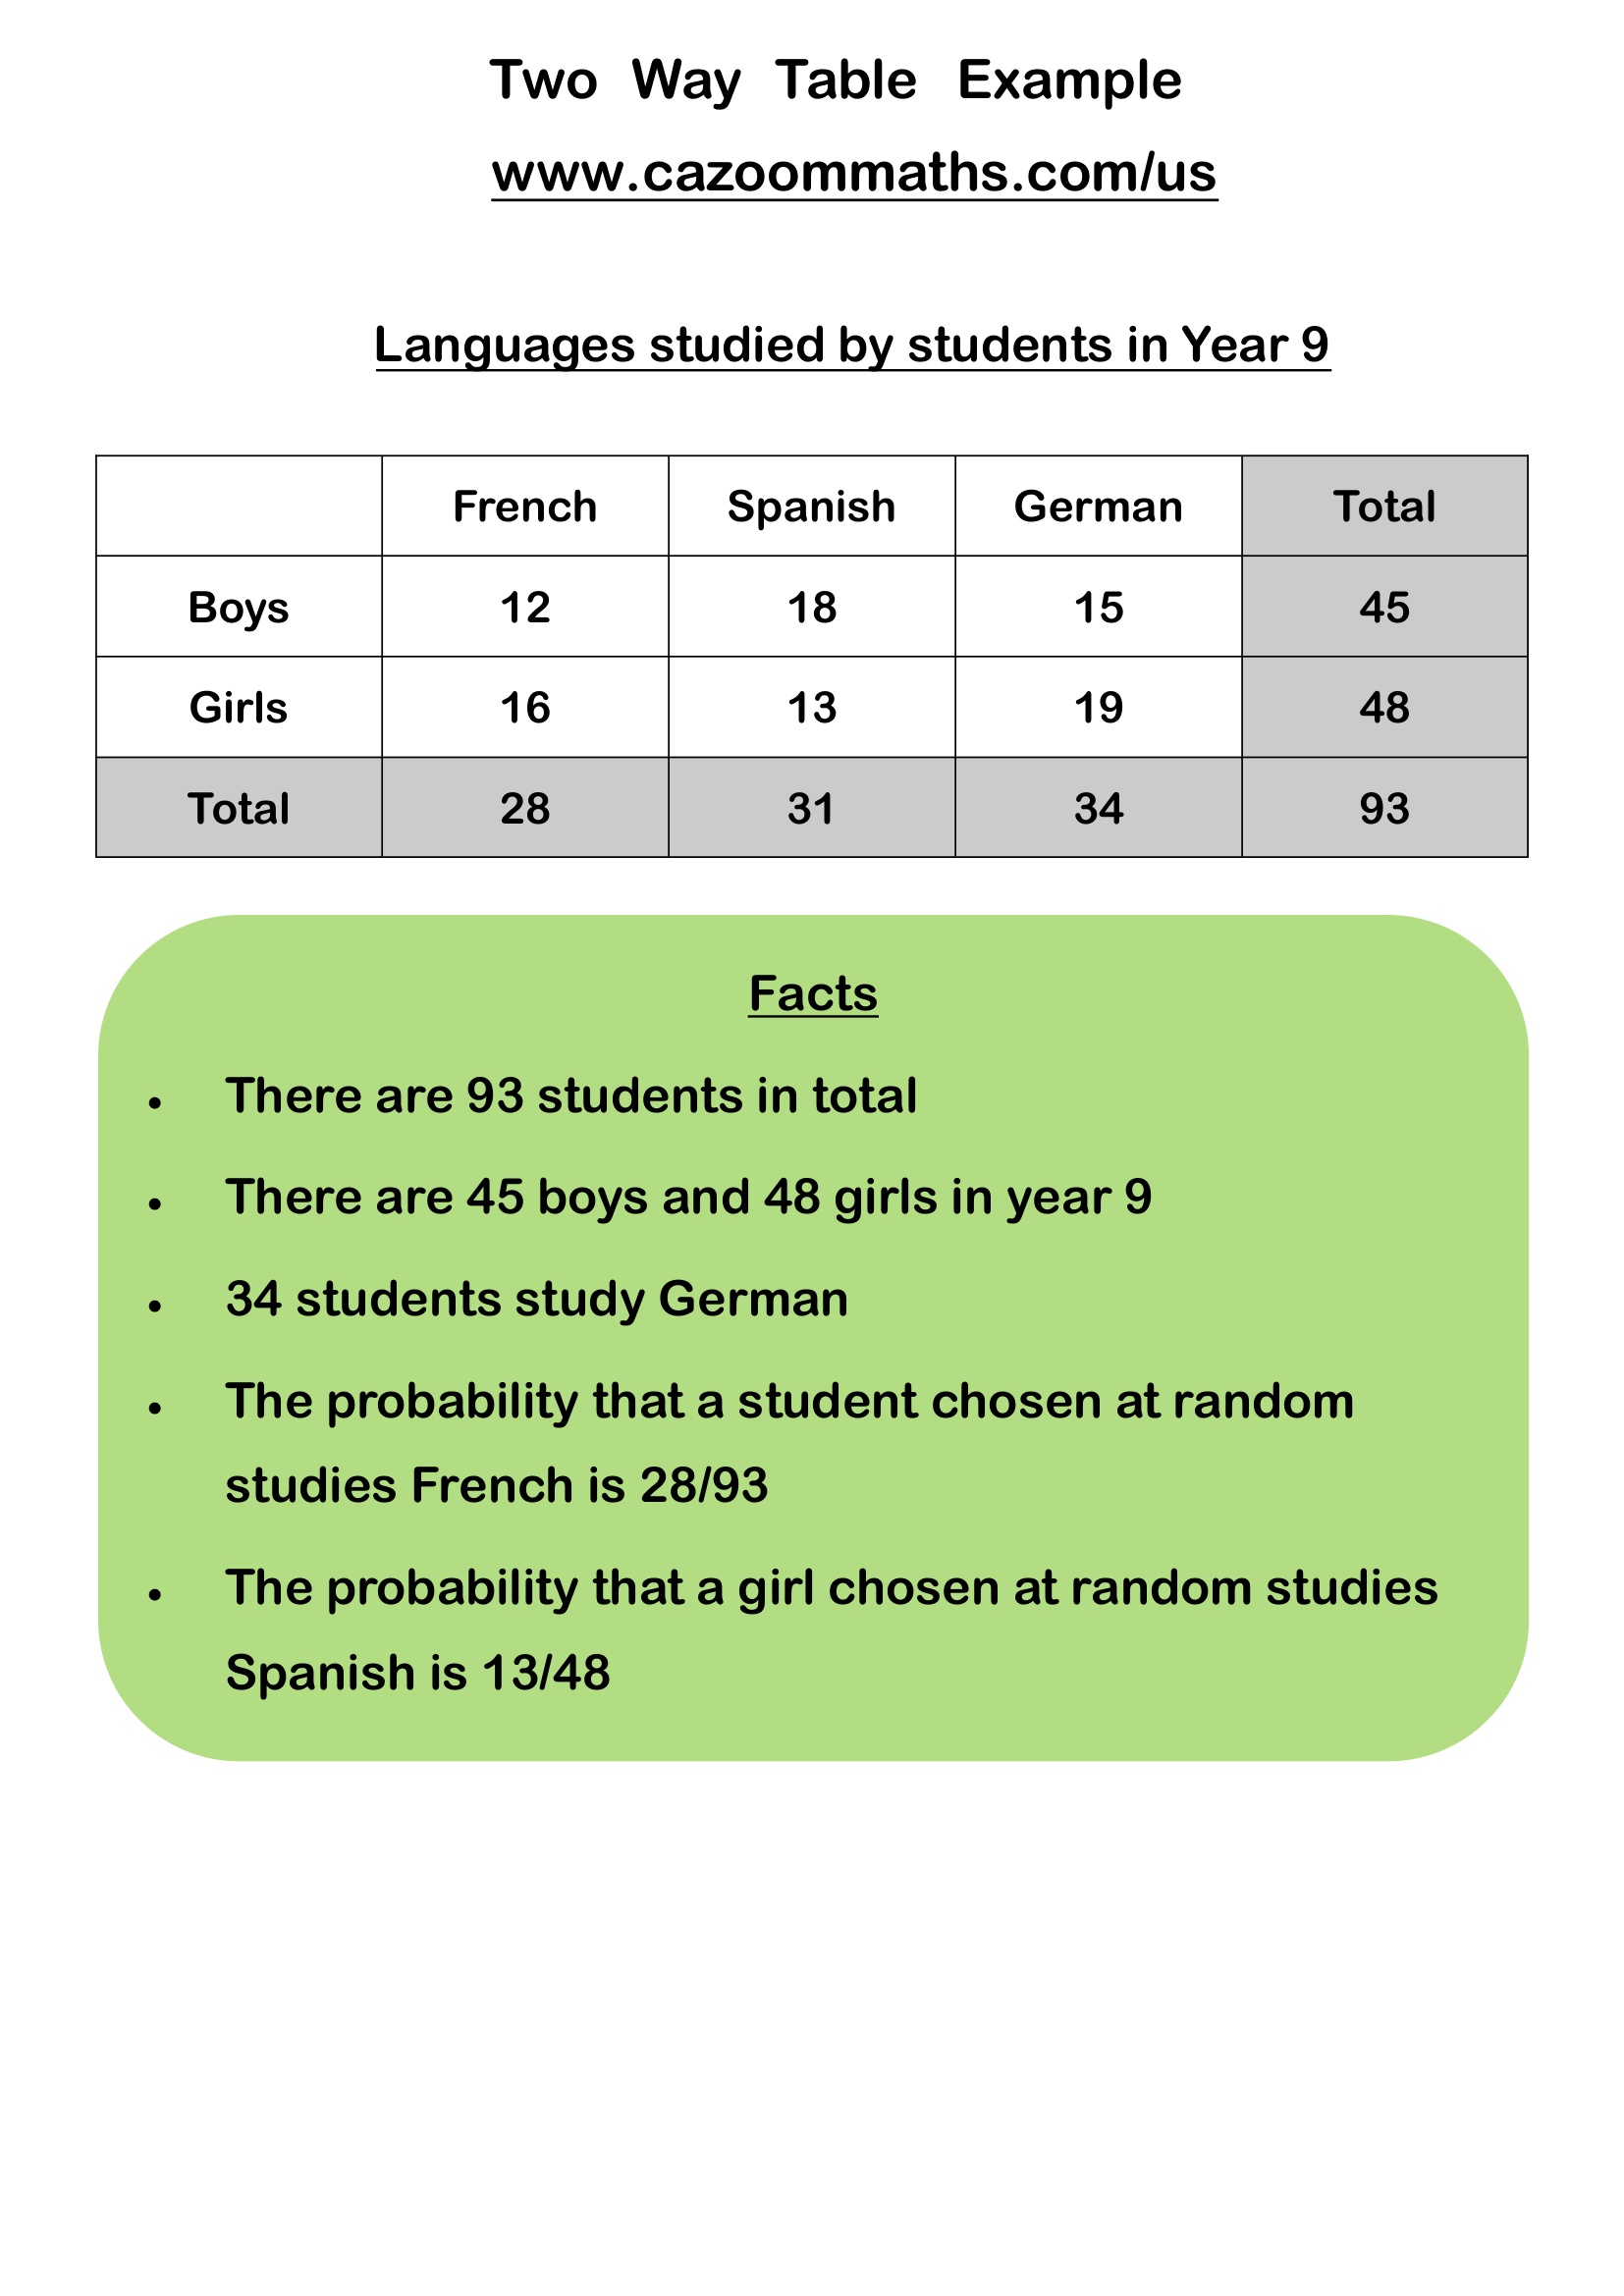
Two Way Table Example
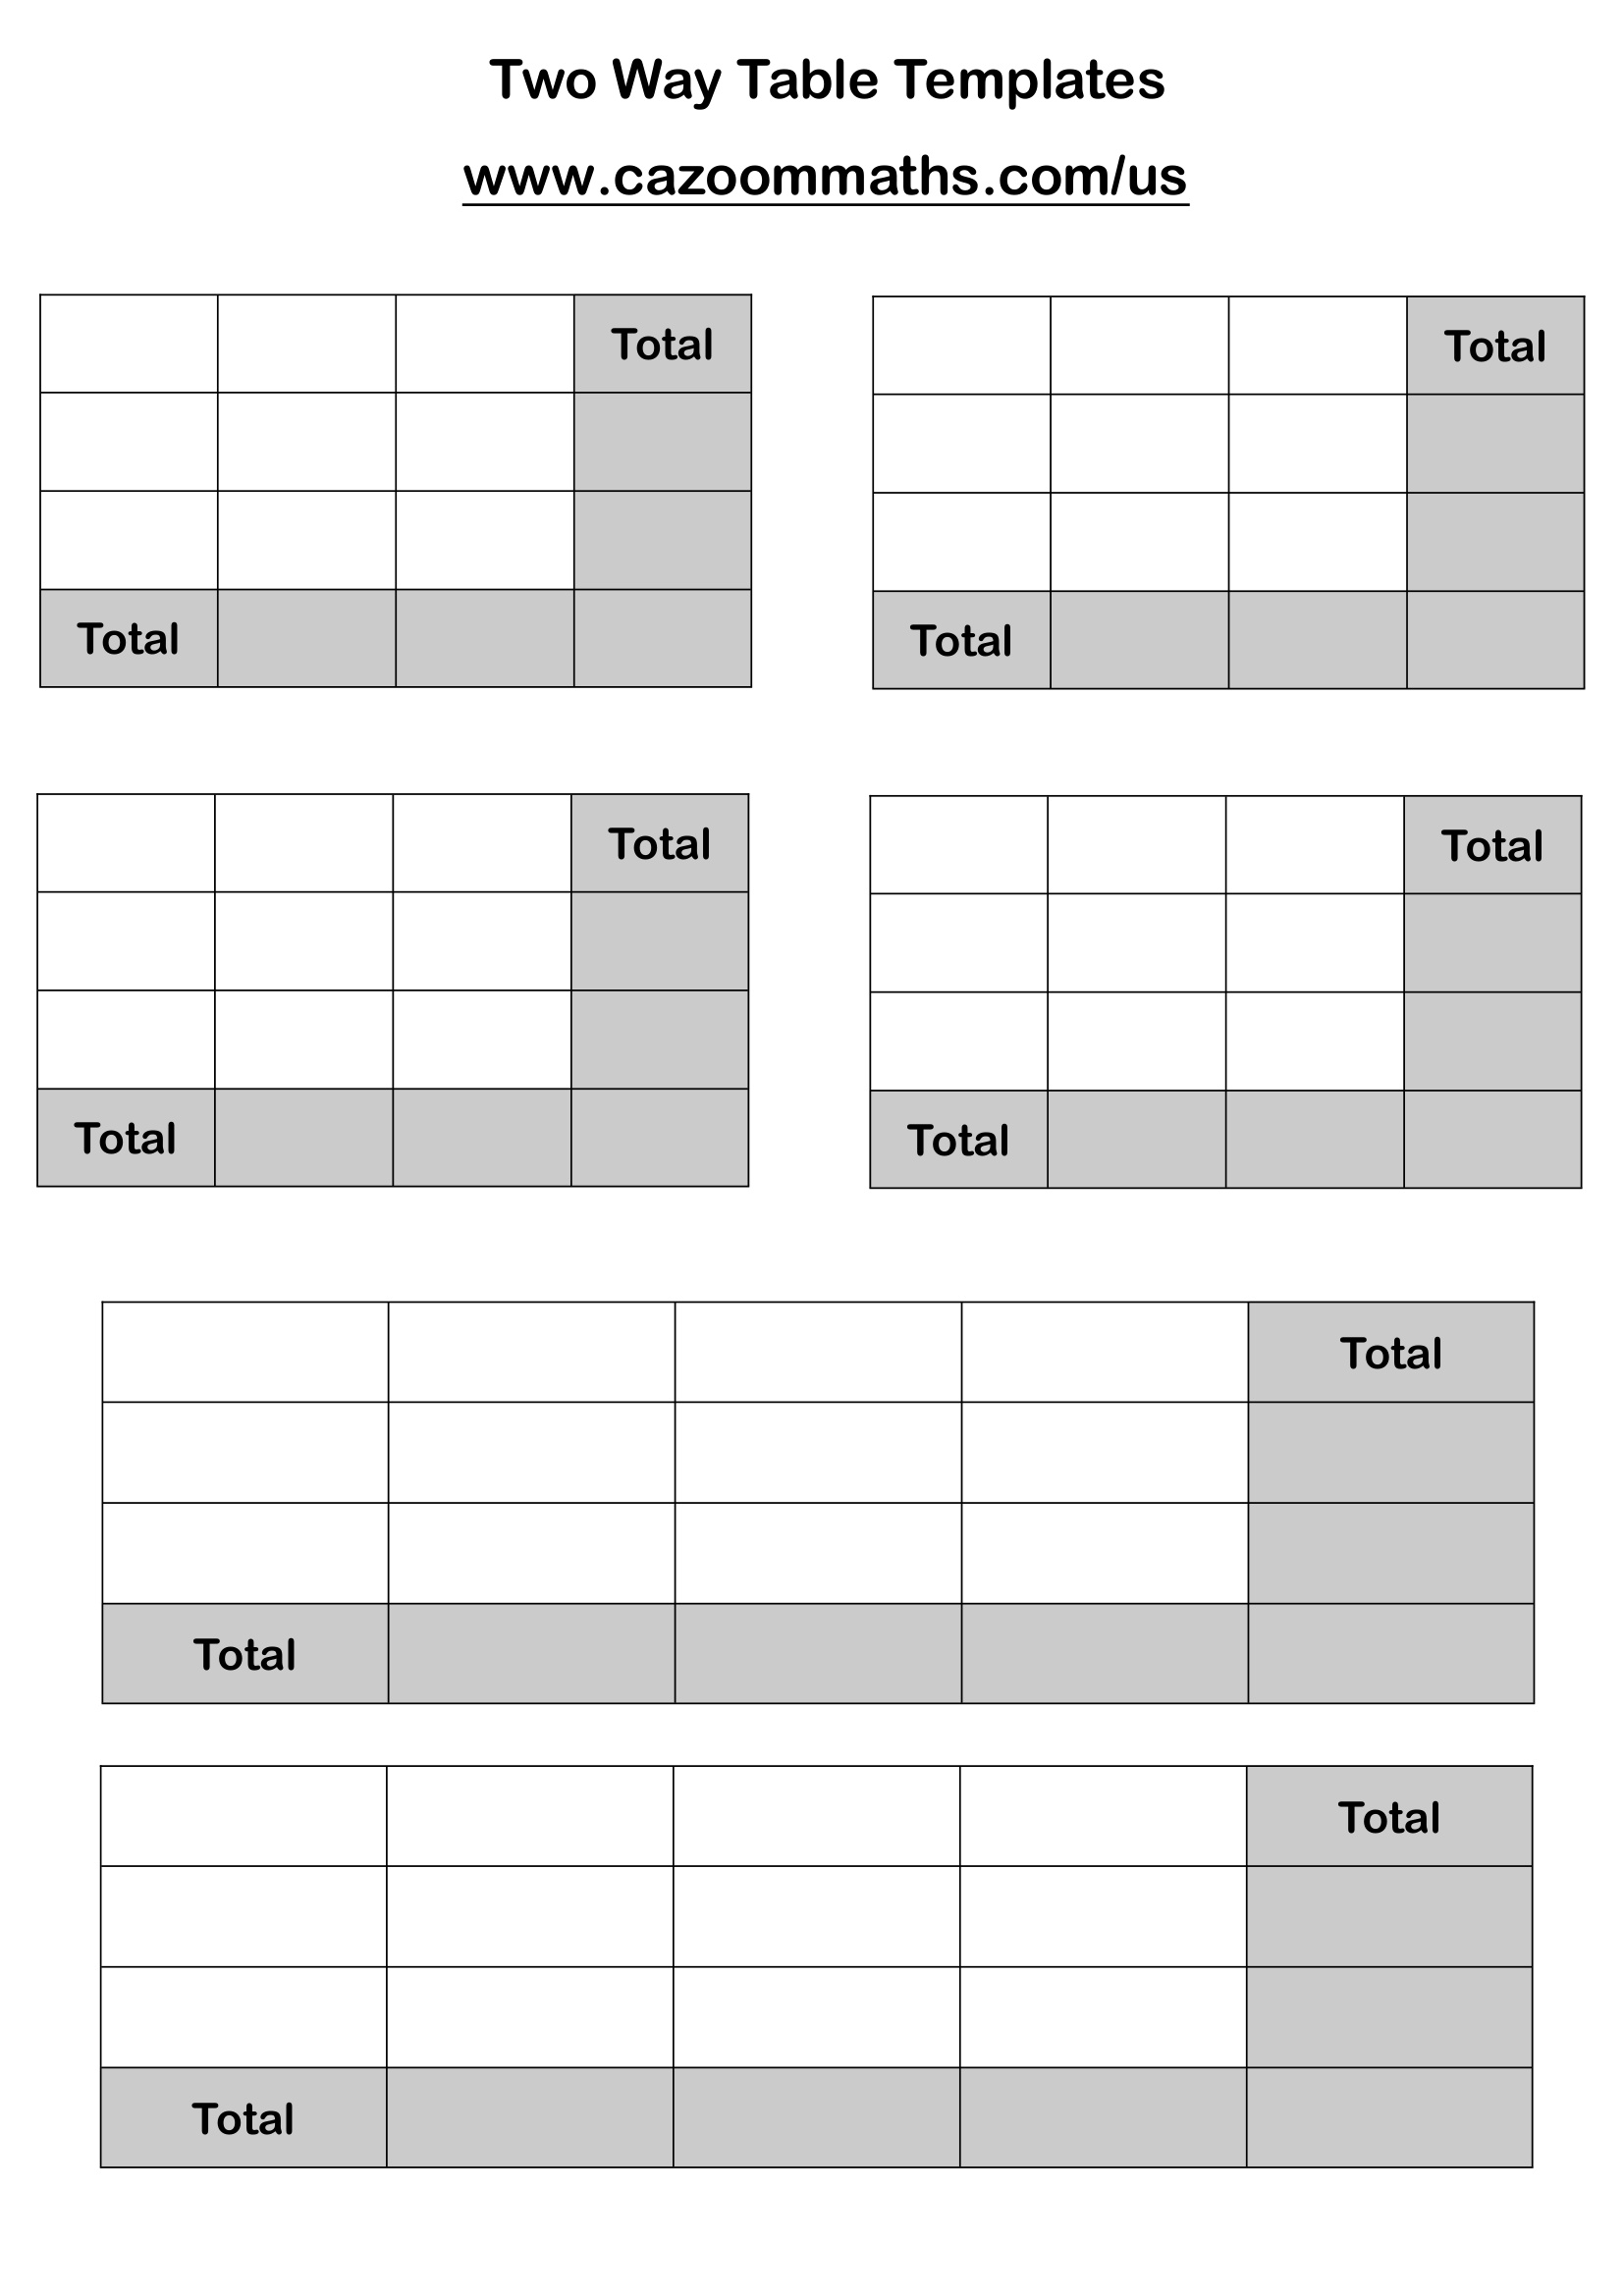
Two Way Table Templates
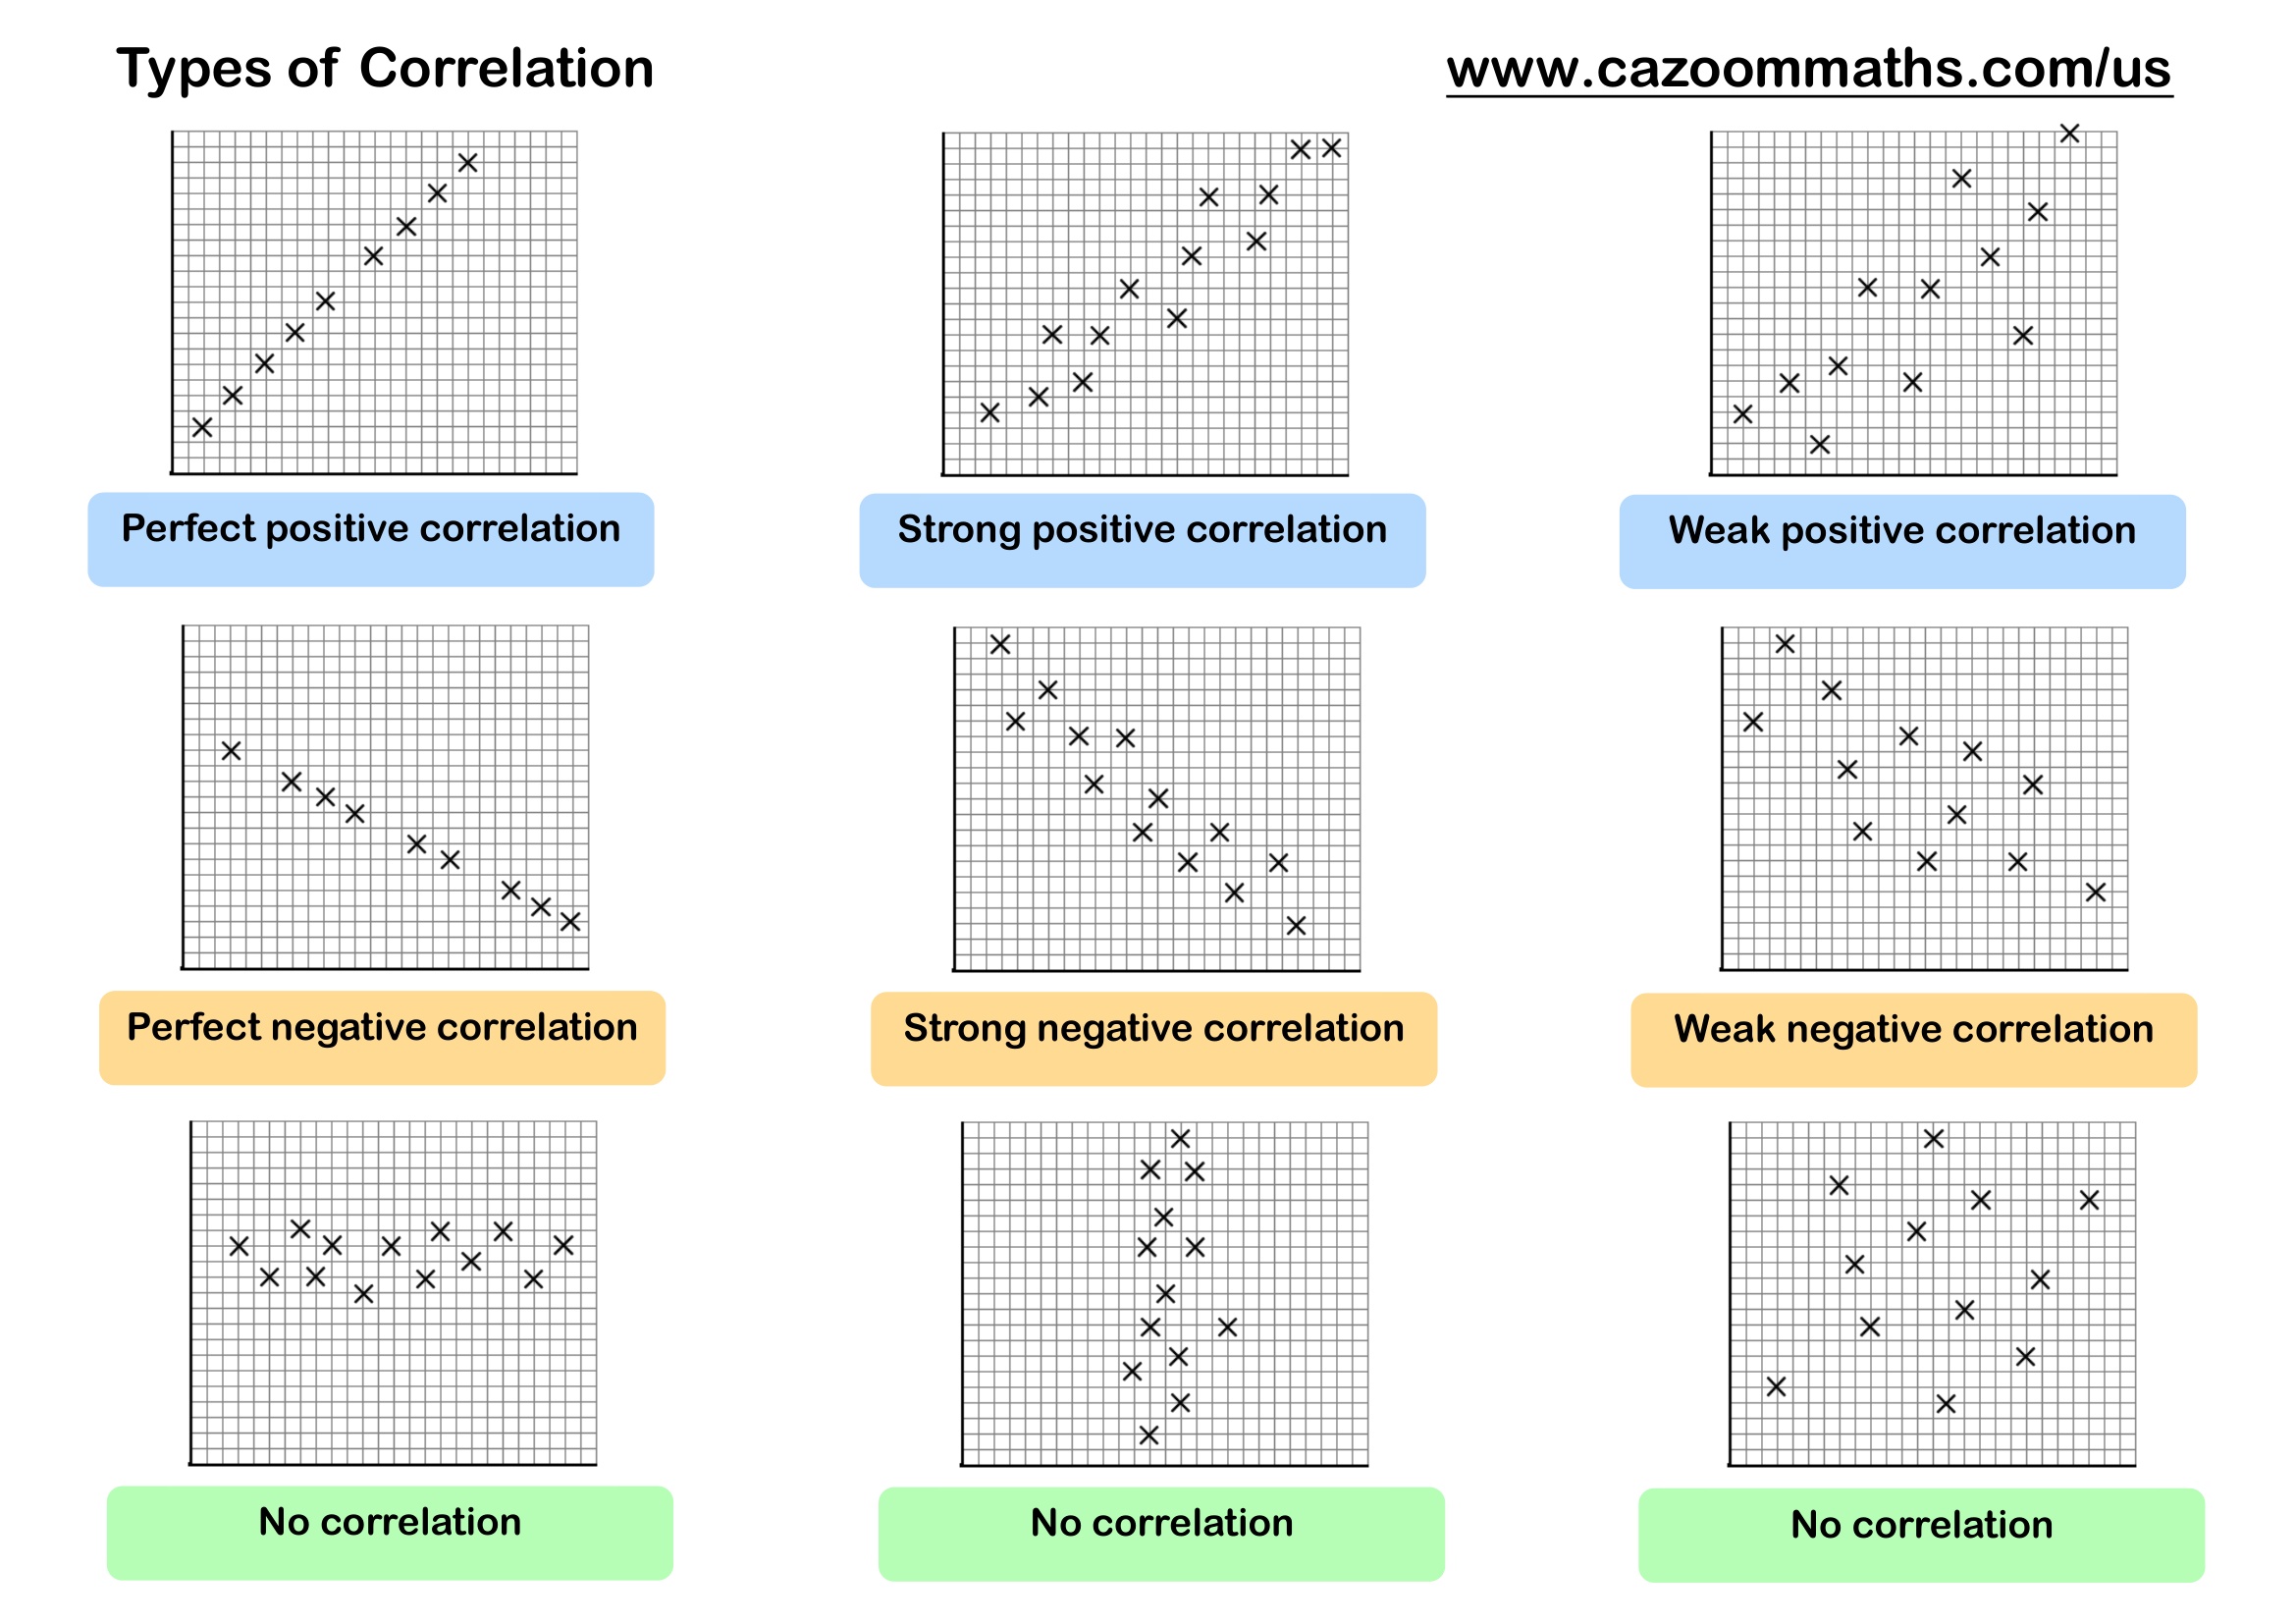
Types of Correlation
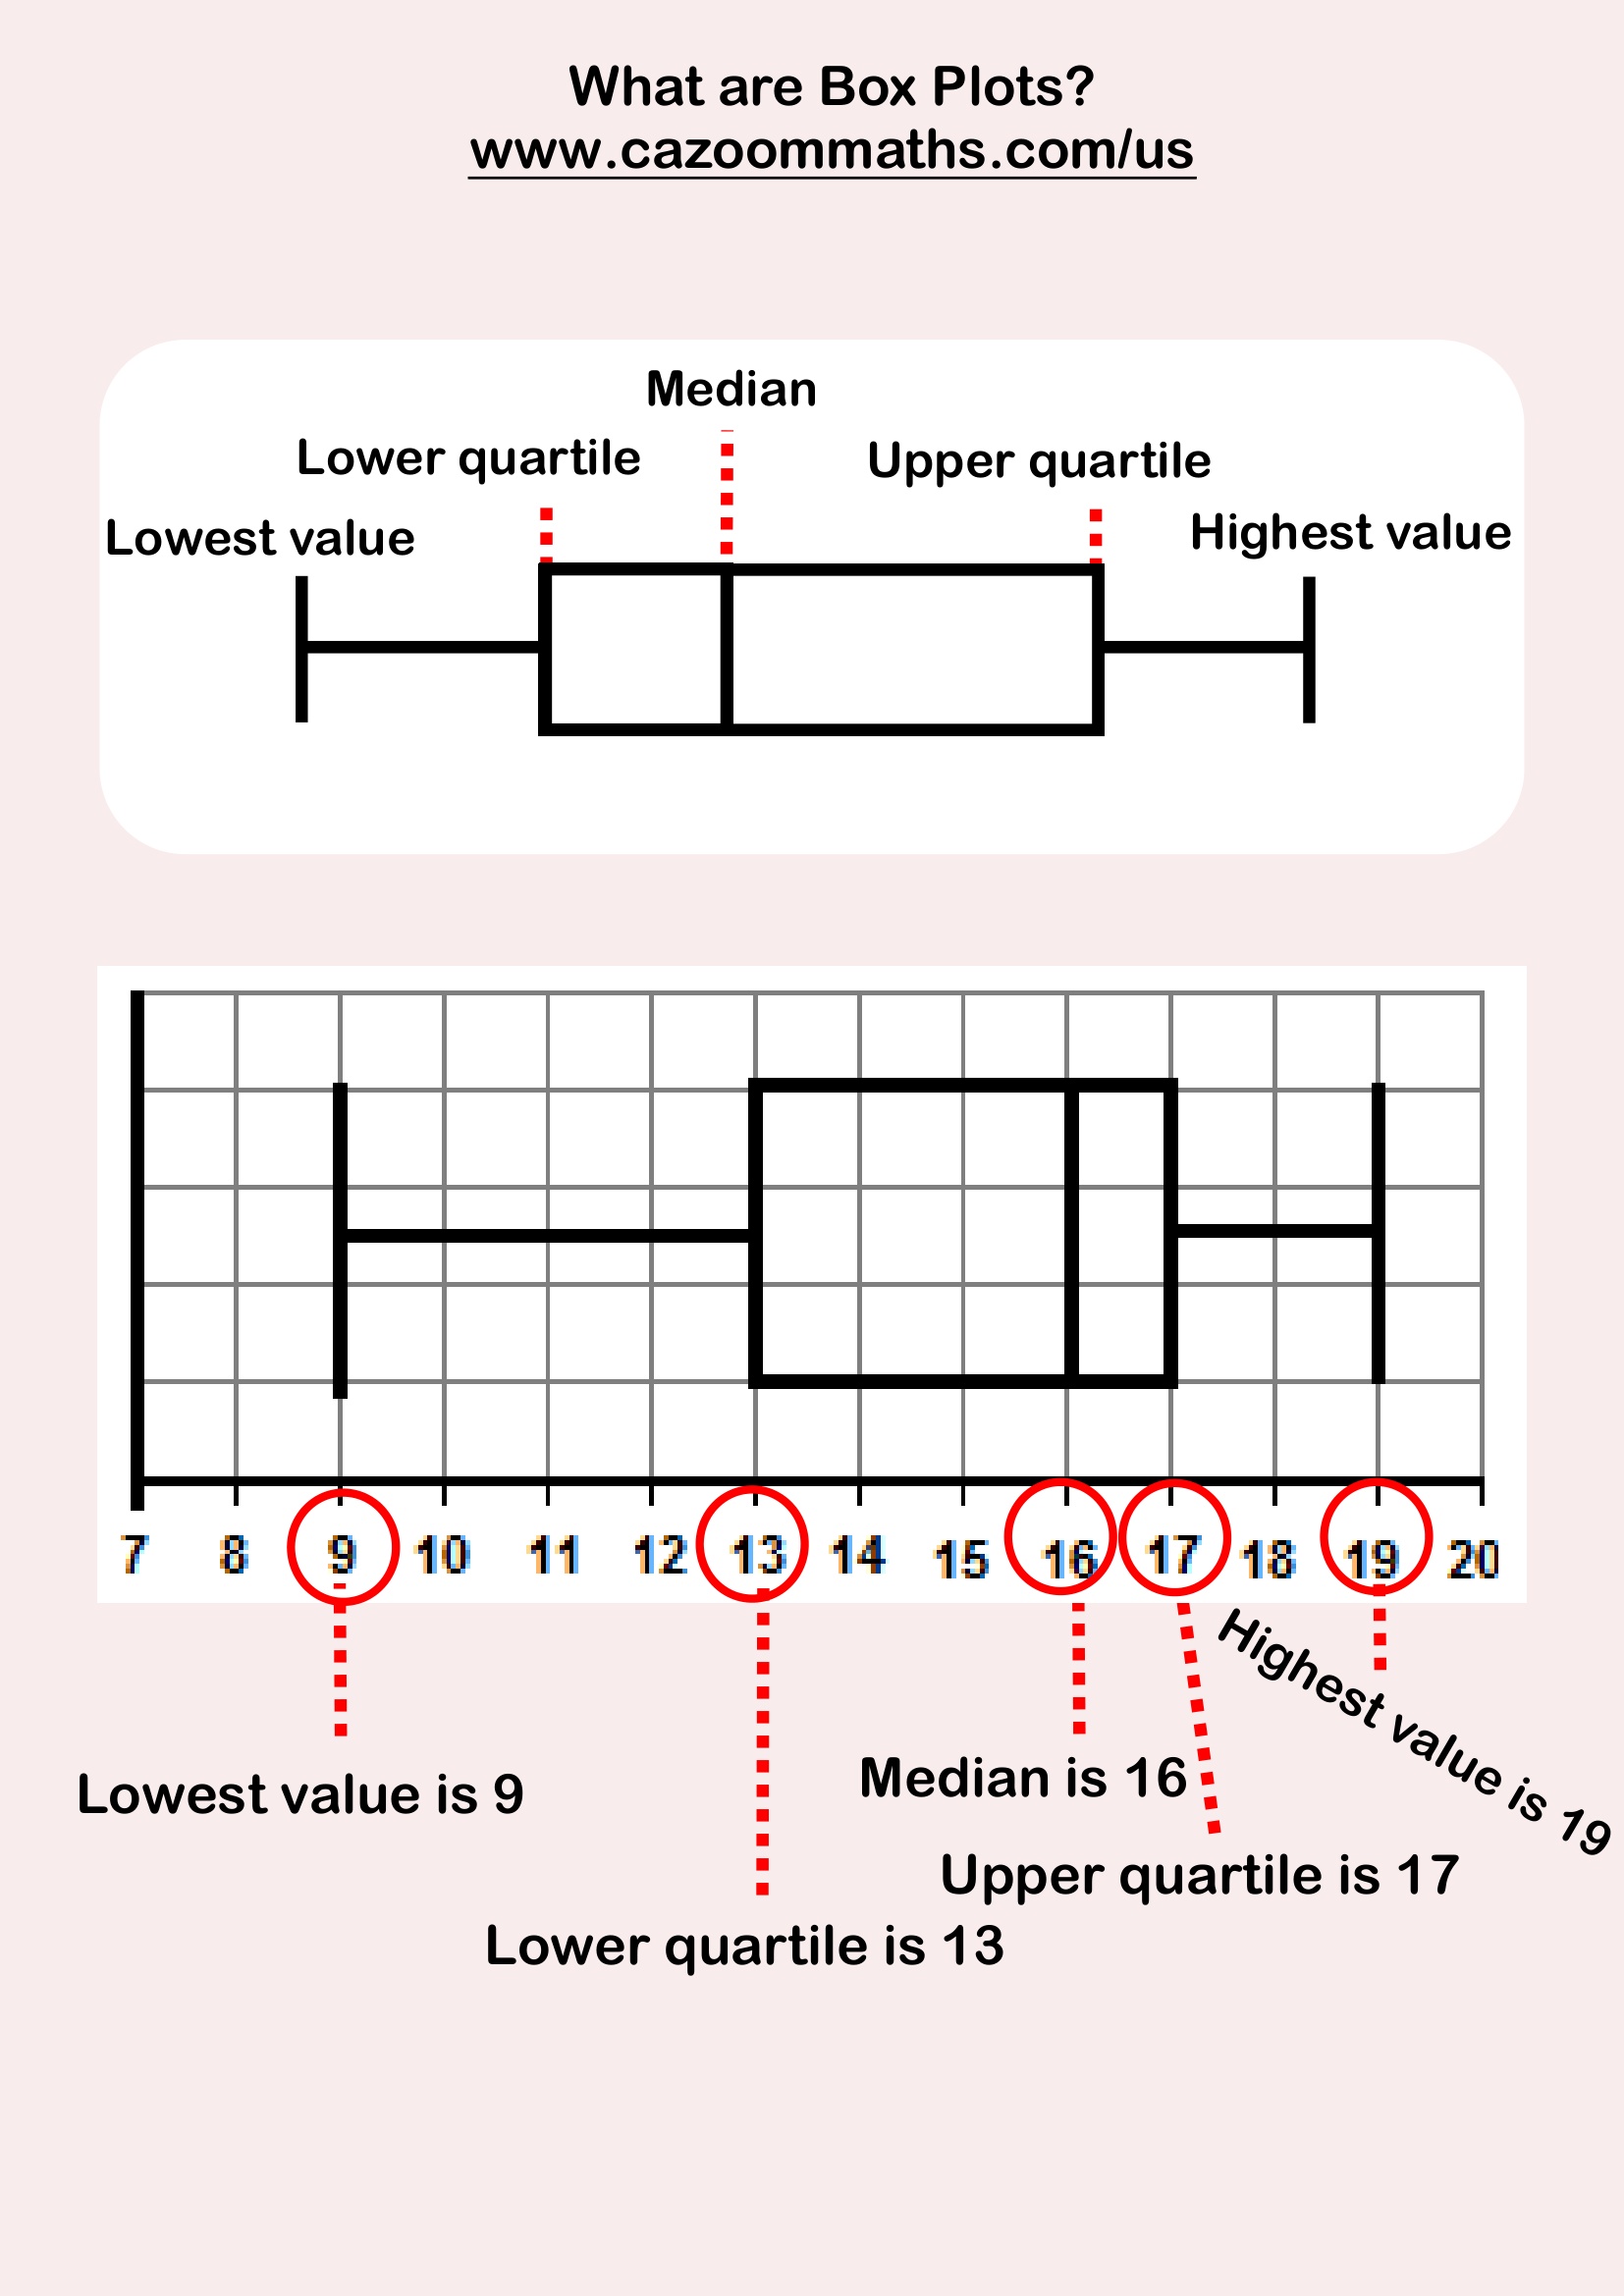
What are box plots?
What are Histograms
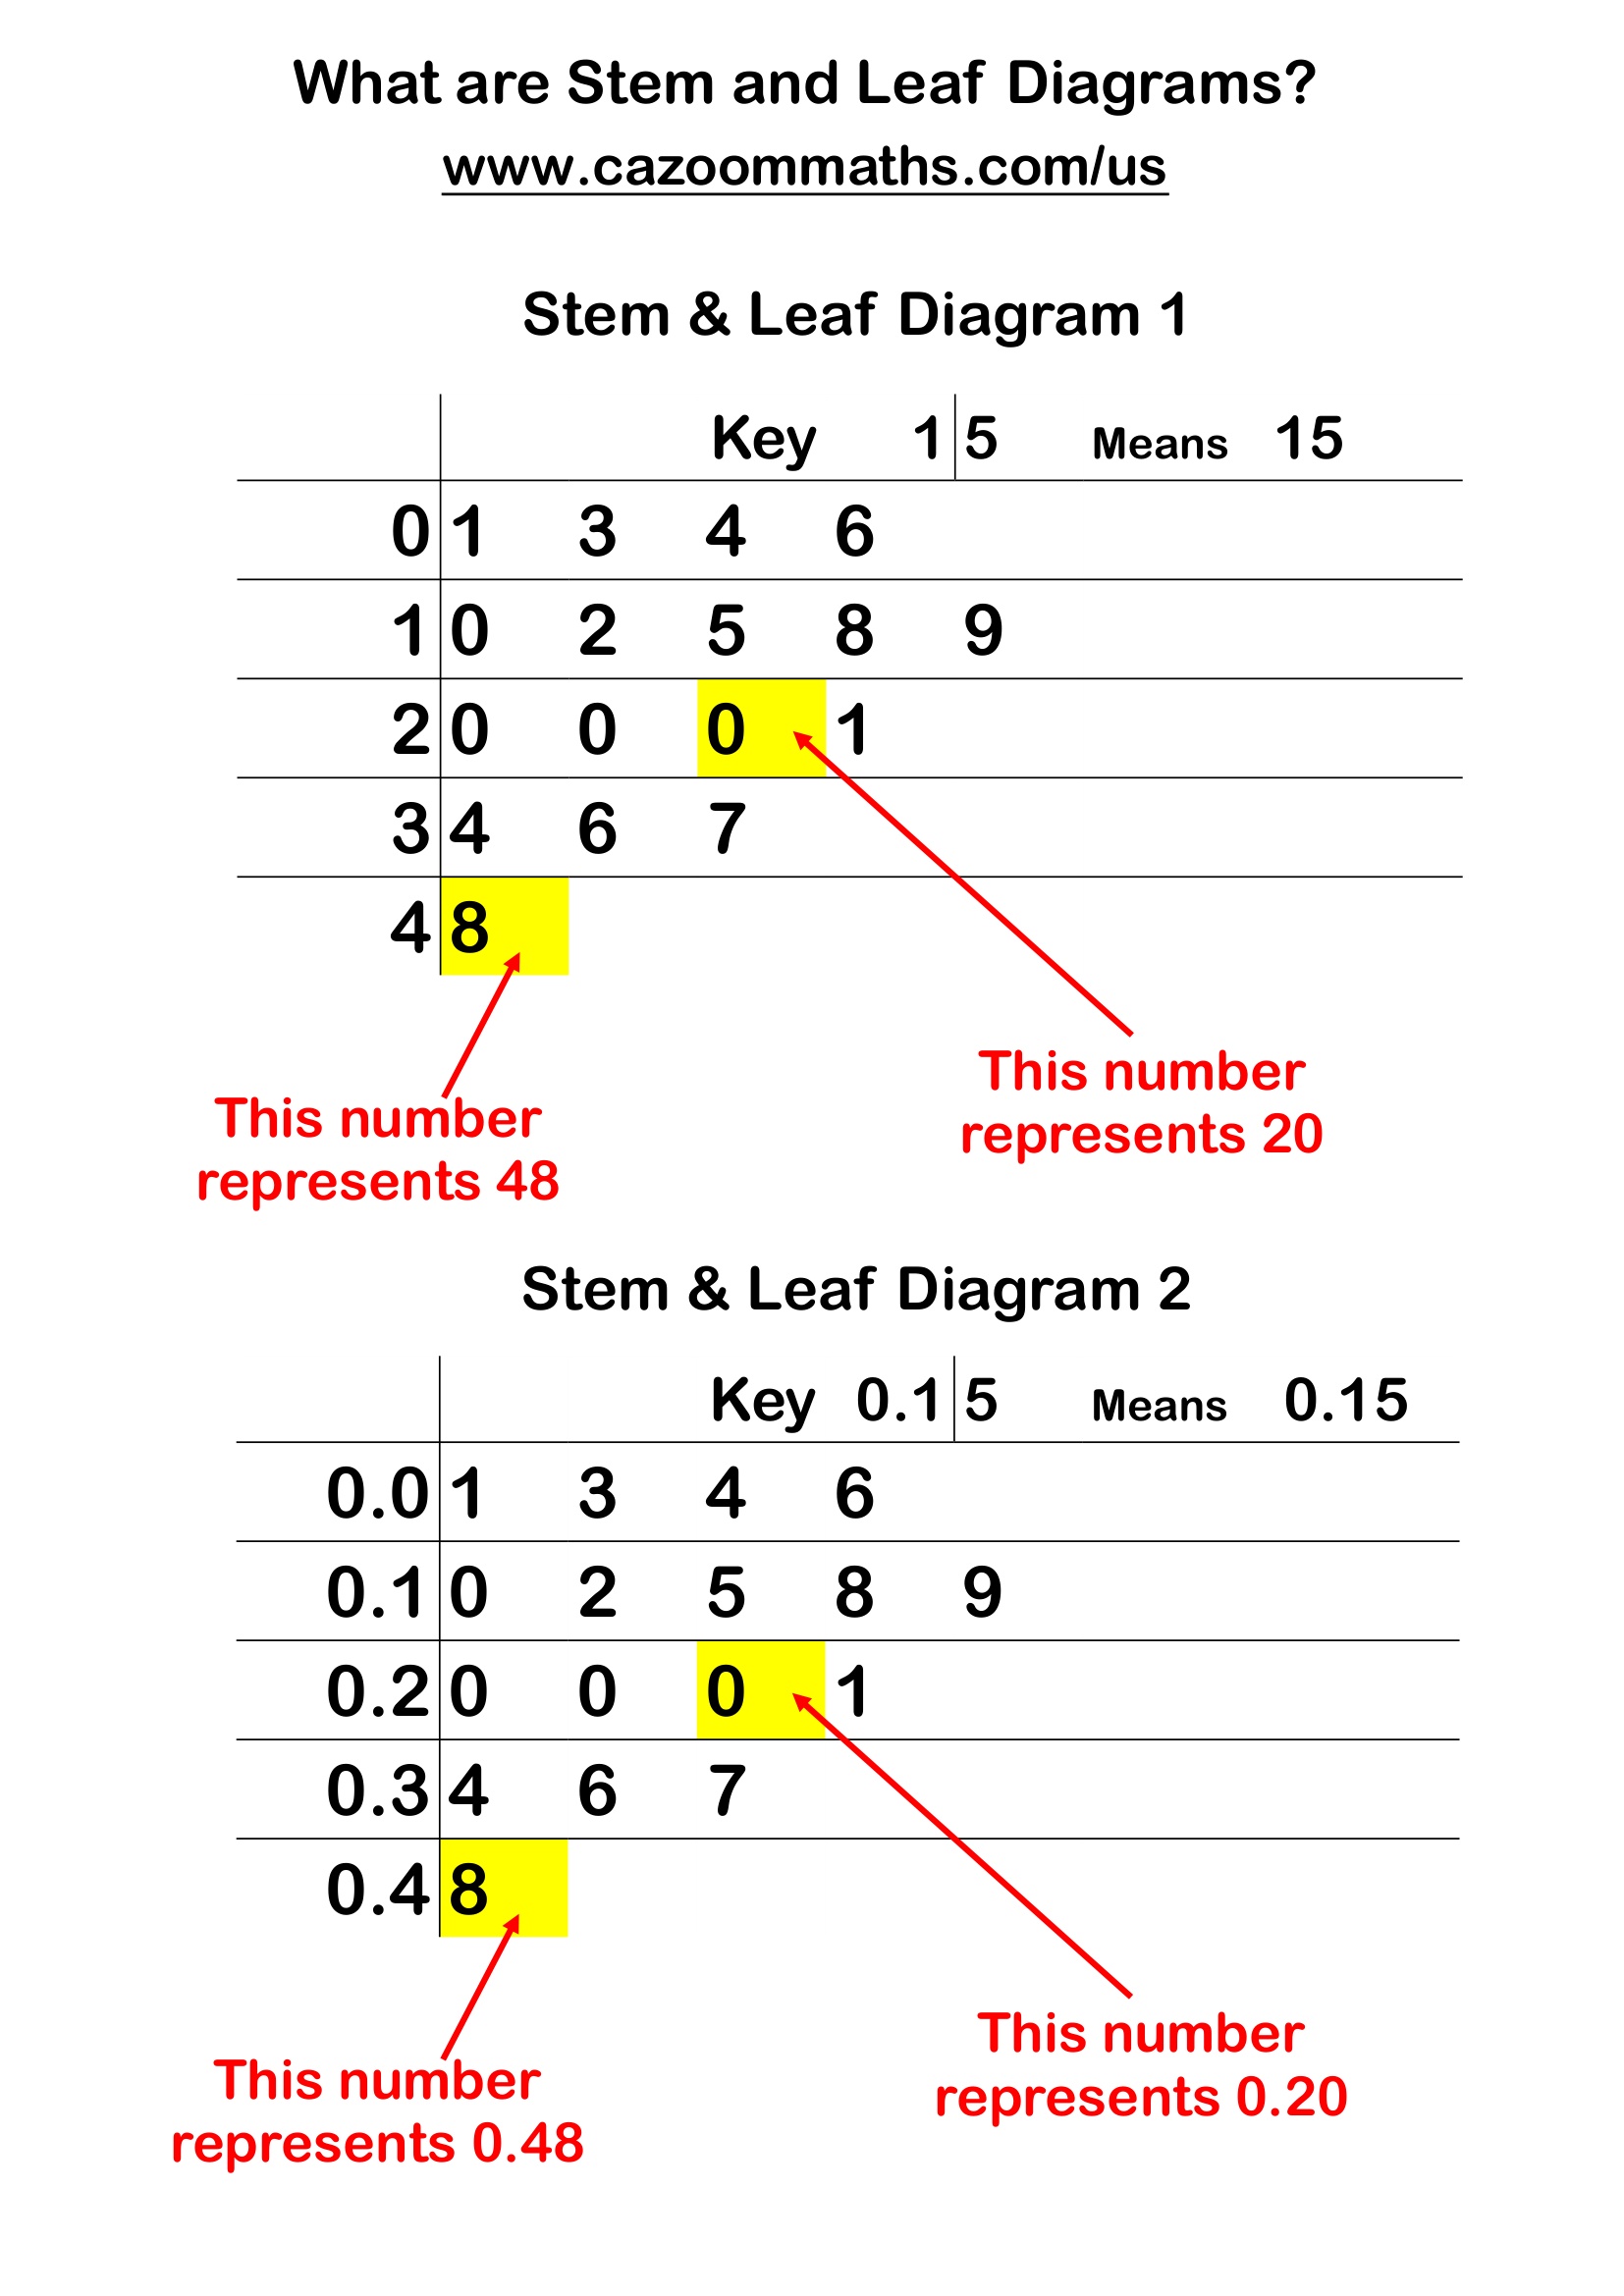
What are Stem and Leaf Diagrams
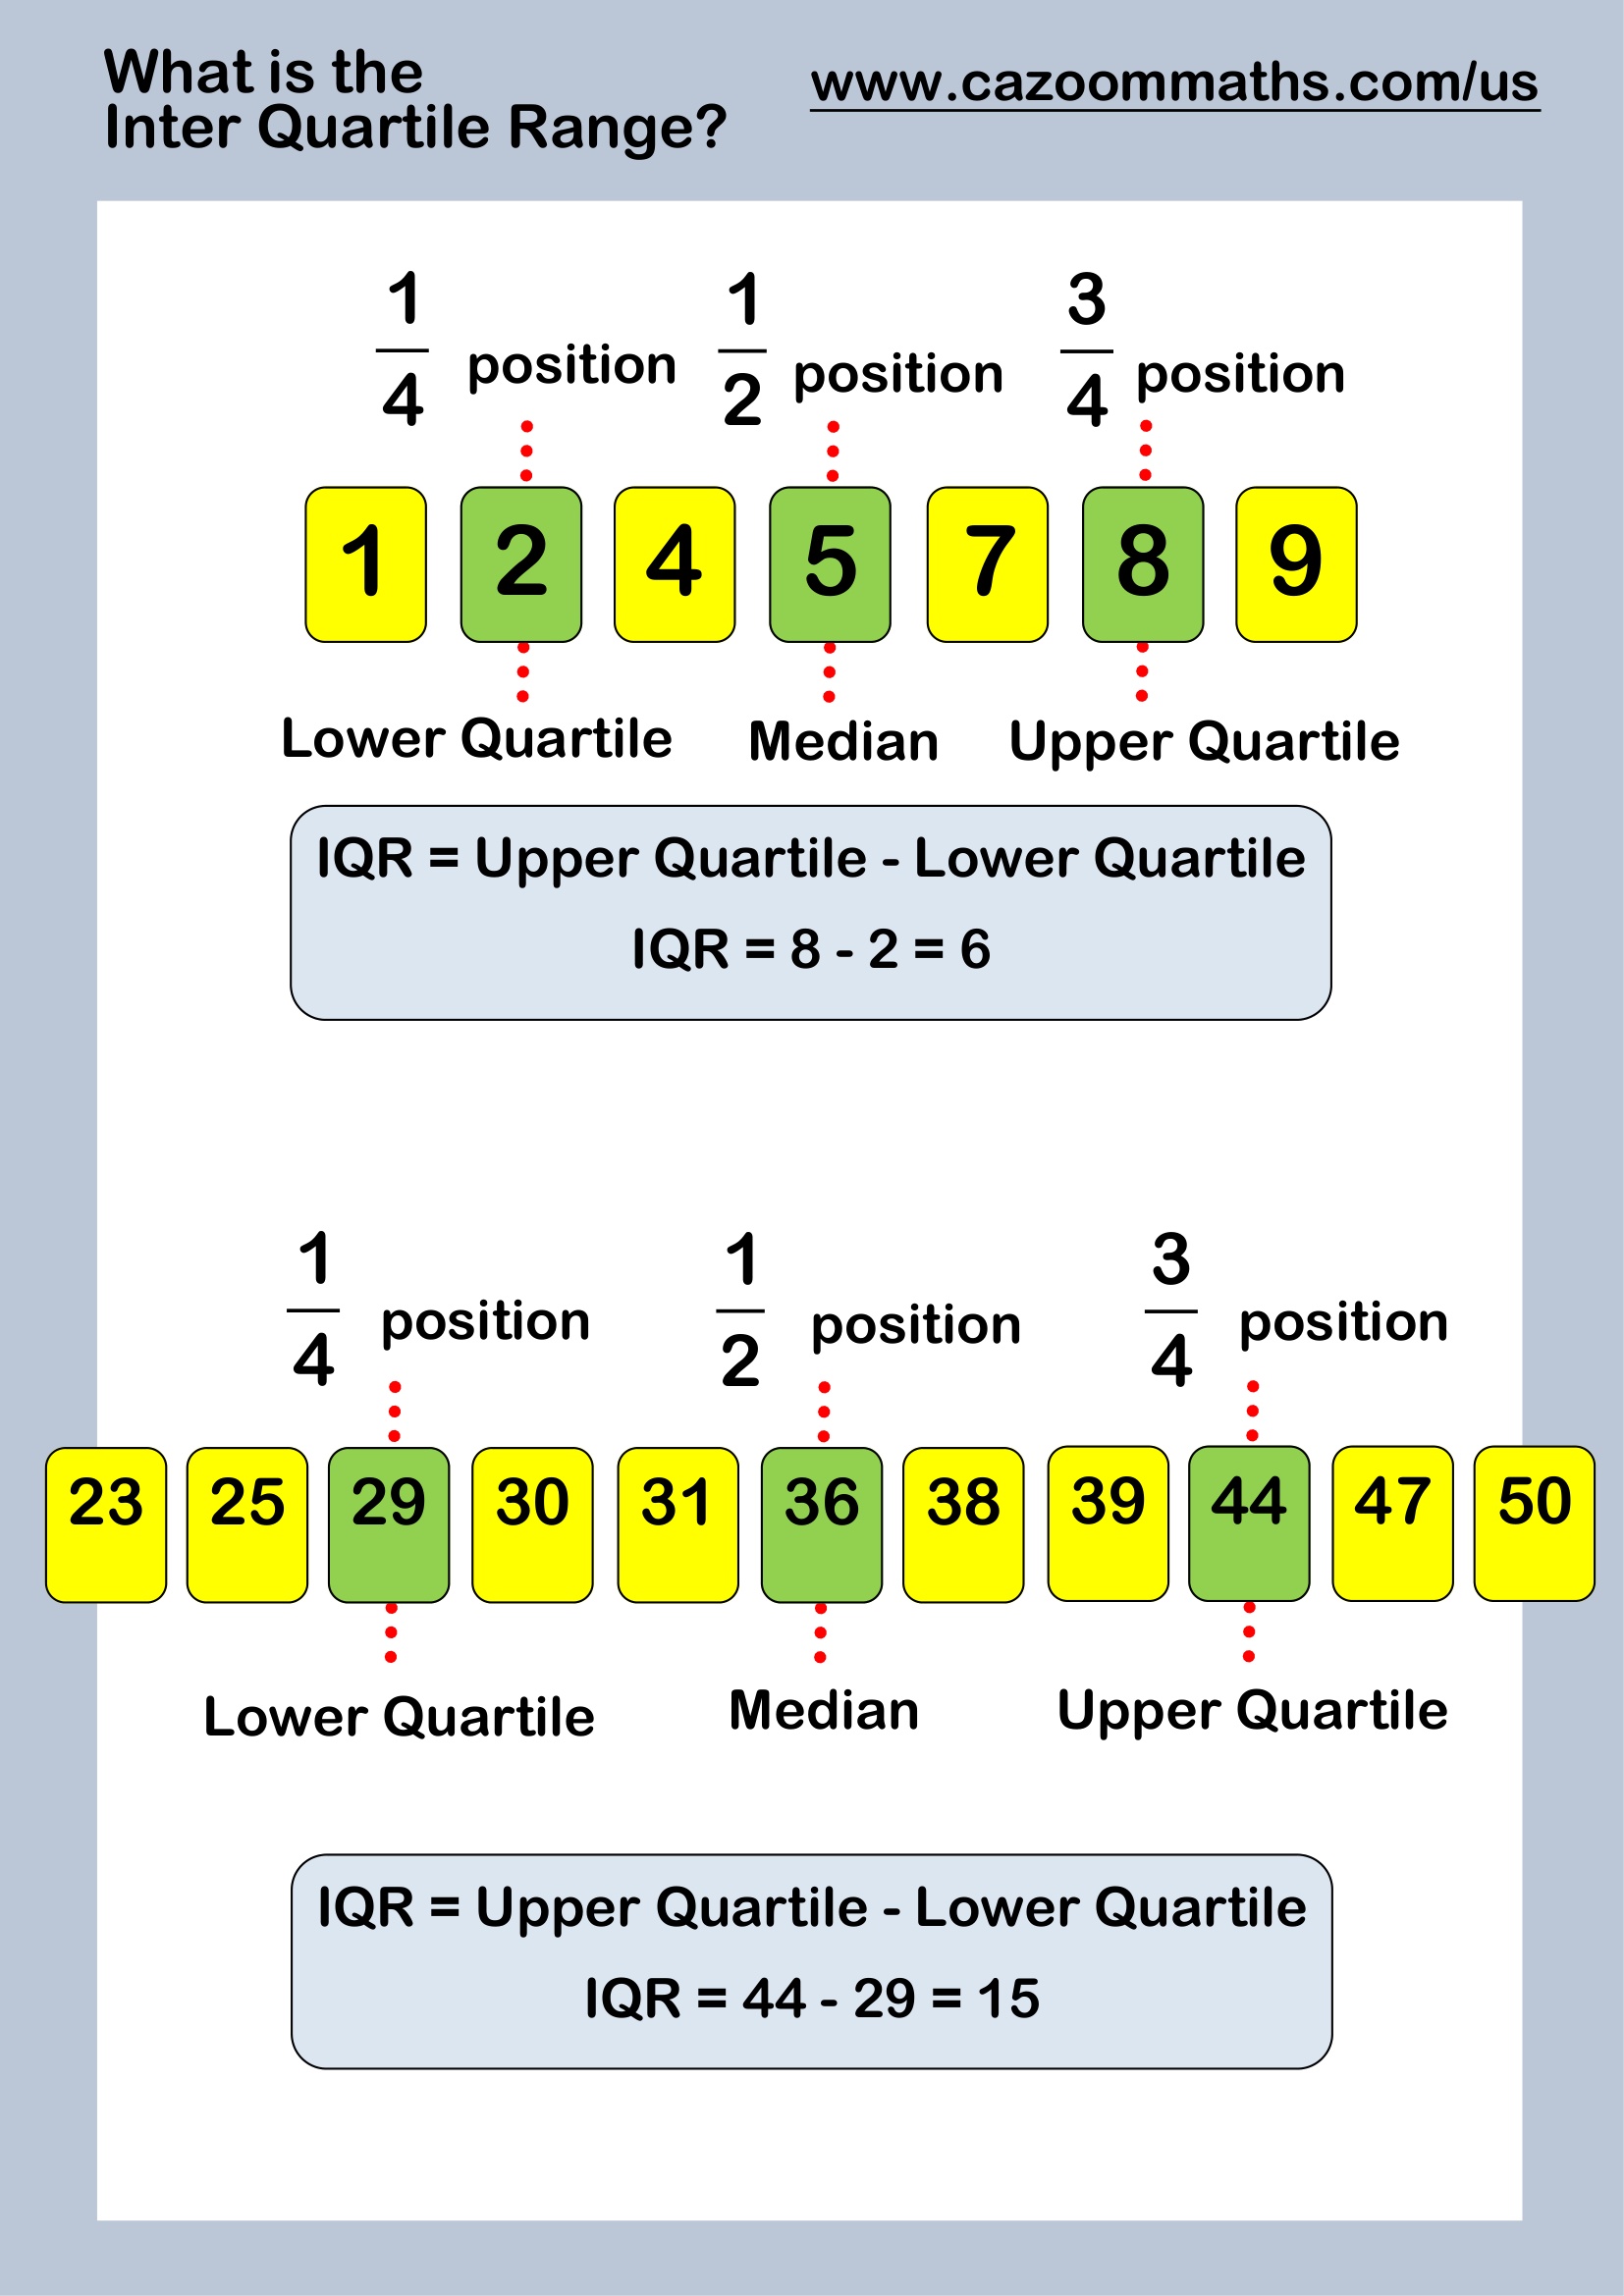
What is the Inter Quartile Range?
All worksheets are created by the team of experienced teachers at Cazoom Math.