Stem & Leaf Diagrams iGCSE REVISION WORKSHEET
About This Worksheet
This iGCSE revision worksheet covers Stem & Leaf Diagrams, aligned to Cambridge iGCSE (0580) syllabus codes C9.6, C9.3, C8.1 and Edexcel iGCSE (4MA1) codes 6.1, 6.2, 7.1. Answers and worked solutions are included.
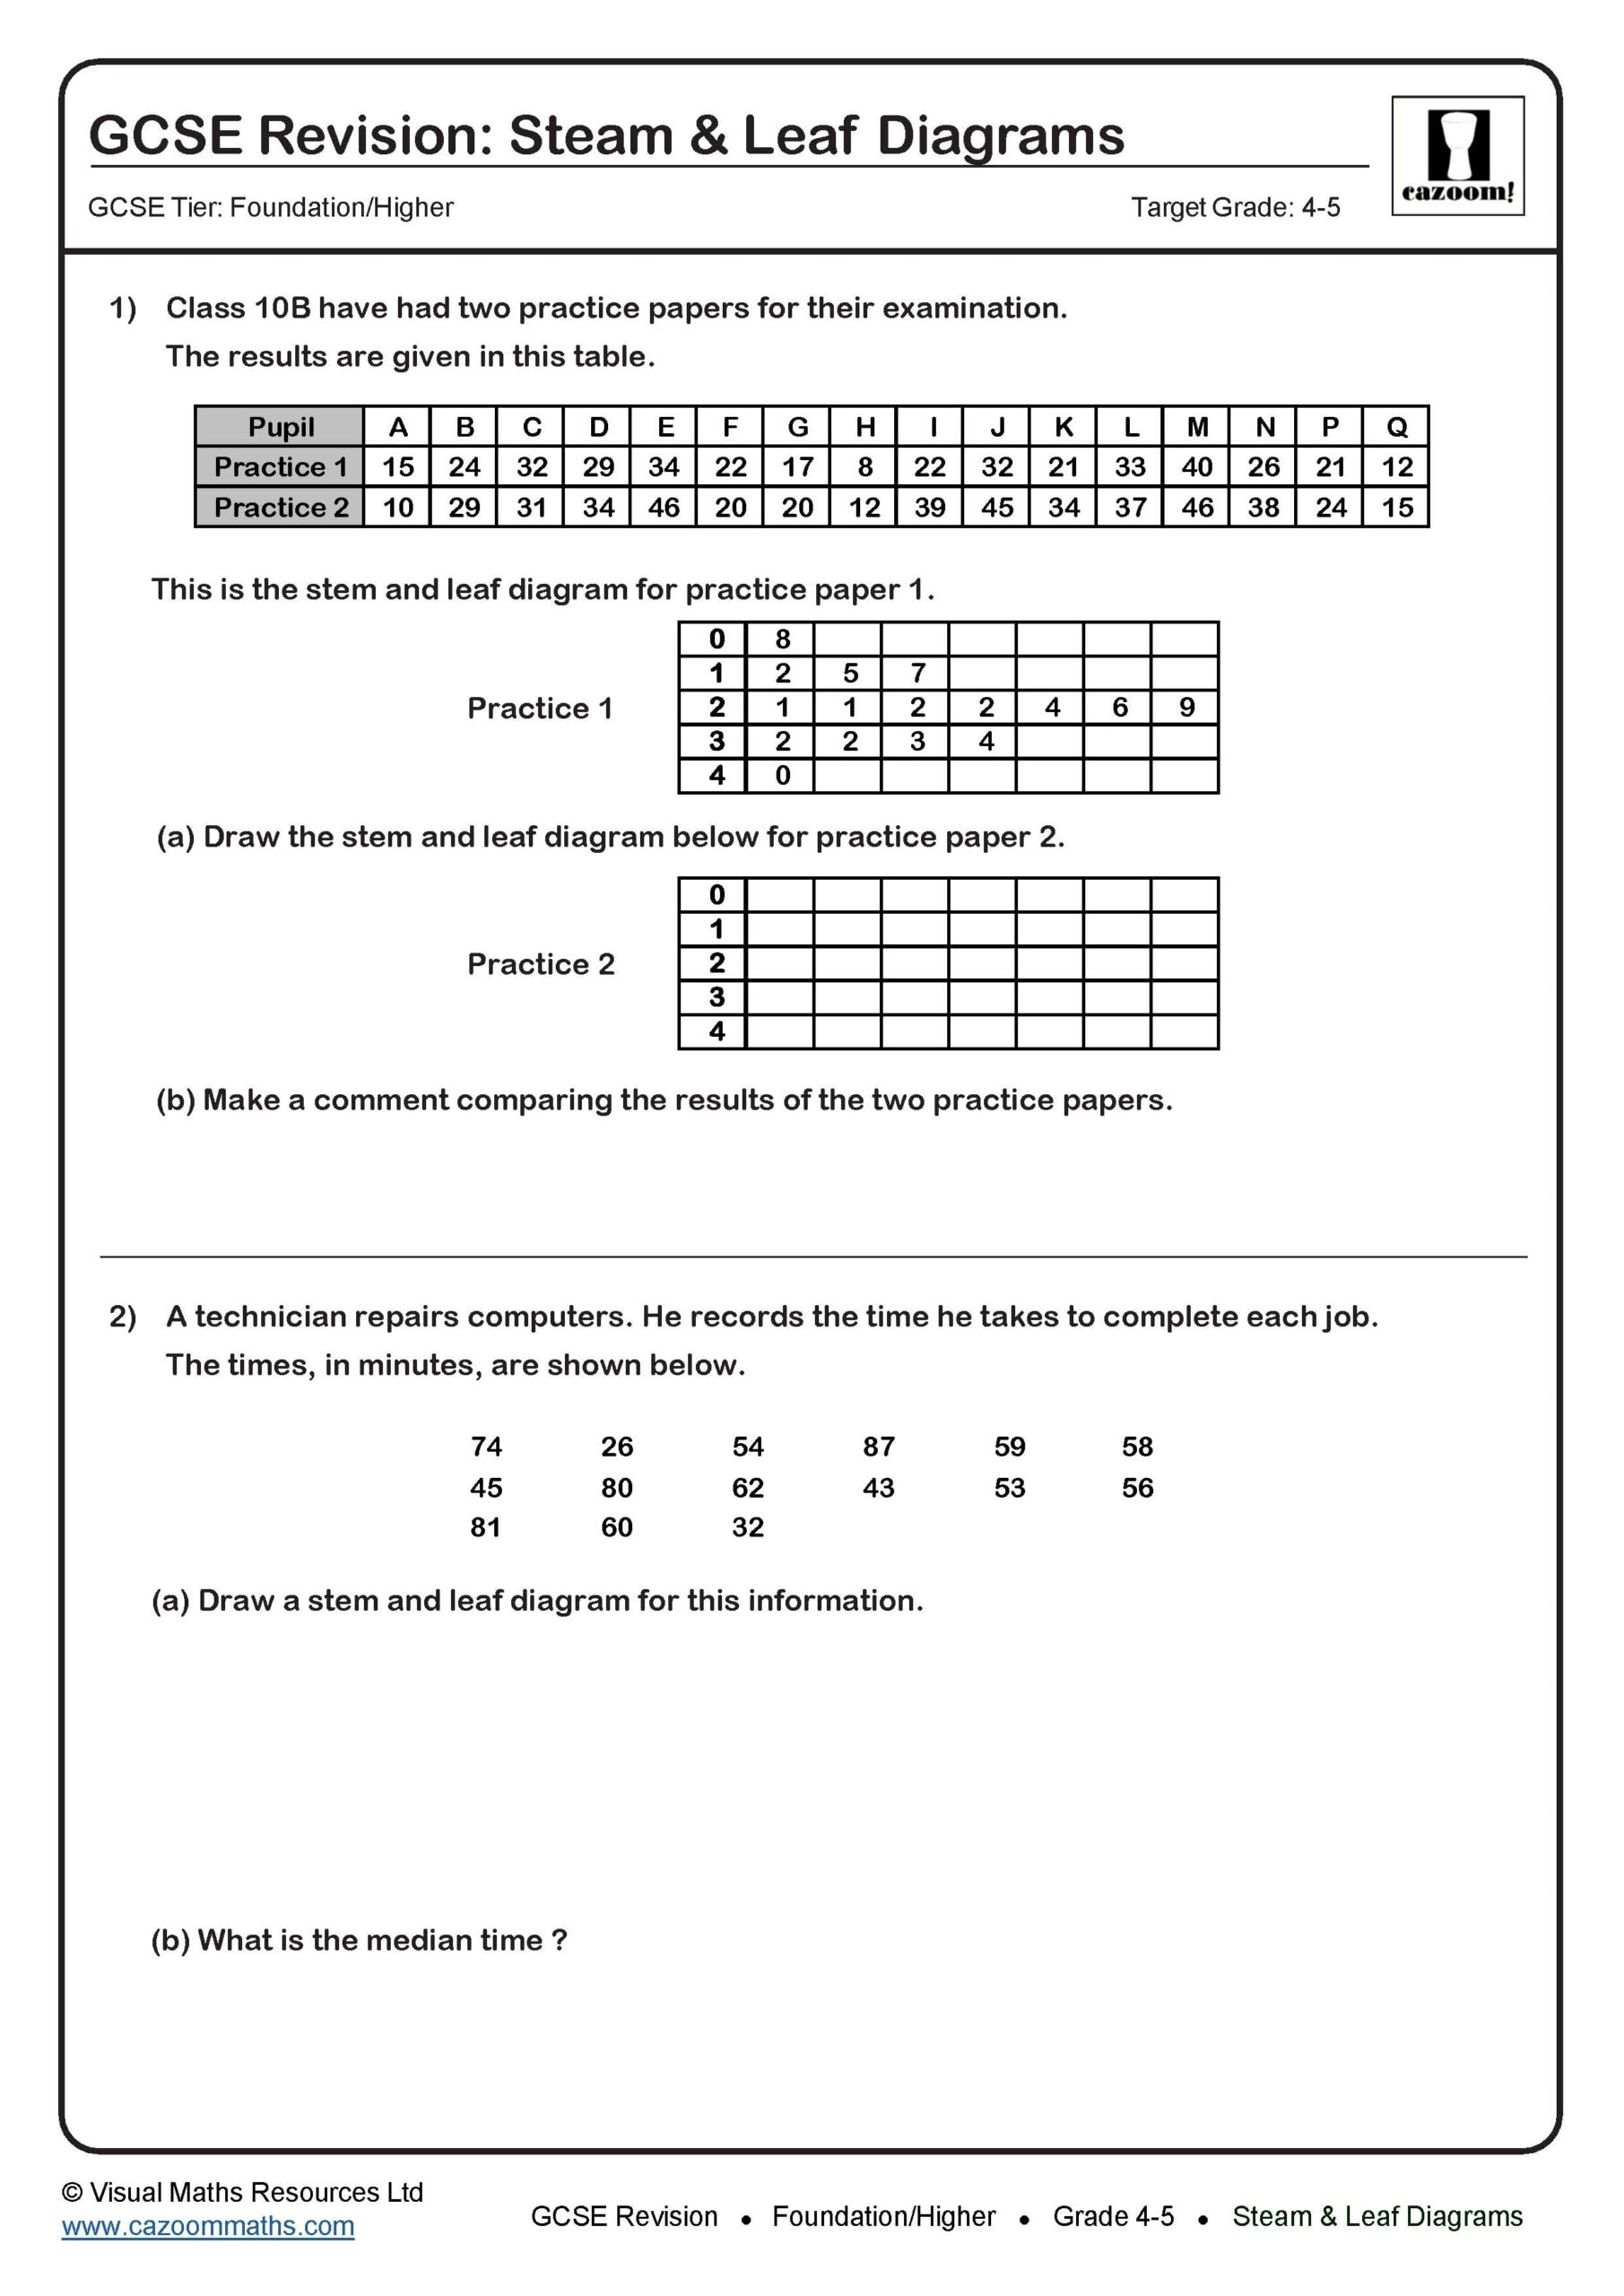
This set of stem and leaf questions involves creating stem and leaf diagrams, finding averages and the range, and comparing two sets of data.
All worksheets are created by the team of experienced teachers at Cazoom Maths.
iGCSE Syllabus Alignment
Cambridge iGCSE Maths (0580)
Construct and interpret bar charts, pie charts, pictograms, stem-and-leaf diagrams and simple frequency distributions
StatisticsCalculate the probability of a single event as either a fraction, decimal or percentage
ProbabilityEdexcel iGCSE Maths (4MA1)
Use and interpret statistical data presented in tables, charts and diagrams. Construct and interpret bar charts, pie charts, pictograms, stem-and-leaf diagrams, frequency tables and two-way tables
StatisticsCalculate the mean, median, mode and range of a set of data. Find the mean, modal class and median from grouped data. Find the estimated mean of grouped data
StatisticsUnderstand and use the probability scale. Understand and use theoretical and experimental probability. Understand that the sum of all probabilities for all outcomes is 1. Use P(not A) = 1 − P(A)
Probability