KS1 and KS2 Statistics Worksheets
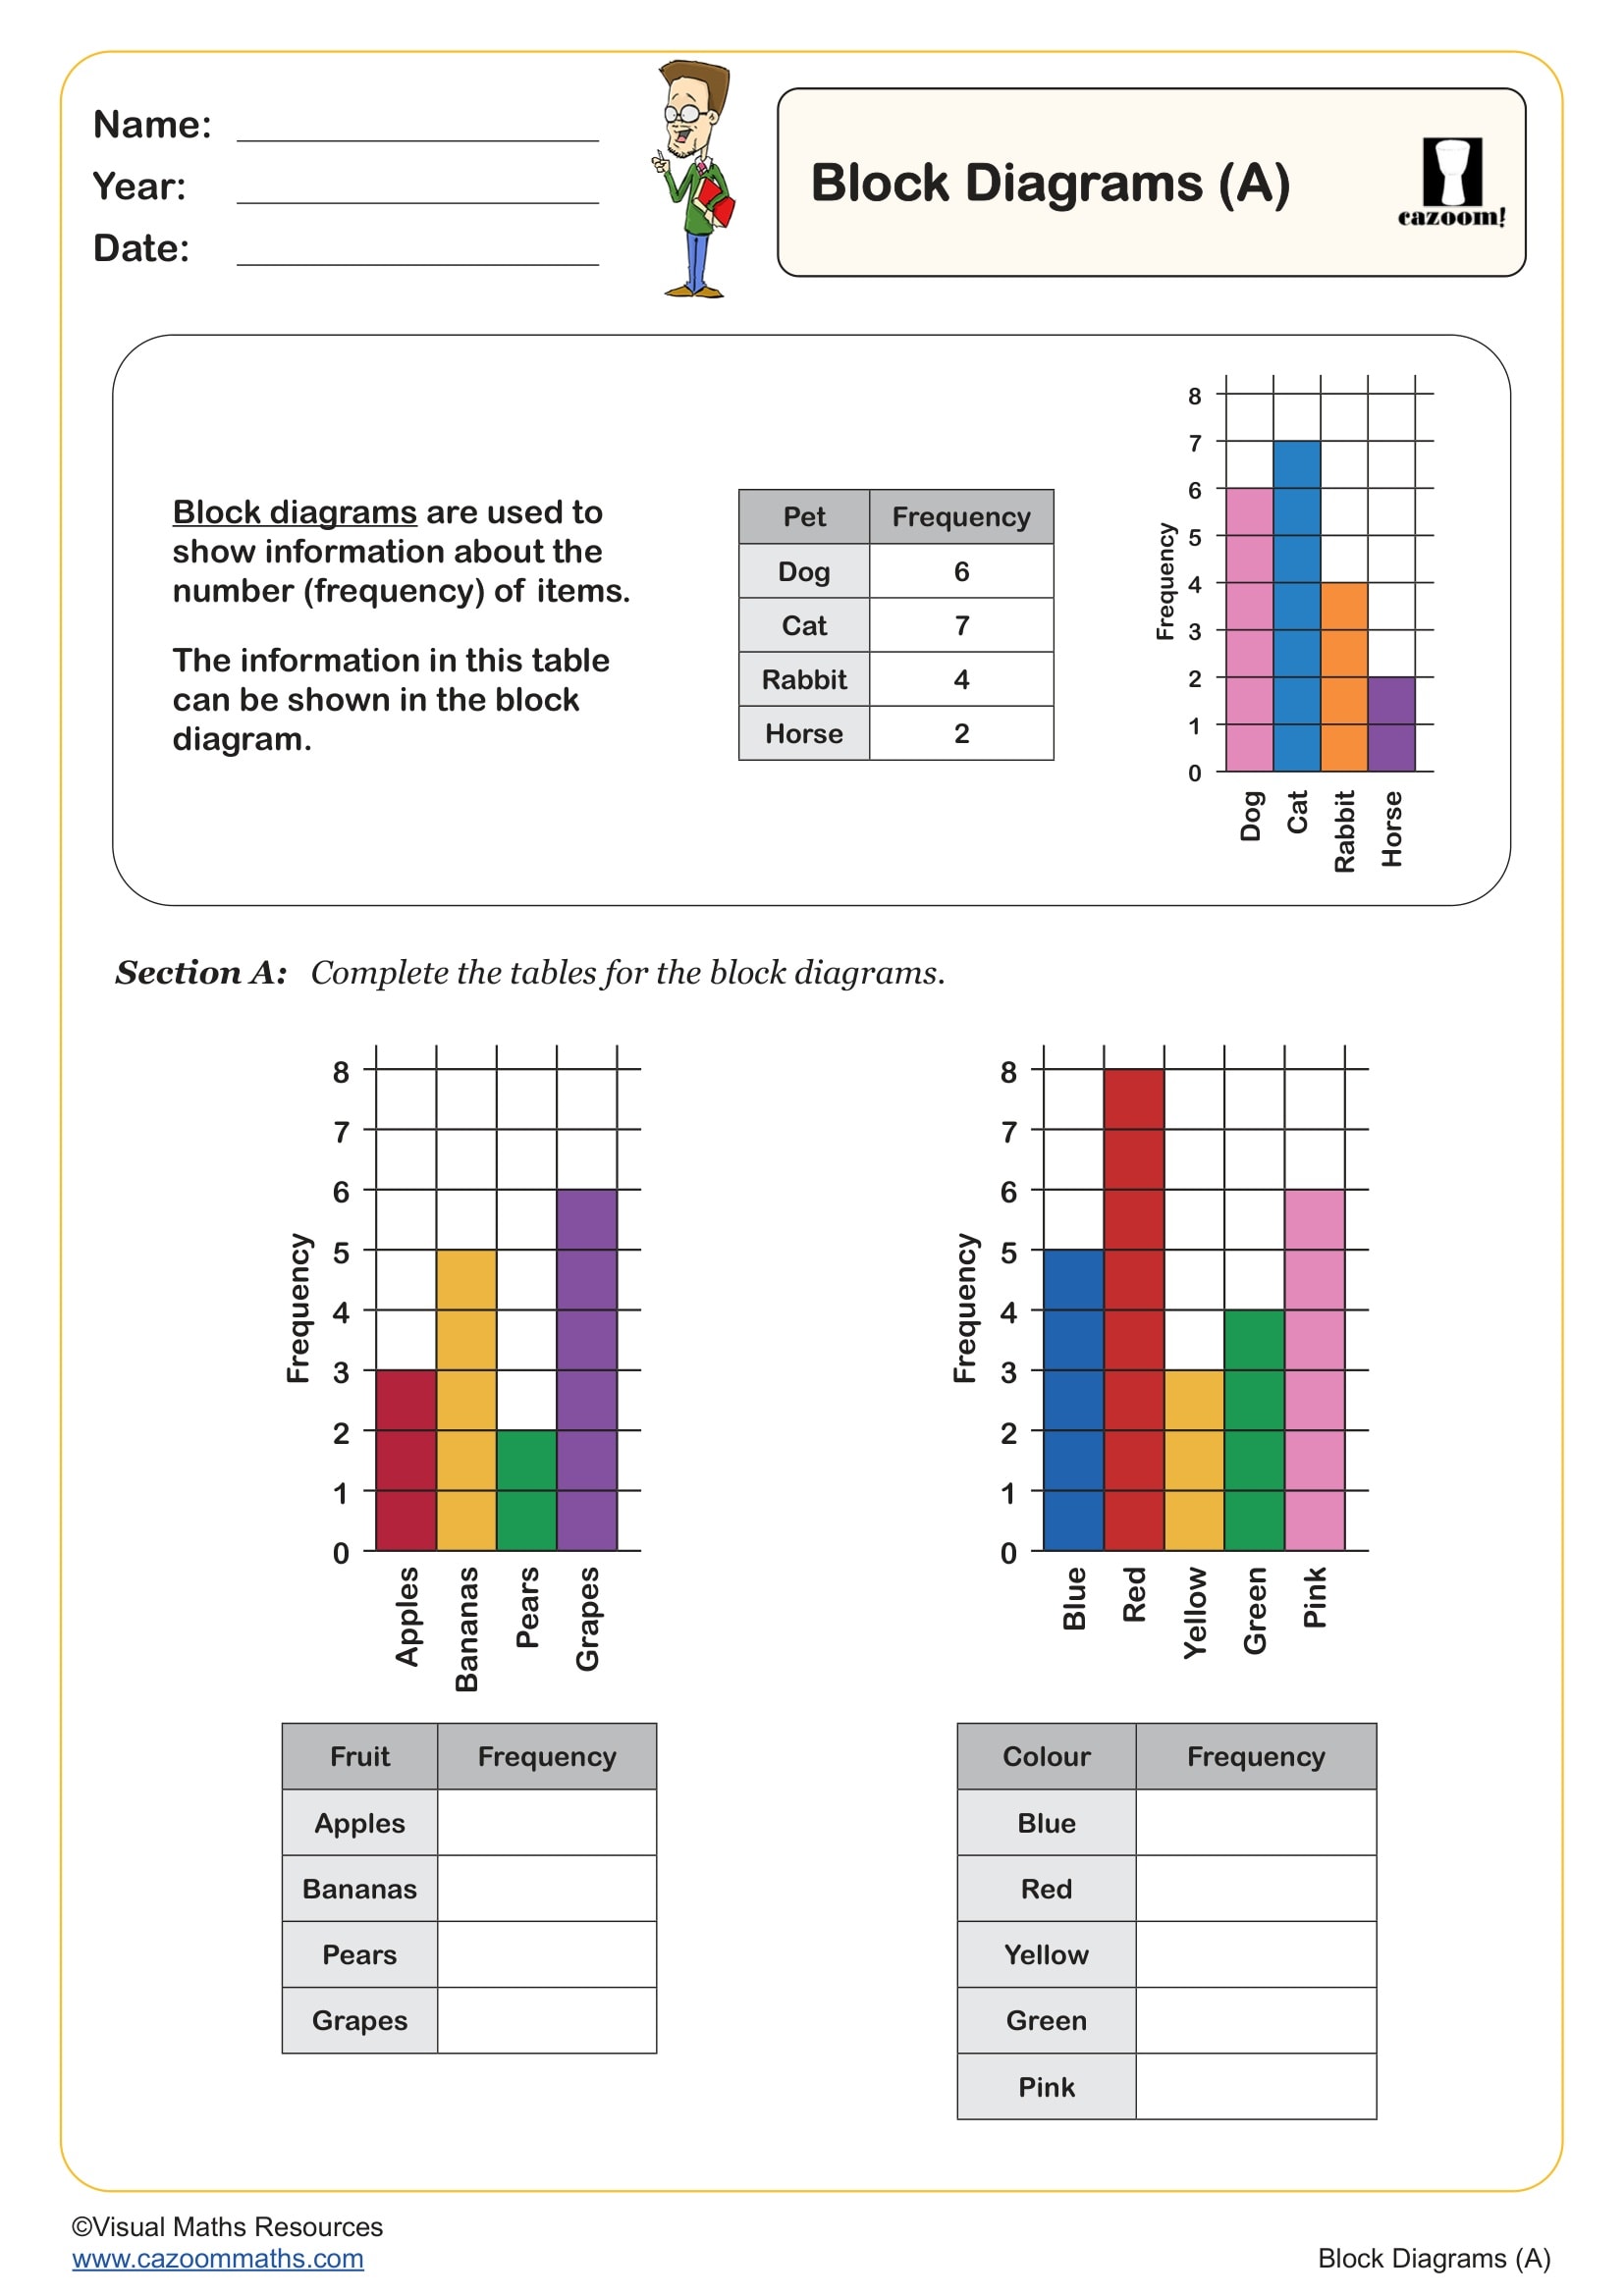
Block Diagrams (A)
Year groups: 2
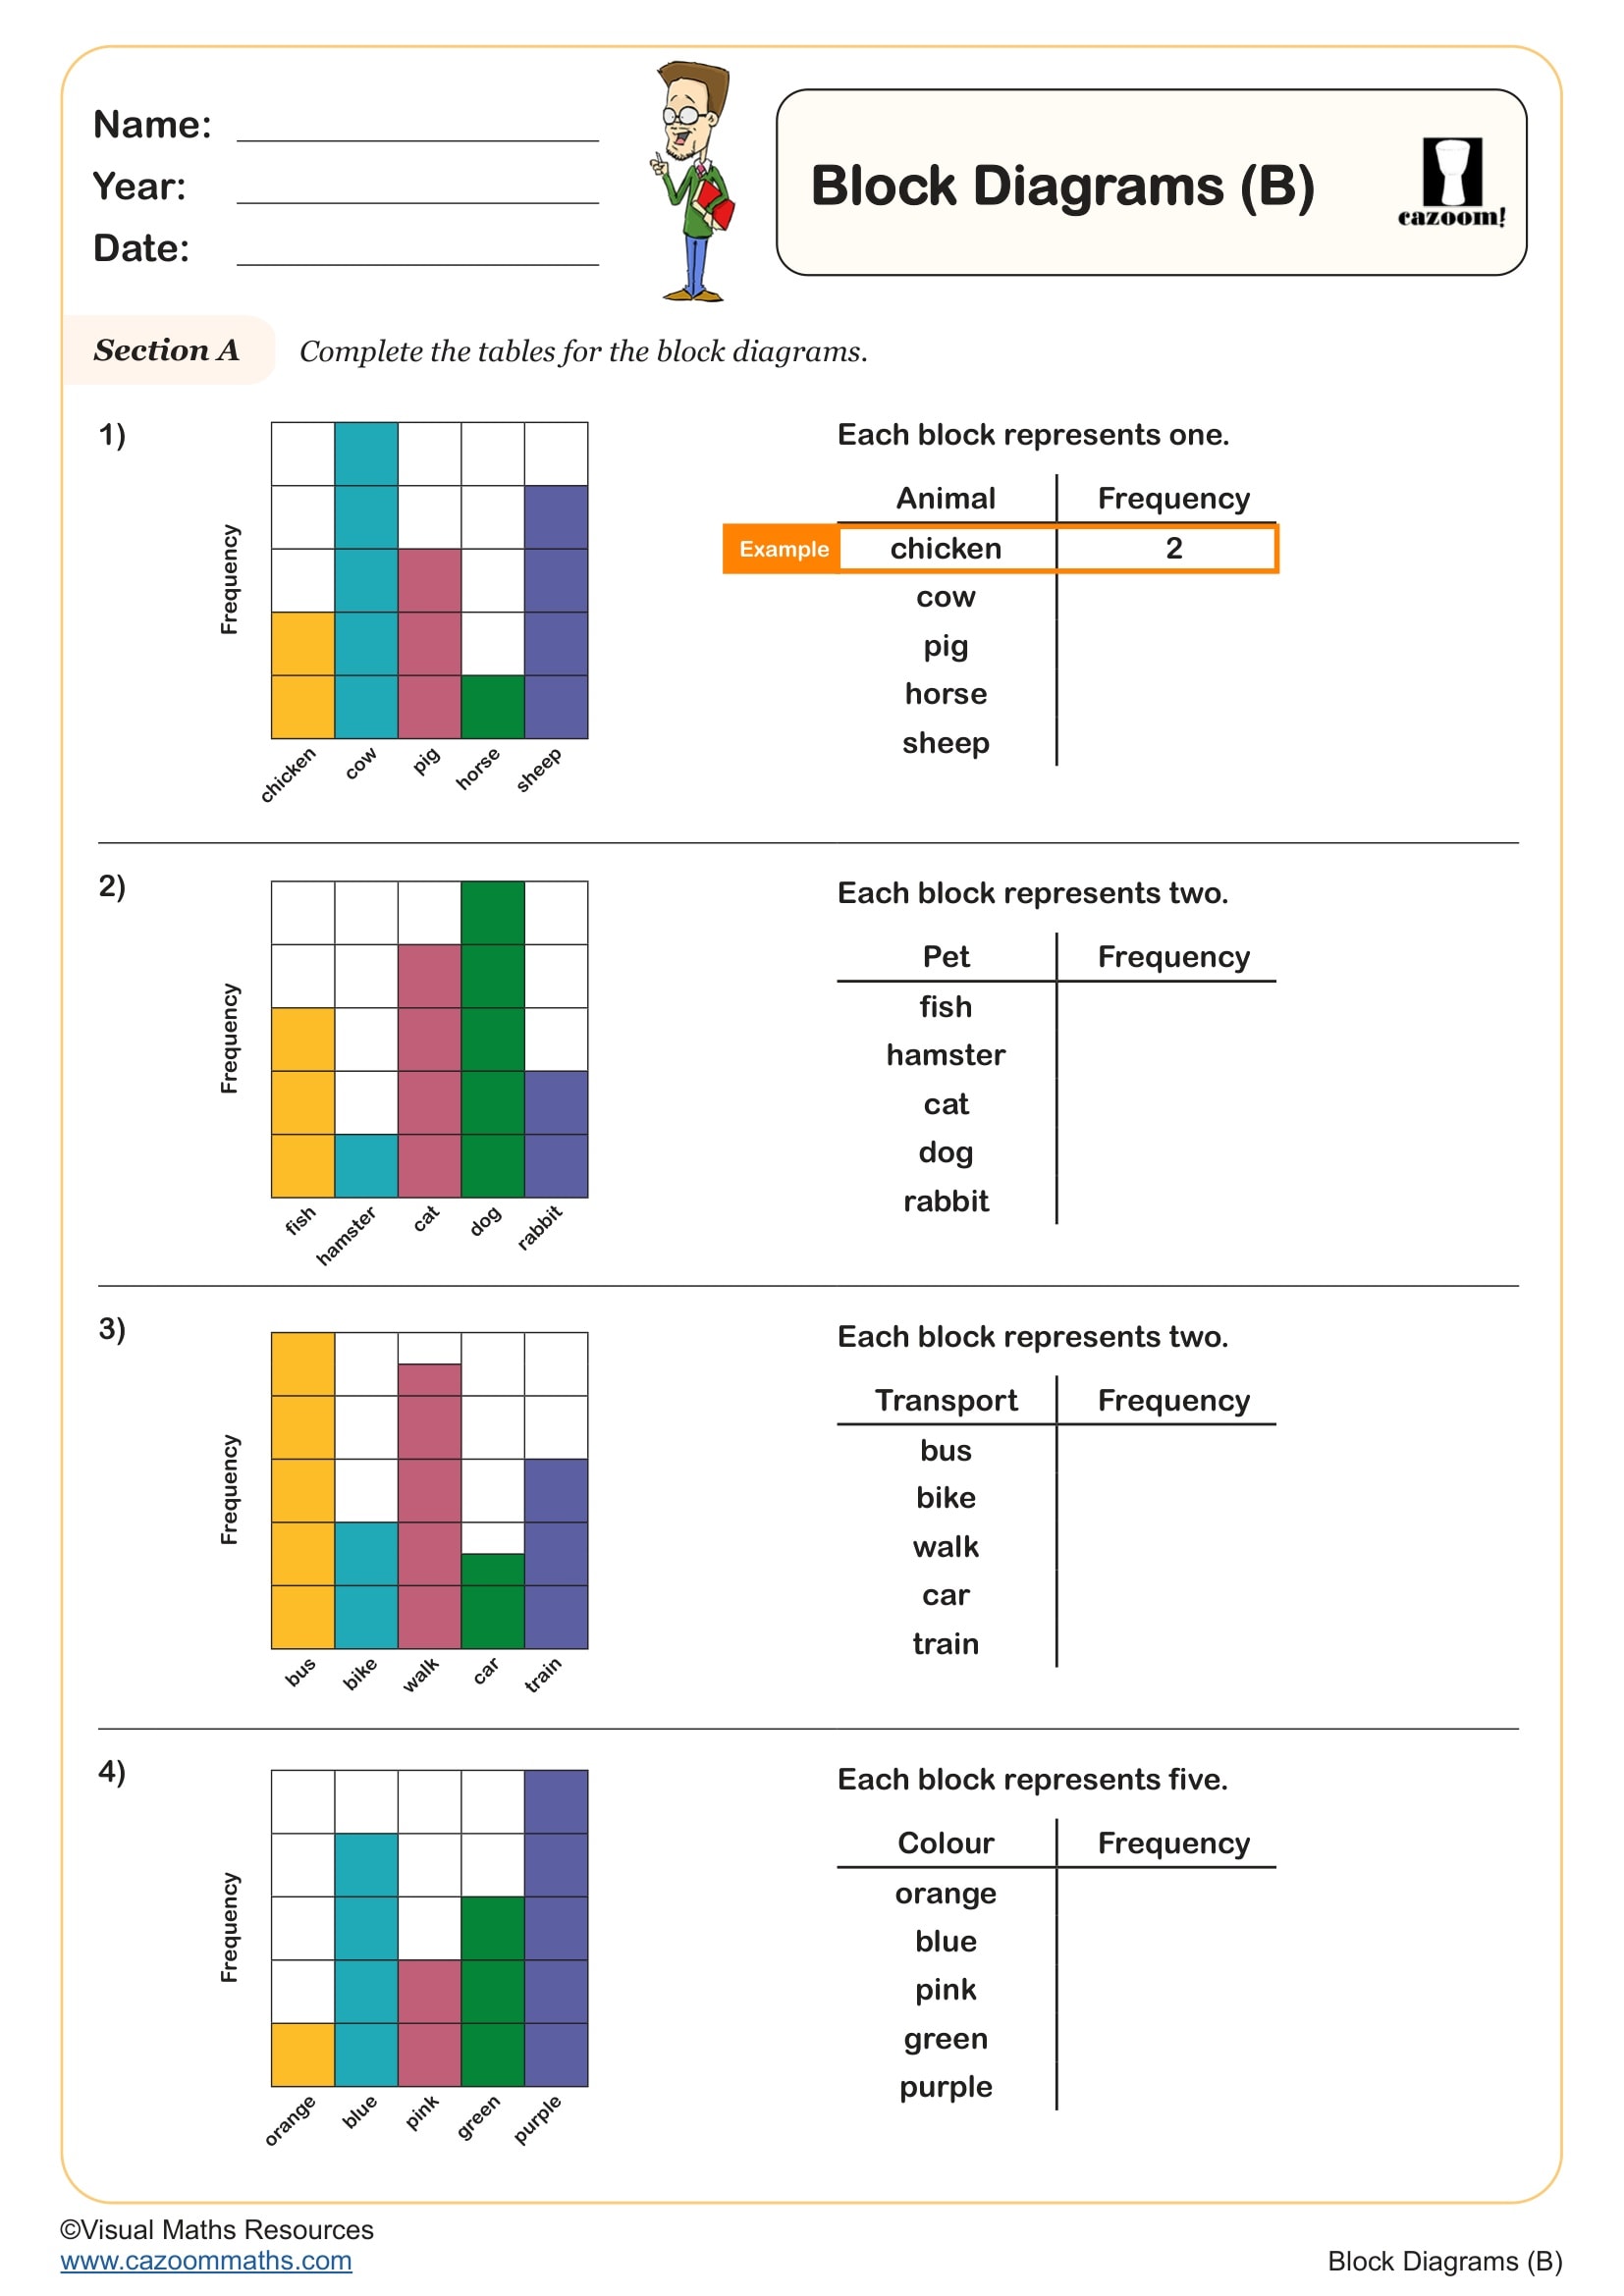
Block Diagrams (B)
Year groups: 2
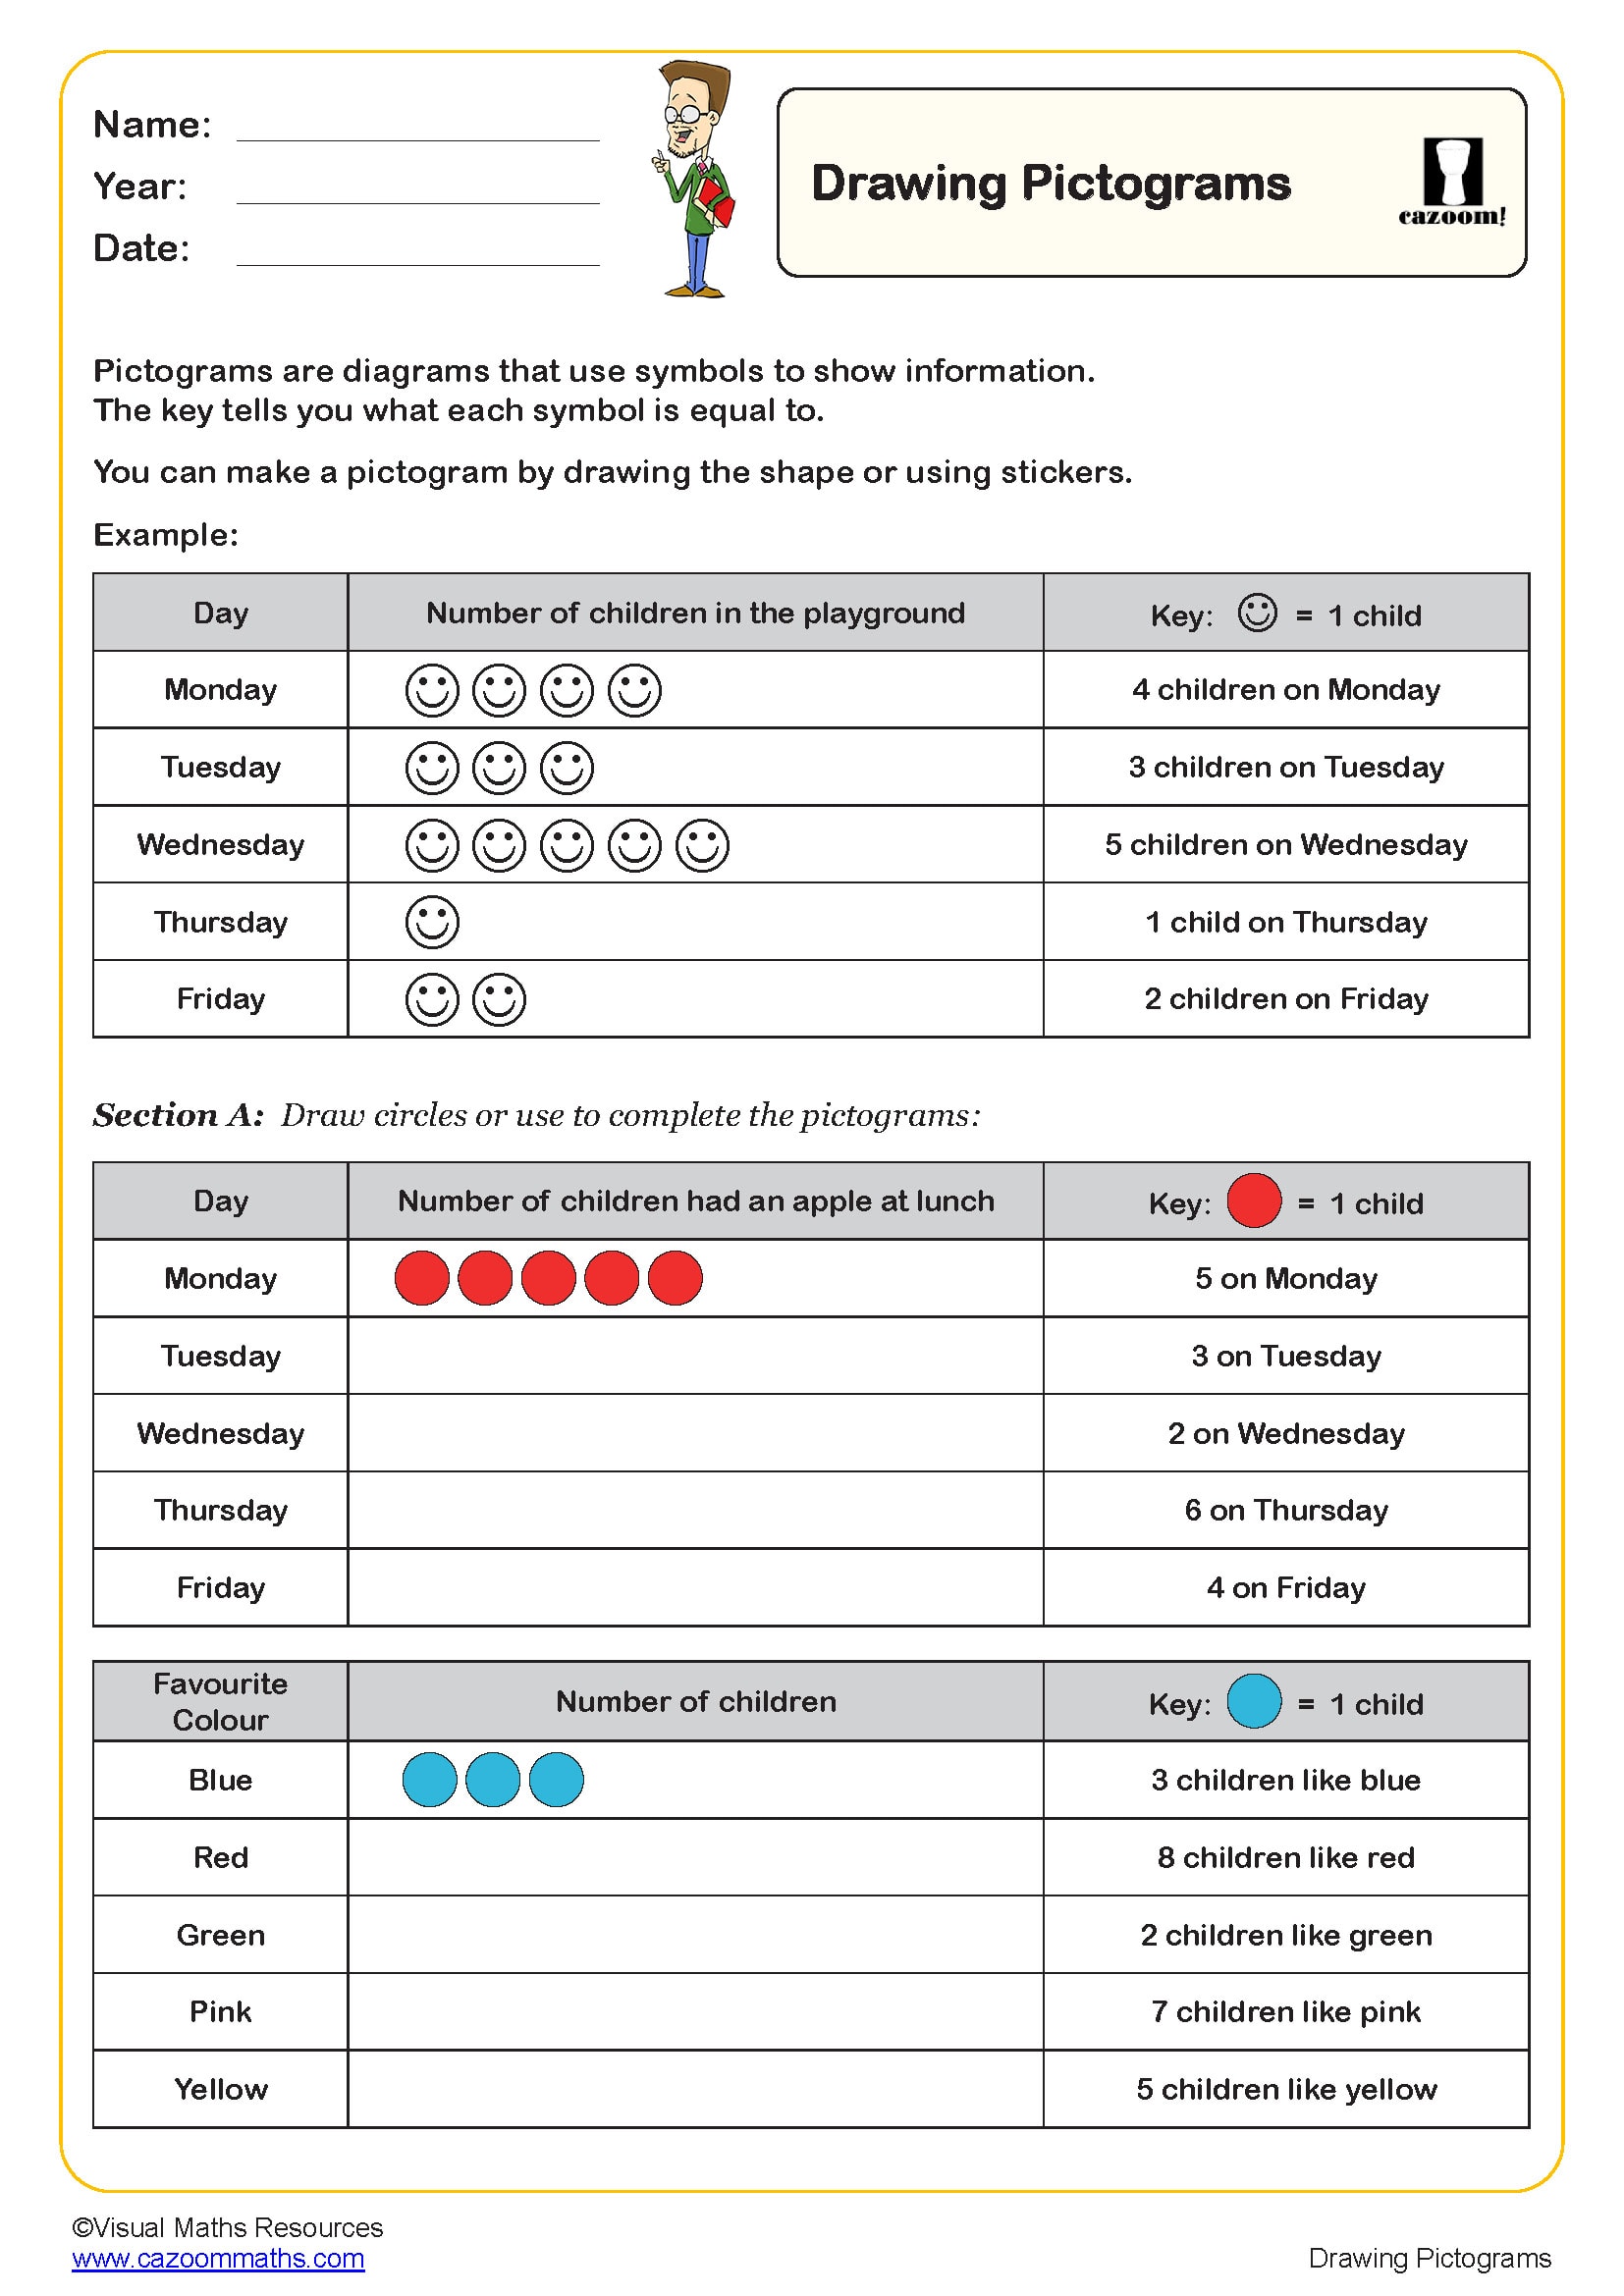
Drawing Pictograms
Year groups: 2
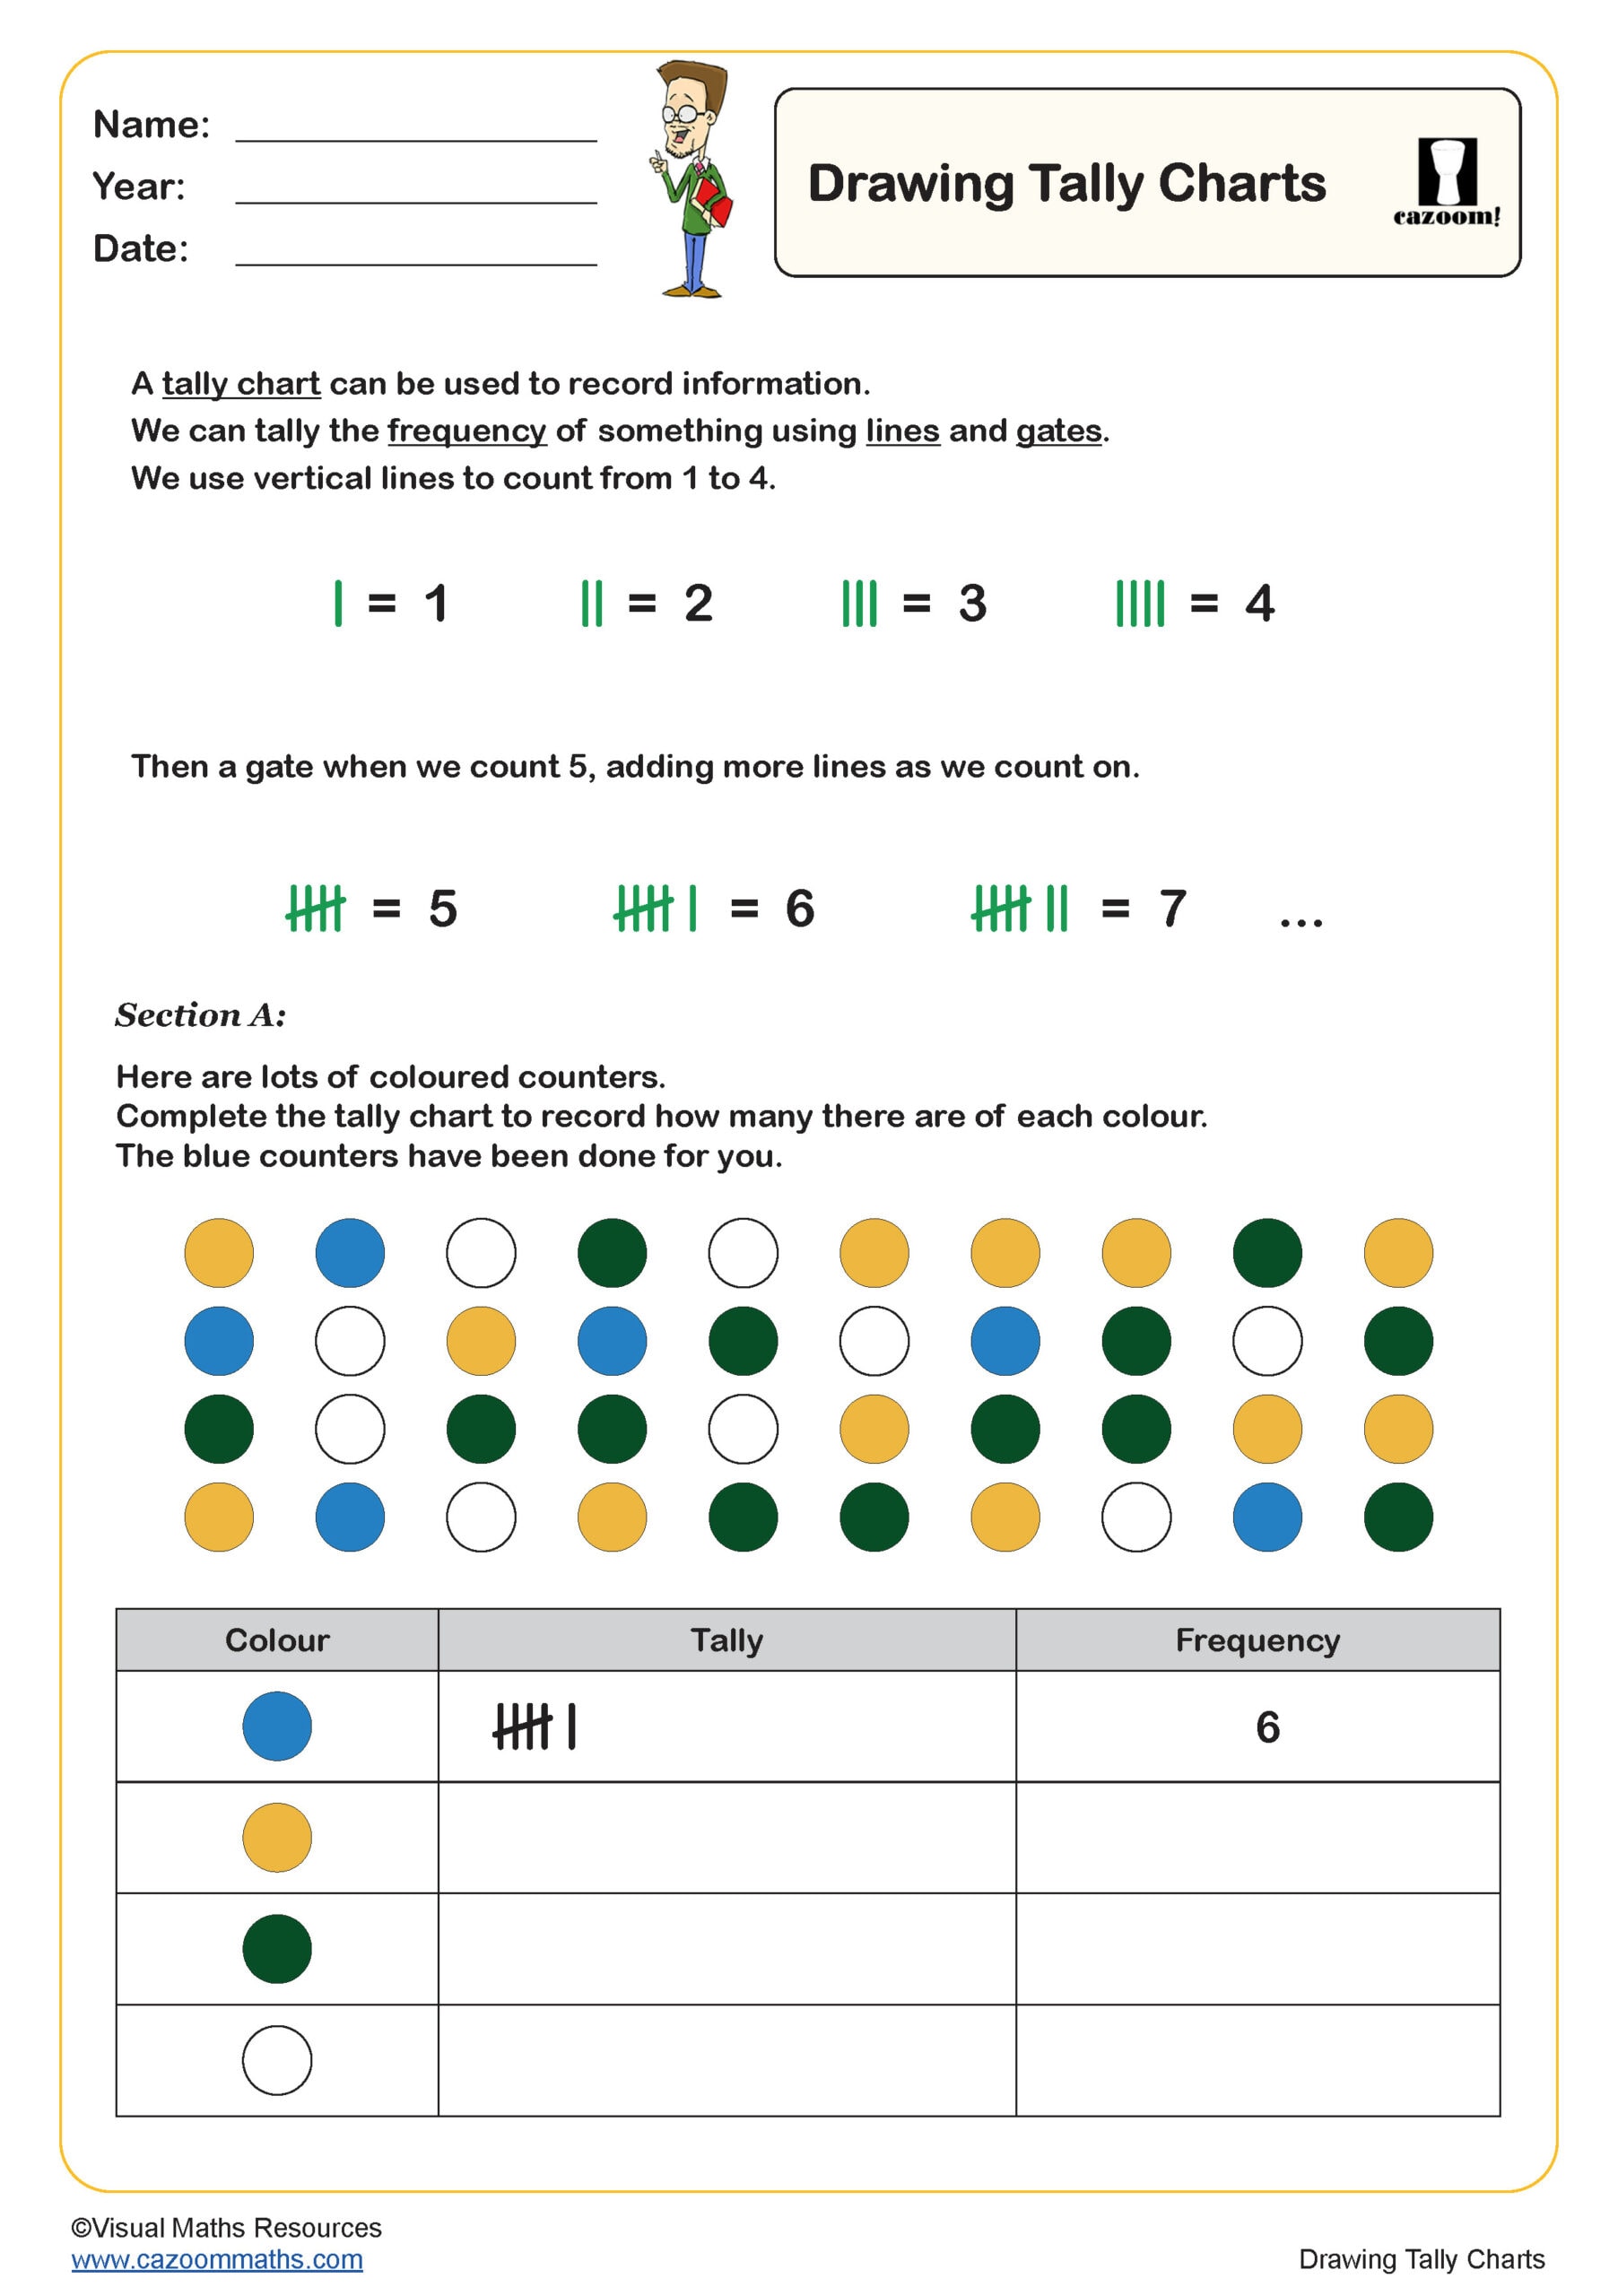
Drawing Tally Charts
Year groups: 2
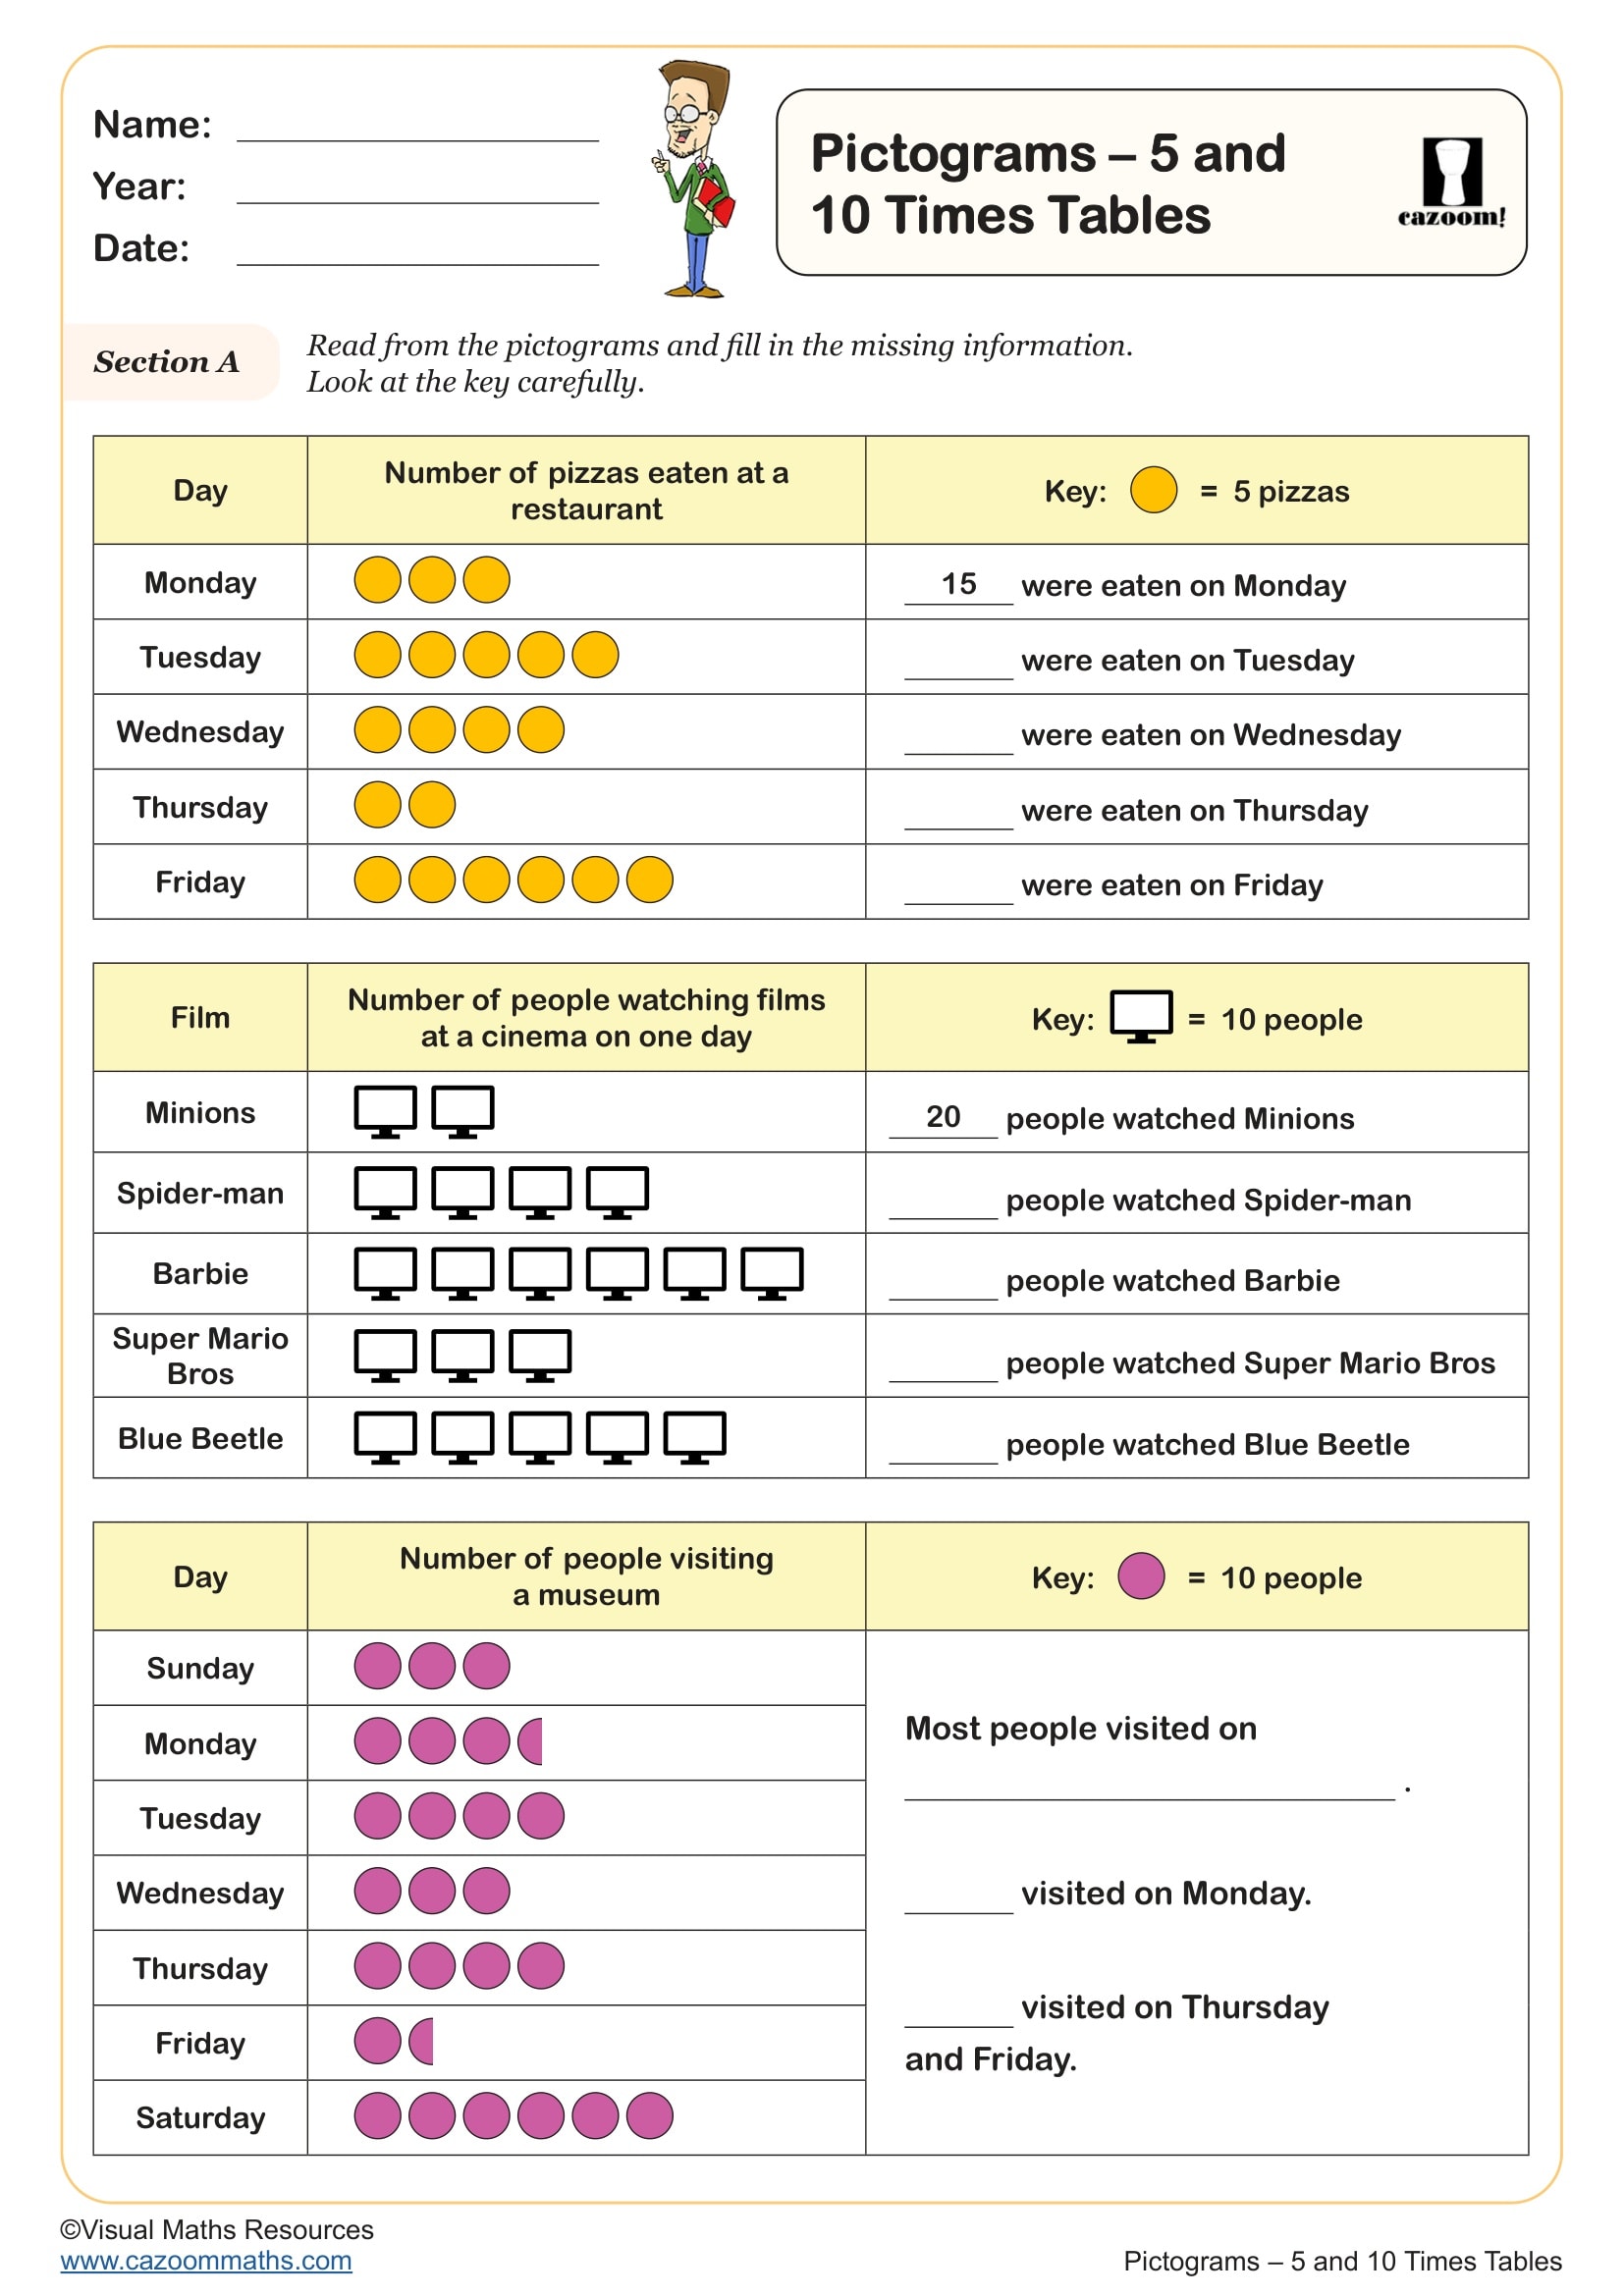
Pictograms - 5 and 10 Times Tables
Year groups: 2
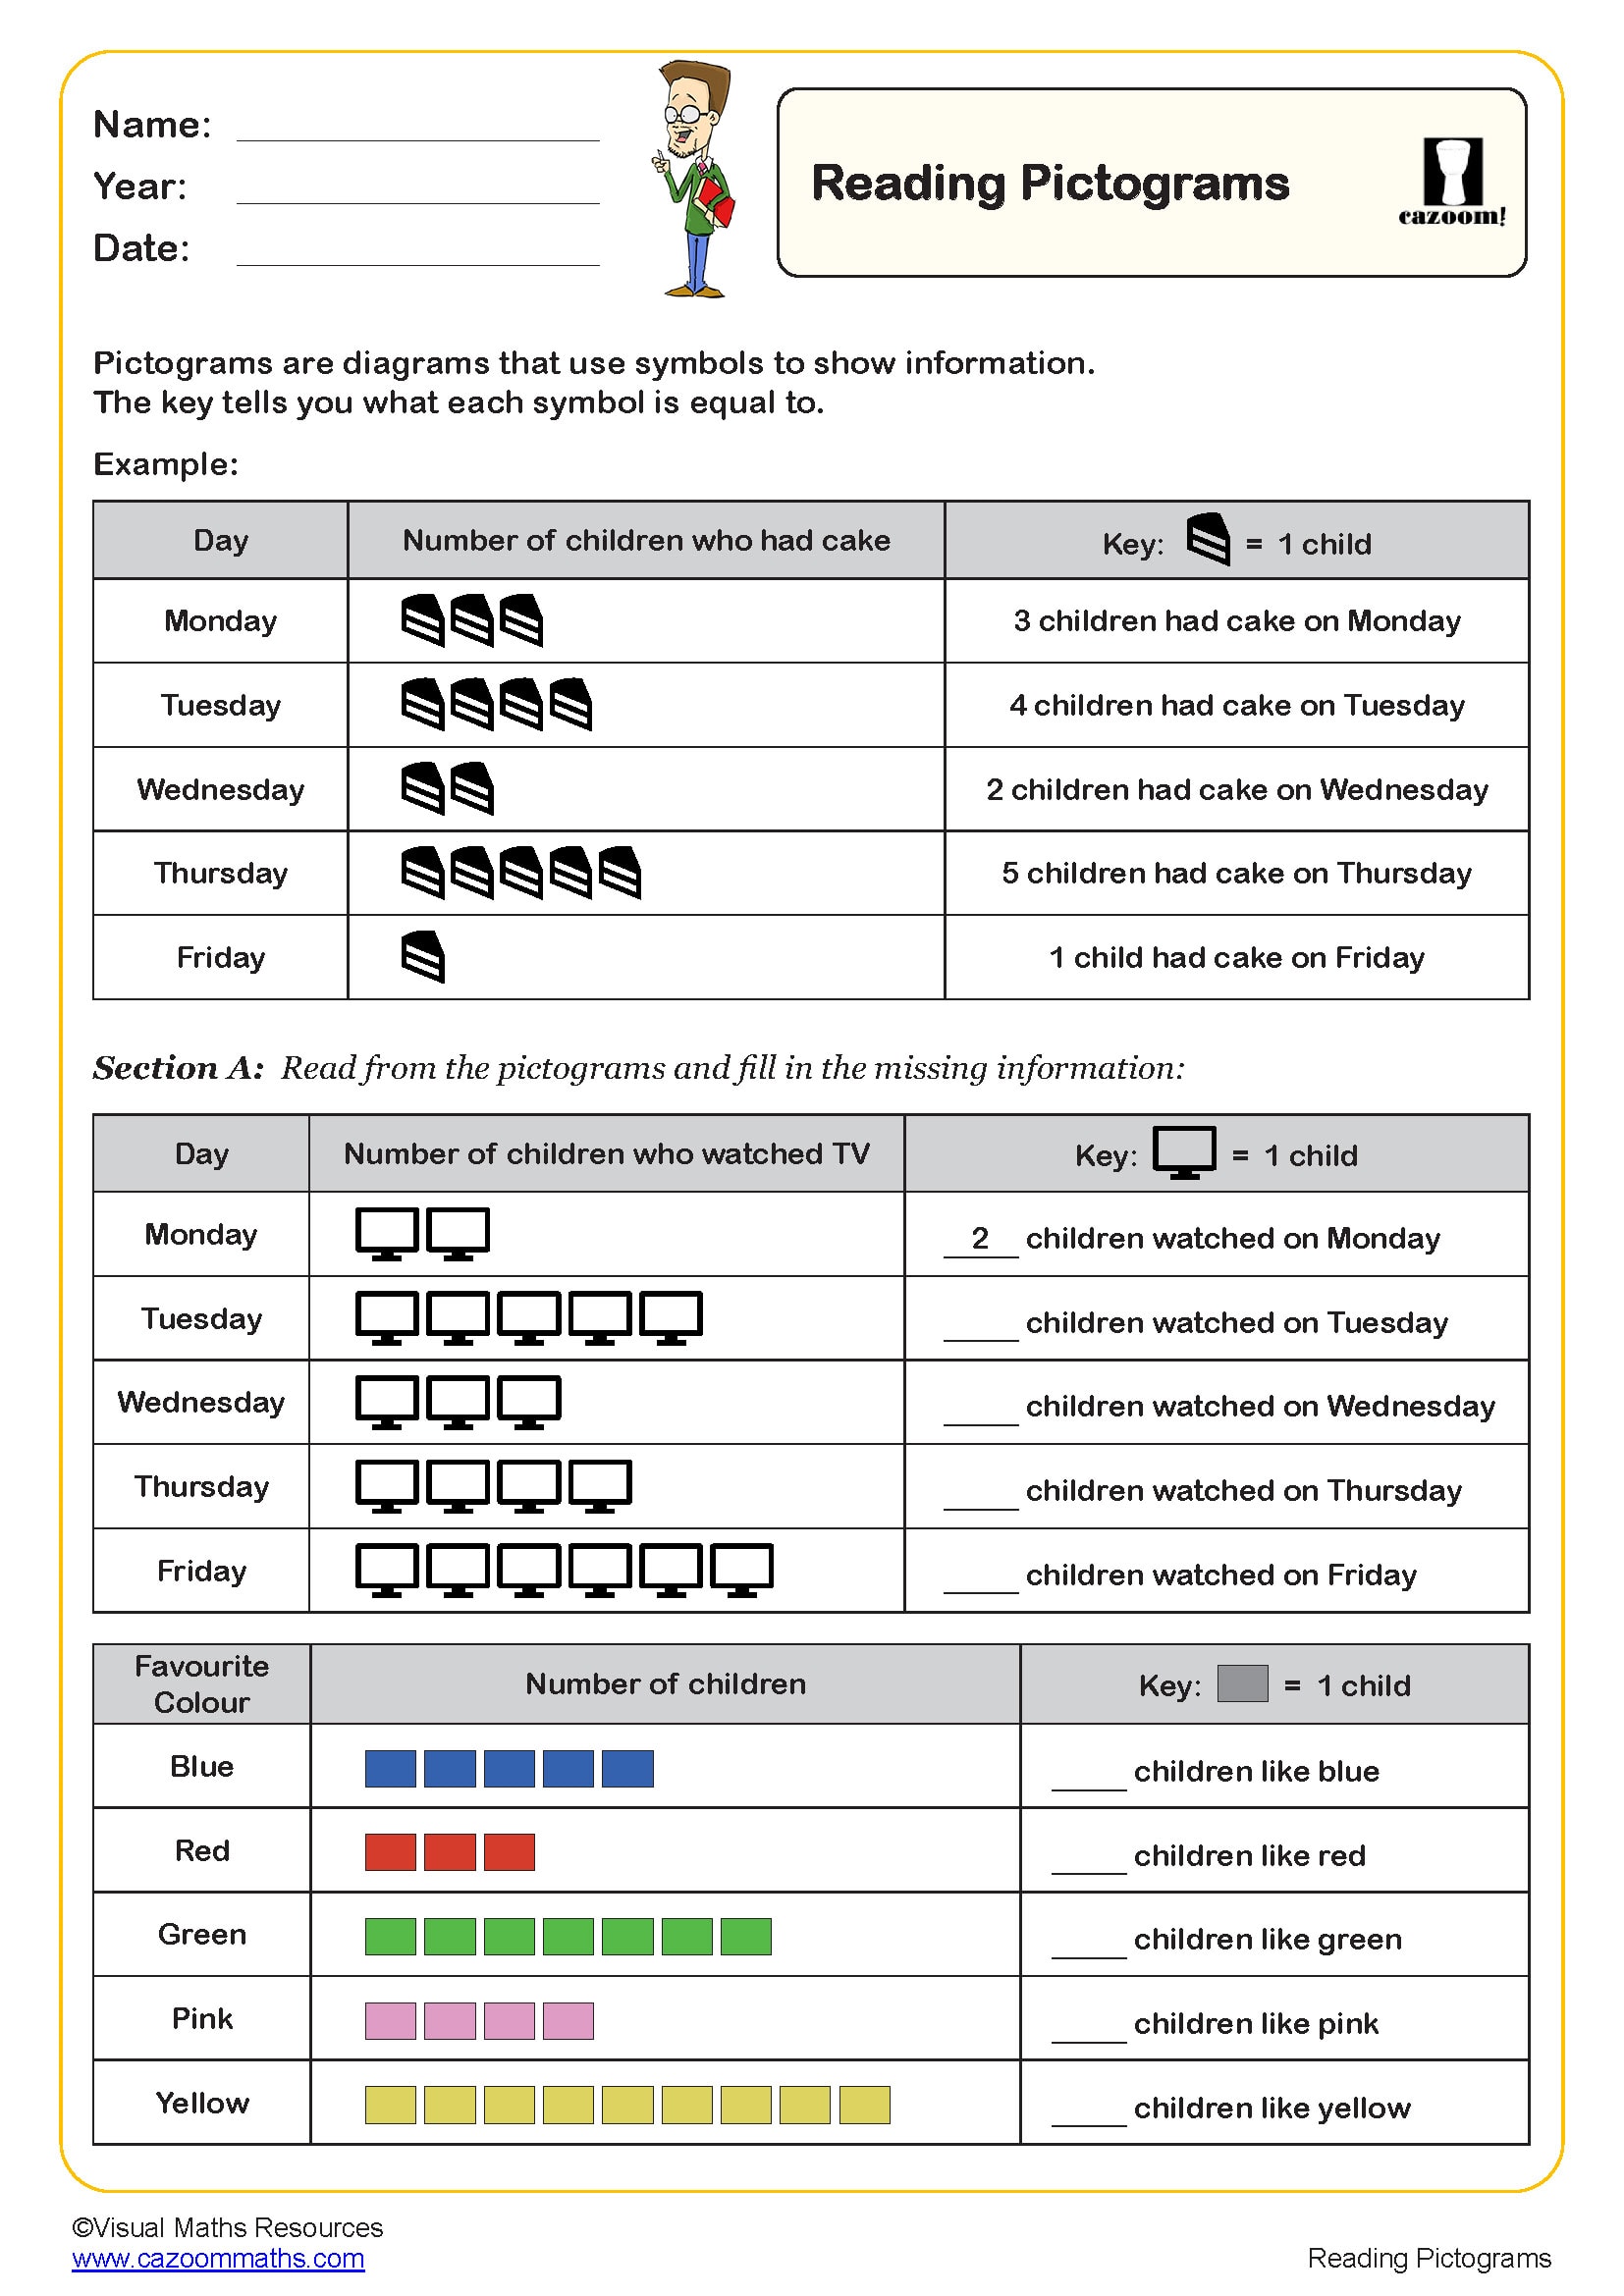
Reading Pictograms
Year groups: 2
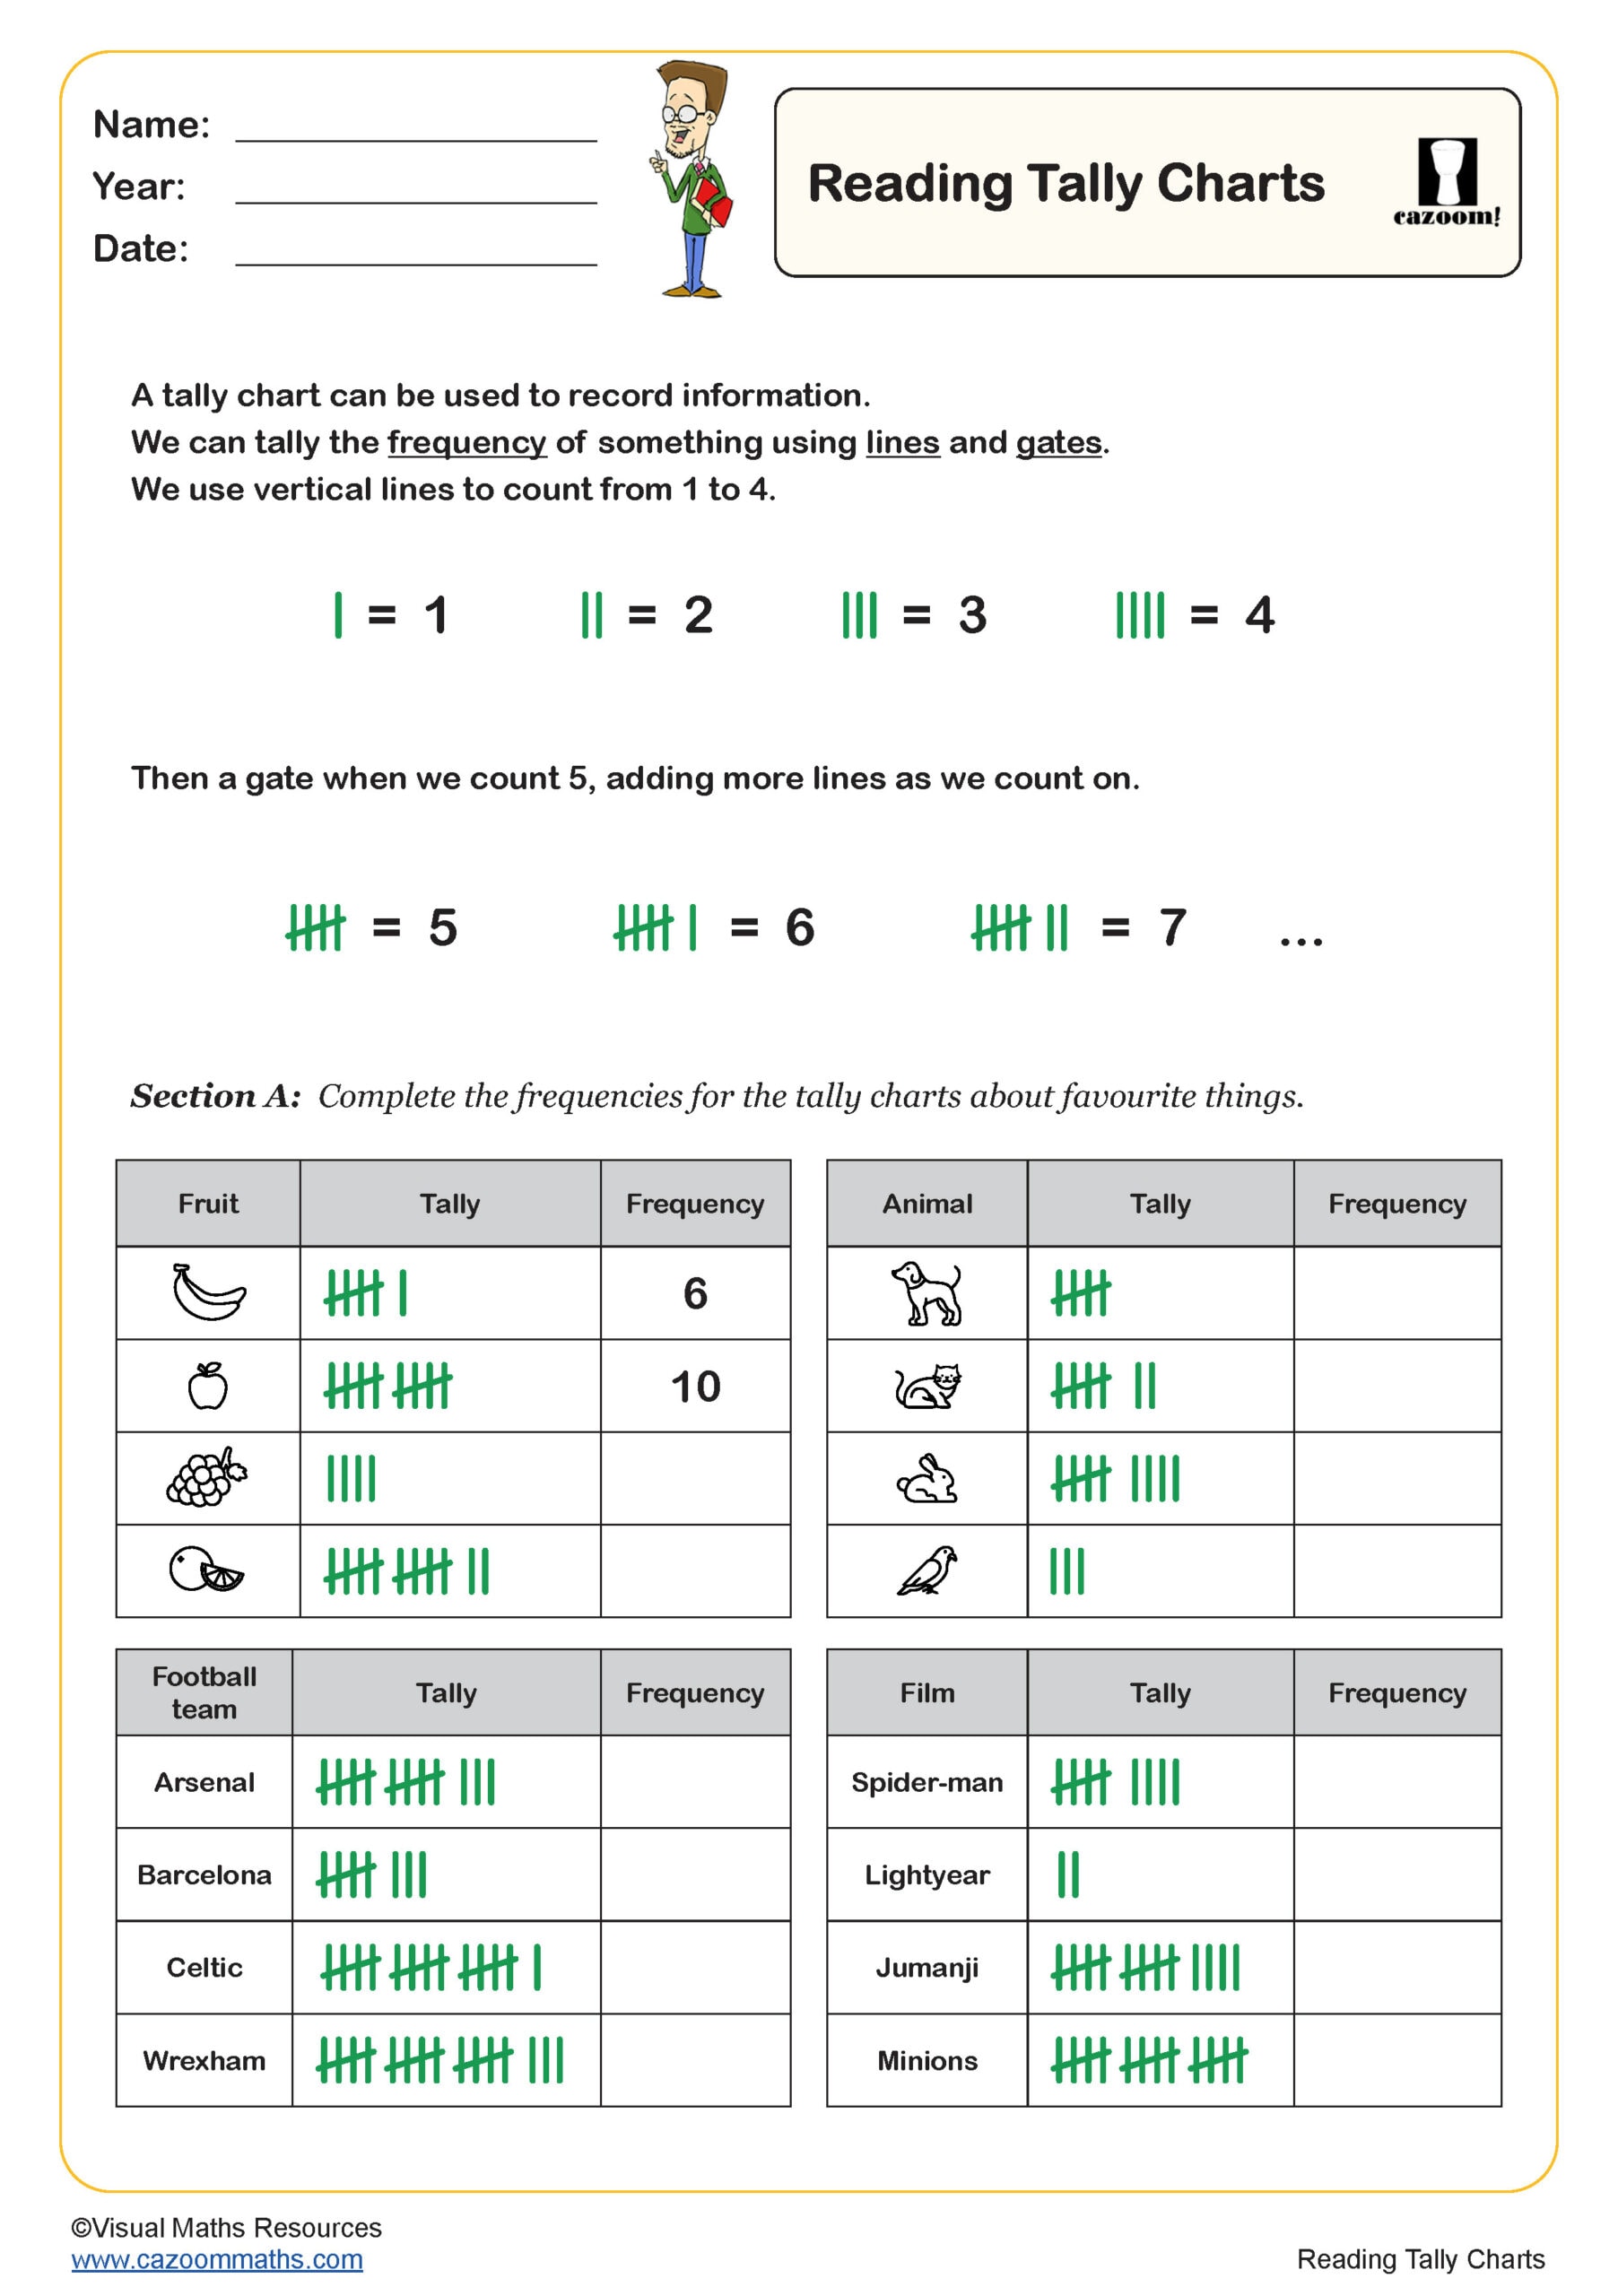
Reading Tally Charts
Year groups: 2
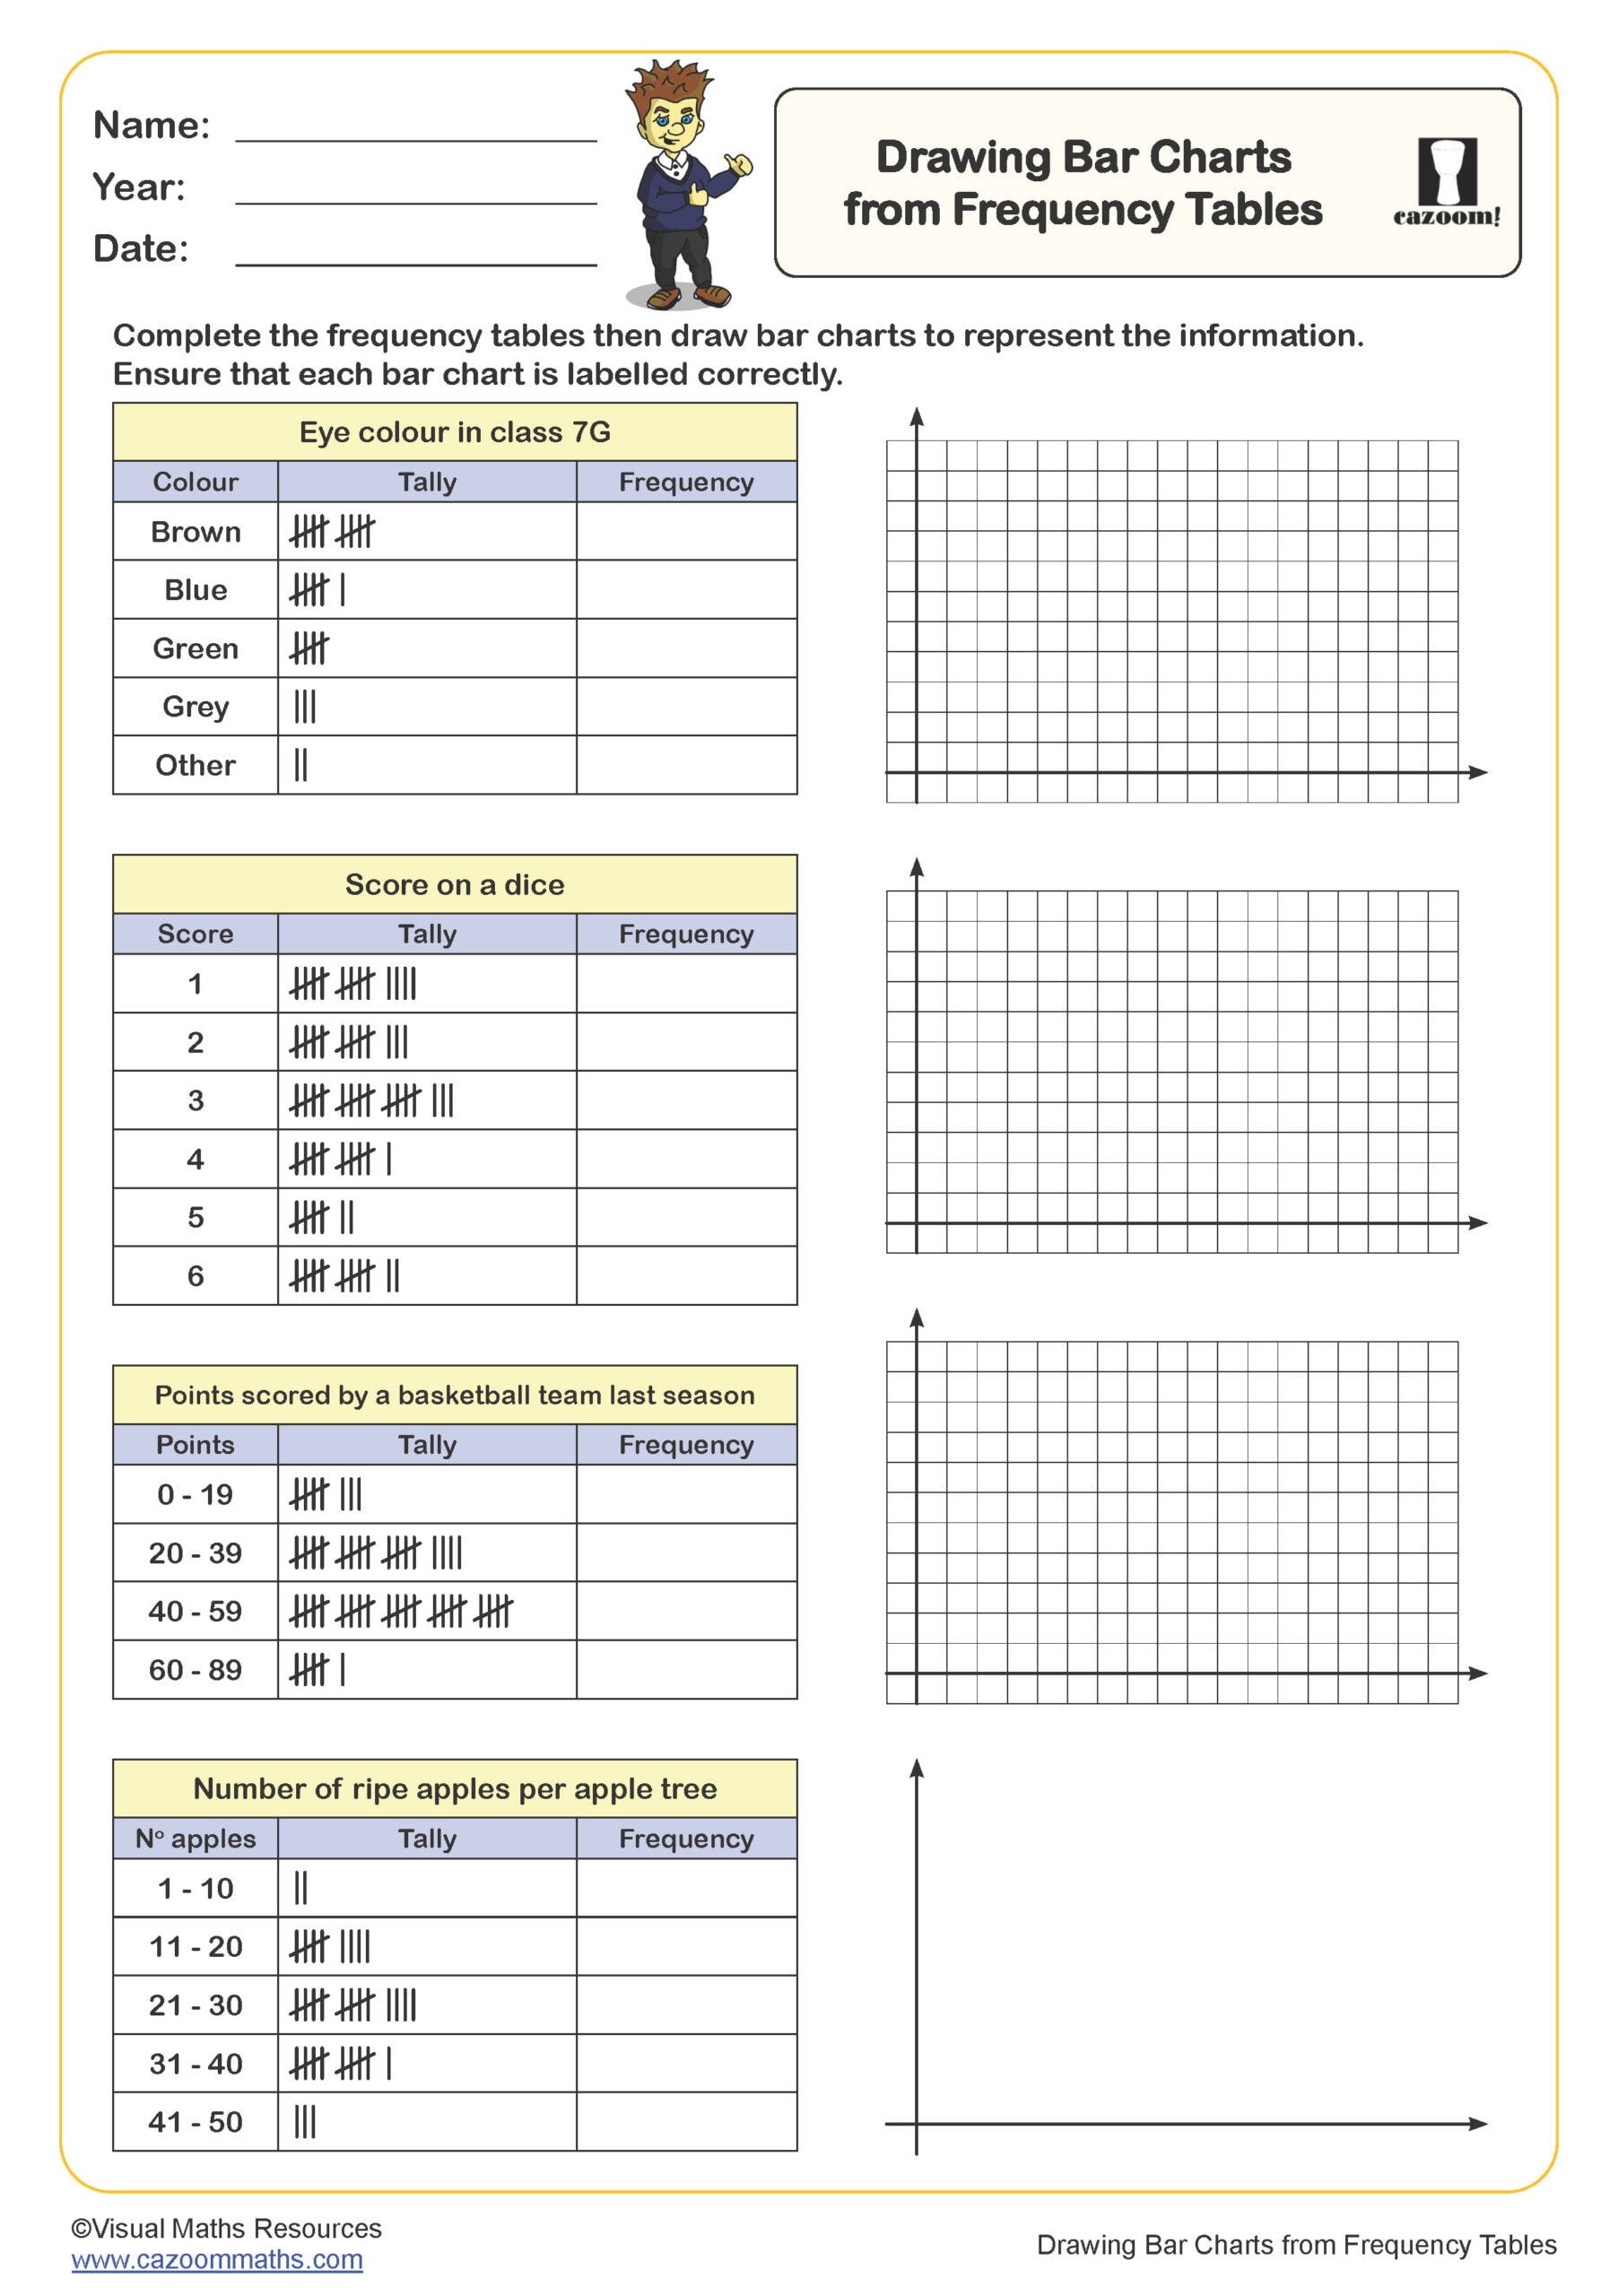
Drawing Bar Charts from Frequency Tables
Year groups: 3
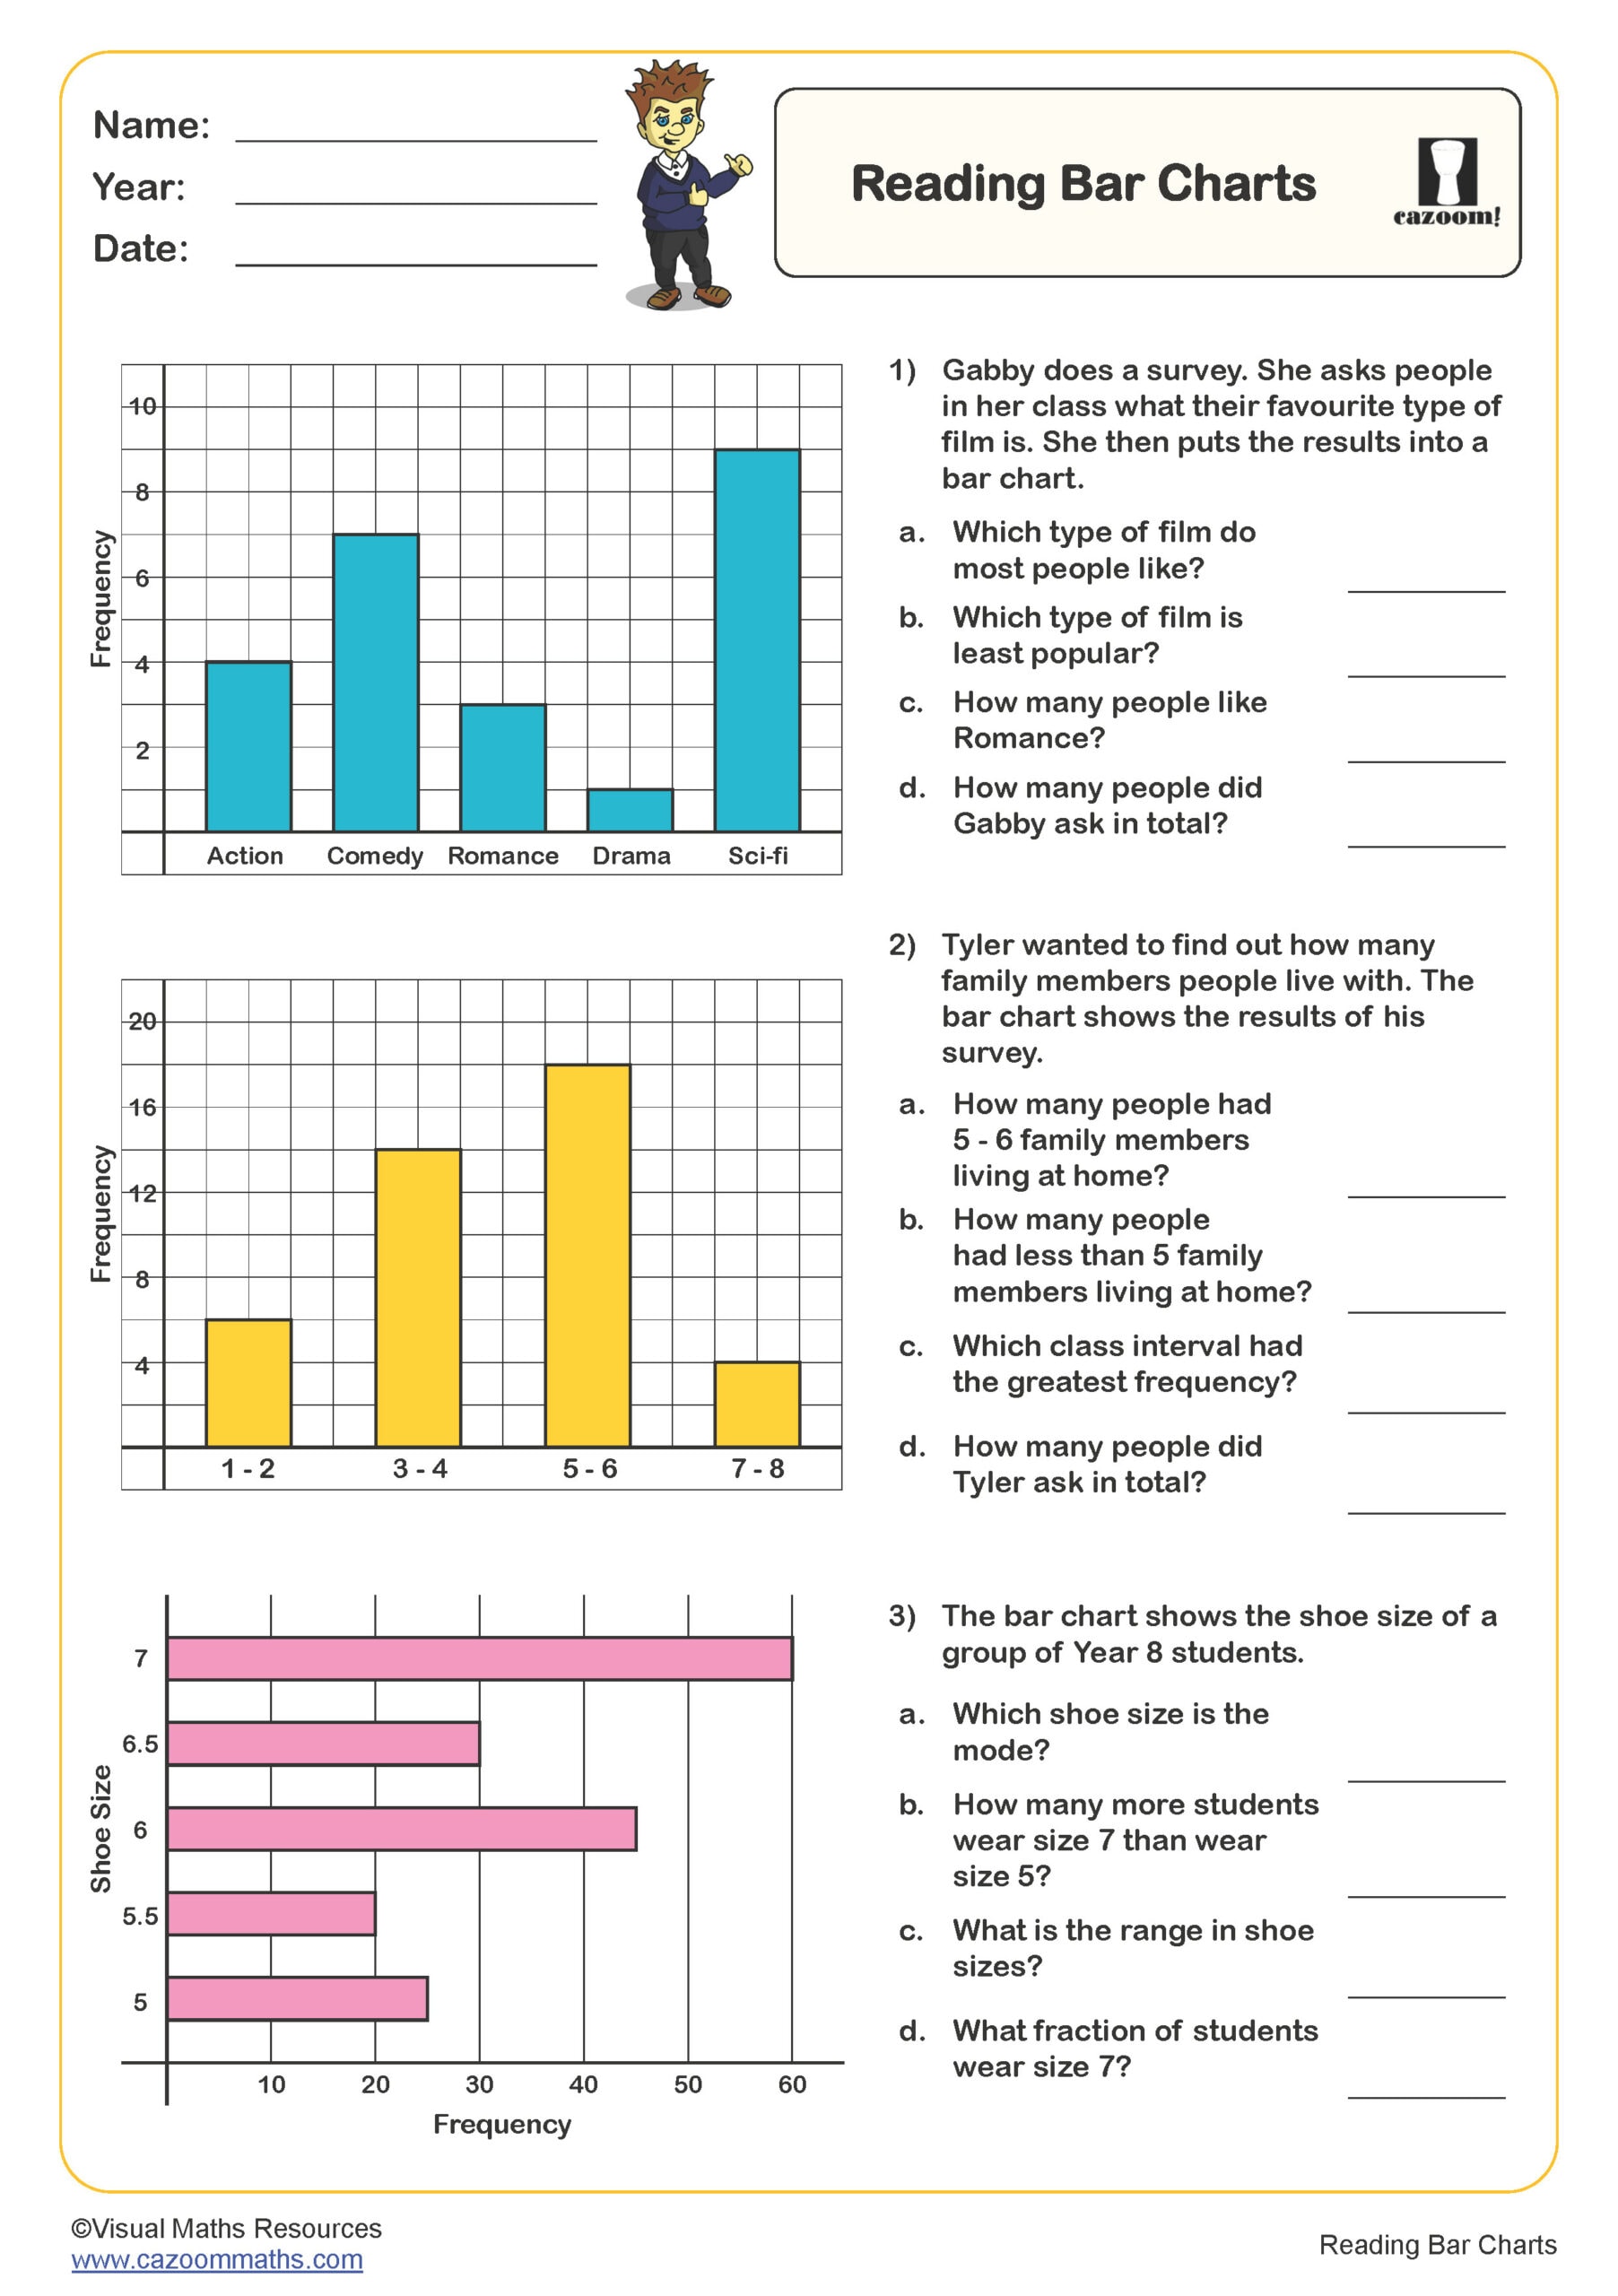
Reading Bar Charts (A)
Year groups: 3
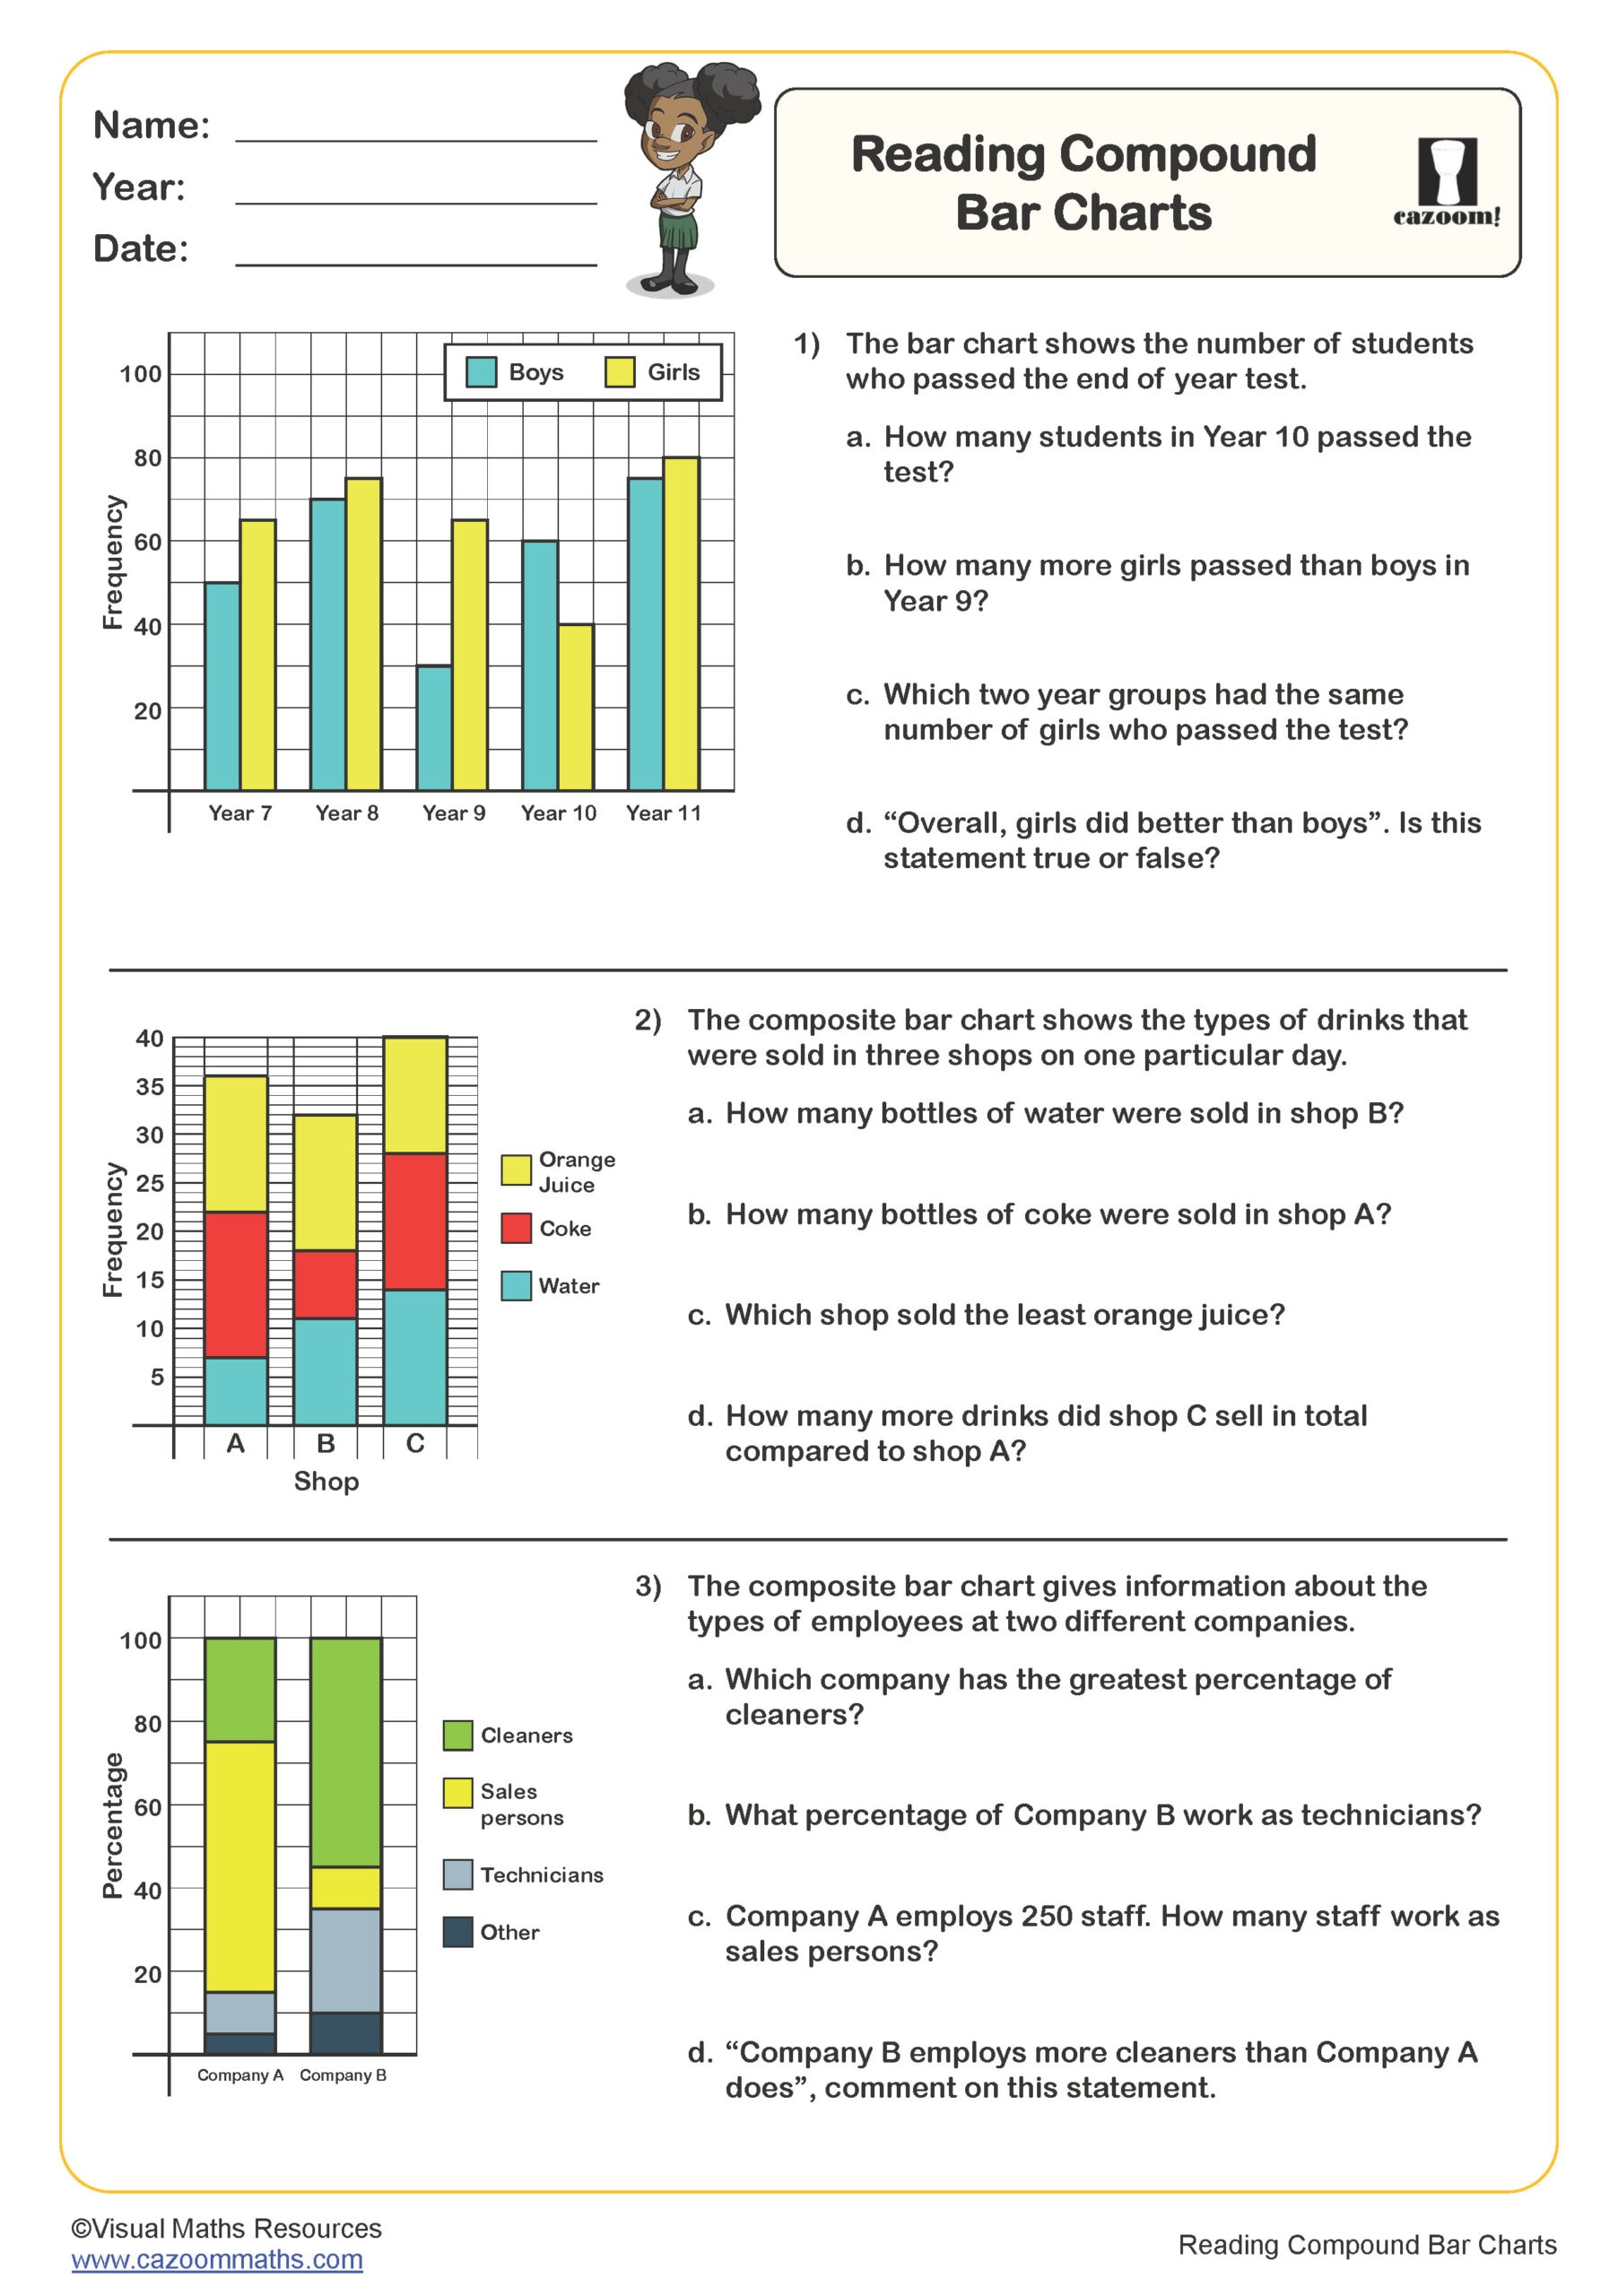
Reading Compound Bar Charts
Year groups: 4
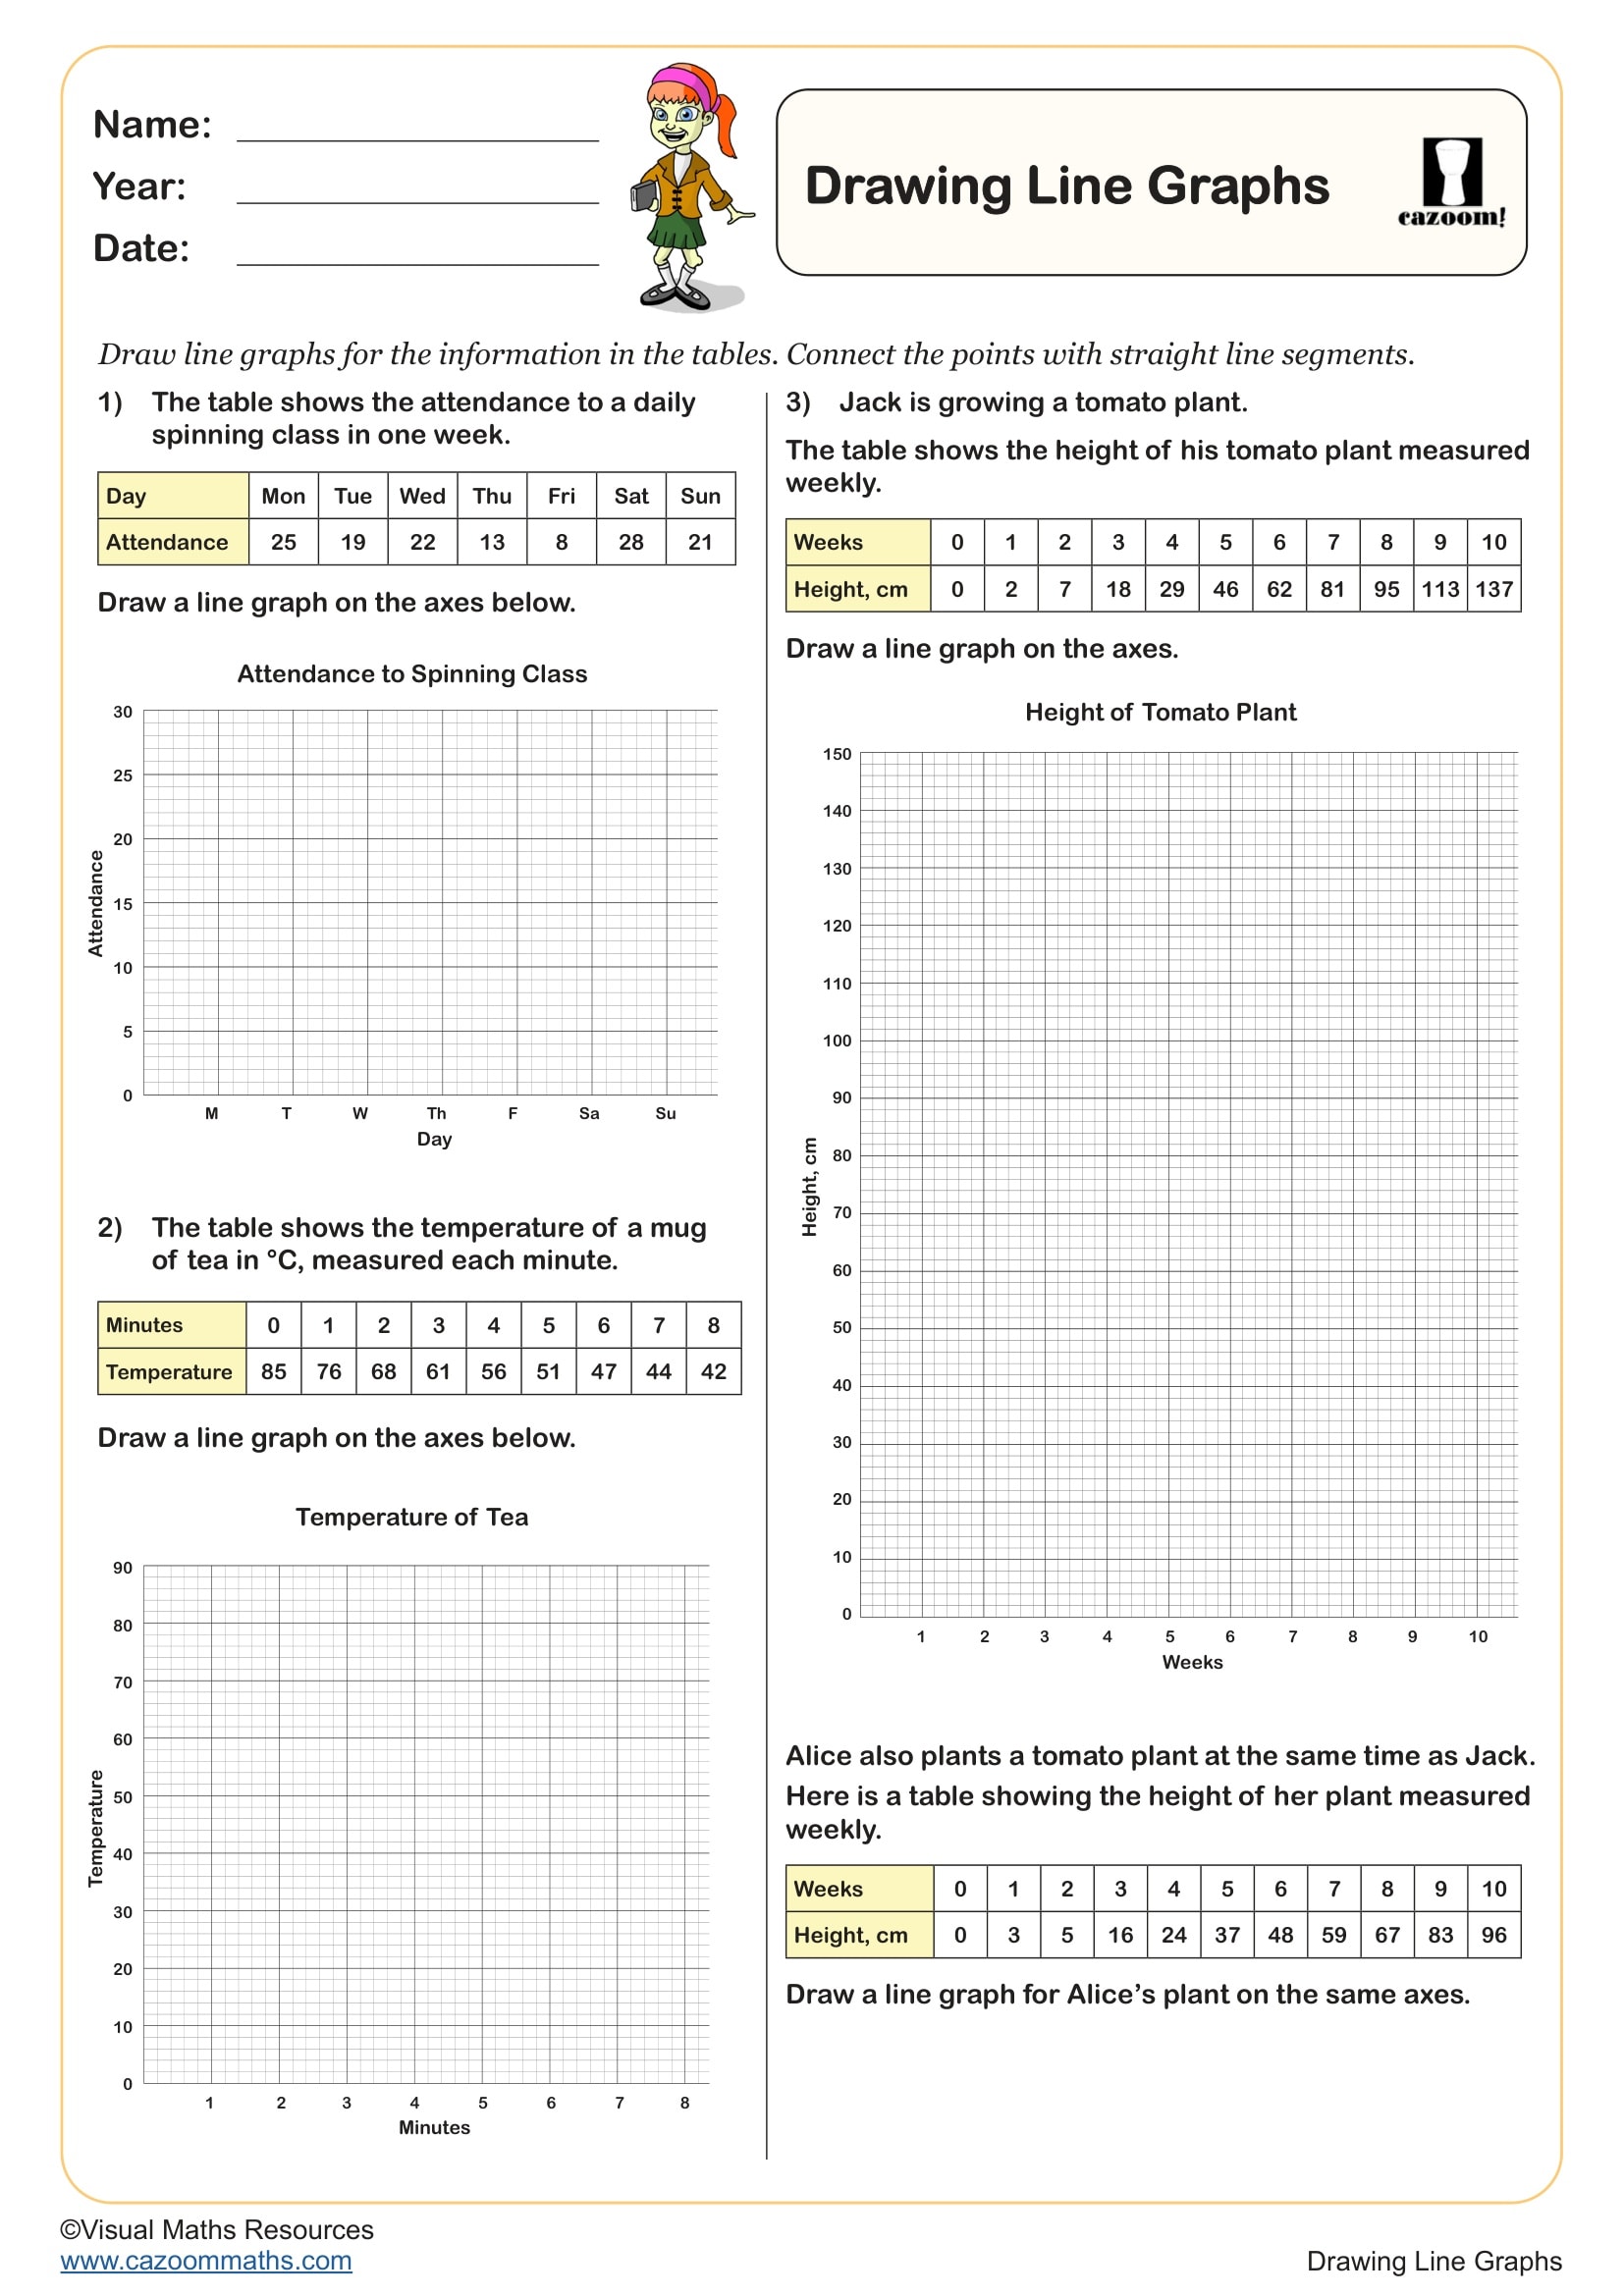
Drawing Line Graphs
Year groups: 5
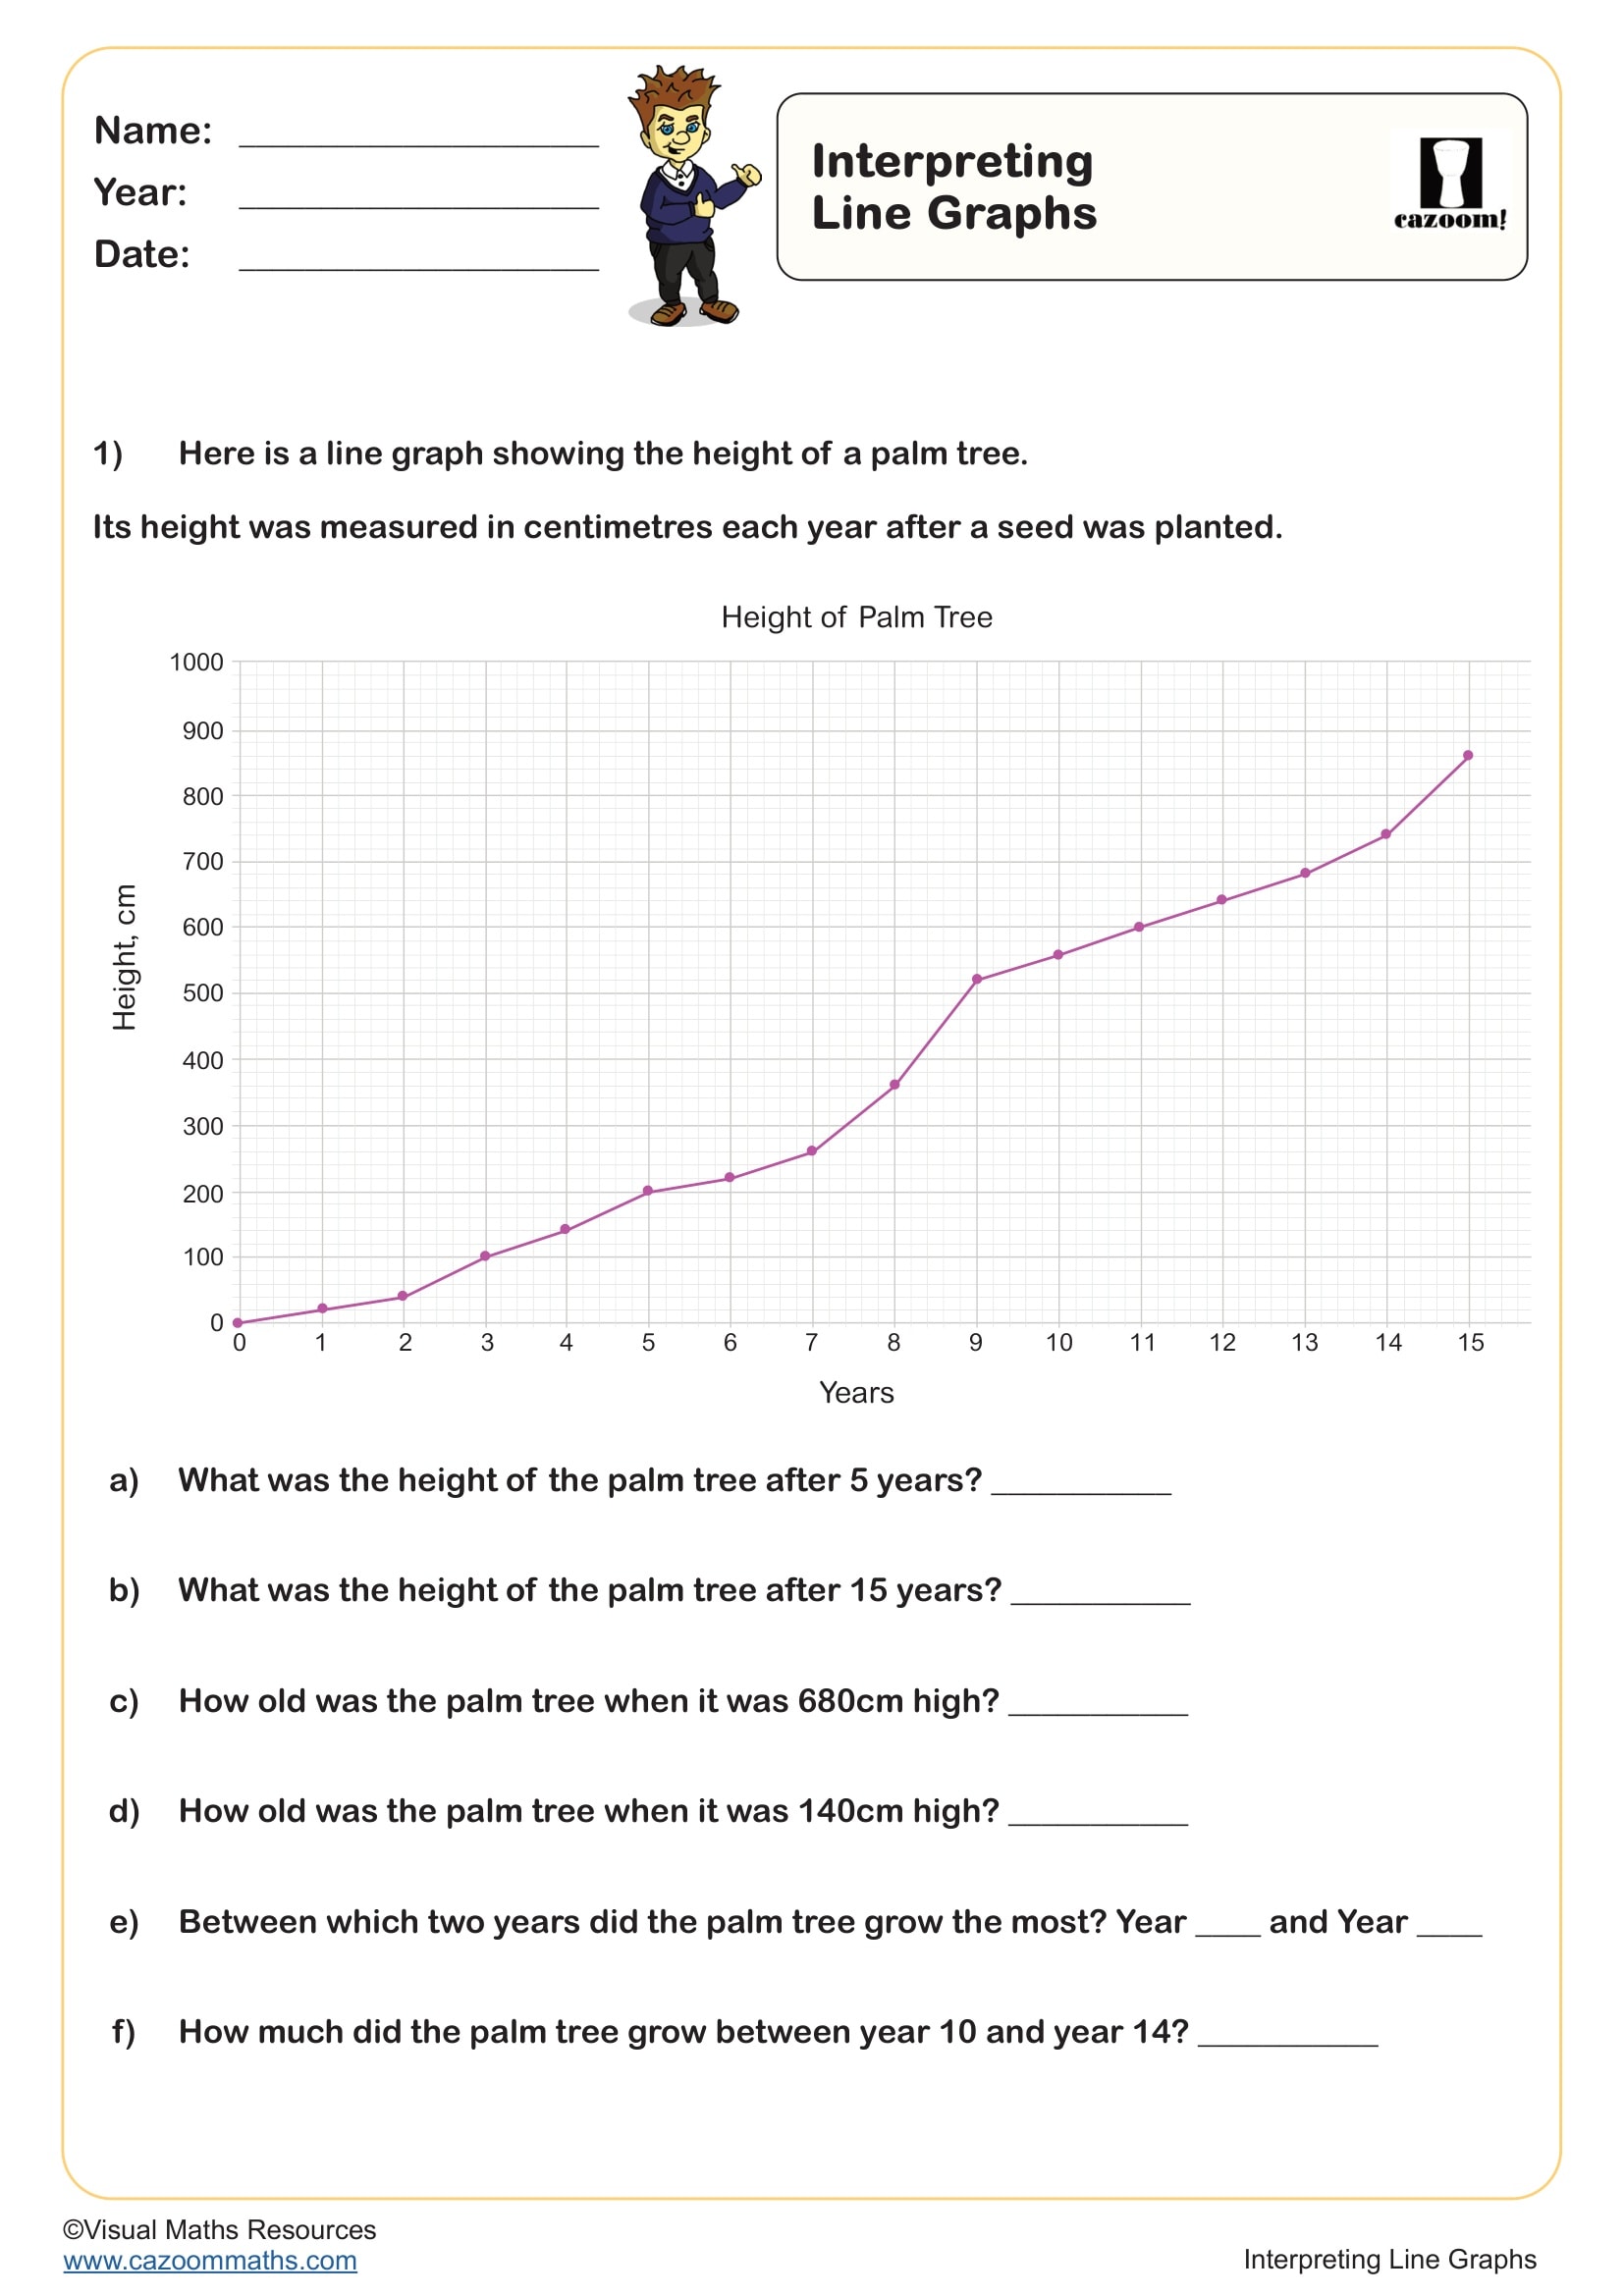
Interpreting Line Graphs
Year groups: 5
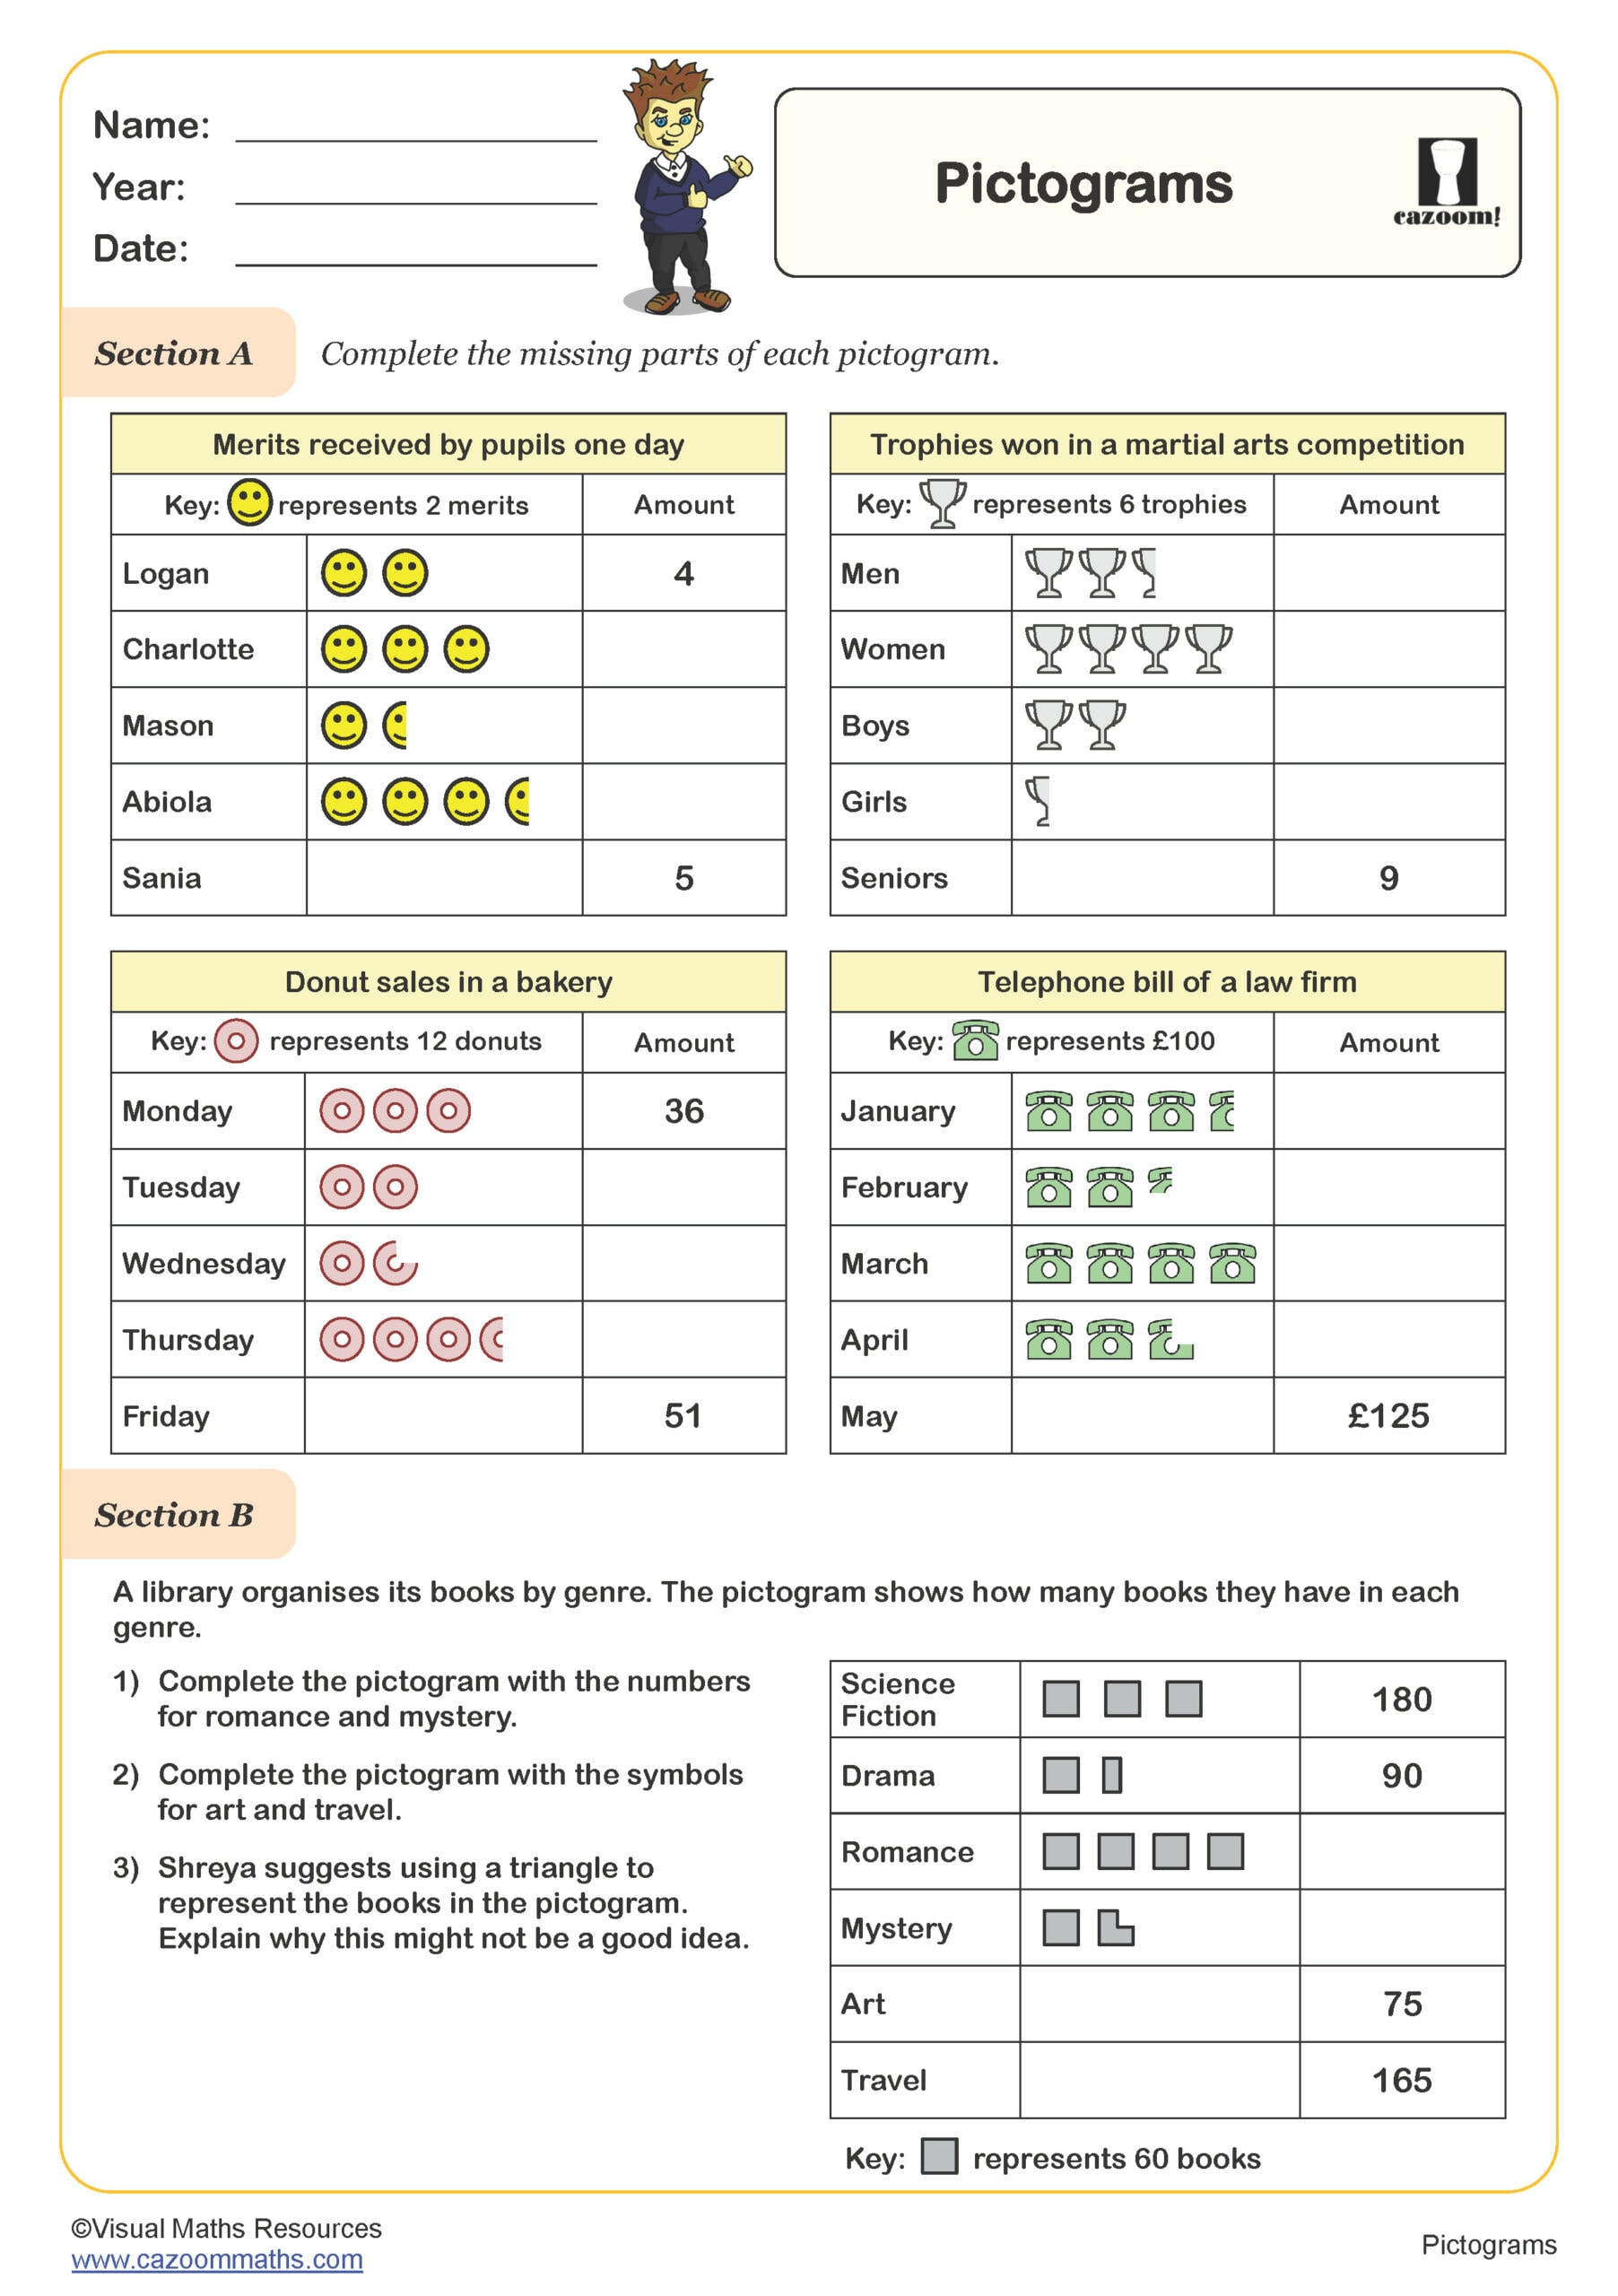
Pictograms
Year groups: 5, 6
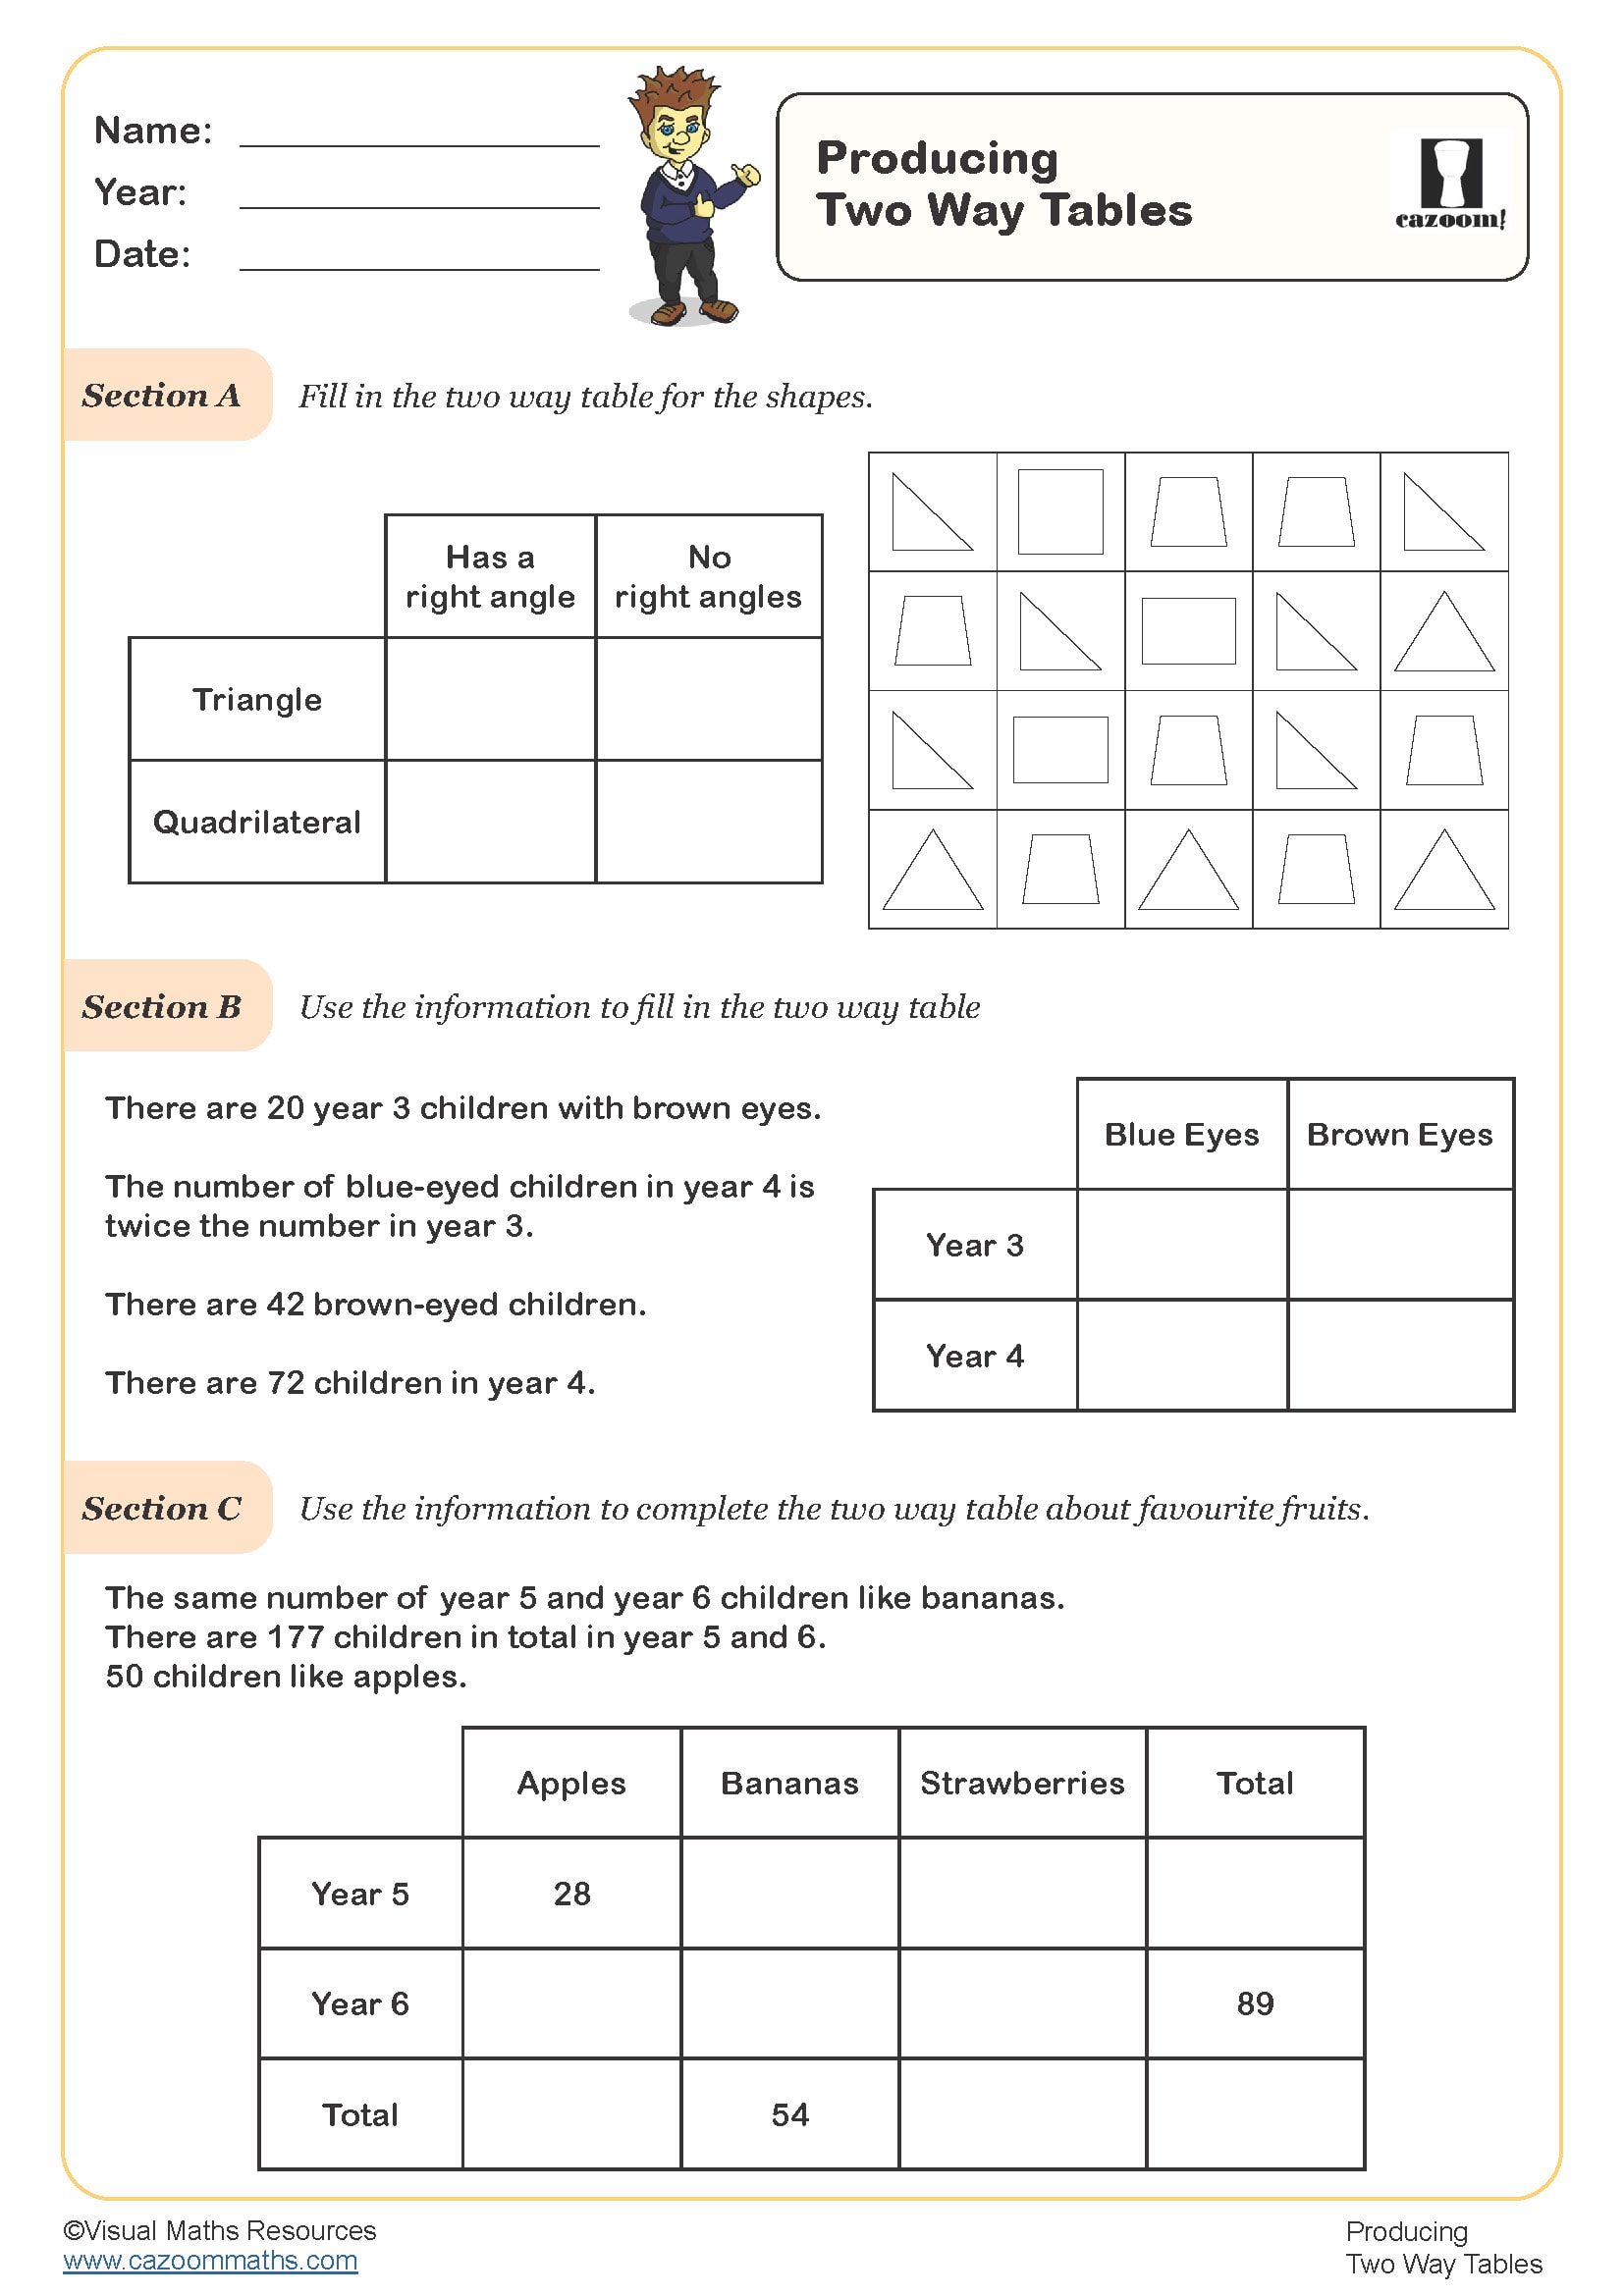
Producing Two Way Tables
Year groups: 5
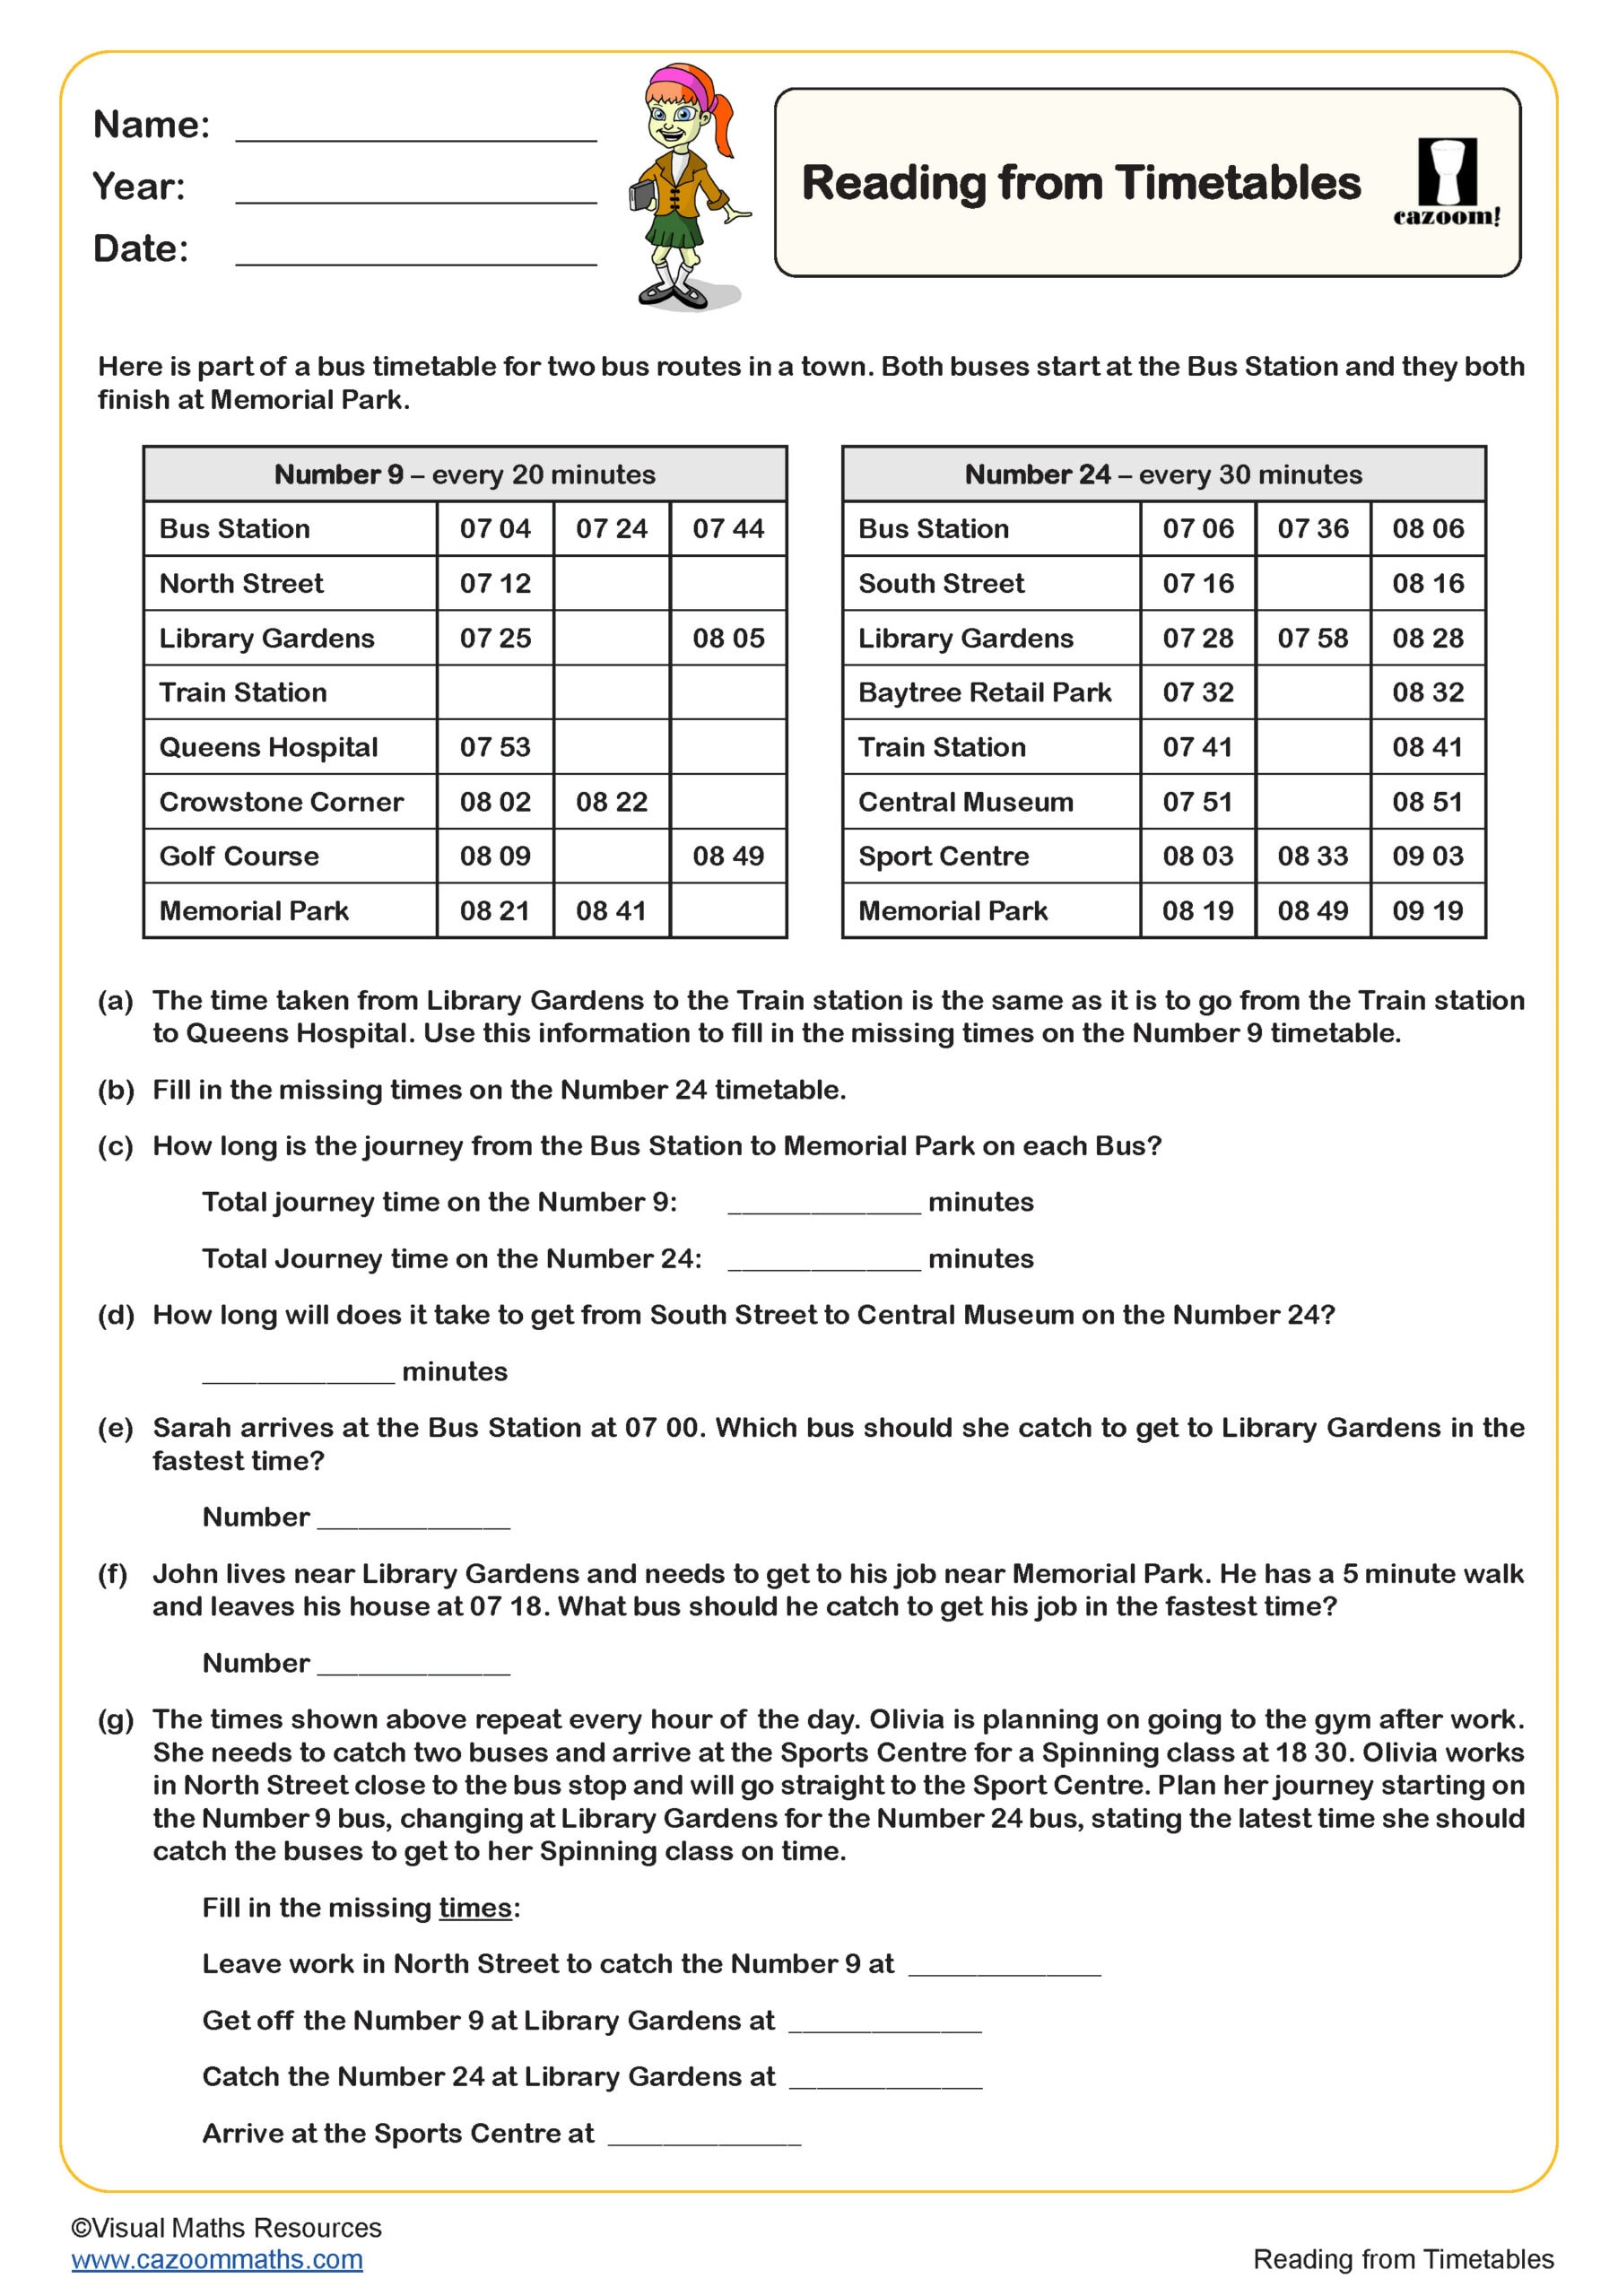
Reading from Time Tables
Year groups: 5
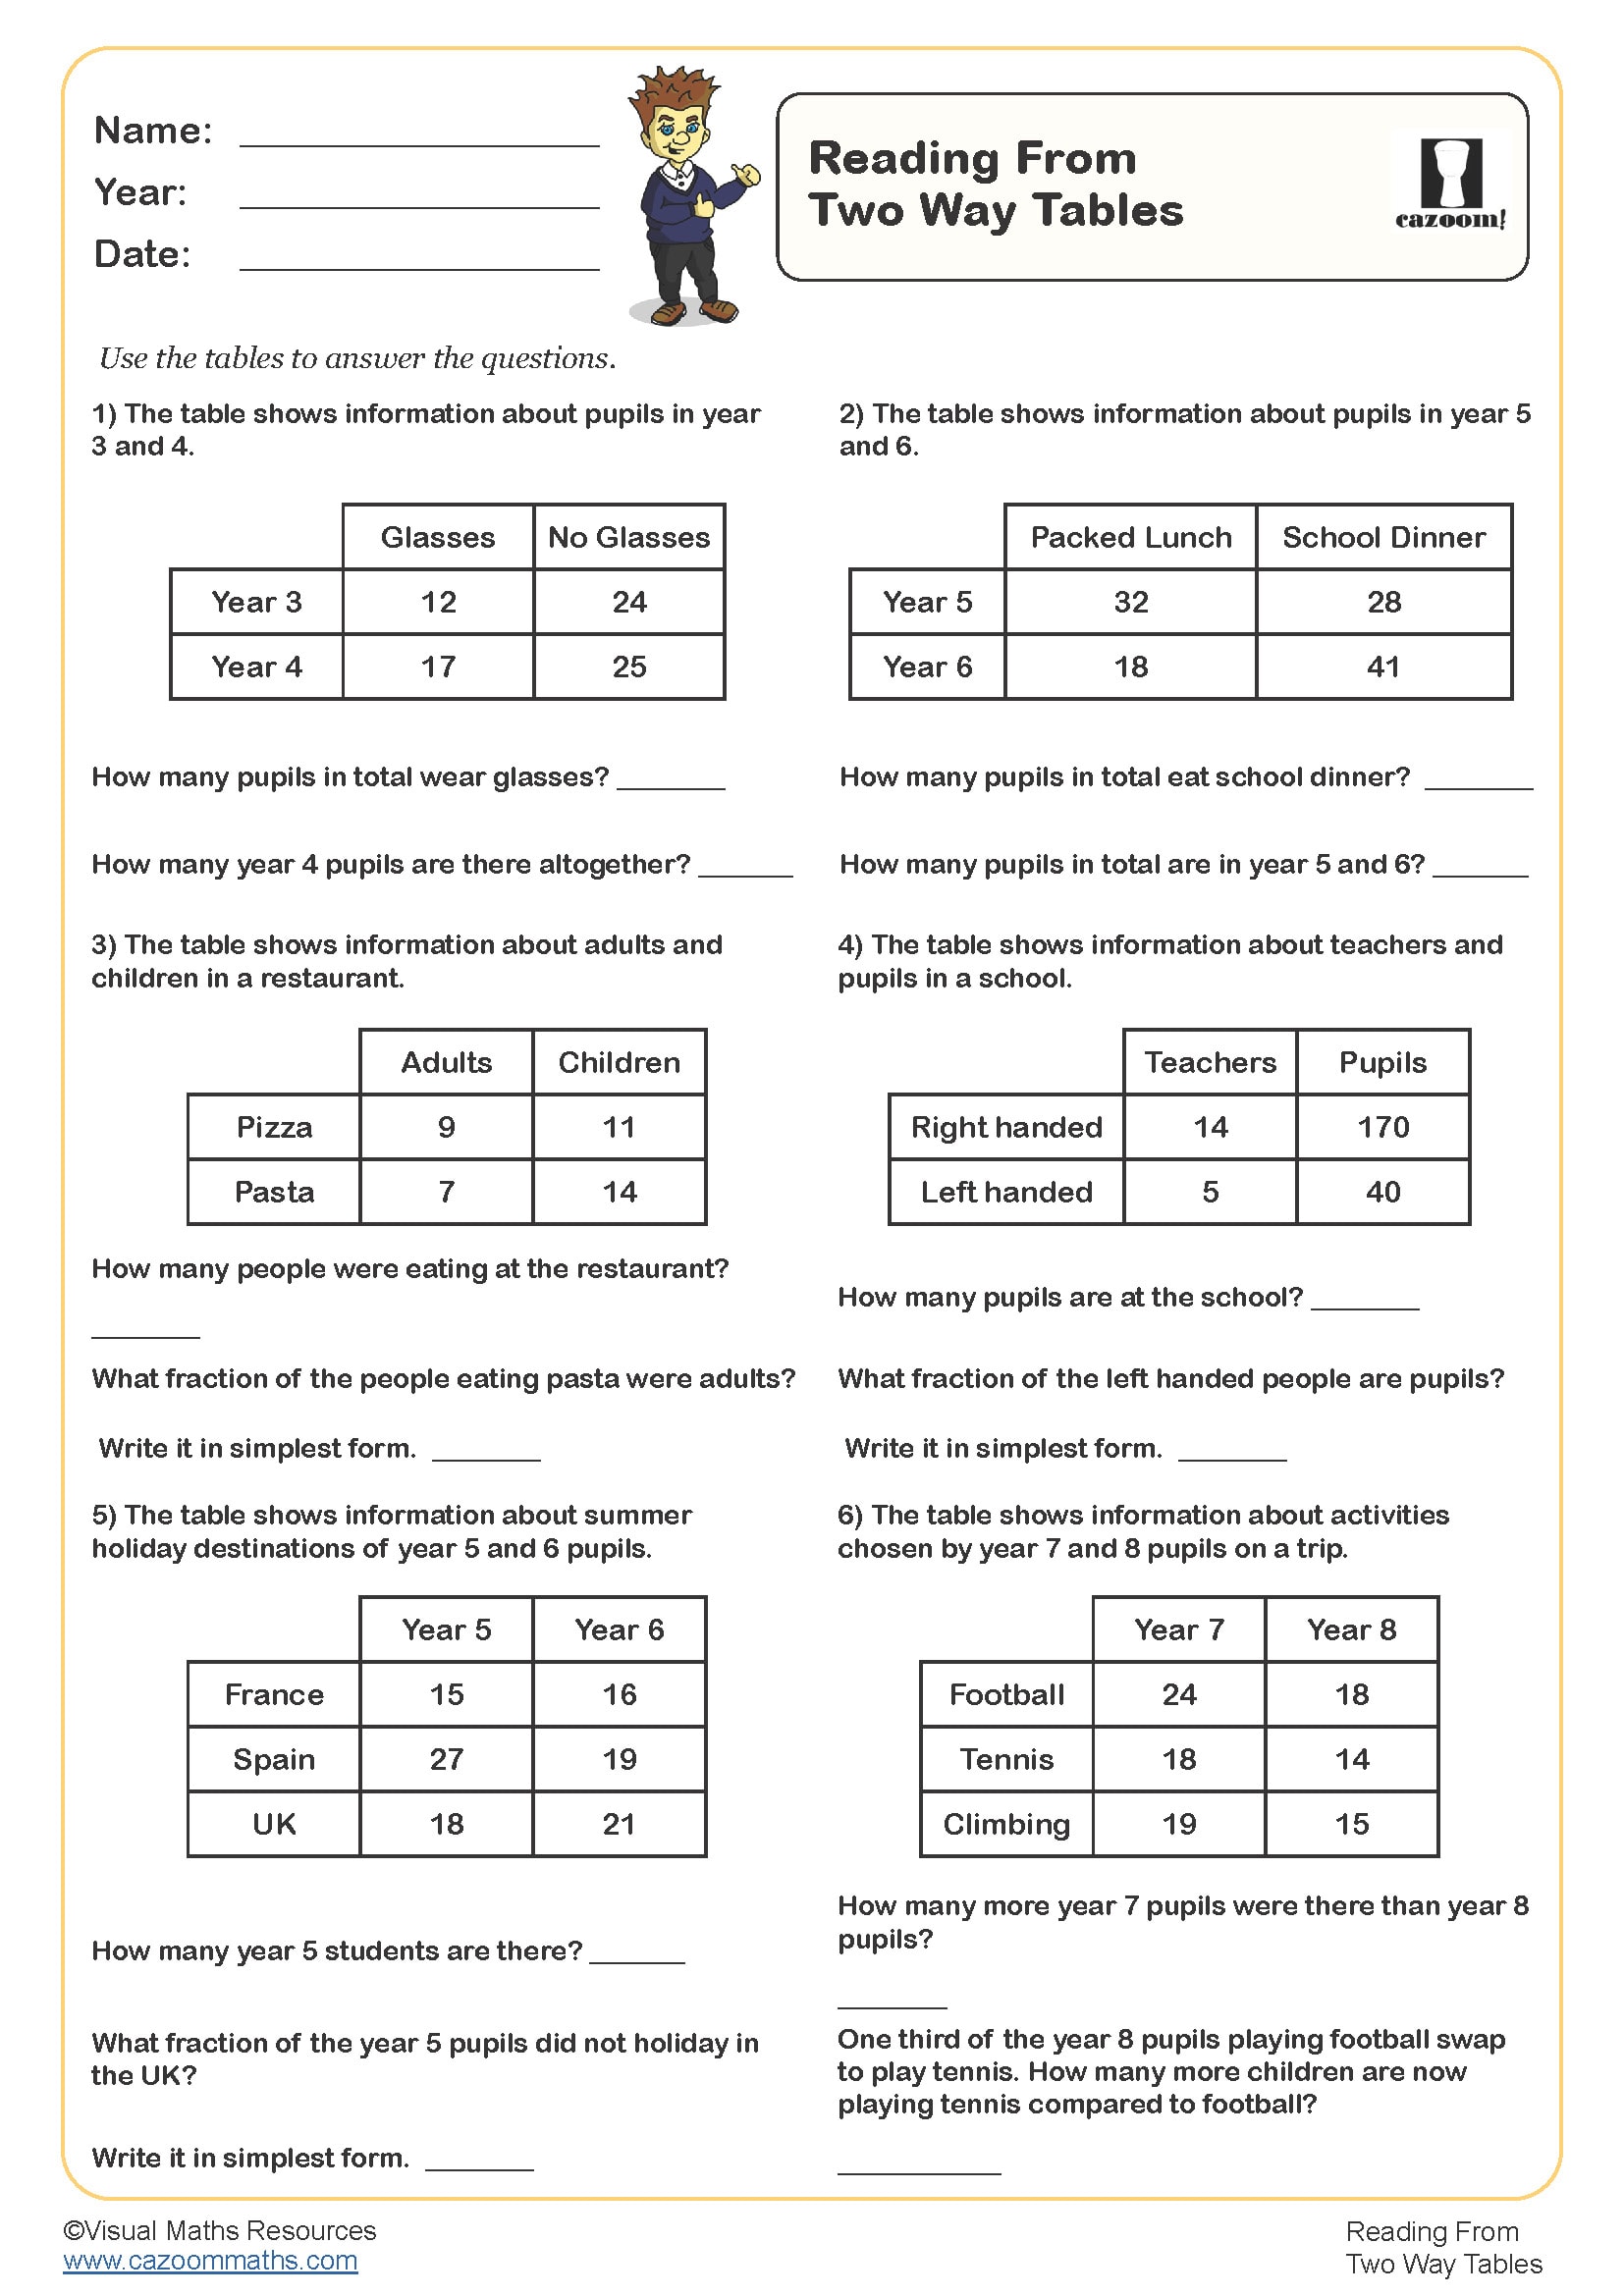
Reading from Two Way Tables
Year groups: 5
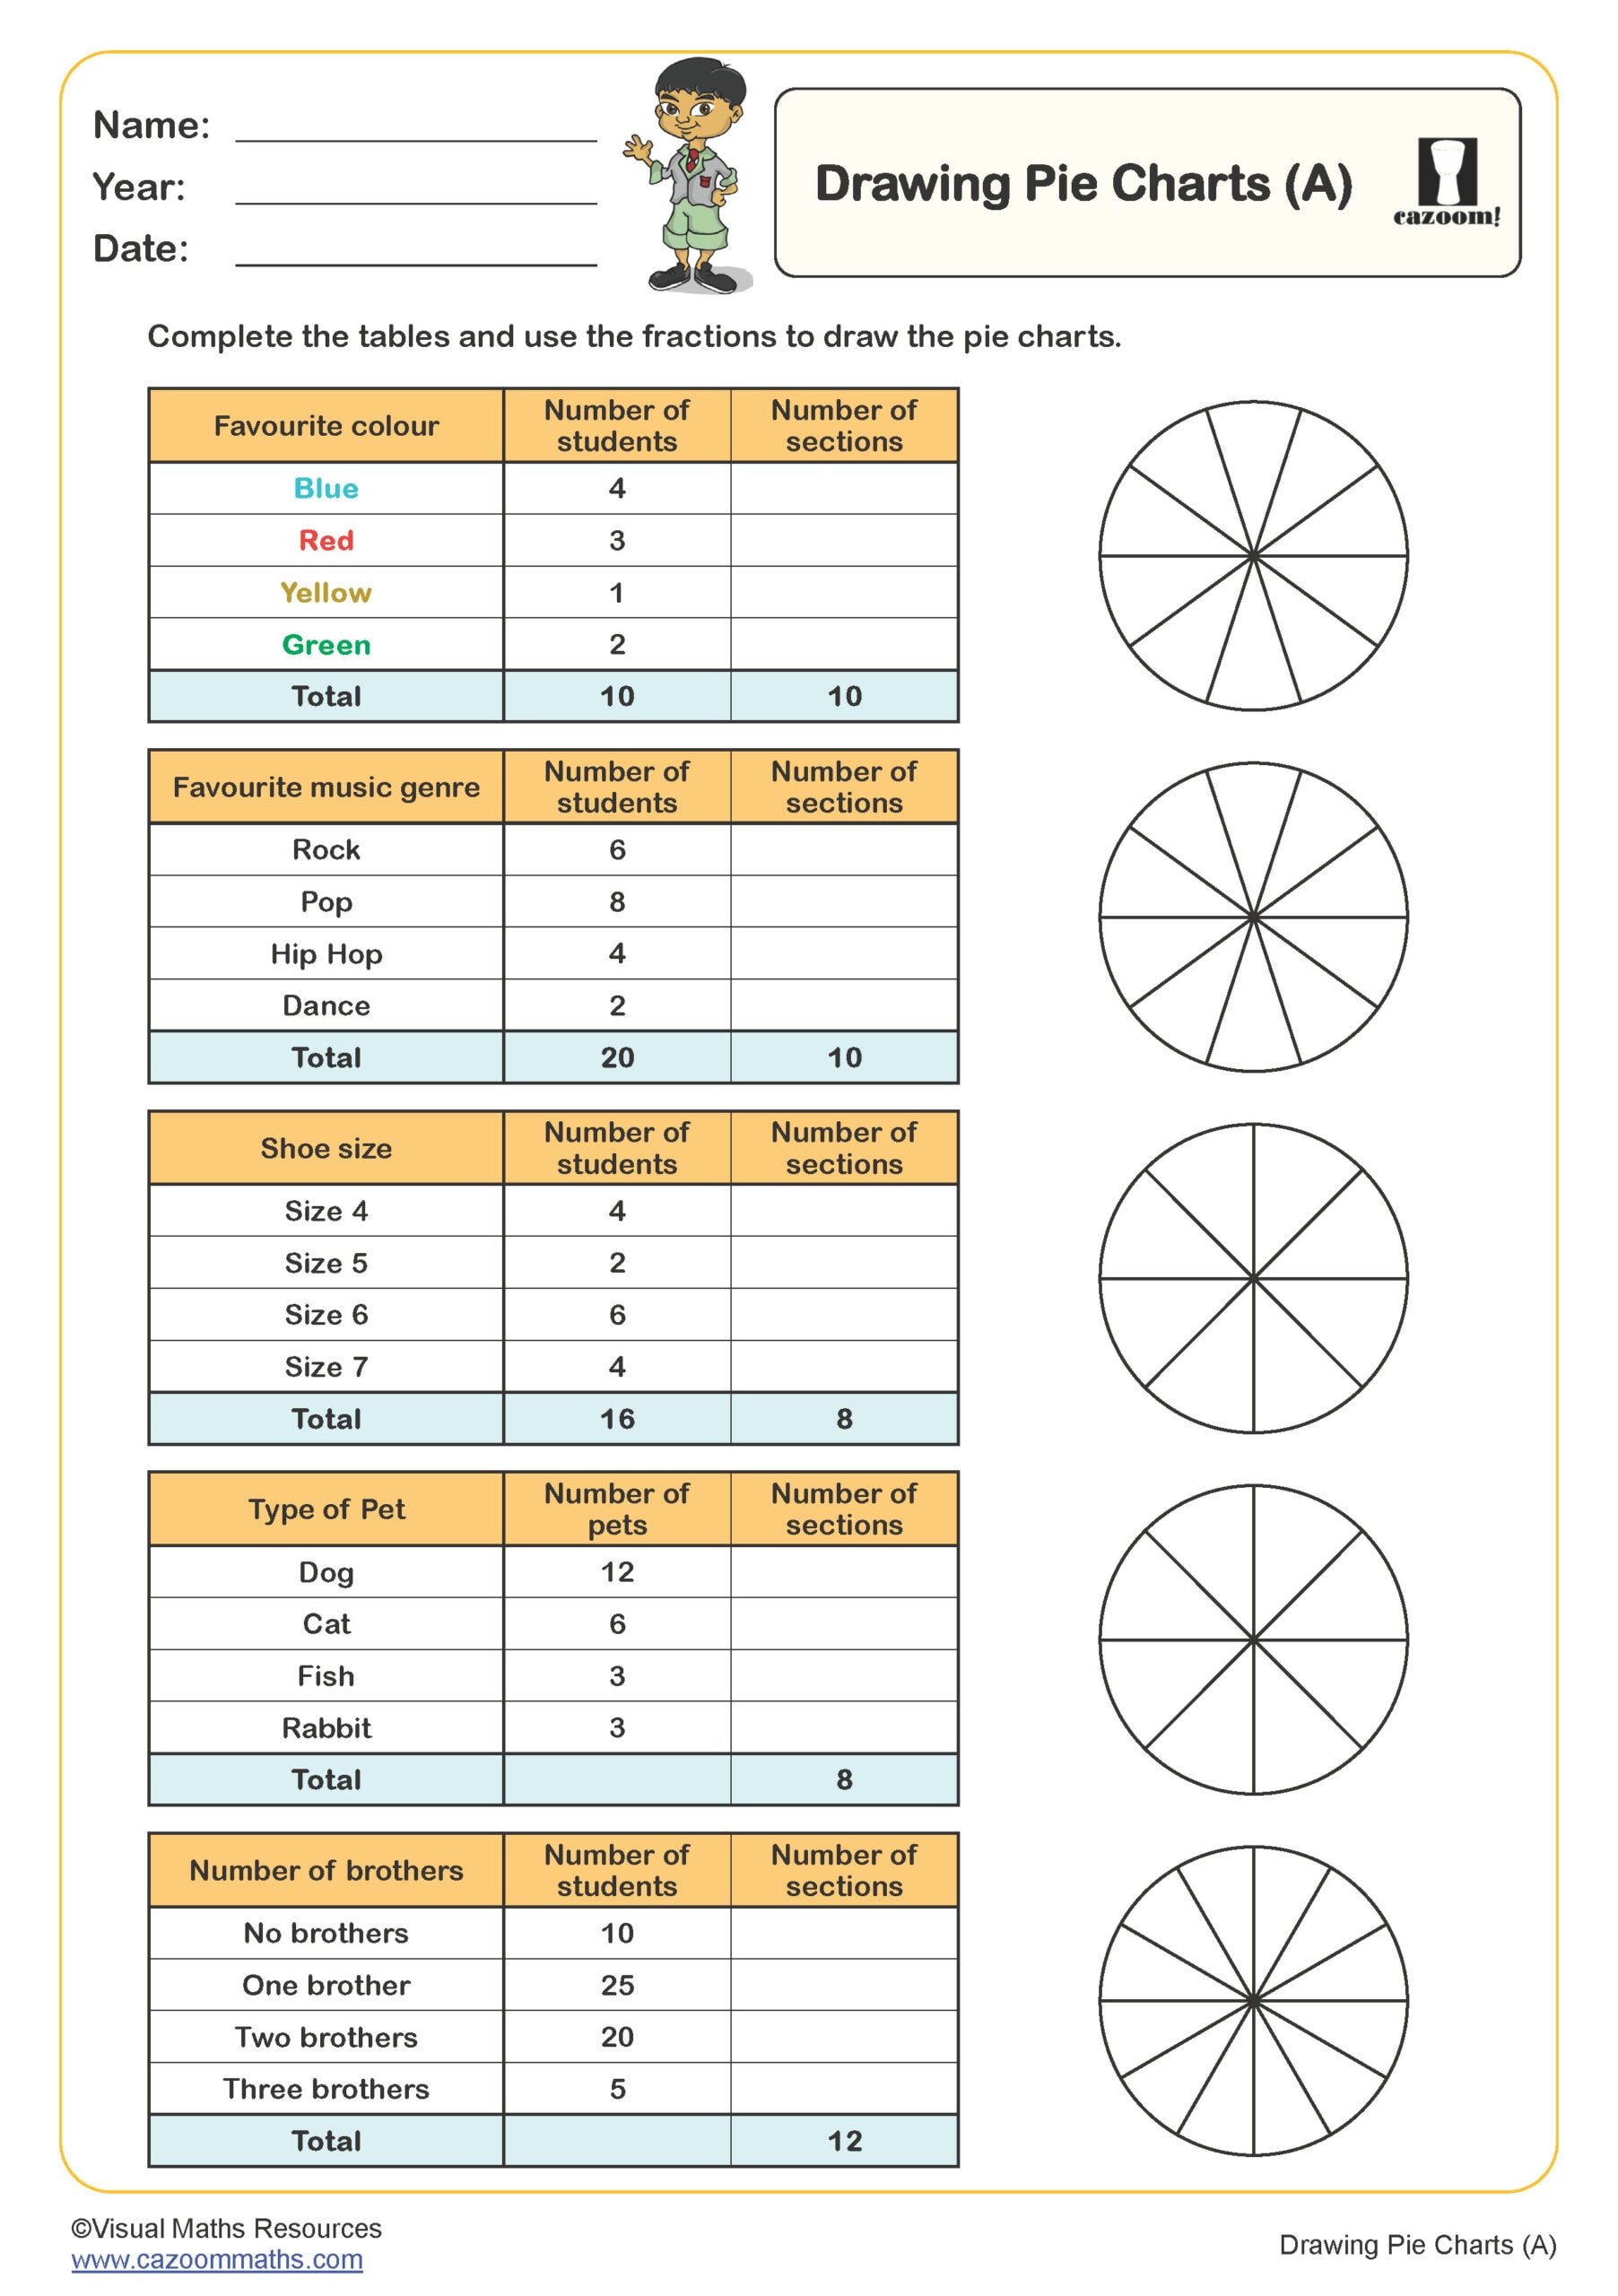
Drawing Pie Charts (A)
Year groups: 6
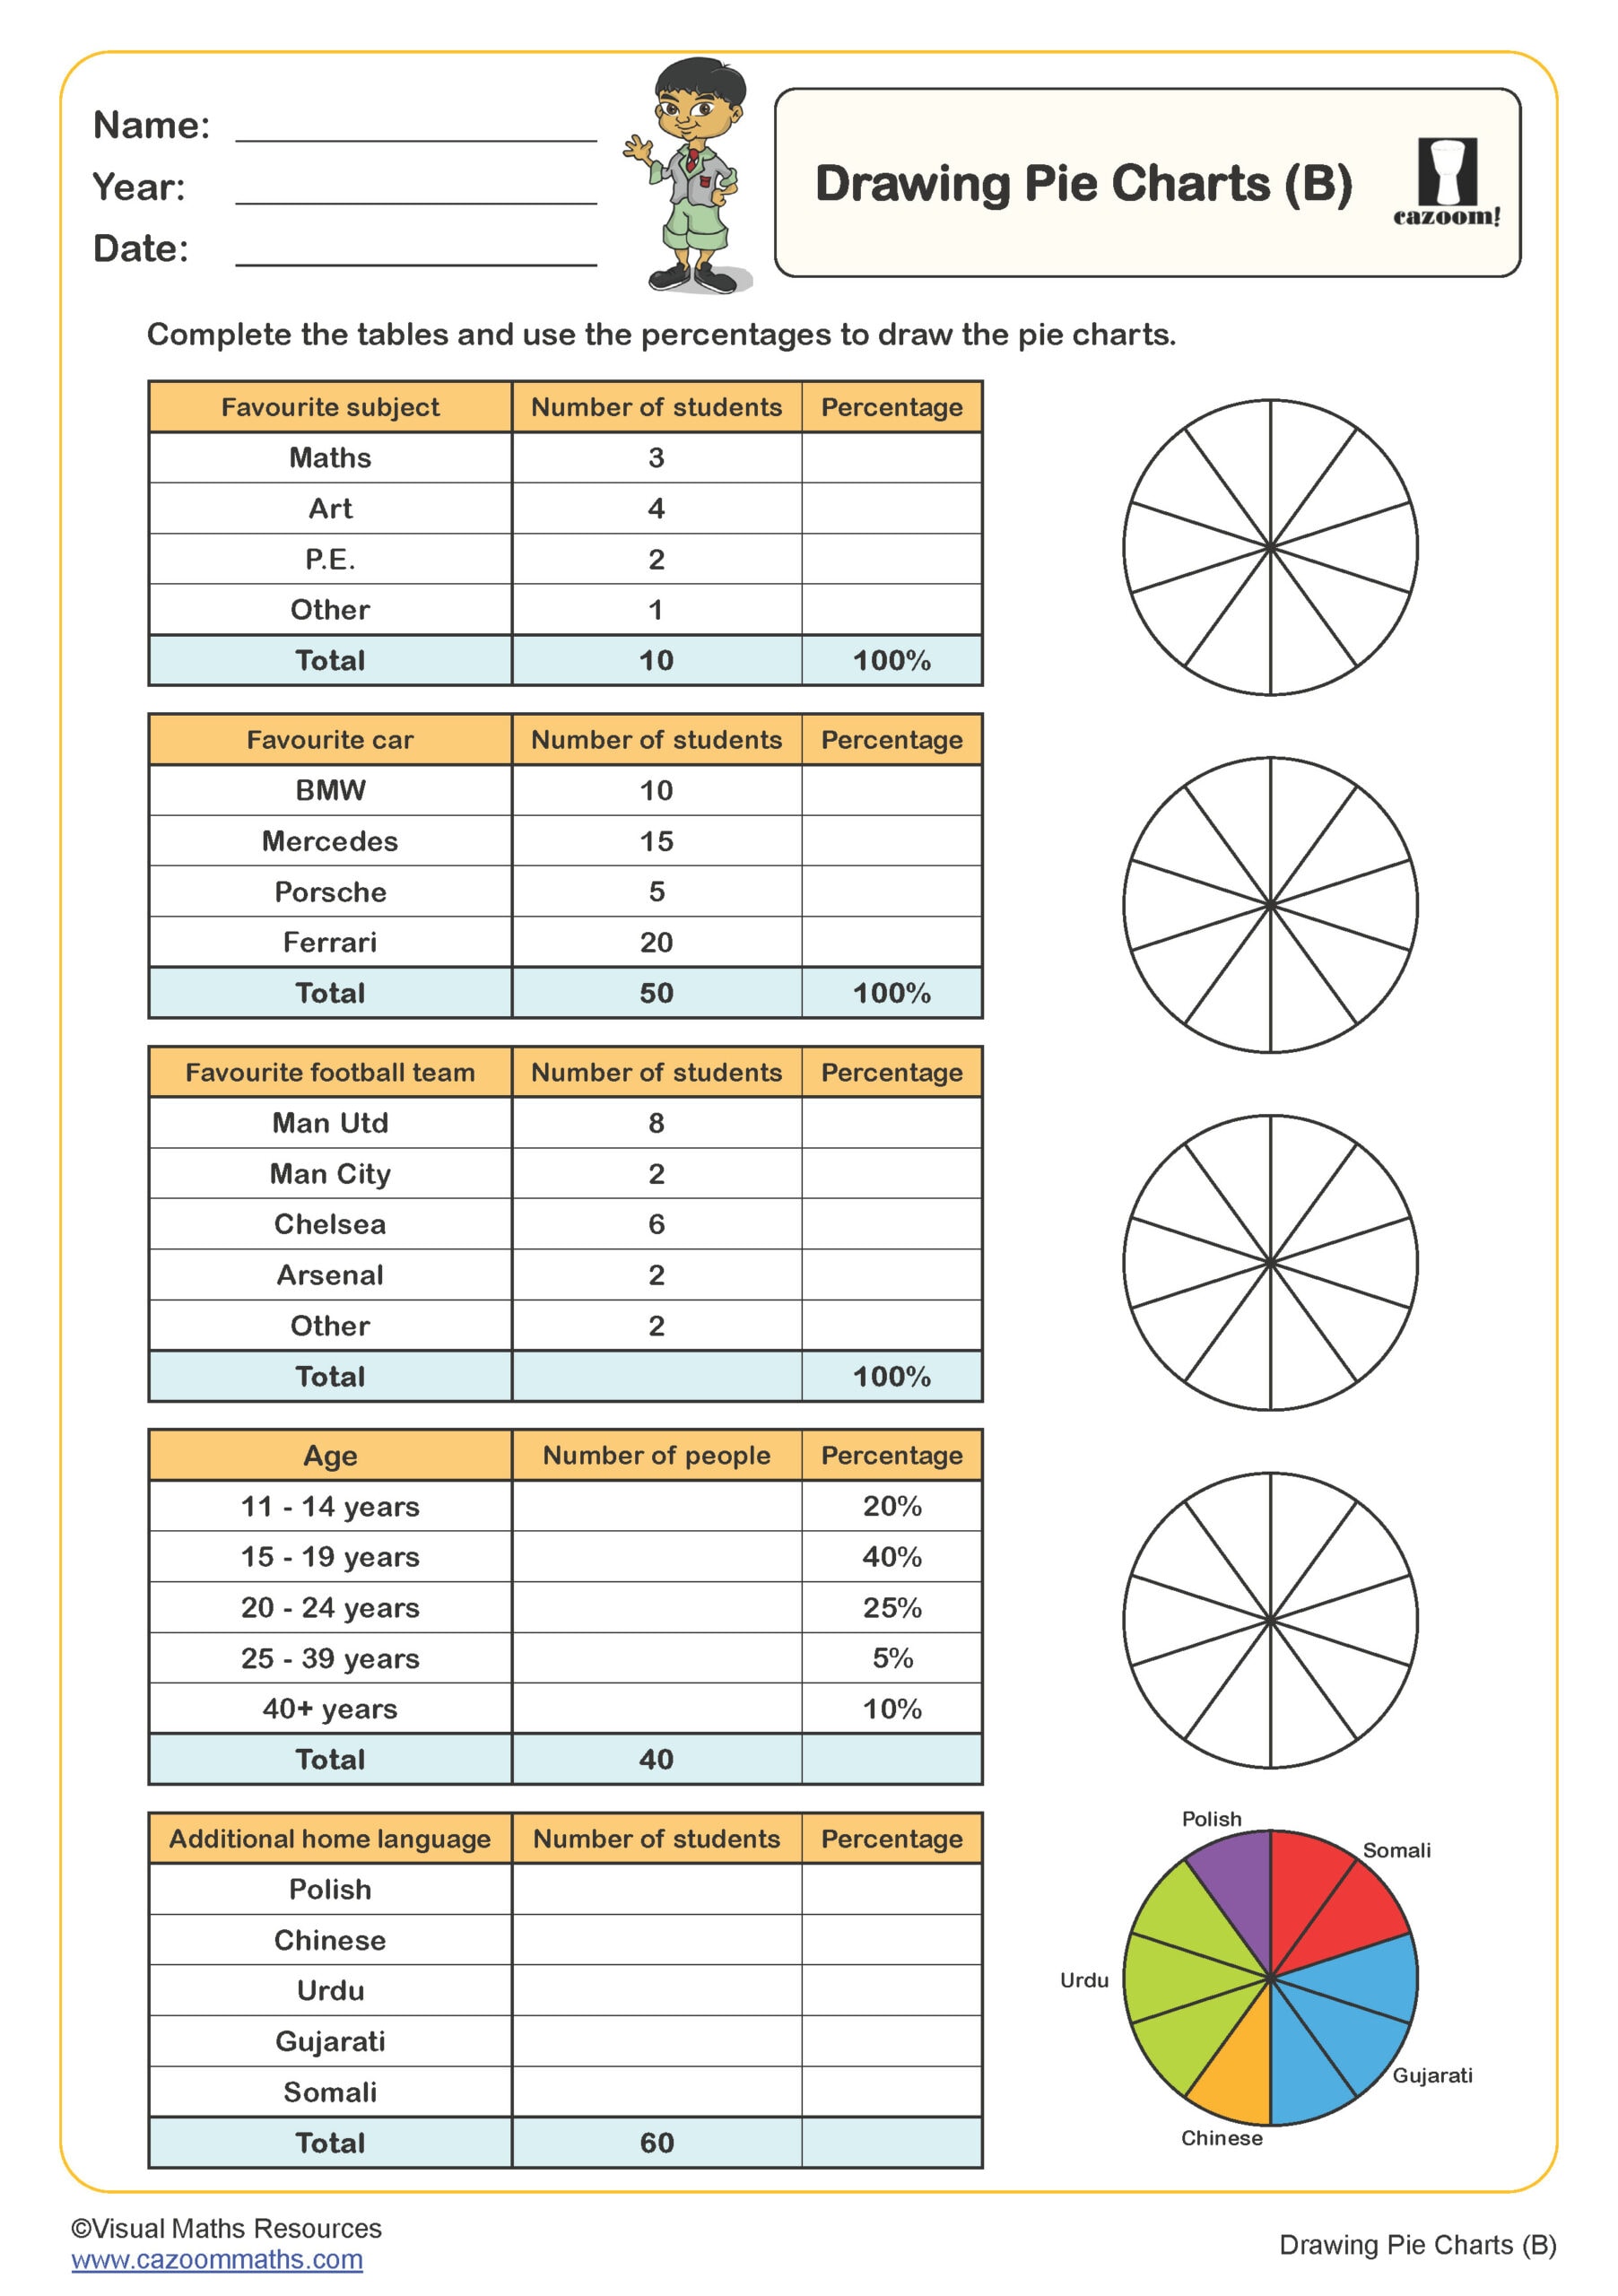
Drawing Pie Charts (B)
Year groups: 6
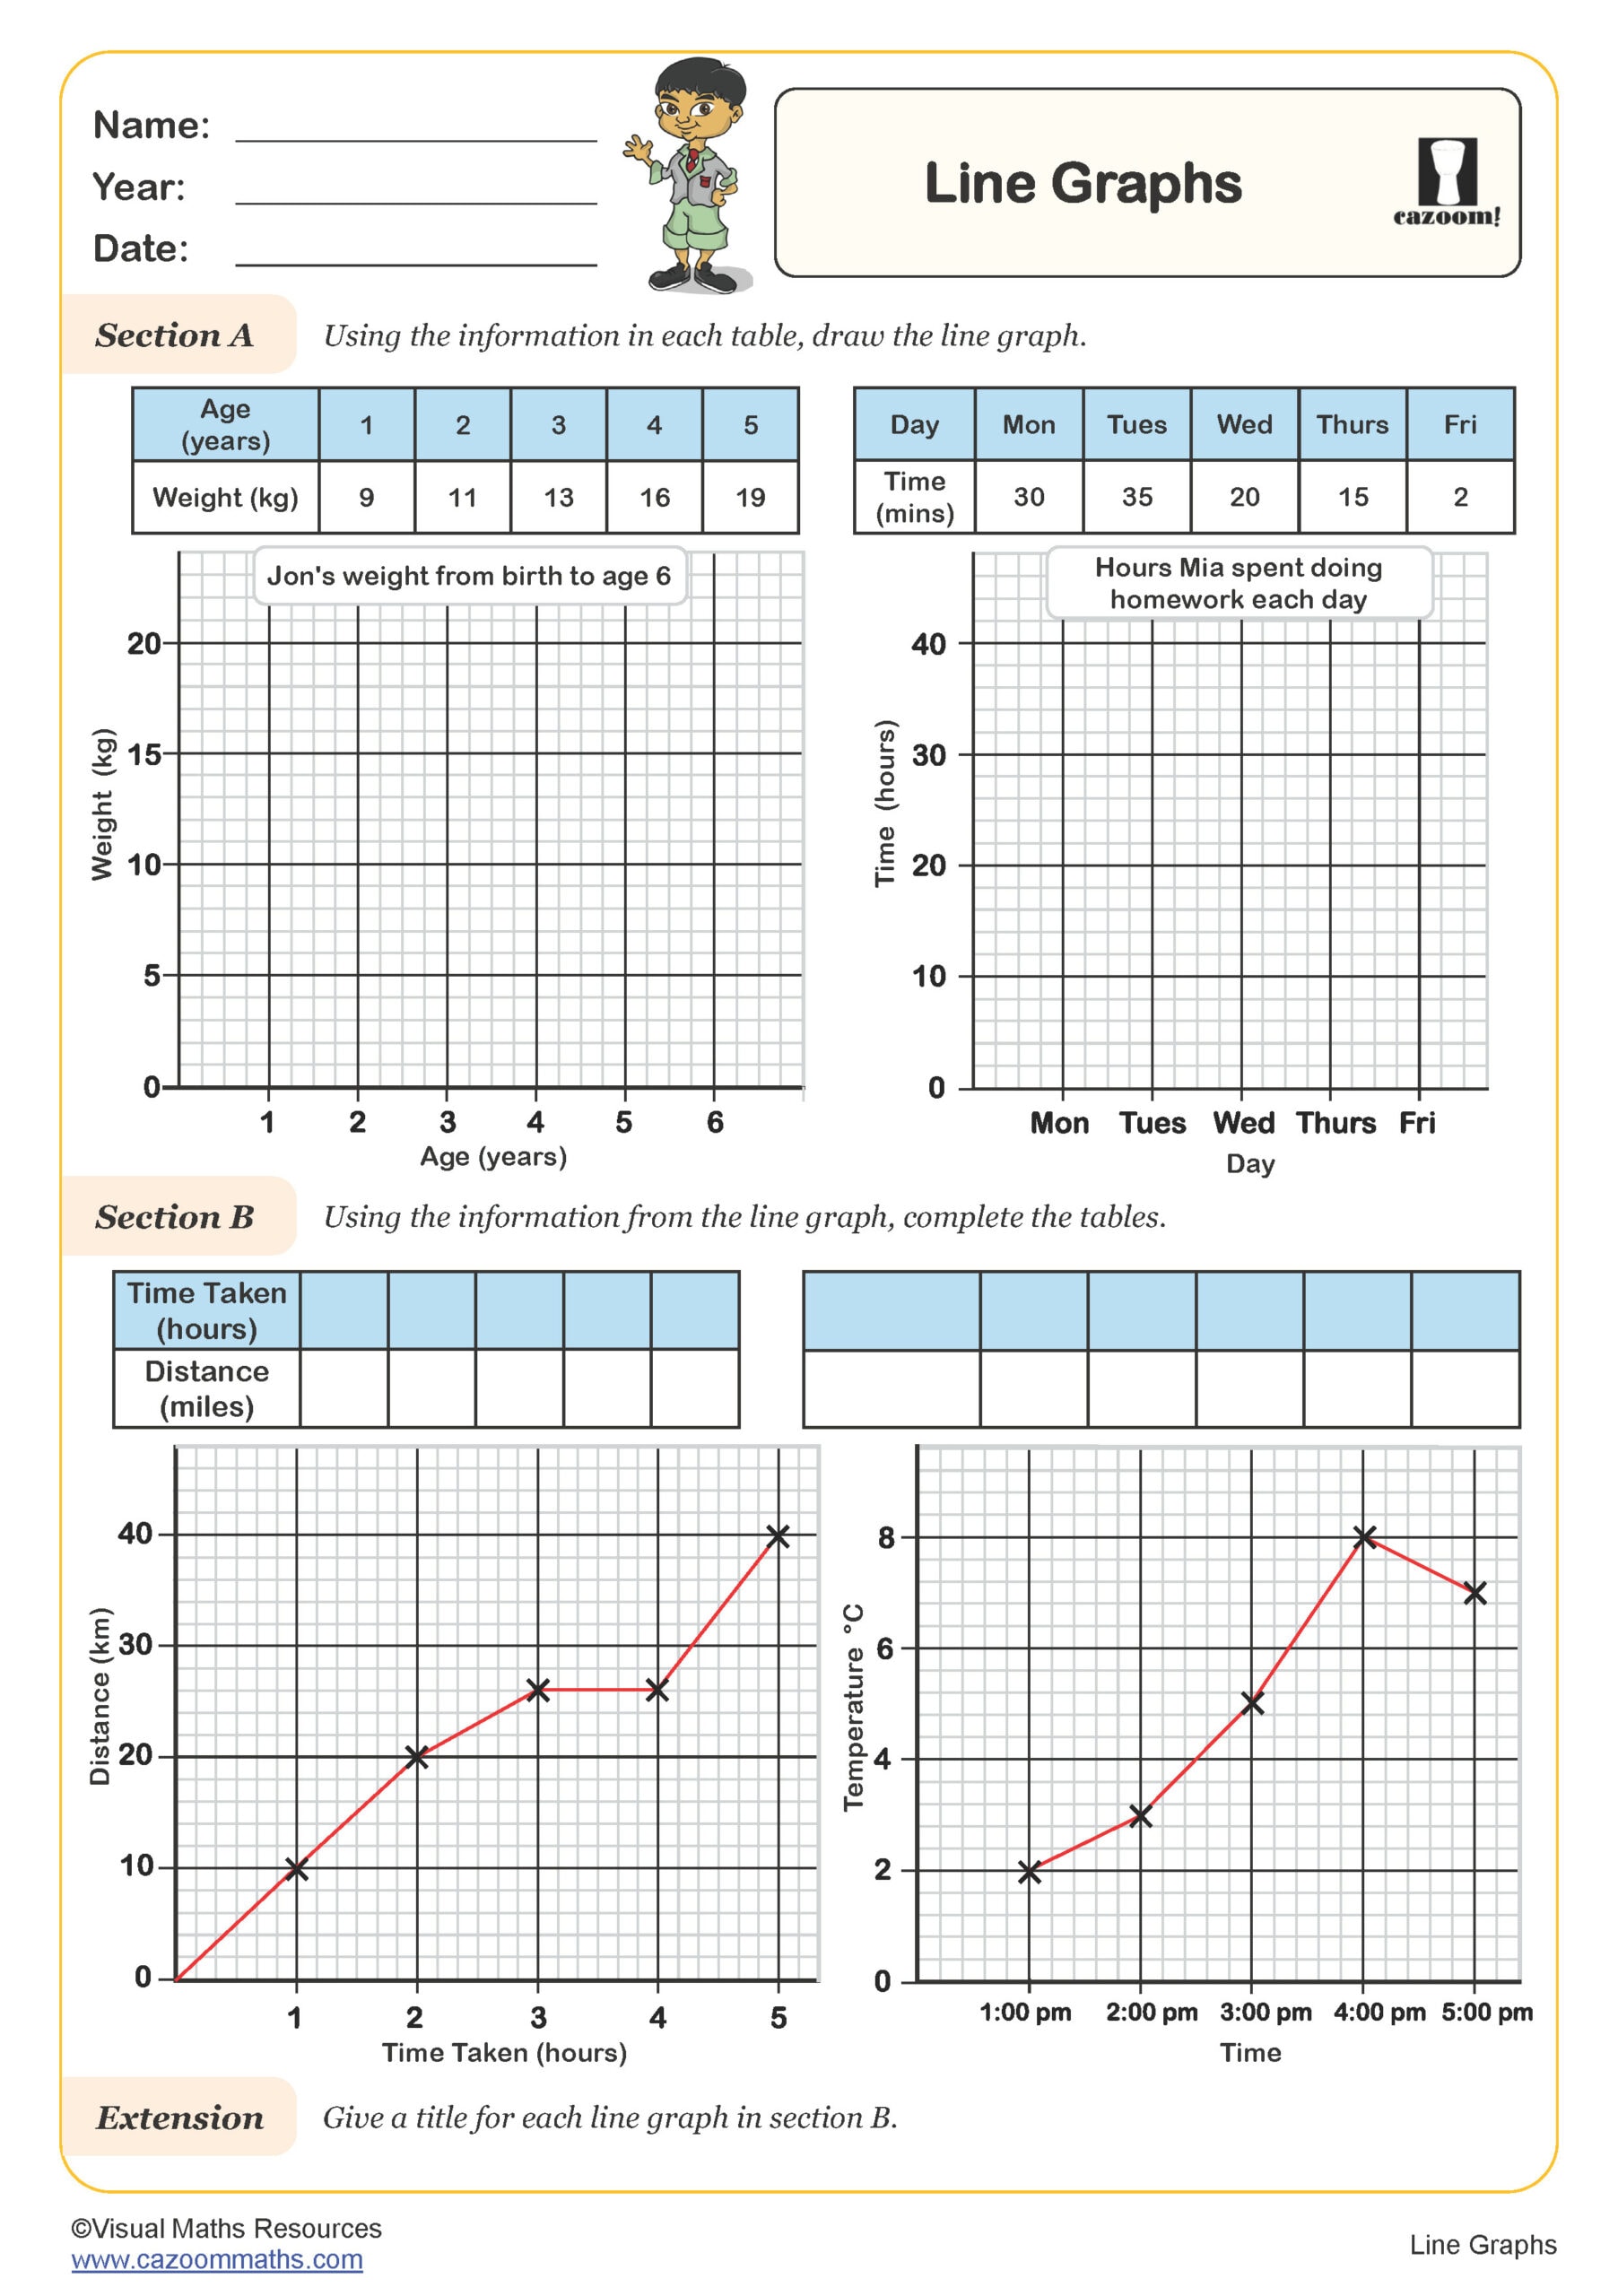
Line Graphs
Year groups: 6
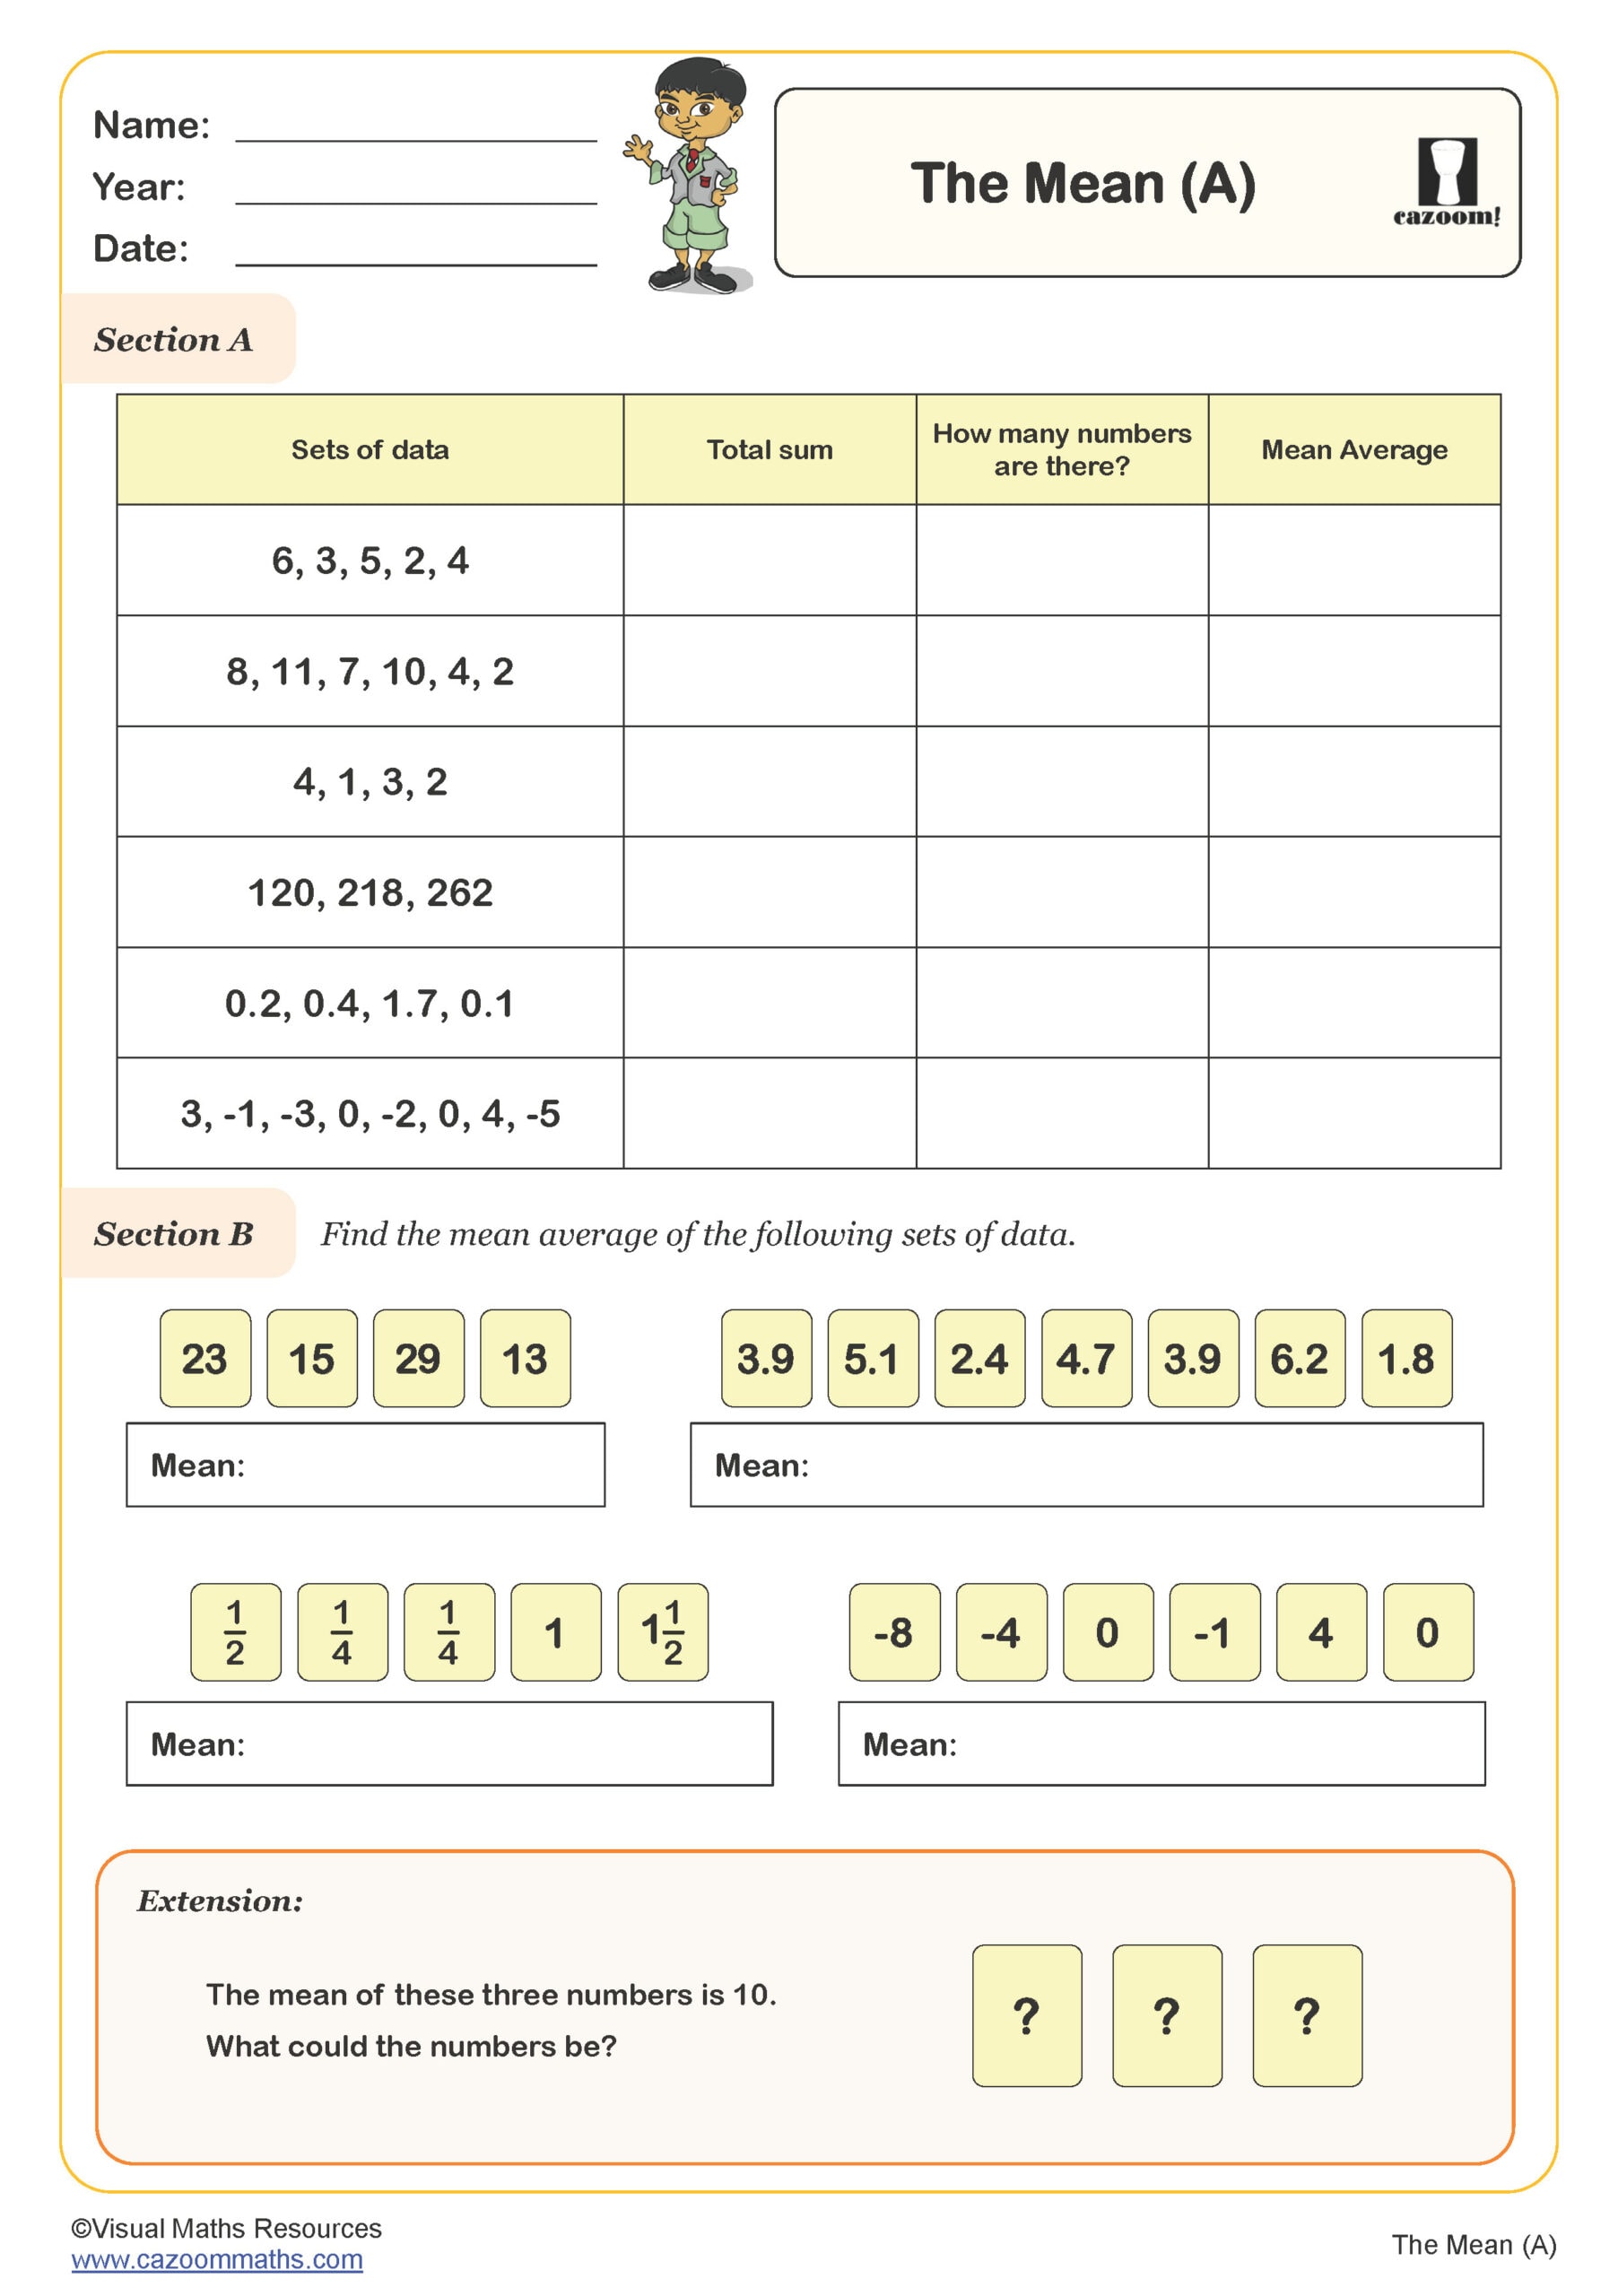
The Mean (A)
Year groups: 6
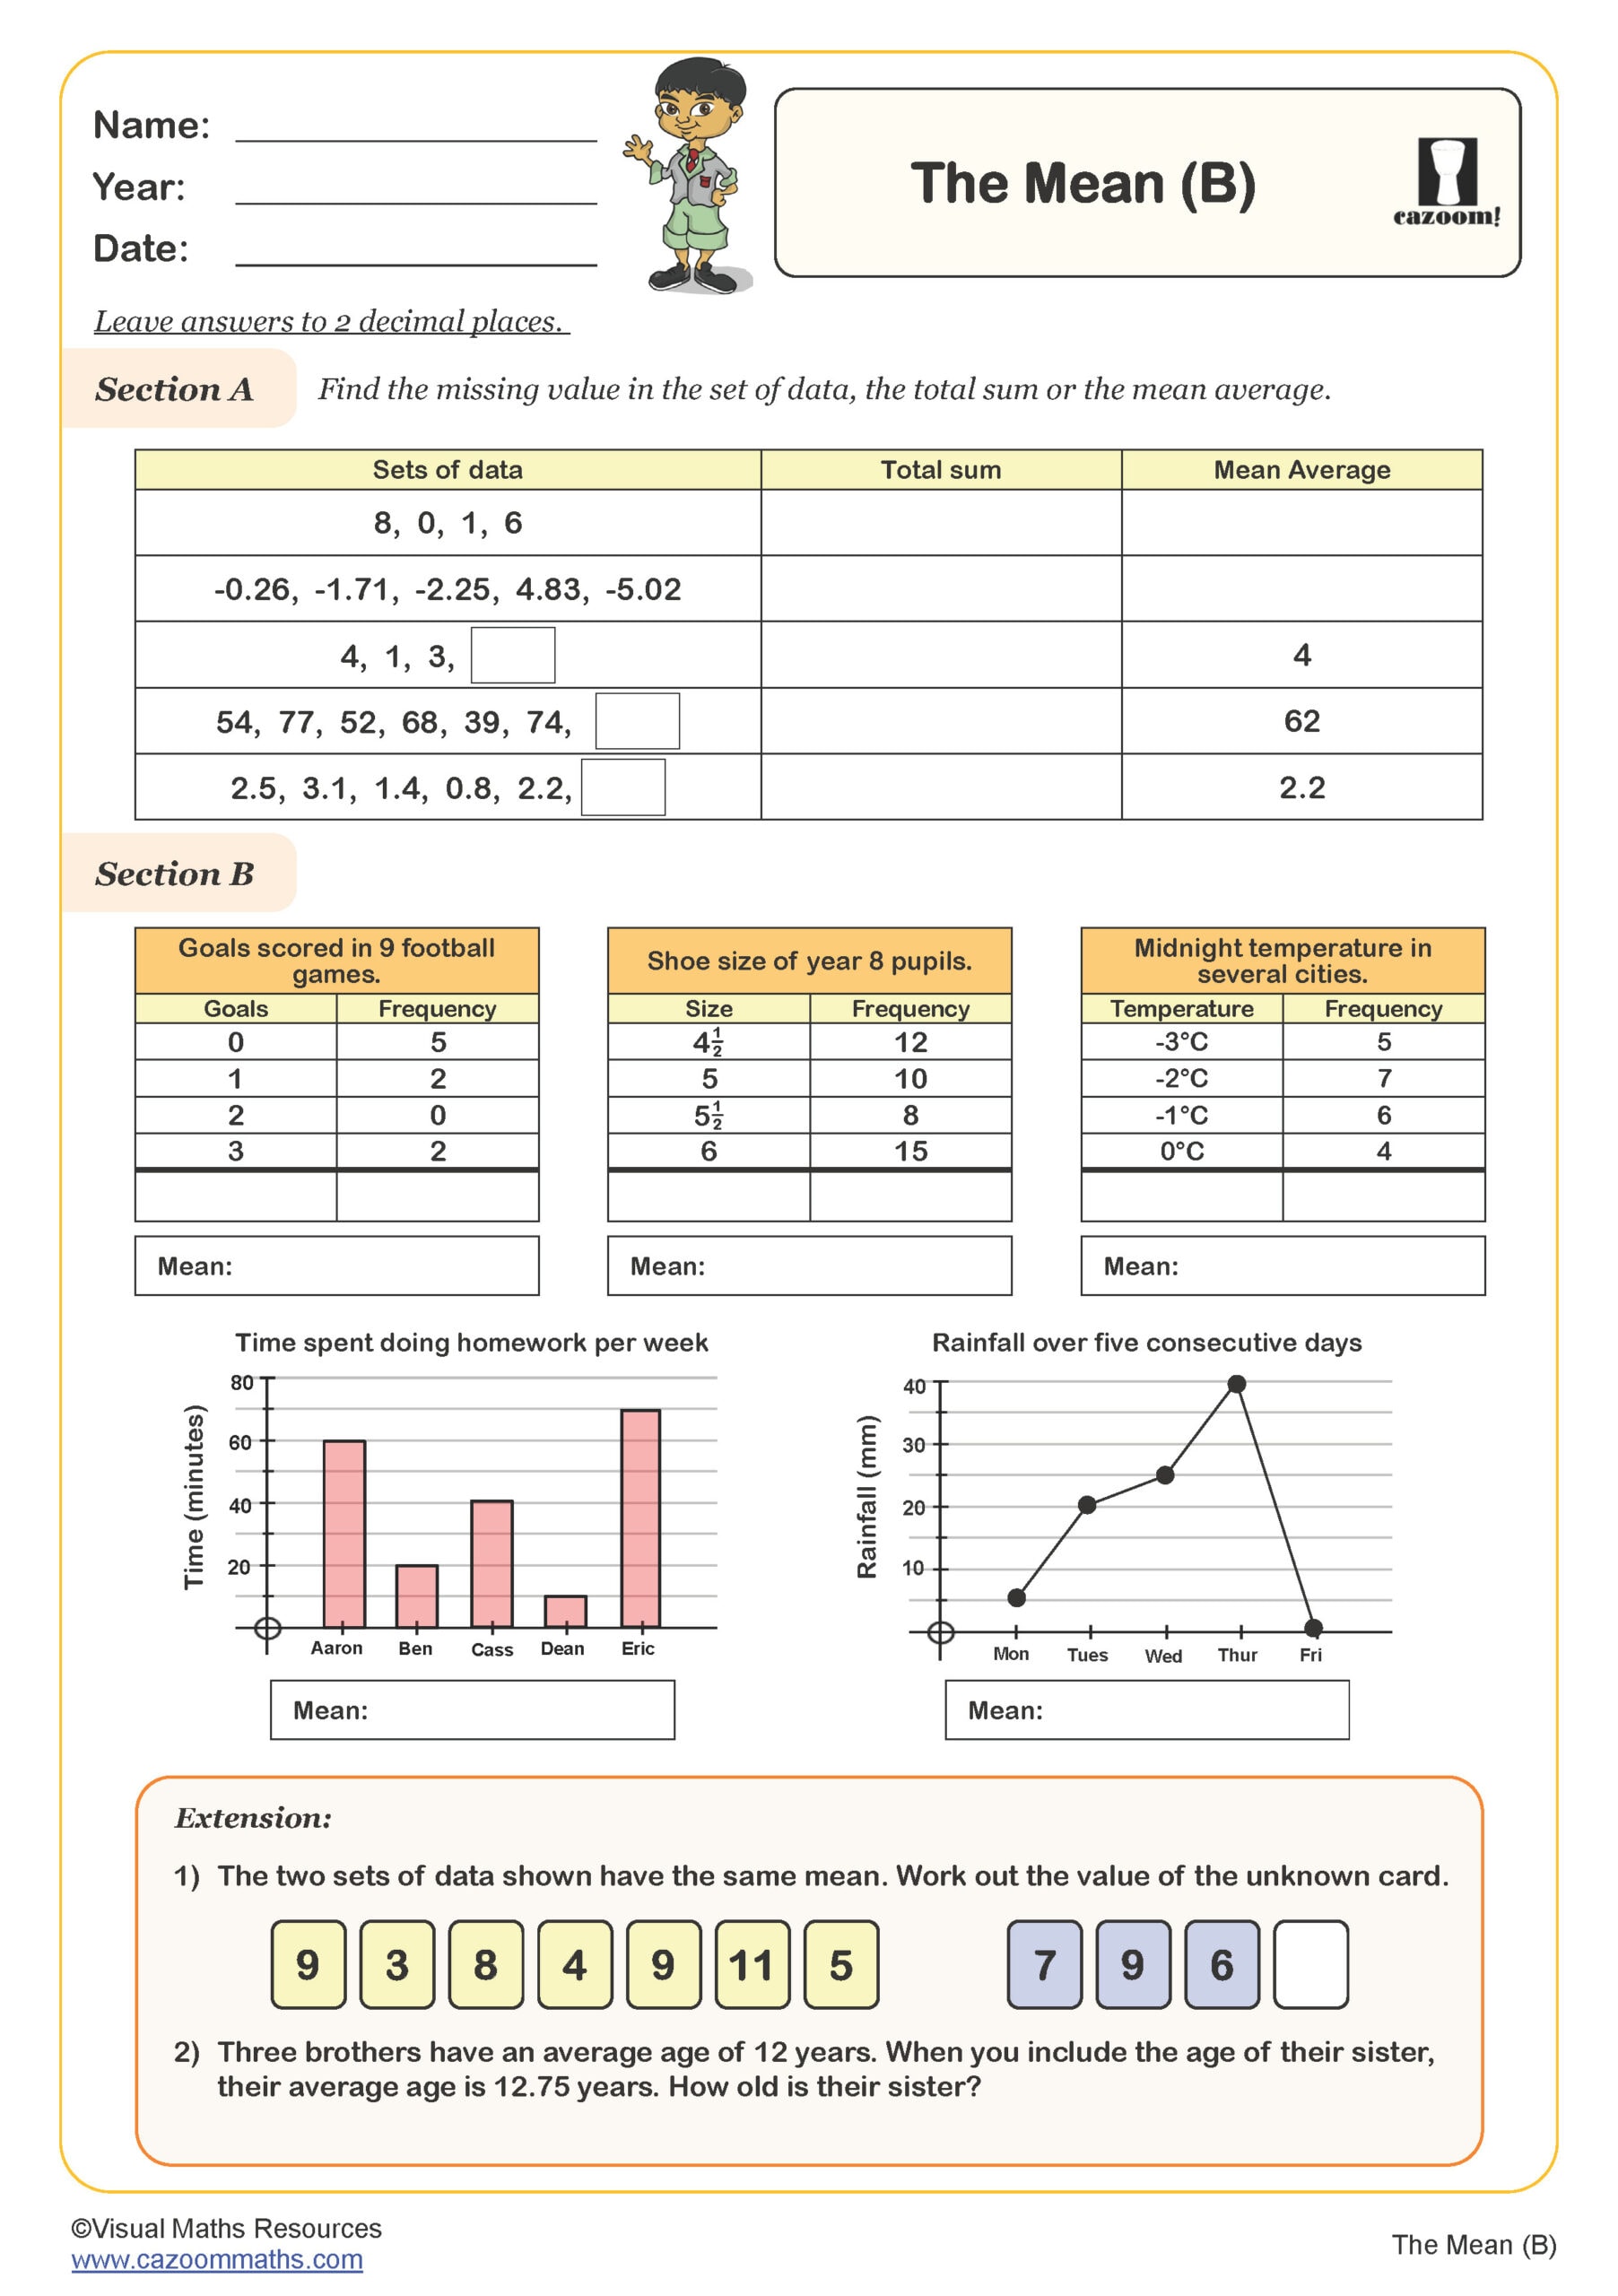
The Mean (B)
Year groups: 6
All worksheets are created by the team of experienced teachers at Cazoom Maths.
What statistics topics are covered in KS2?
The KS2 statistics curriculum builds progressively from Year 3 through to Year 6, covering data collection, representation and interpretation. Students learn to construct and read bar charts, pictograms, tables and line graphs with increasing complexity. They also work with time graphs and understand different scales on the vertical axis.
Which year groups can use these statistics worksheets?
These statistics worksheets span from Year 2 through to Year 6, covering both Key Stage 1 and Key Stage 2 requirements. Year 2 students work on simple tally charts, block diagrams and pictograms, building foundational data handling skills. Year 3 and Year 4 worksheets introduce bar charts with different scales, tables and basic line graphs.
How do students learn about mean, median, mode and range?
Mean, median, mode and range are typically introduced in upper KS2, with focused teaching in Year 6. Students learn that the mean is calculated by totalling all values and dividing by how many there are, the median is found by ordering values and selecting the middle one, the mode is the most frequently occurring value, and the range is the difference between the highest and lowest values.
Do these statistics worksheets include answers?
Every worksheet in this collection comes with a complete answer sheet showing all solutions. This allows teachers to mark work efficiently or set up self-marking activities where students check their own understanding. Answer sheets are particularly valuable for statistics work, where pupils benefit from seeing correctly drawn graphs and charts alongside numerical calculations.