KS2 Statistics Worksheets
All worksheets are created by the team of experienced teachers at Cazoom Maths.
What Statistics Skills Do KS2 Pupils Need to Learn?
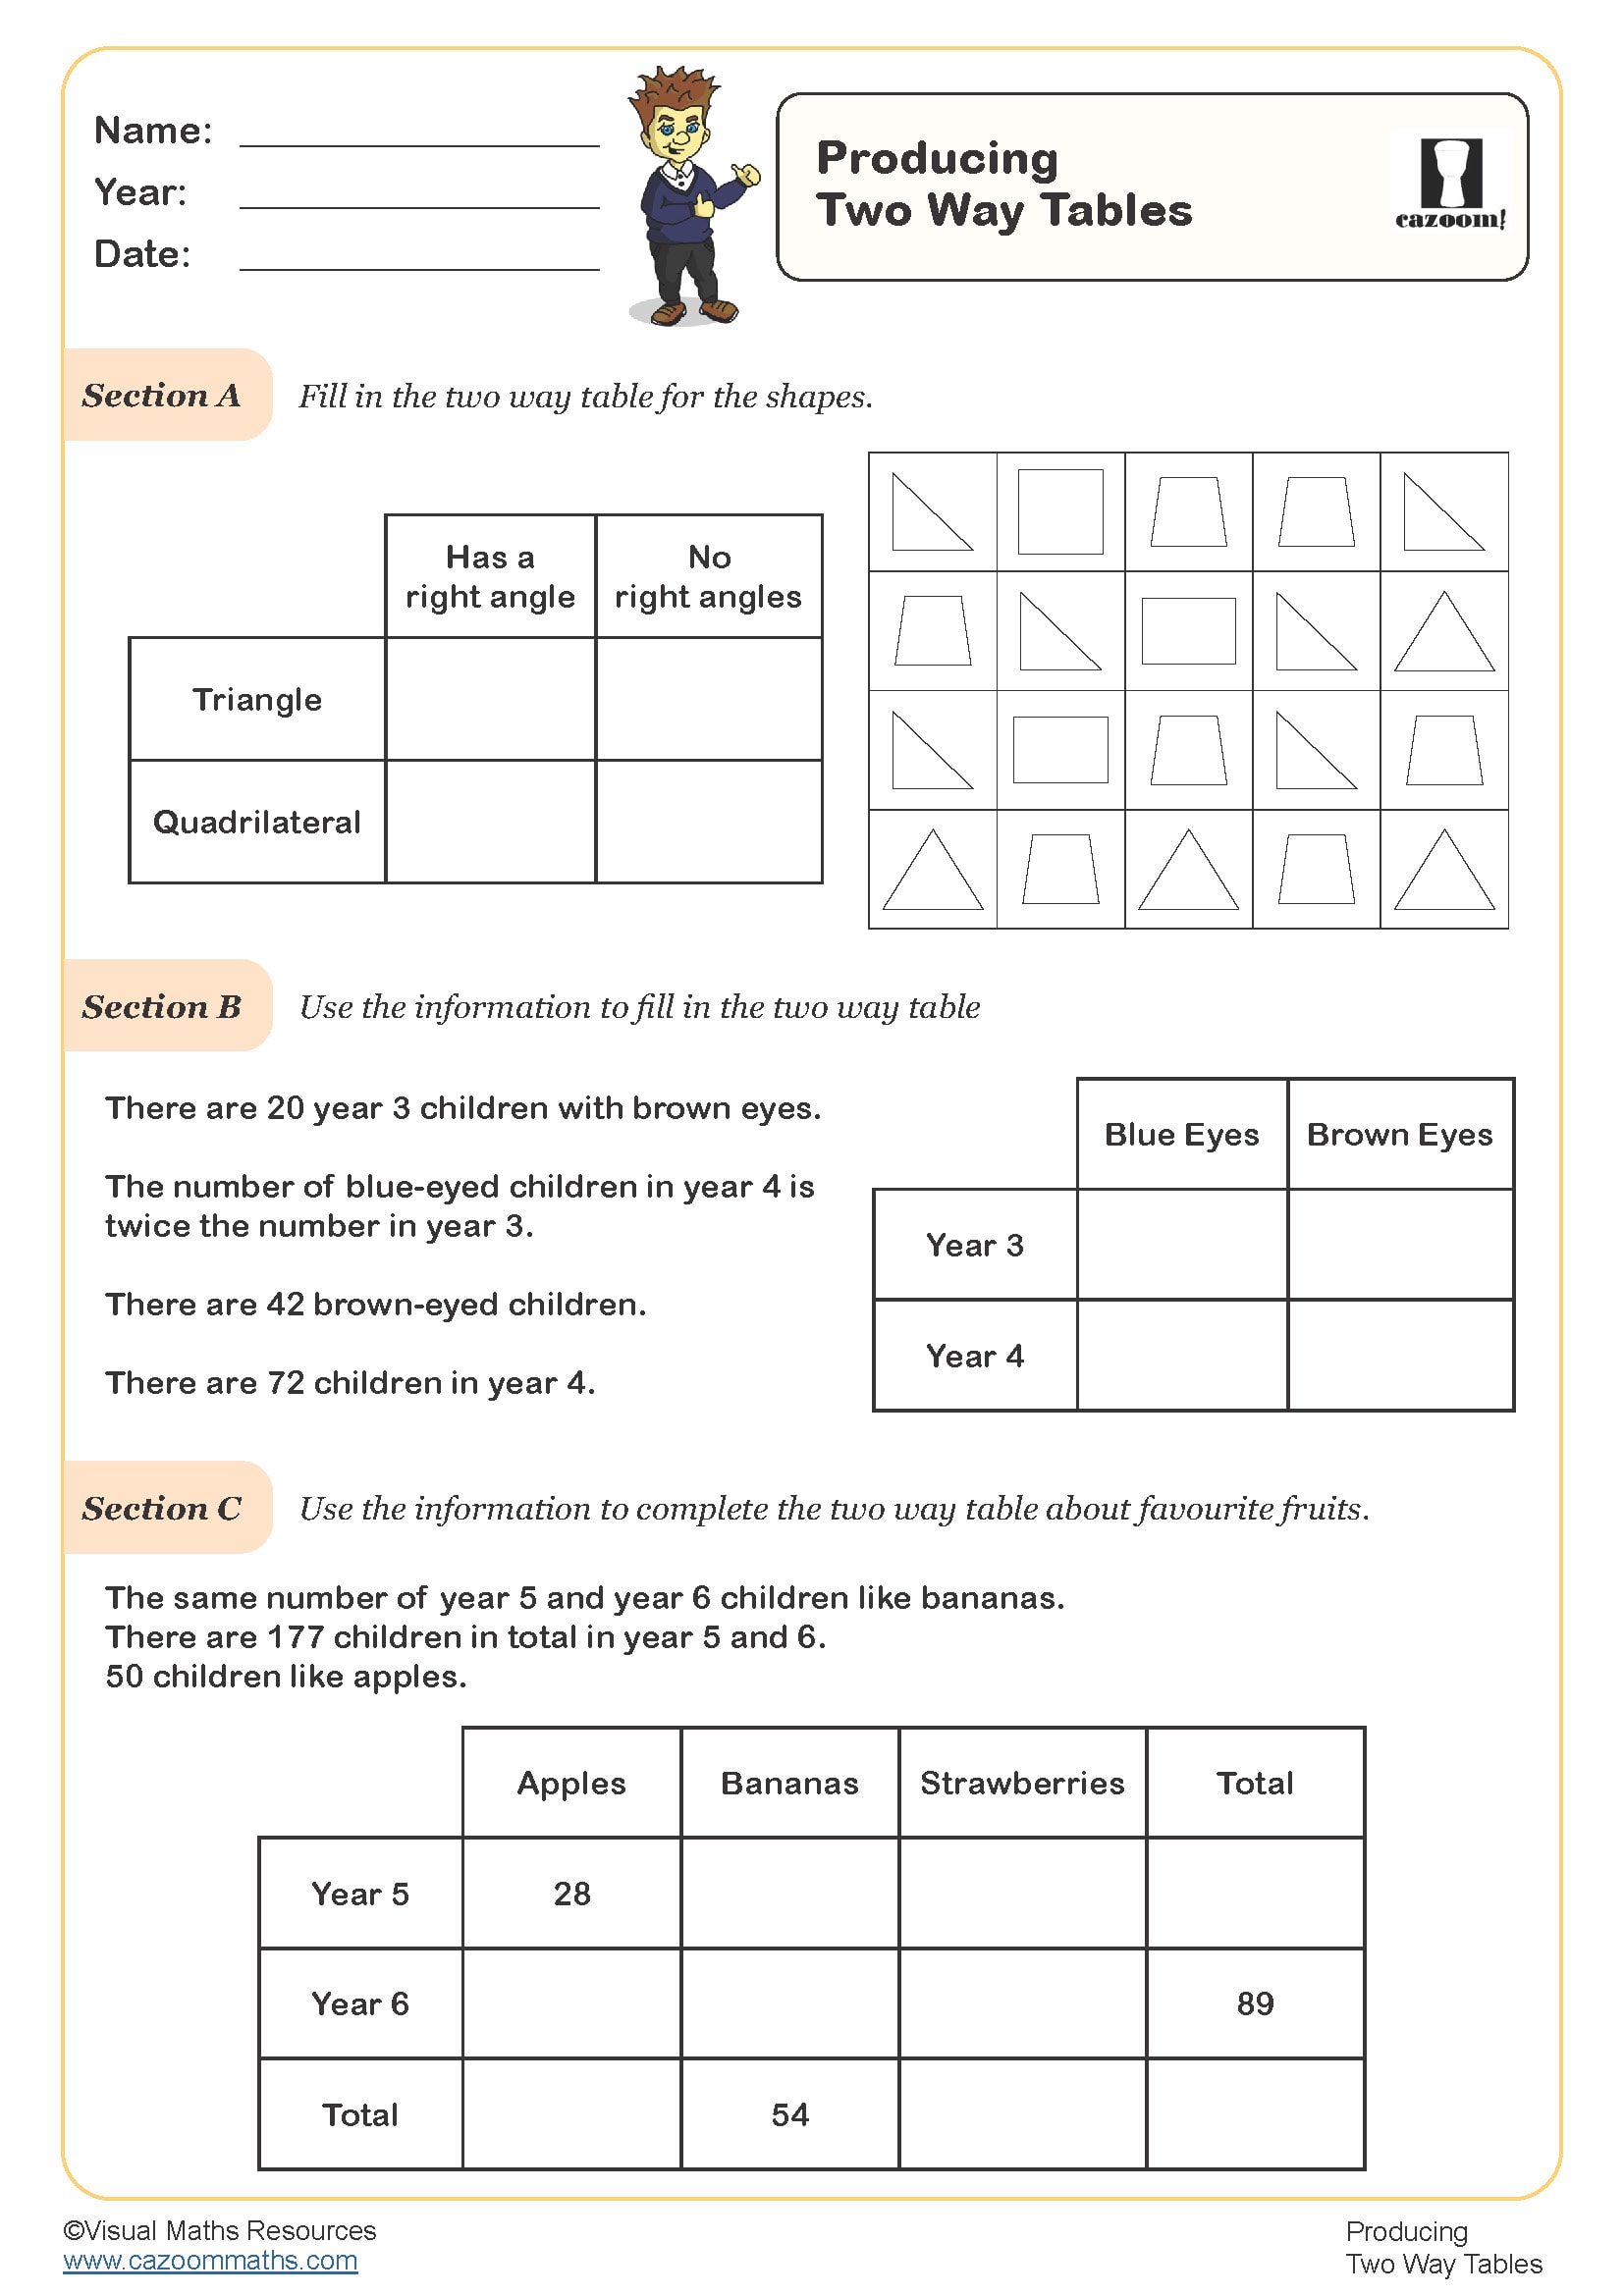
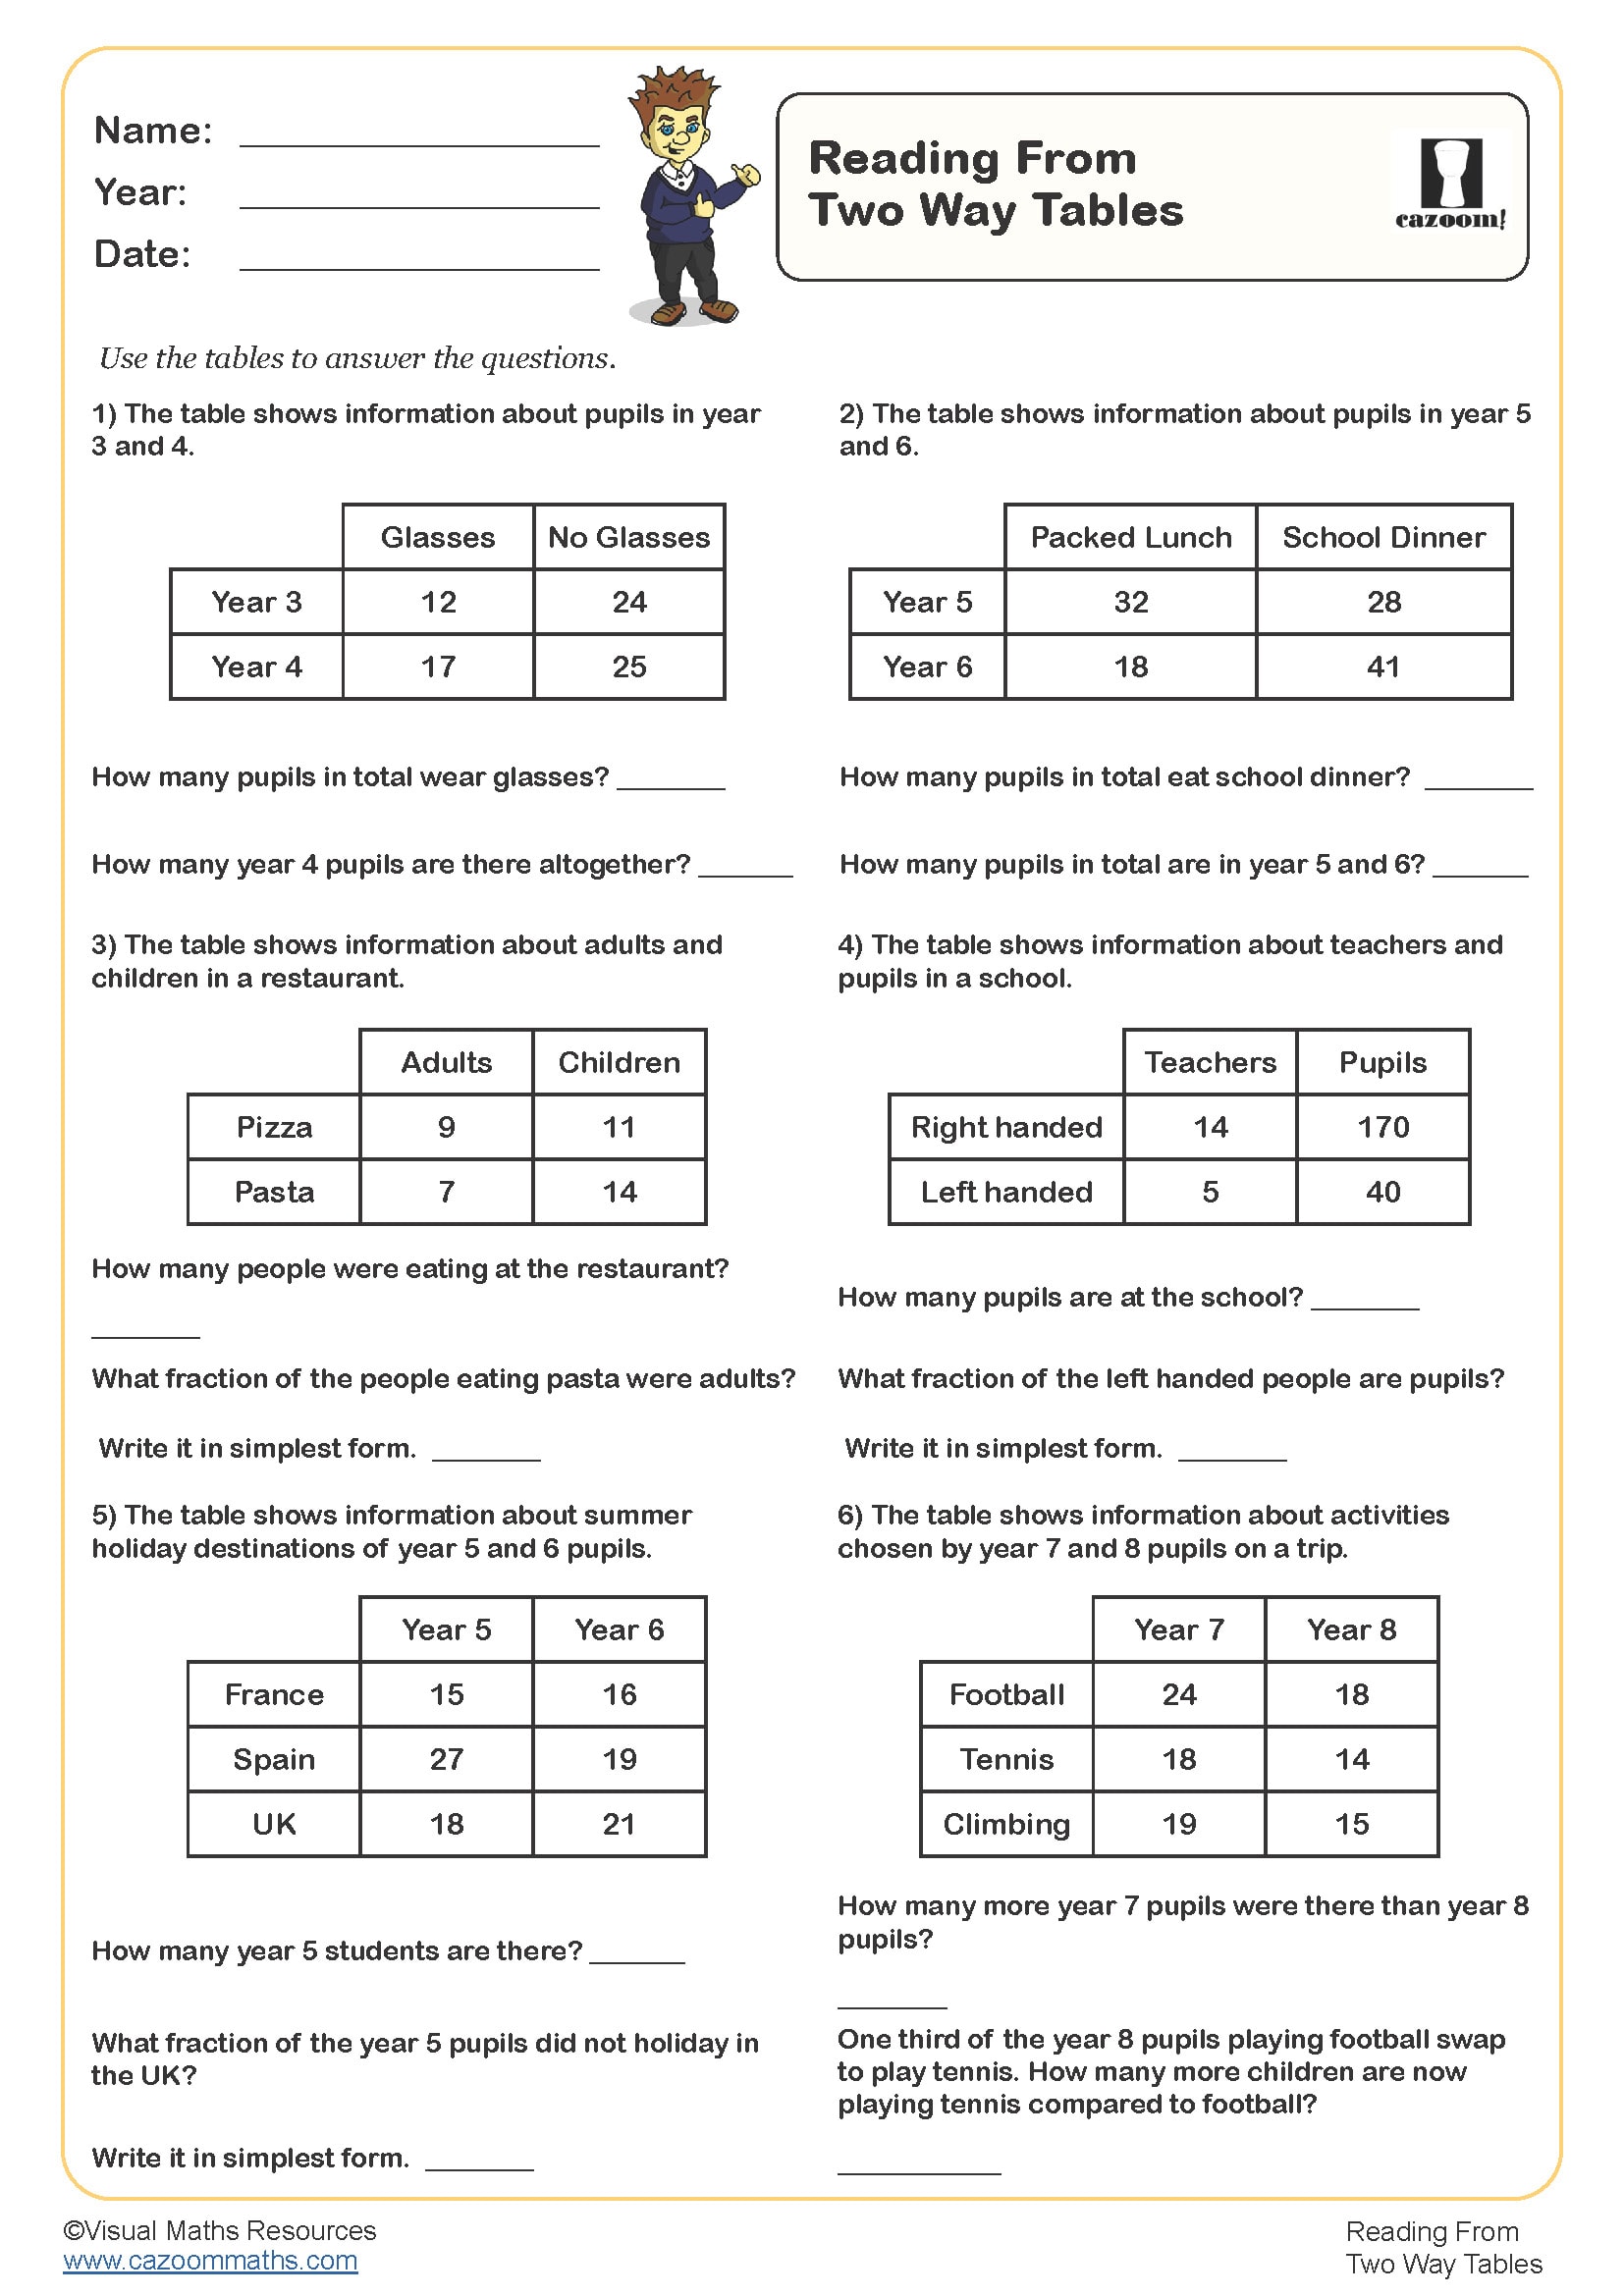
The KS2 statistics curriculum progresses from basic data representation to more sophisticated interpretation and analysis. In Years 3 and 4, pupils learn to collect and represent data using tally charts, pictograms, bar charts, and tables, understanding scales and intervals. They answer questions by reading and interpreting these representations, comparing categories and identifying patterns.
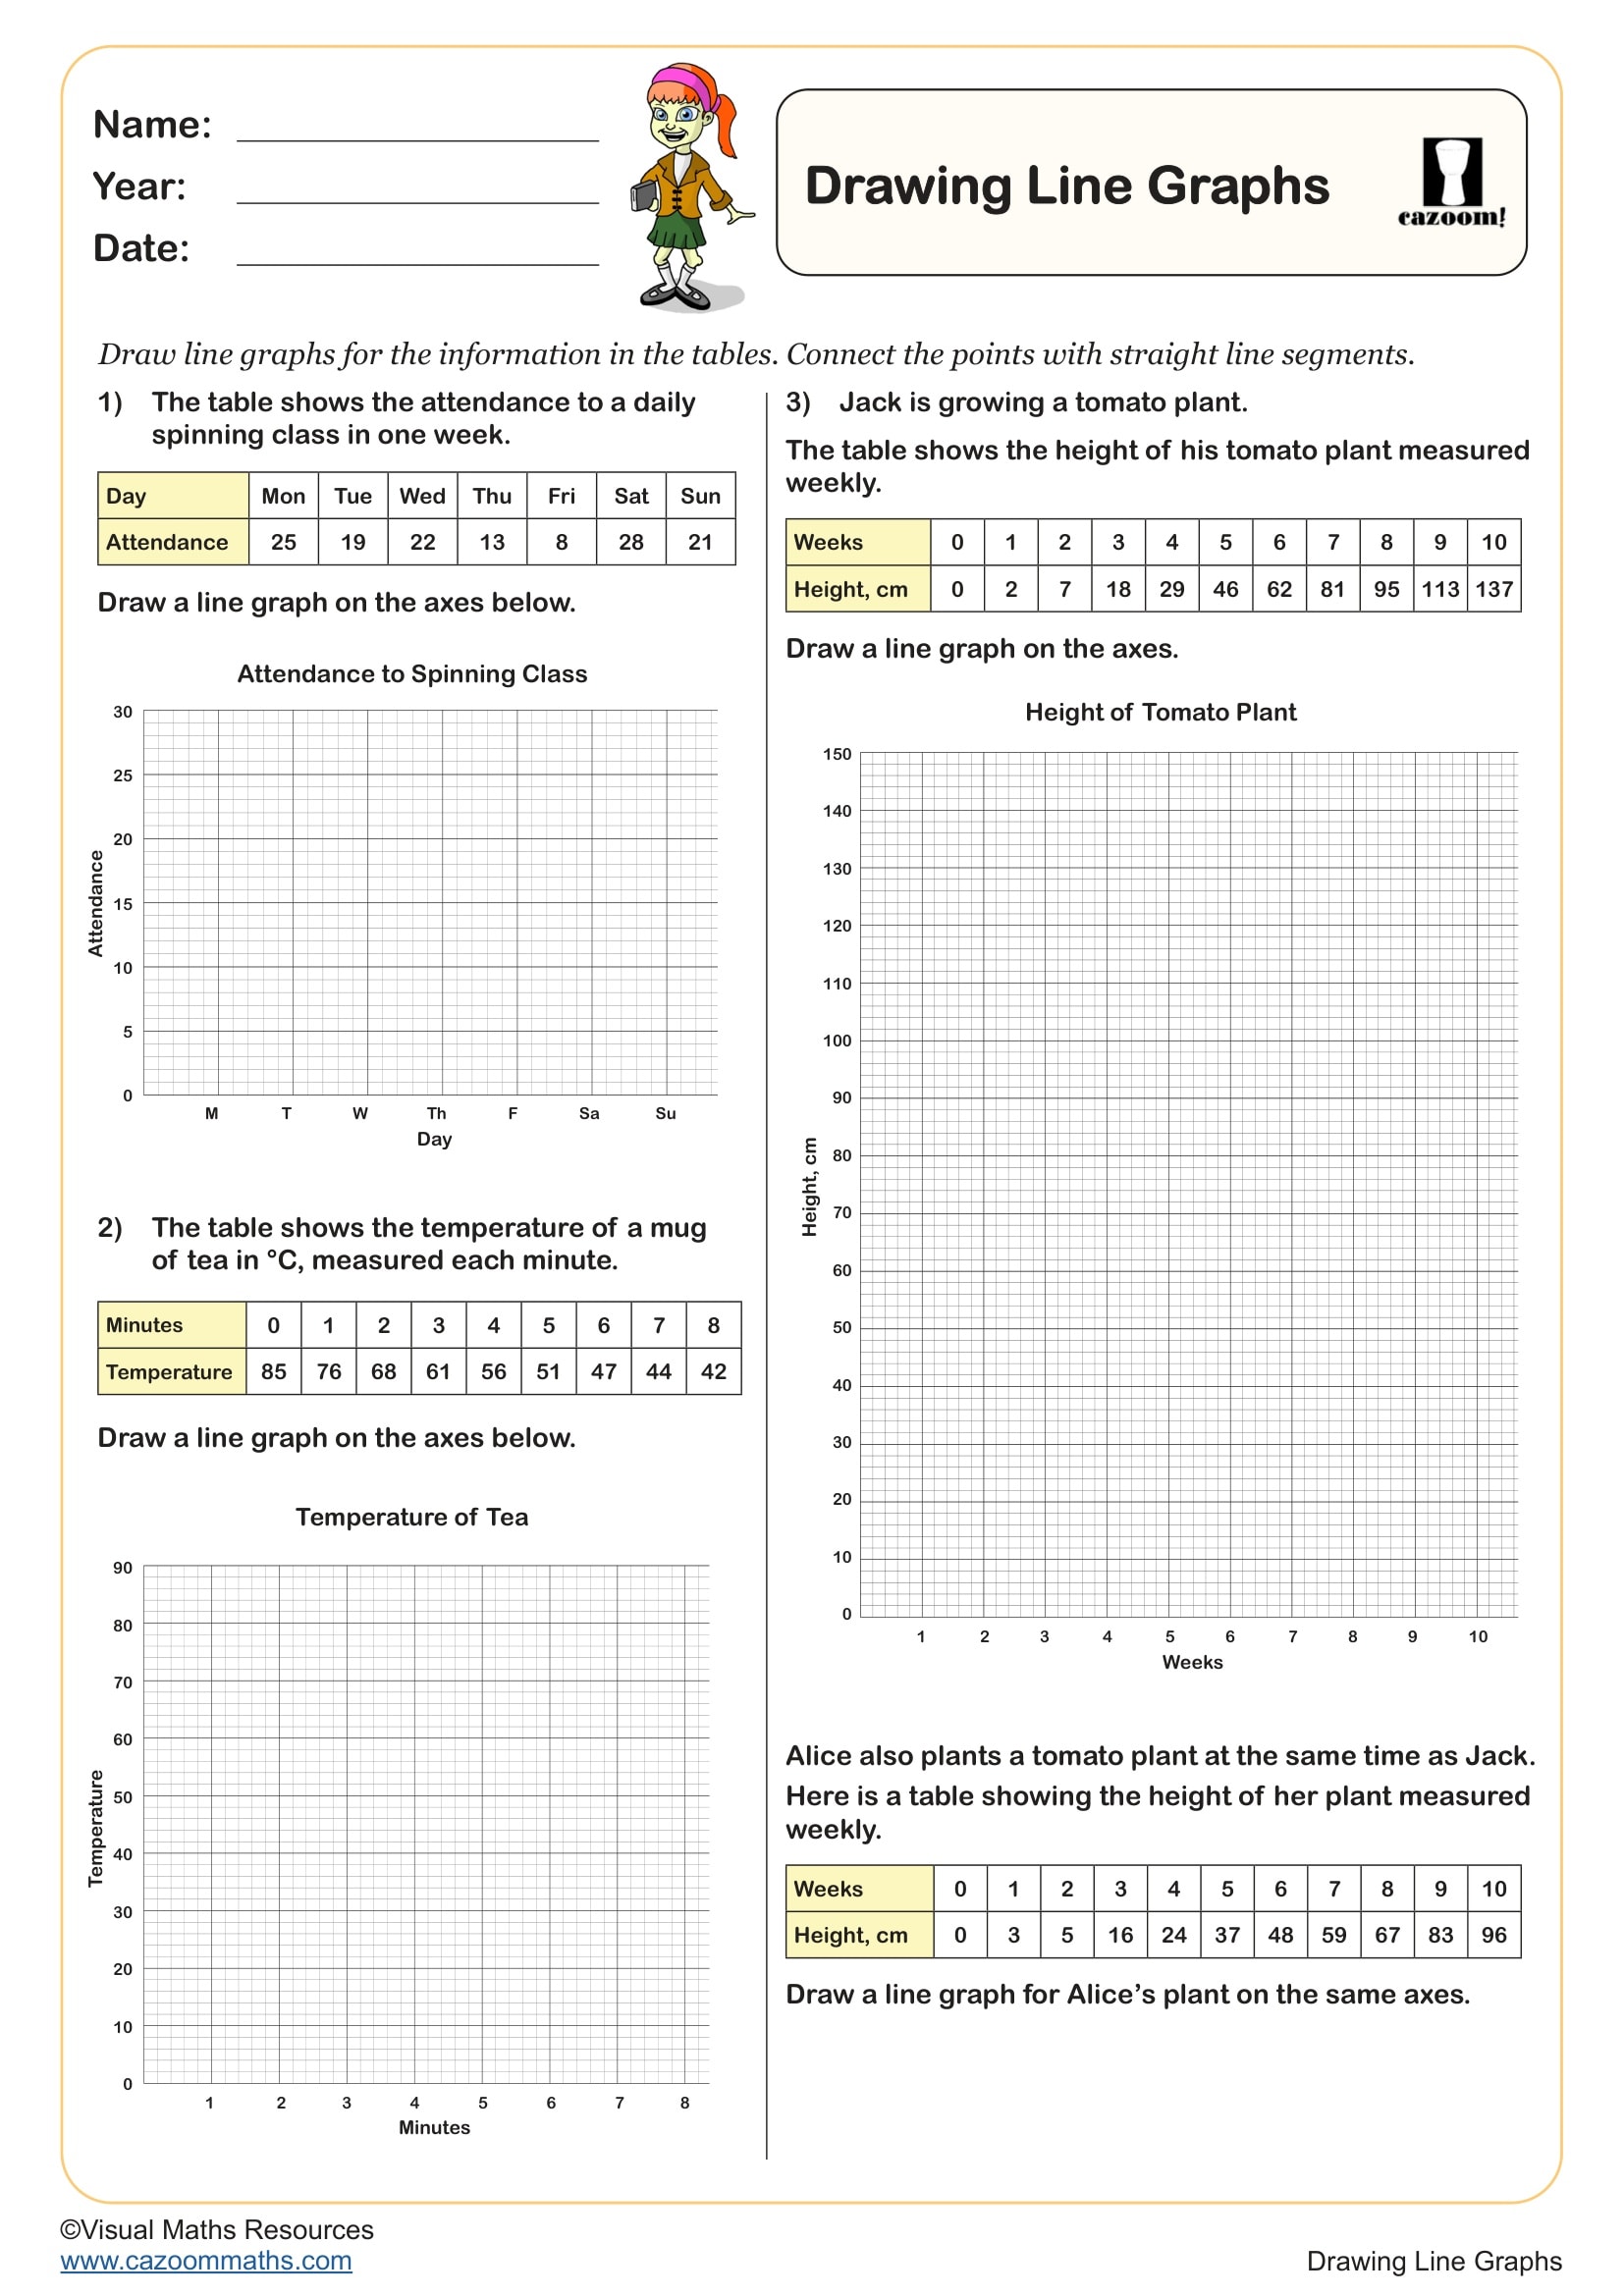
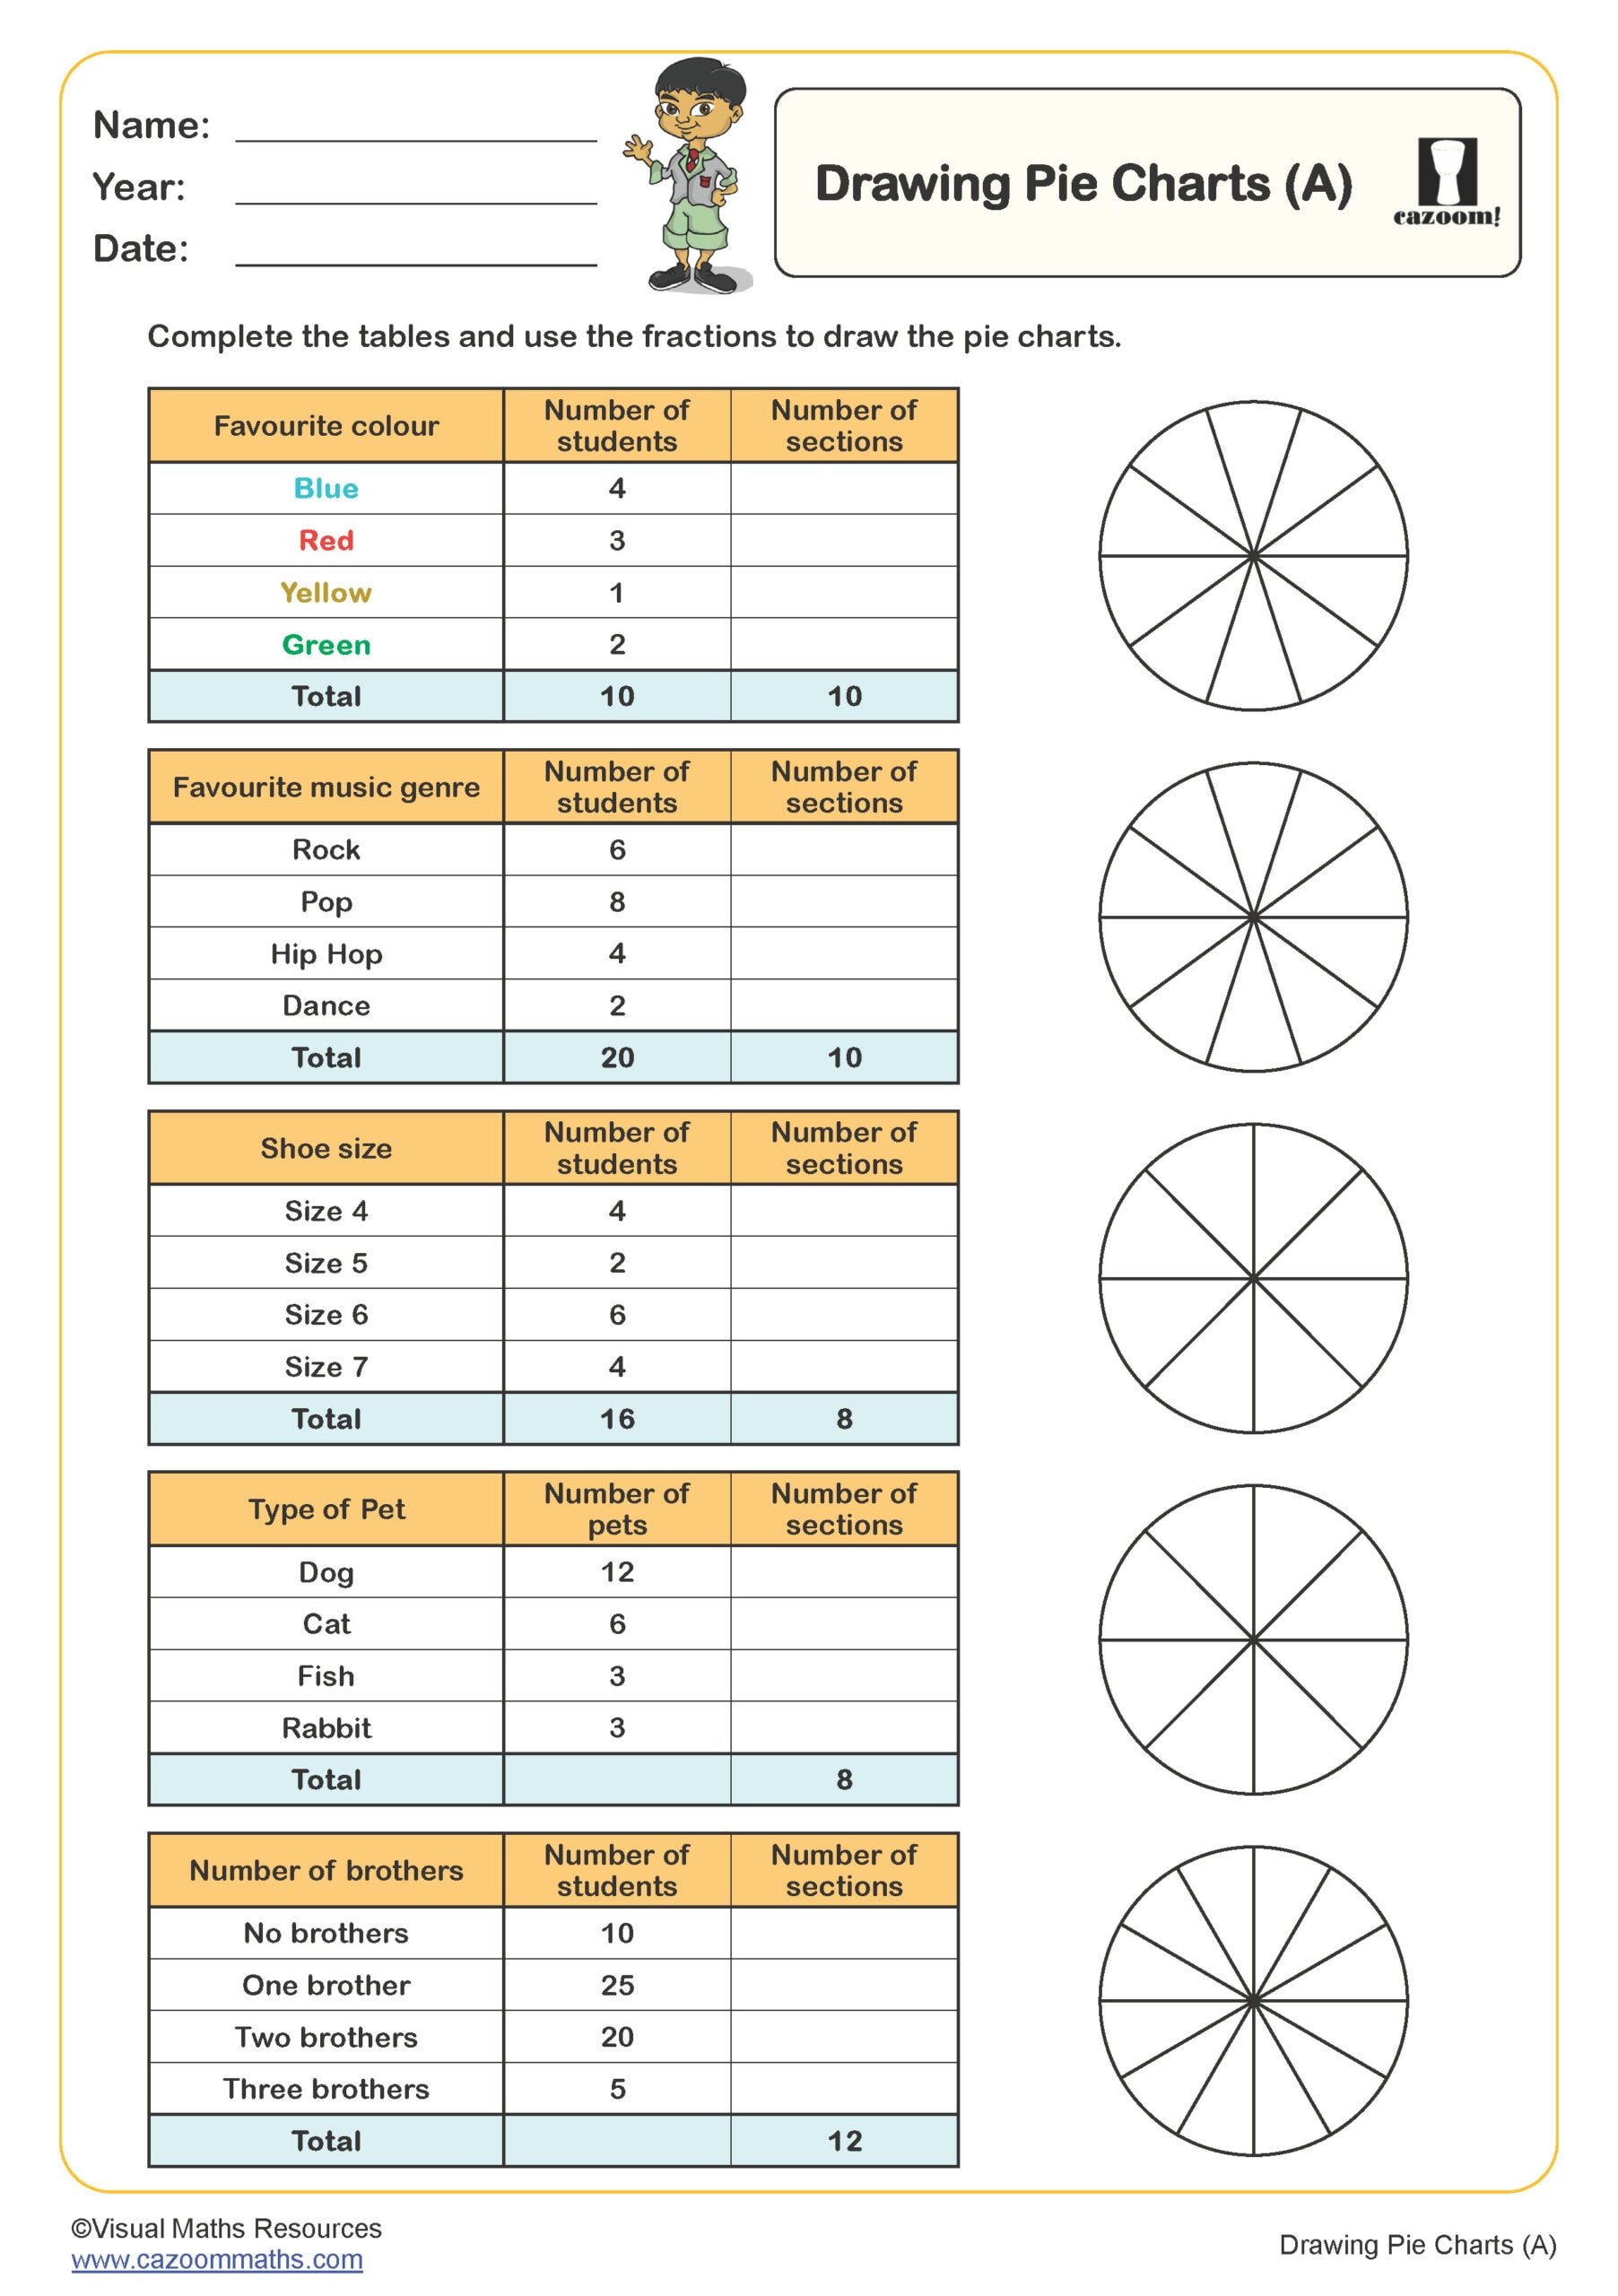
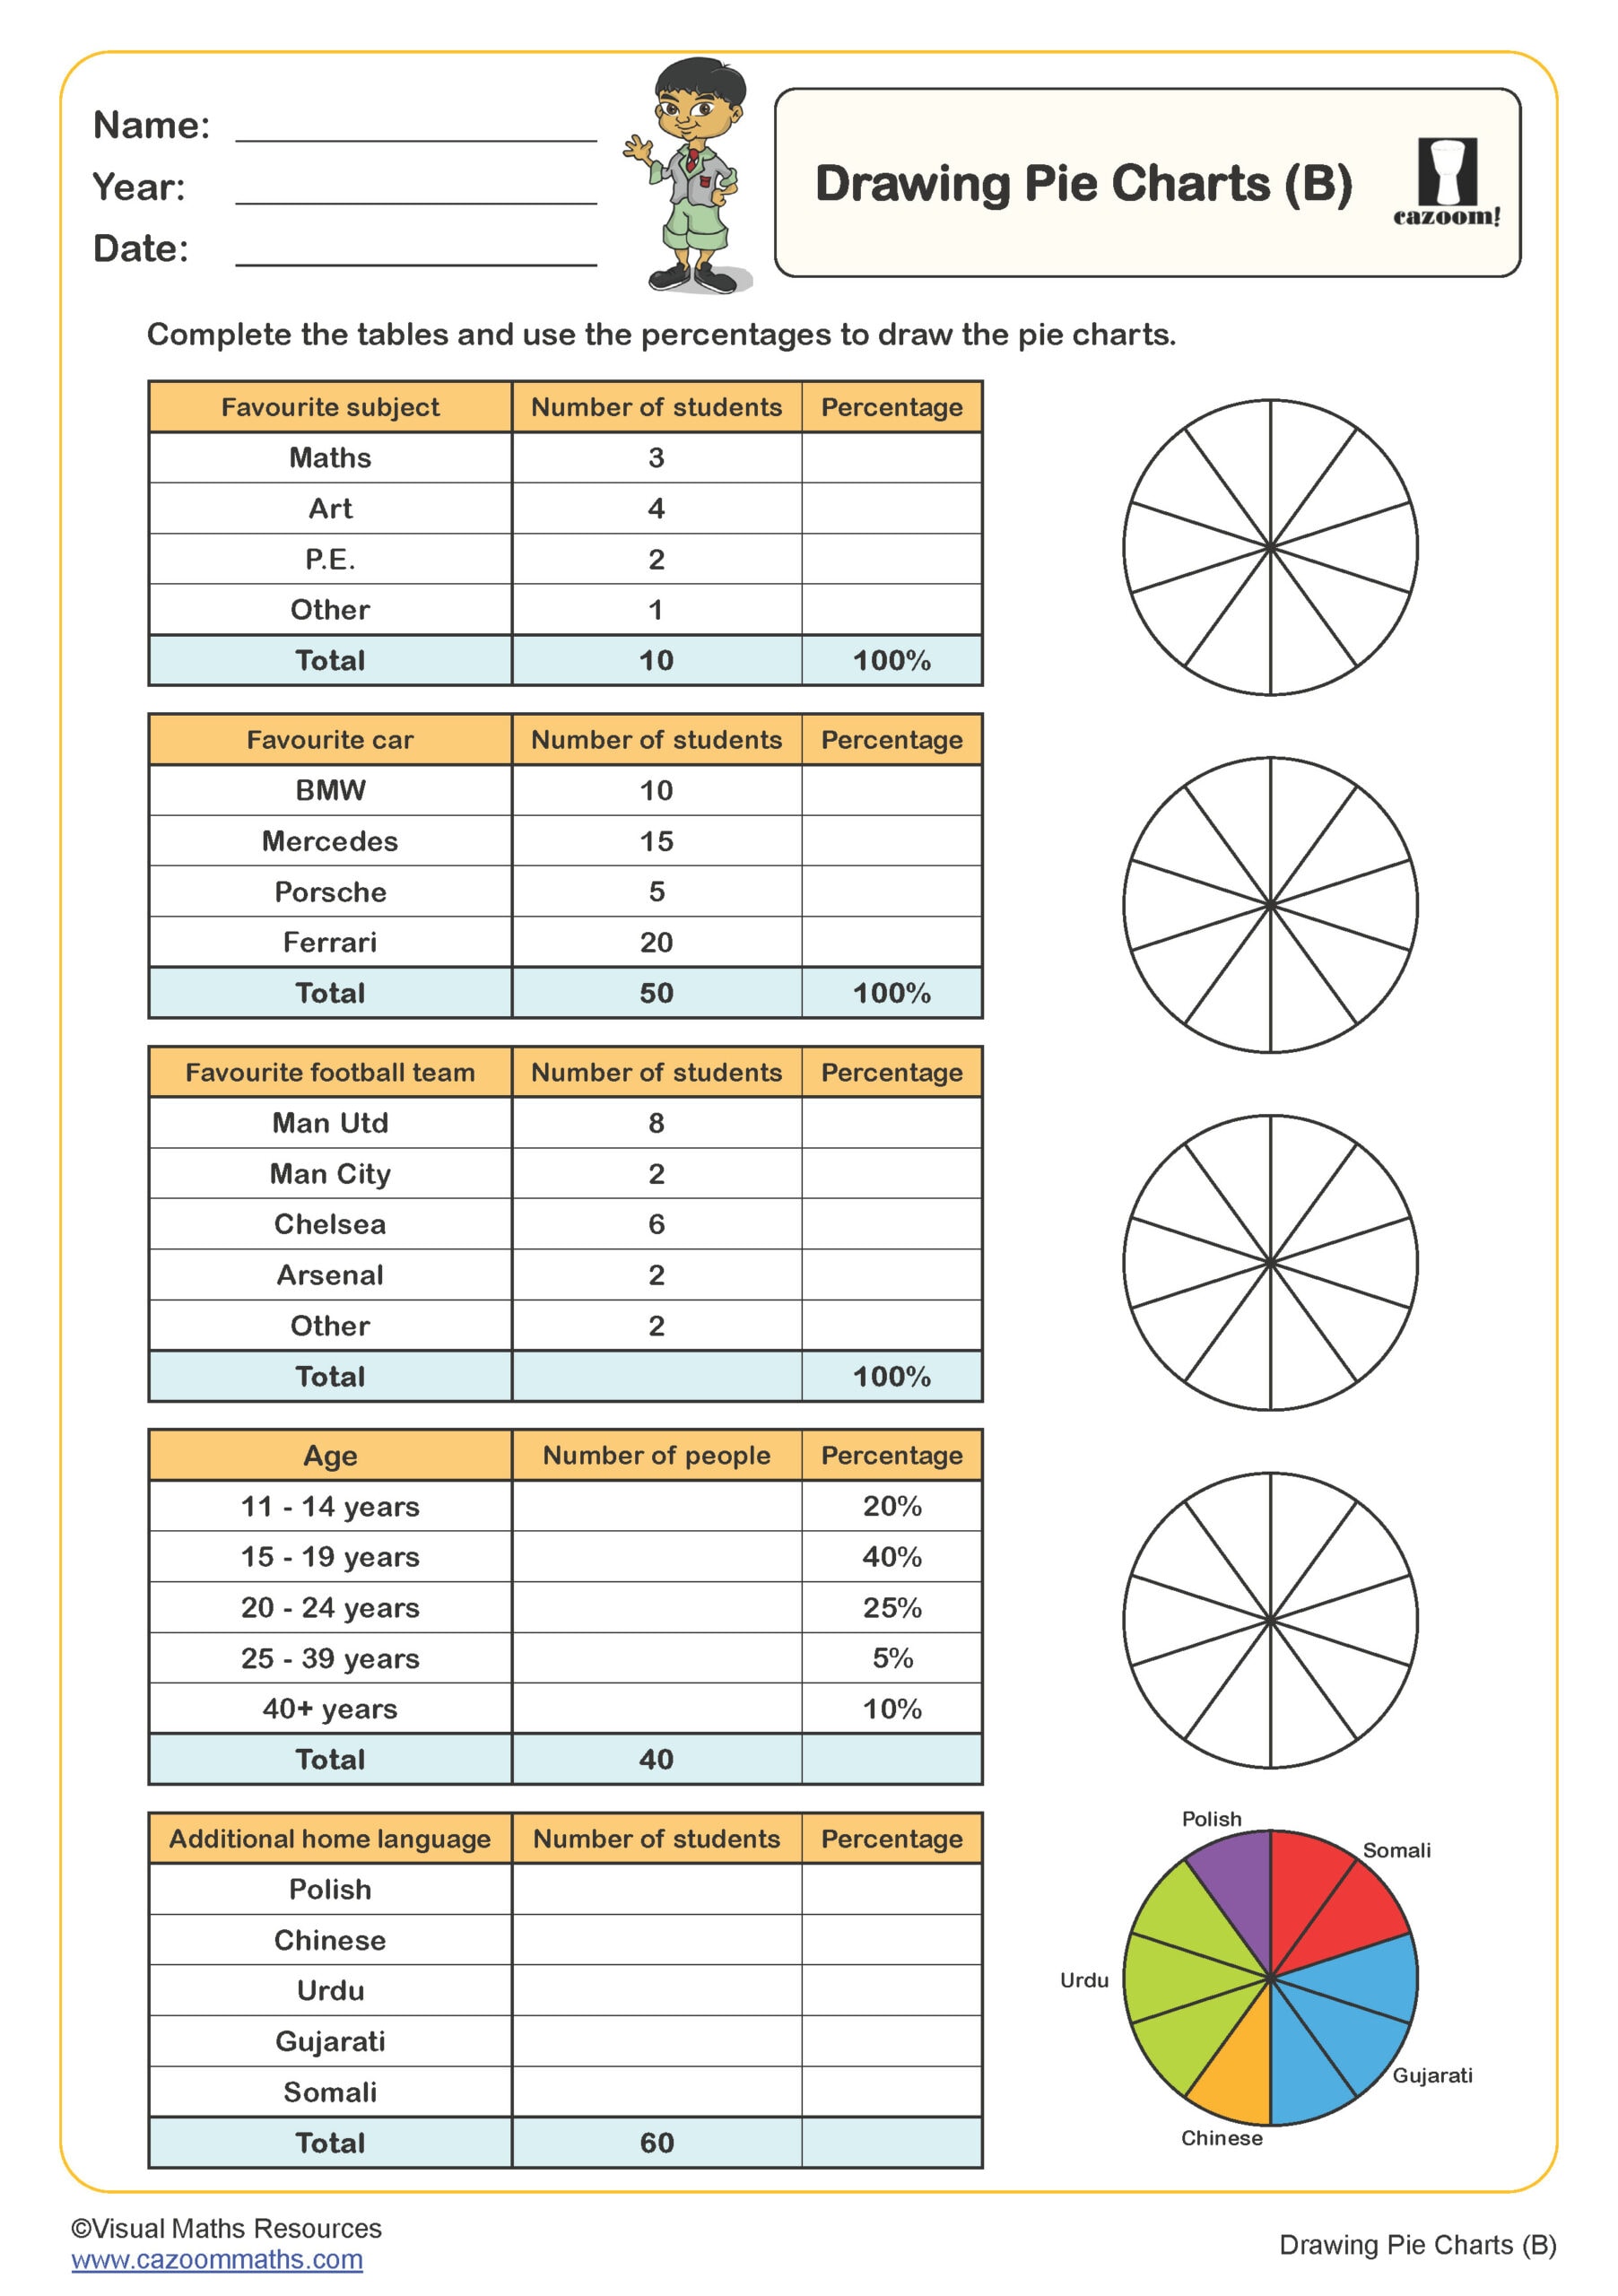
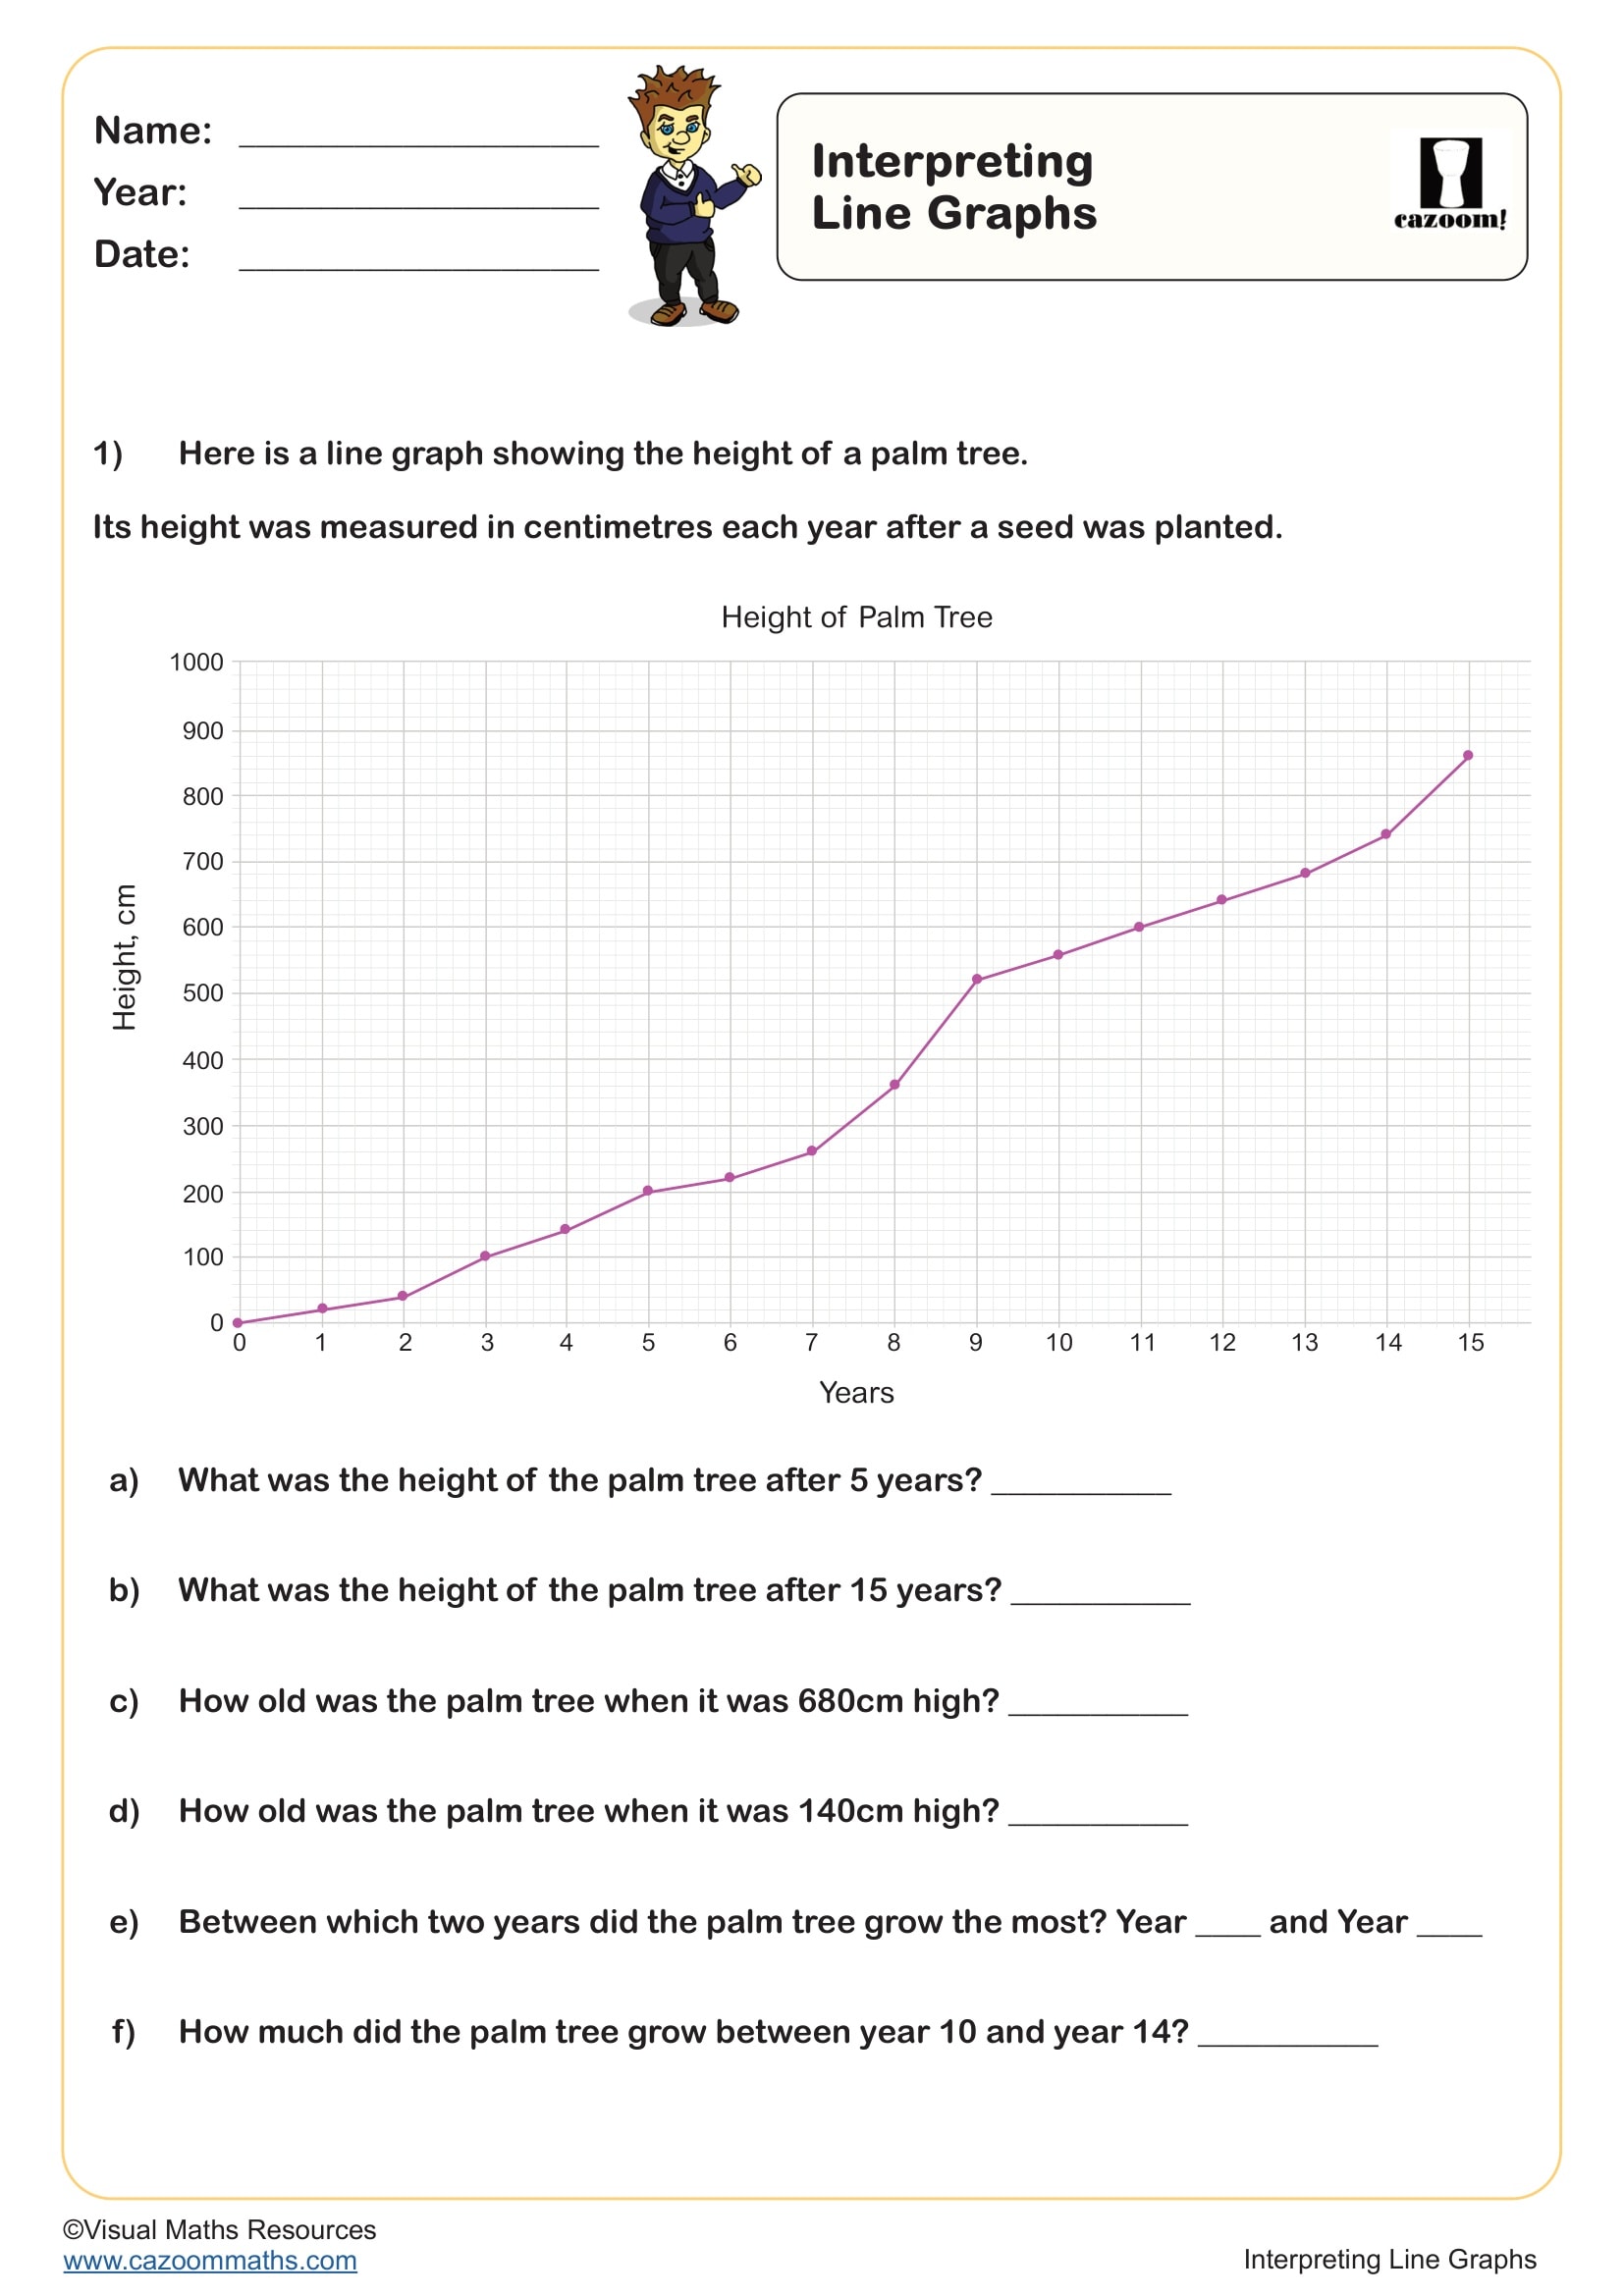
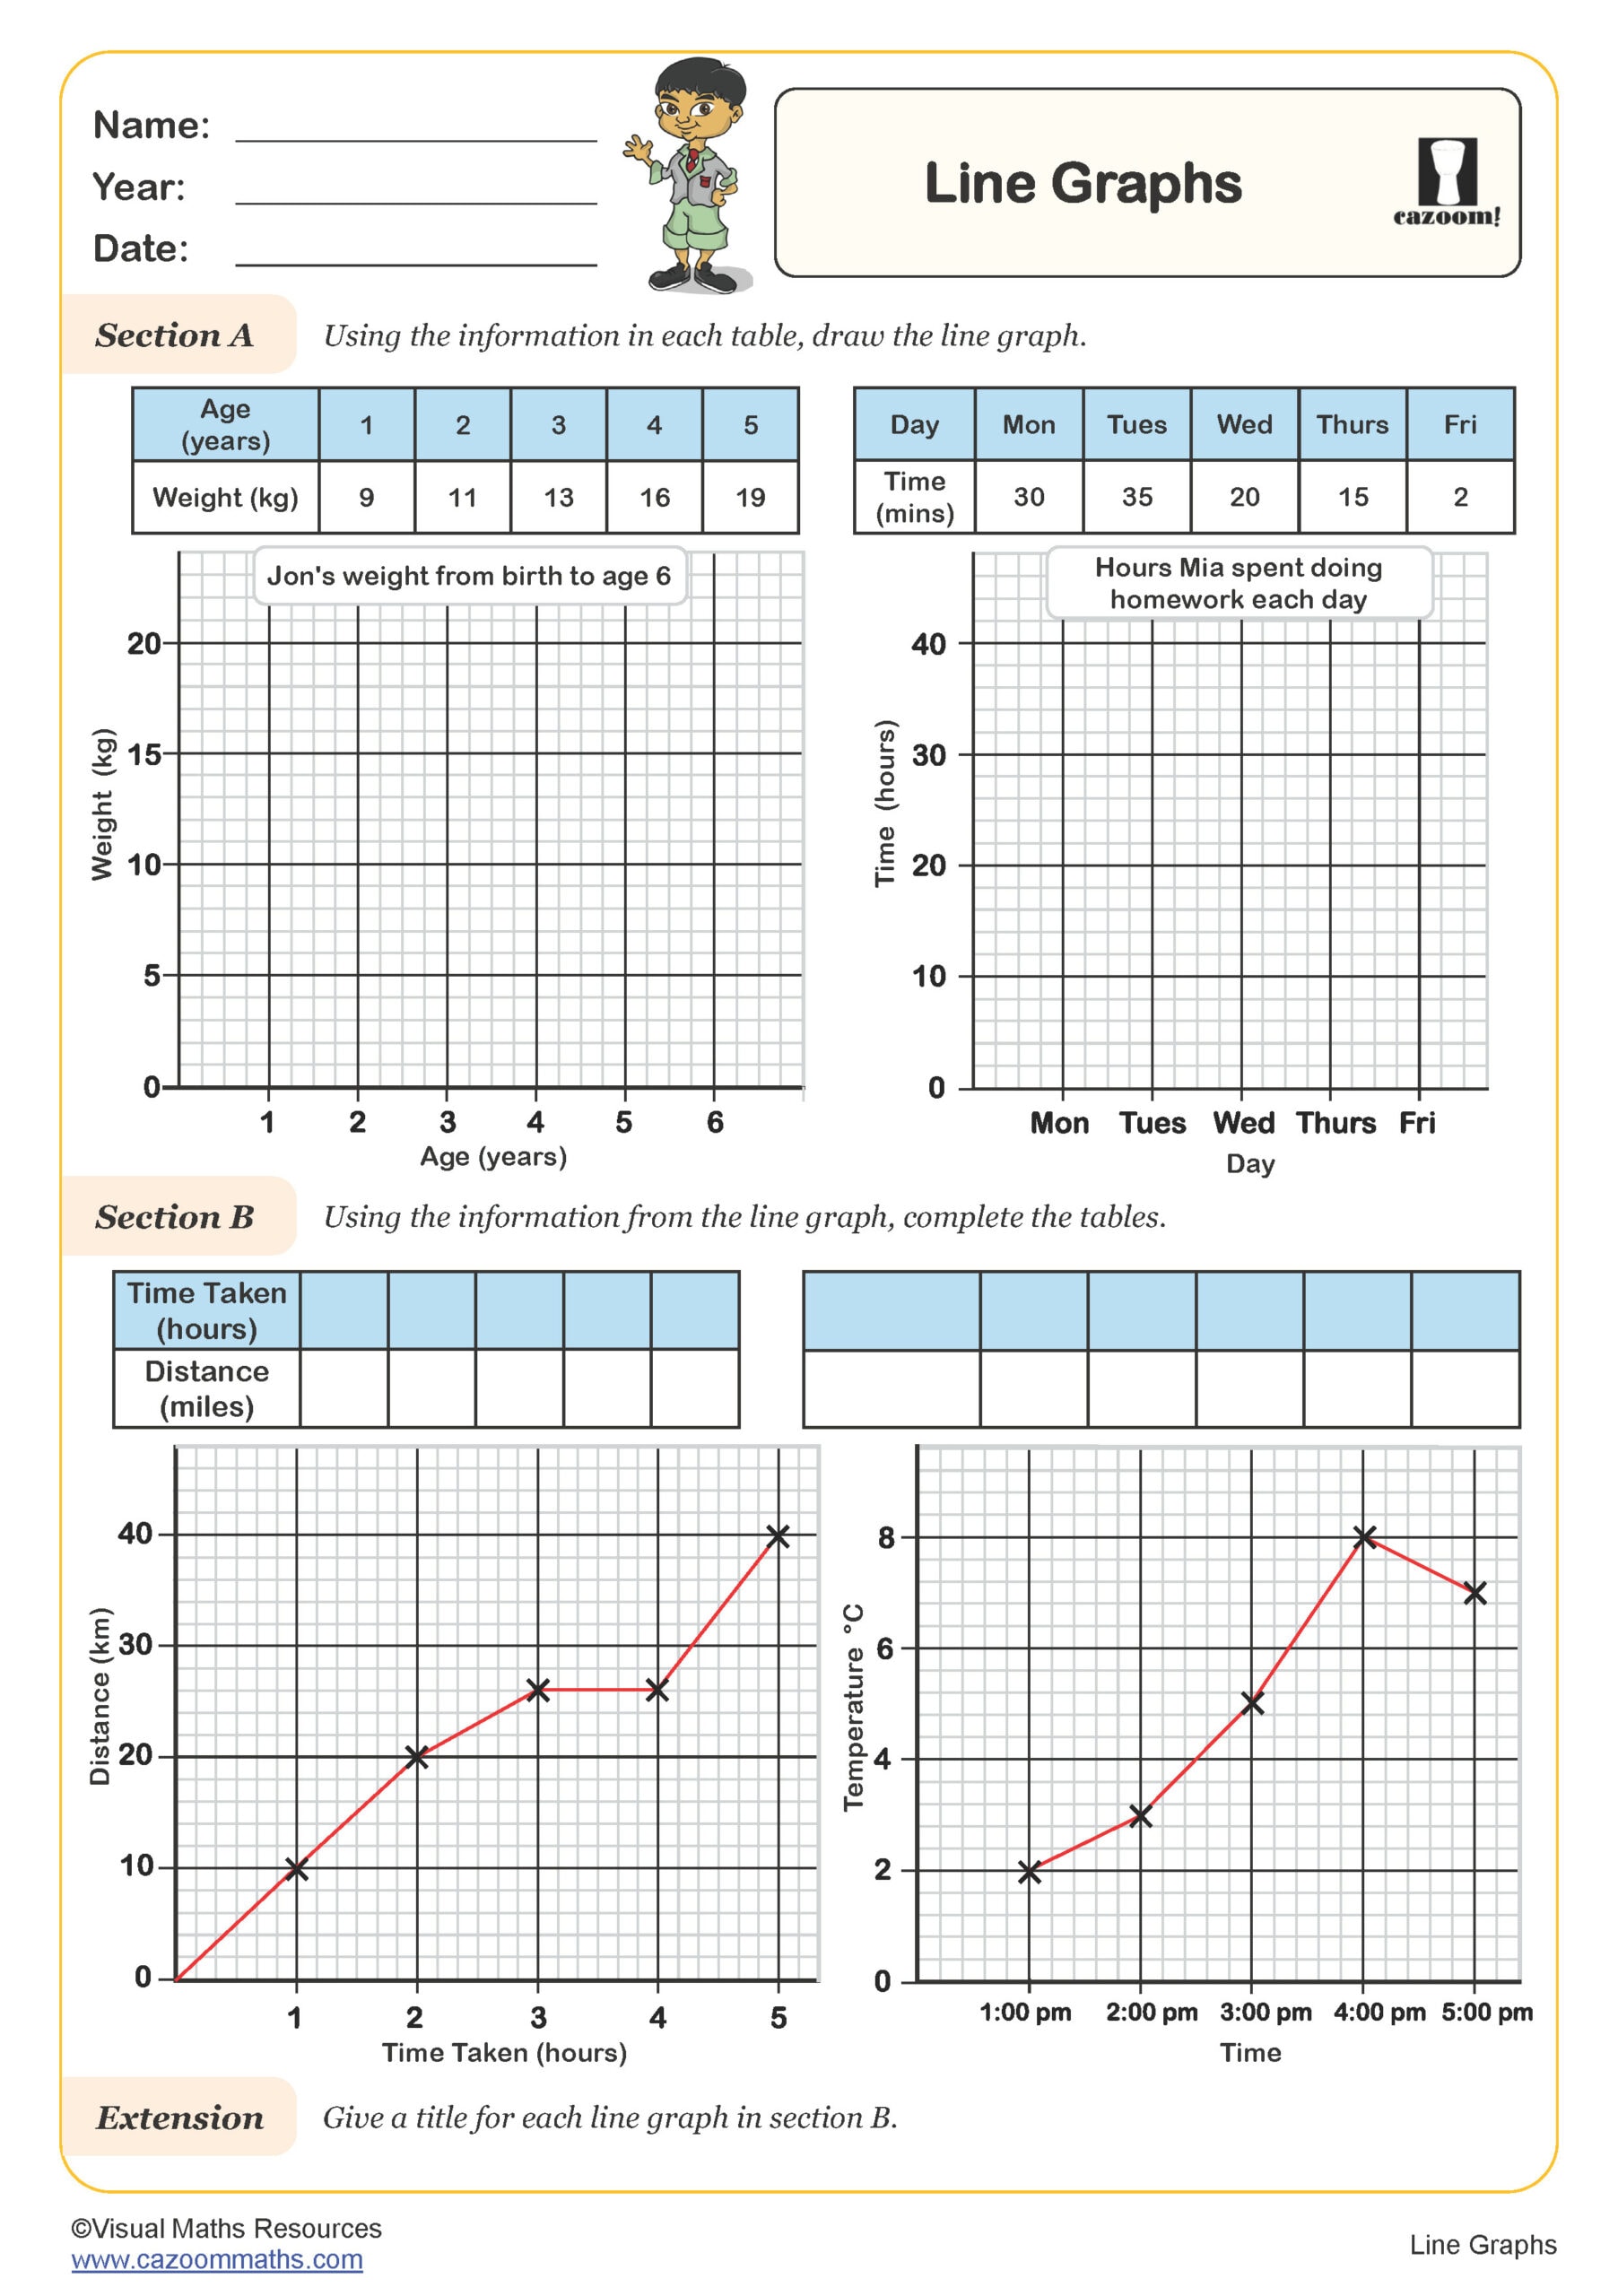
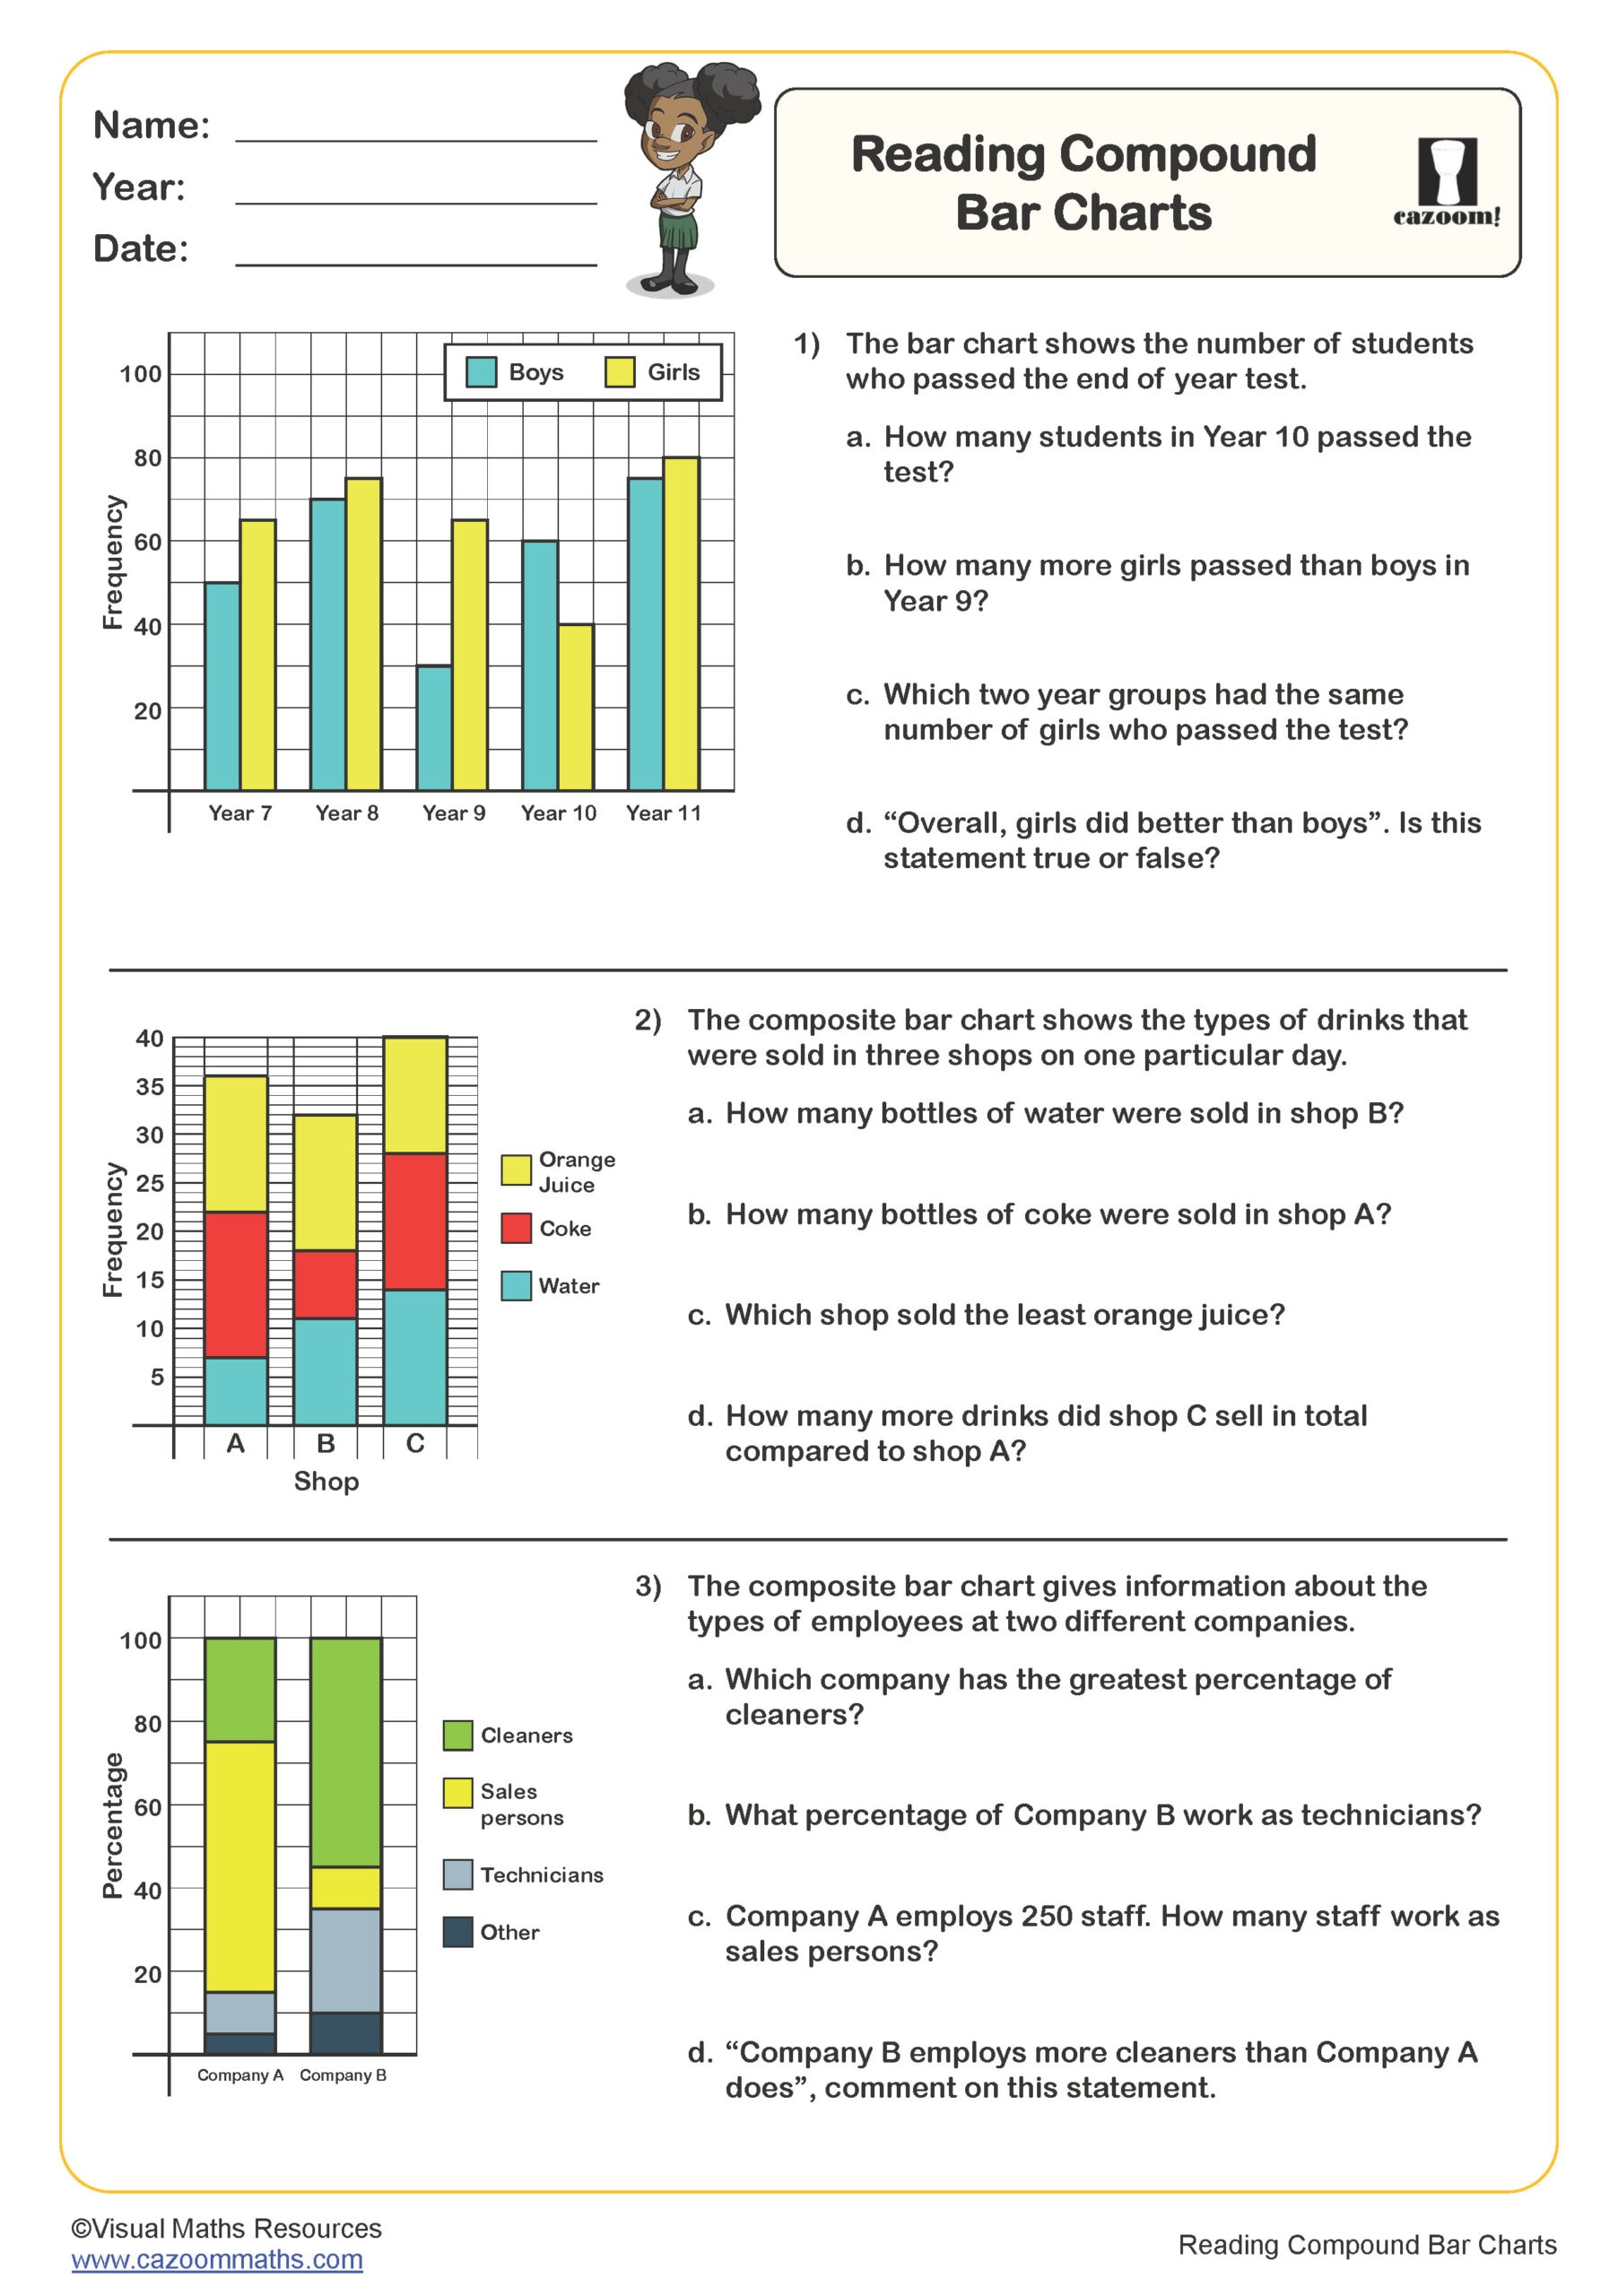
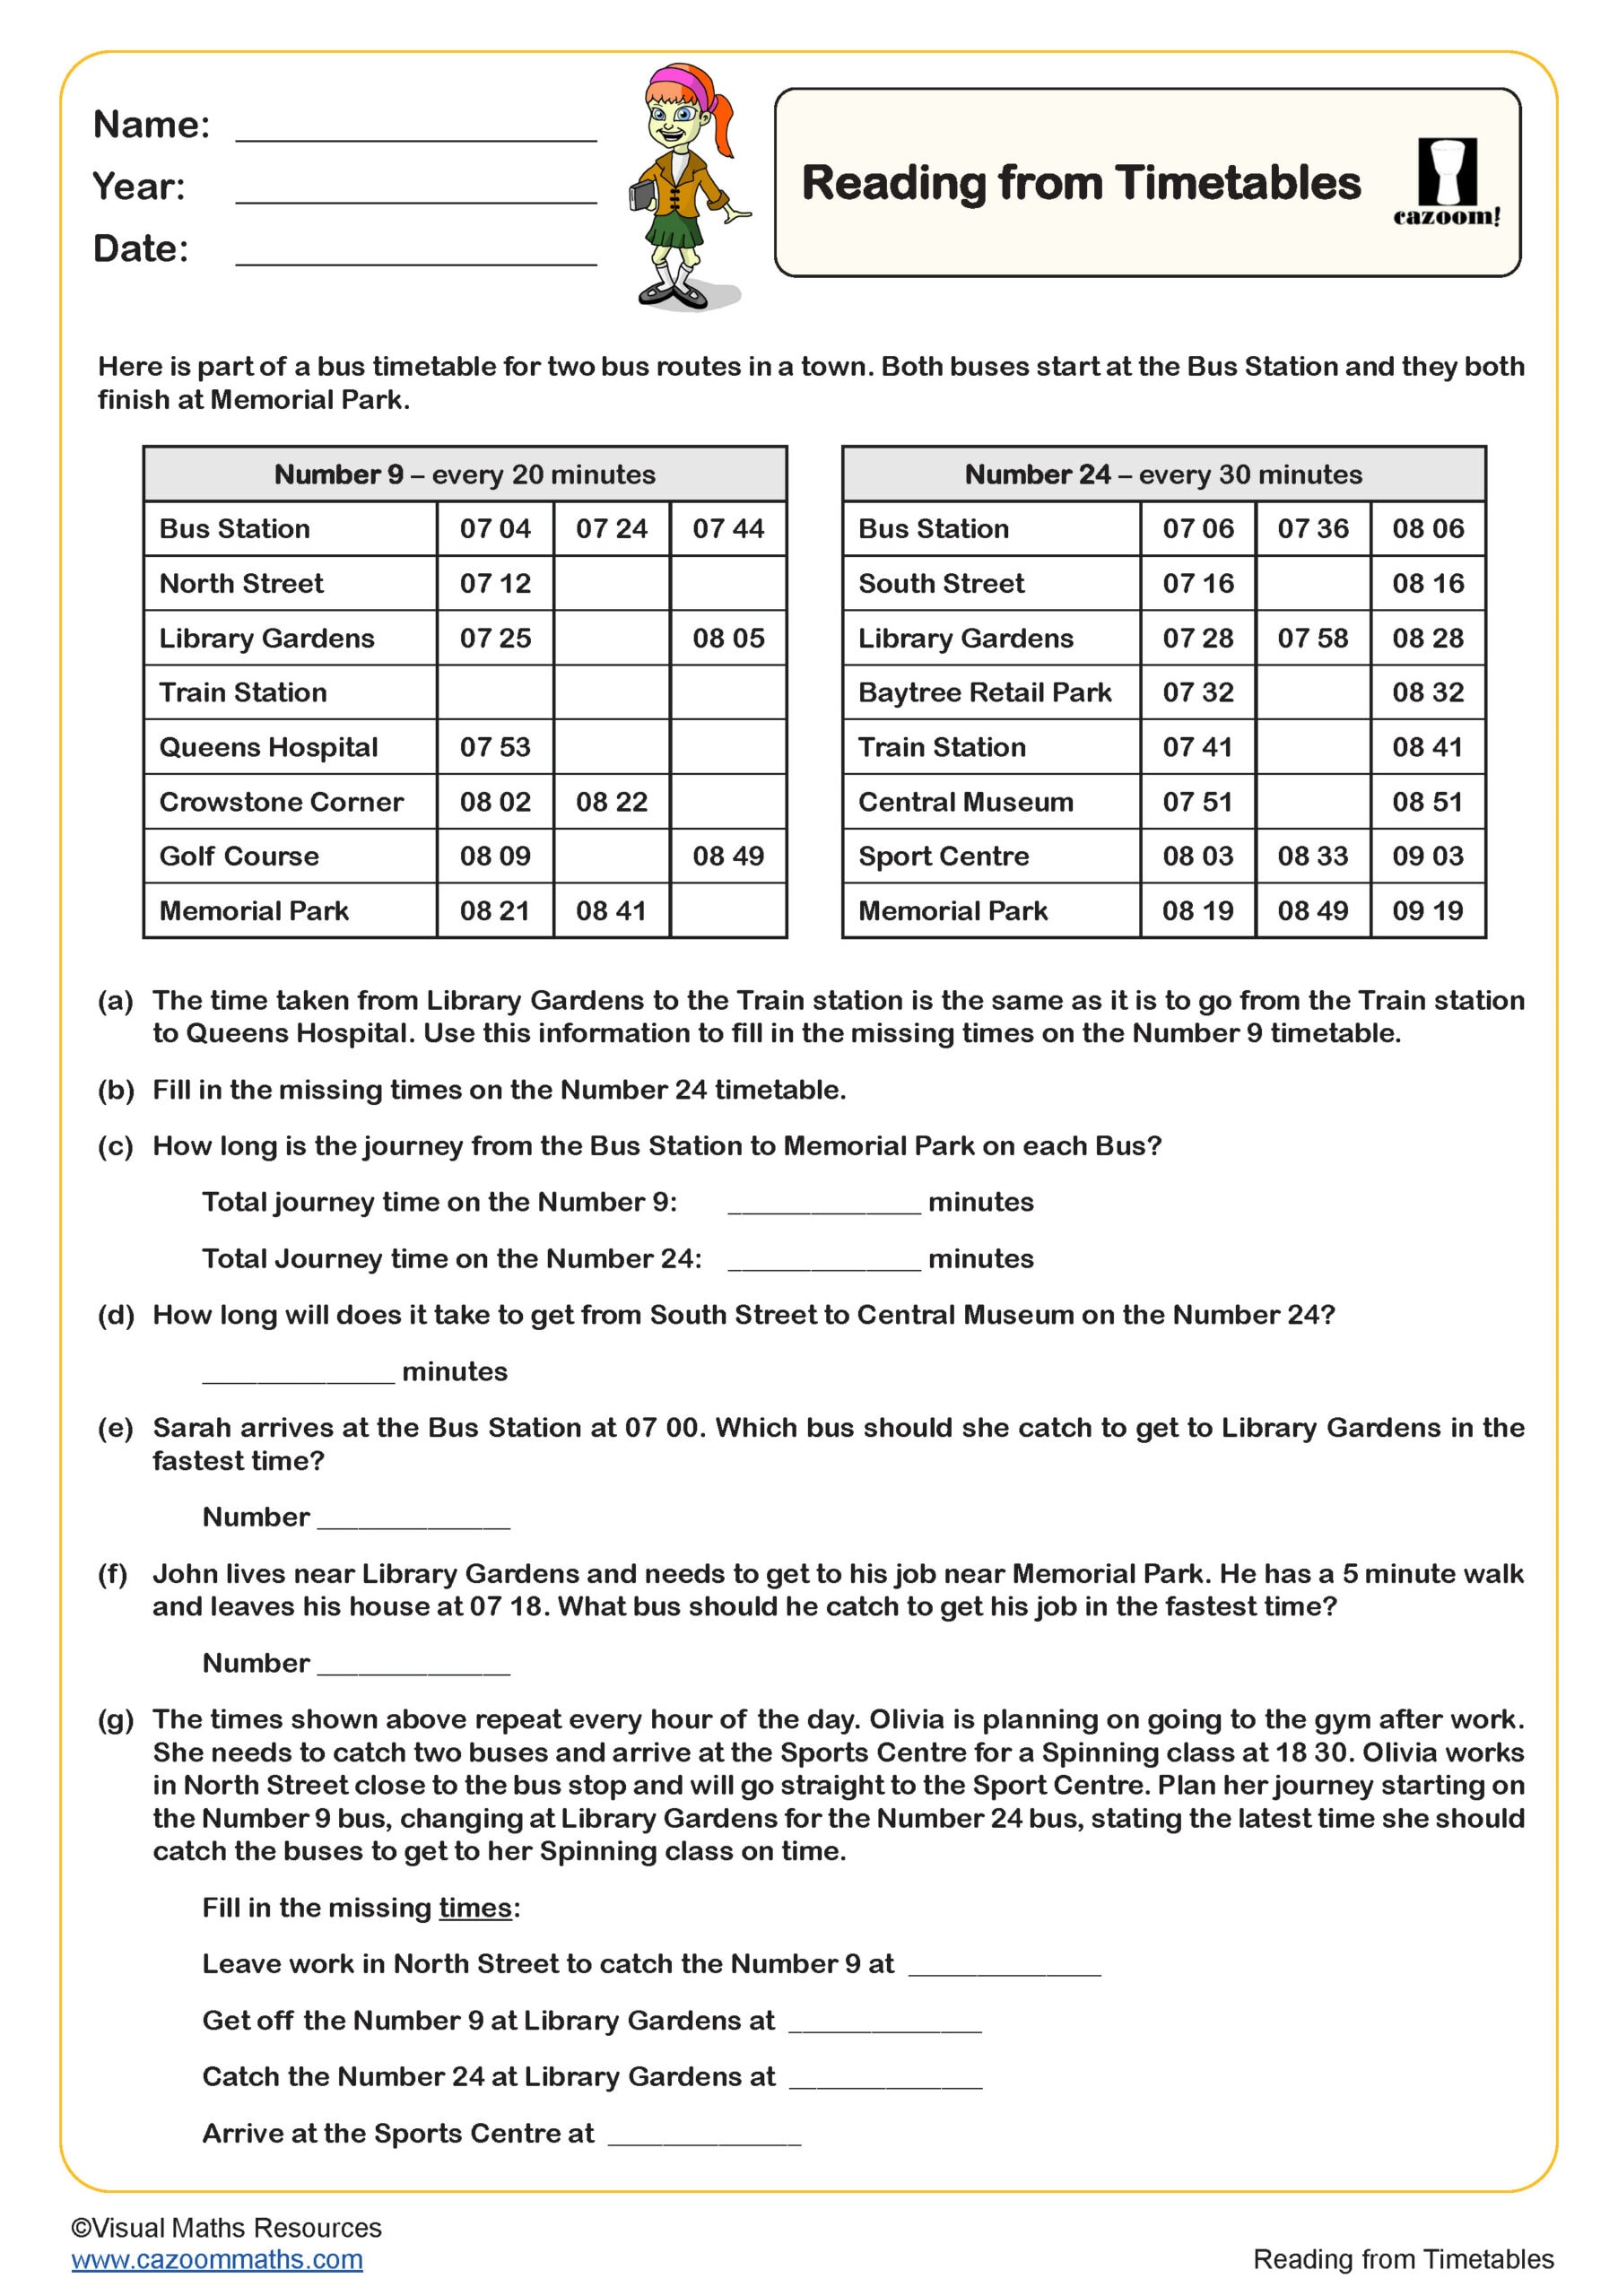
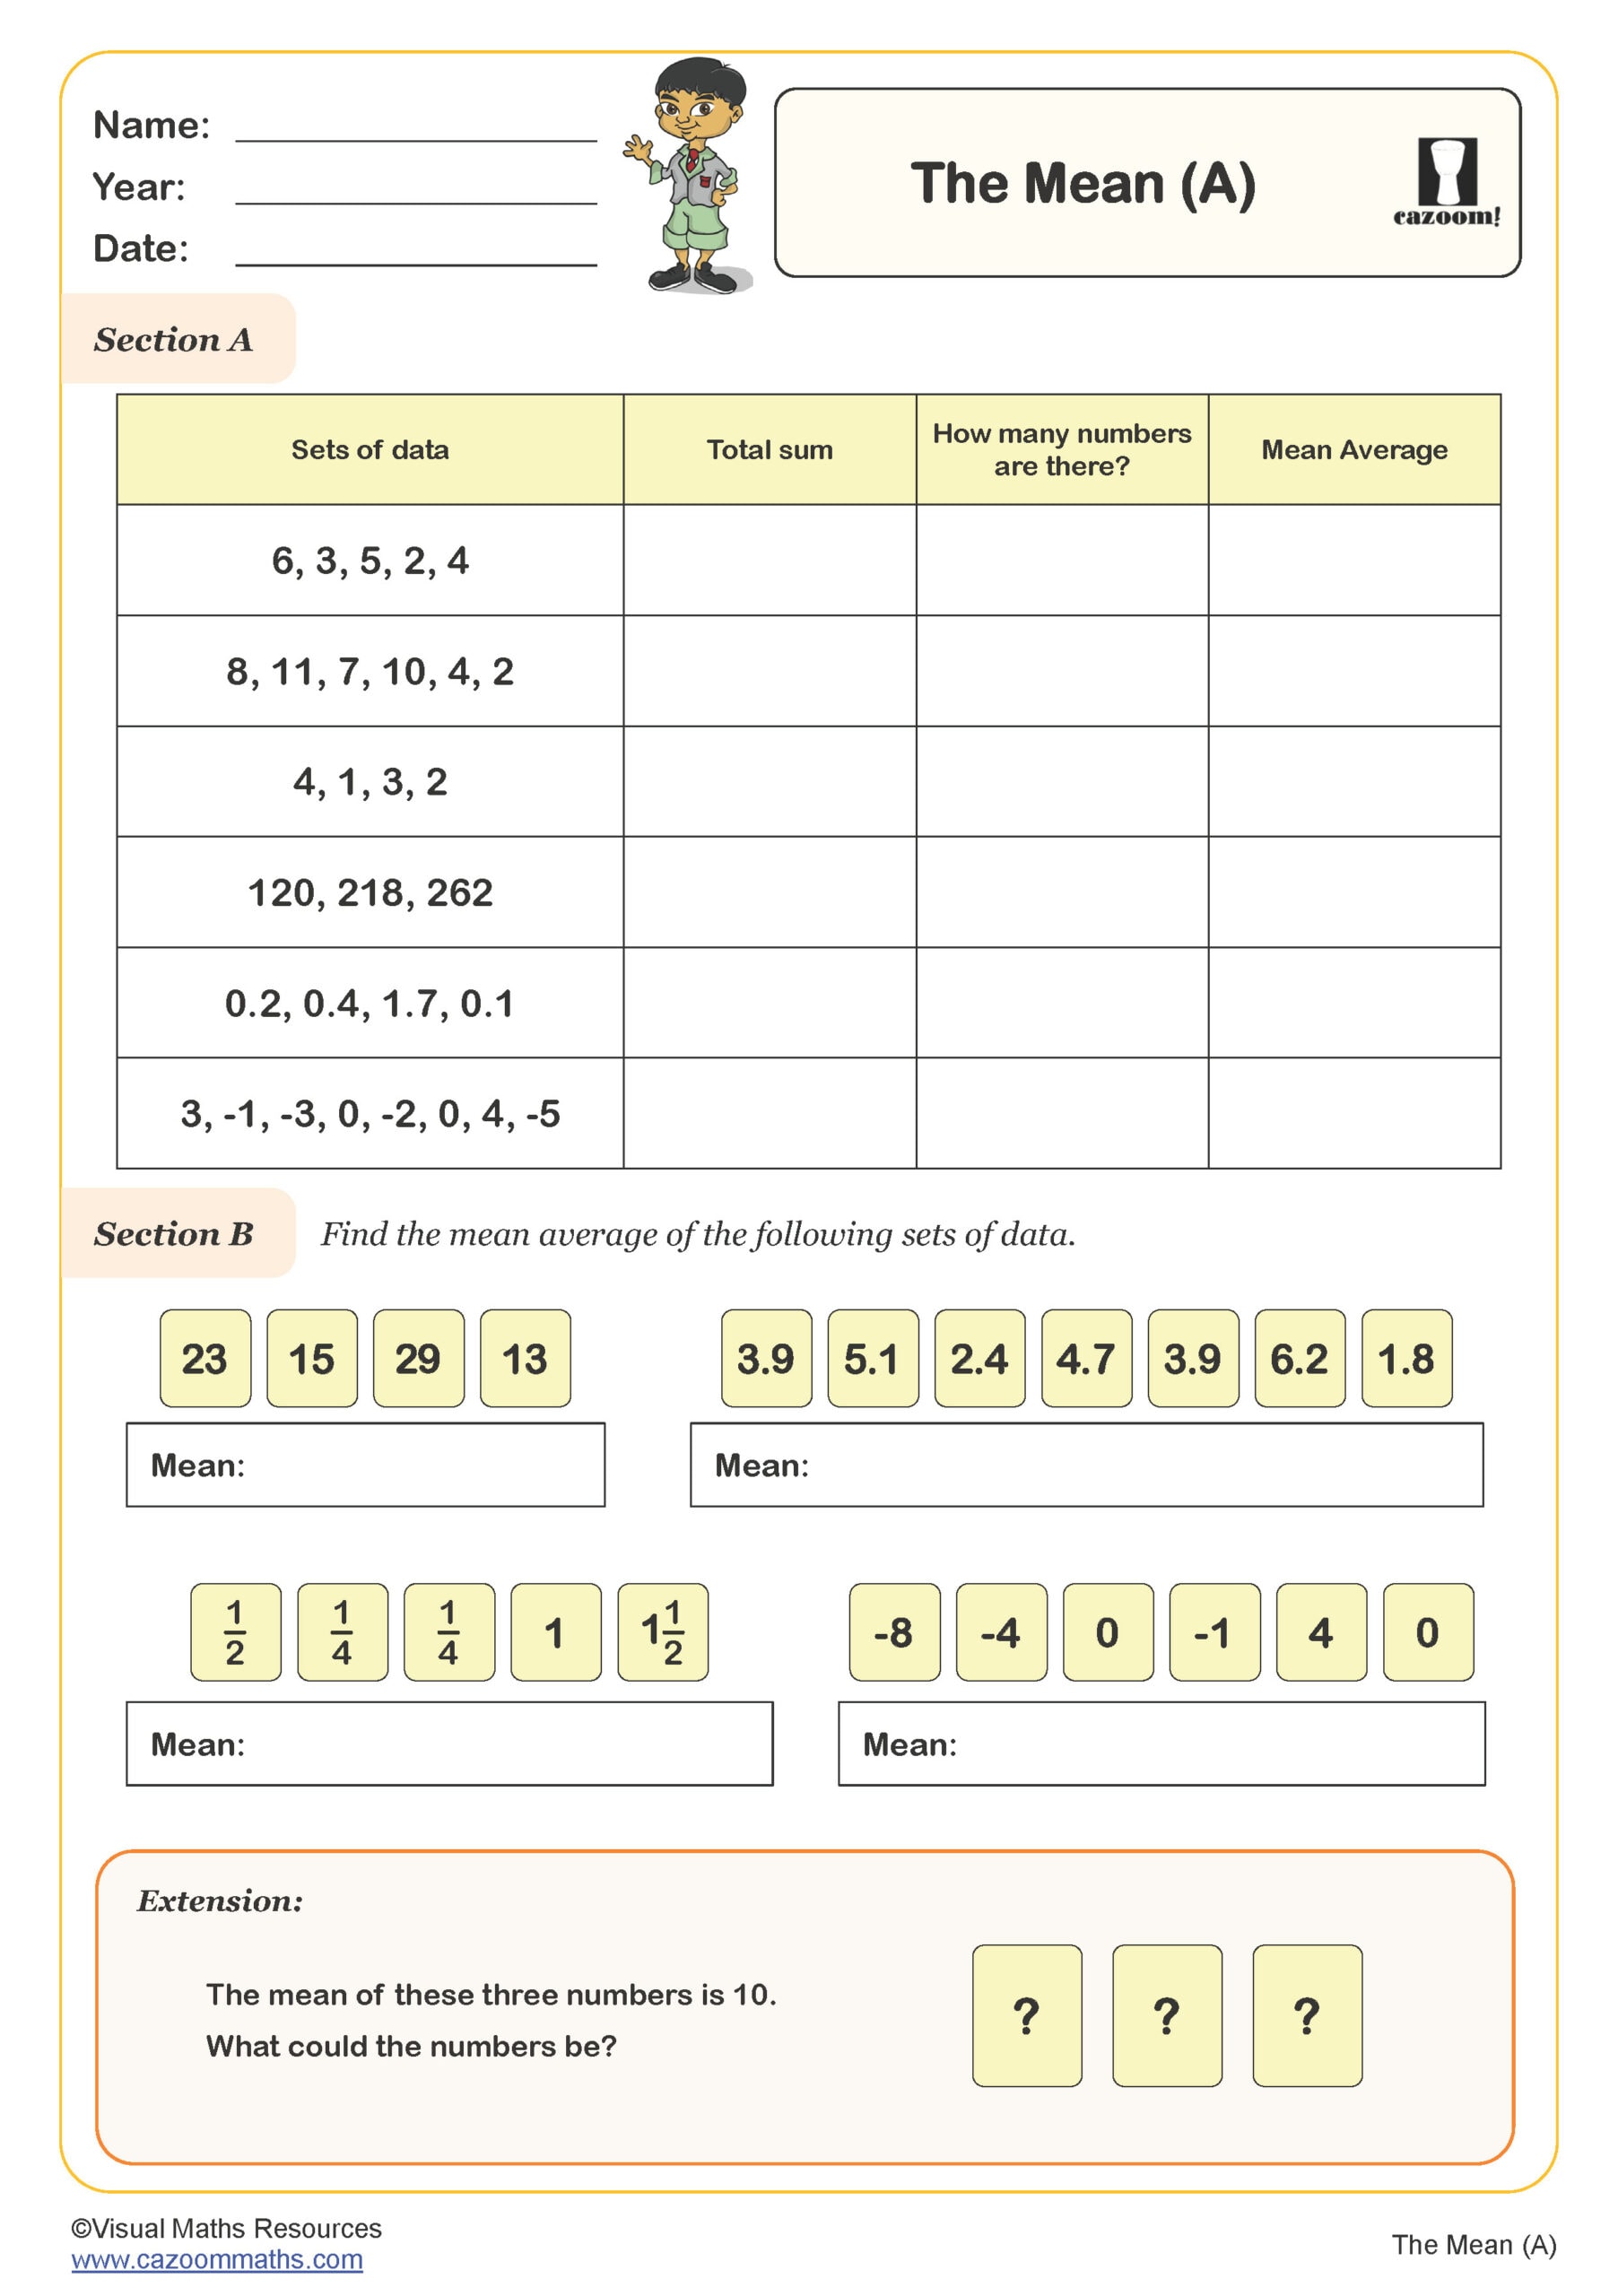
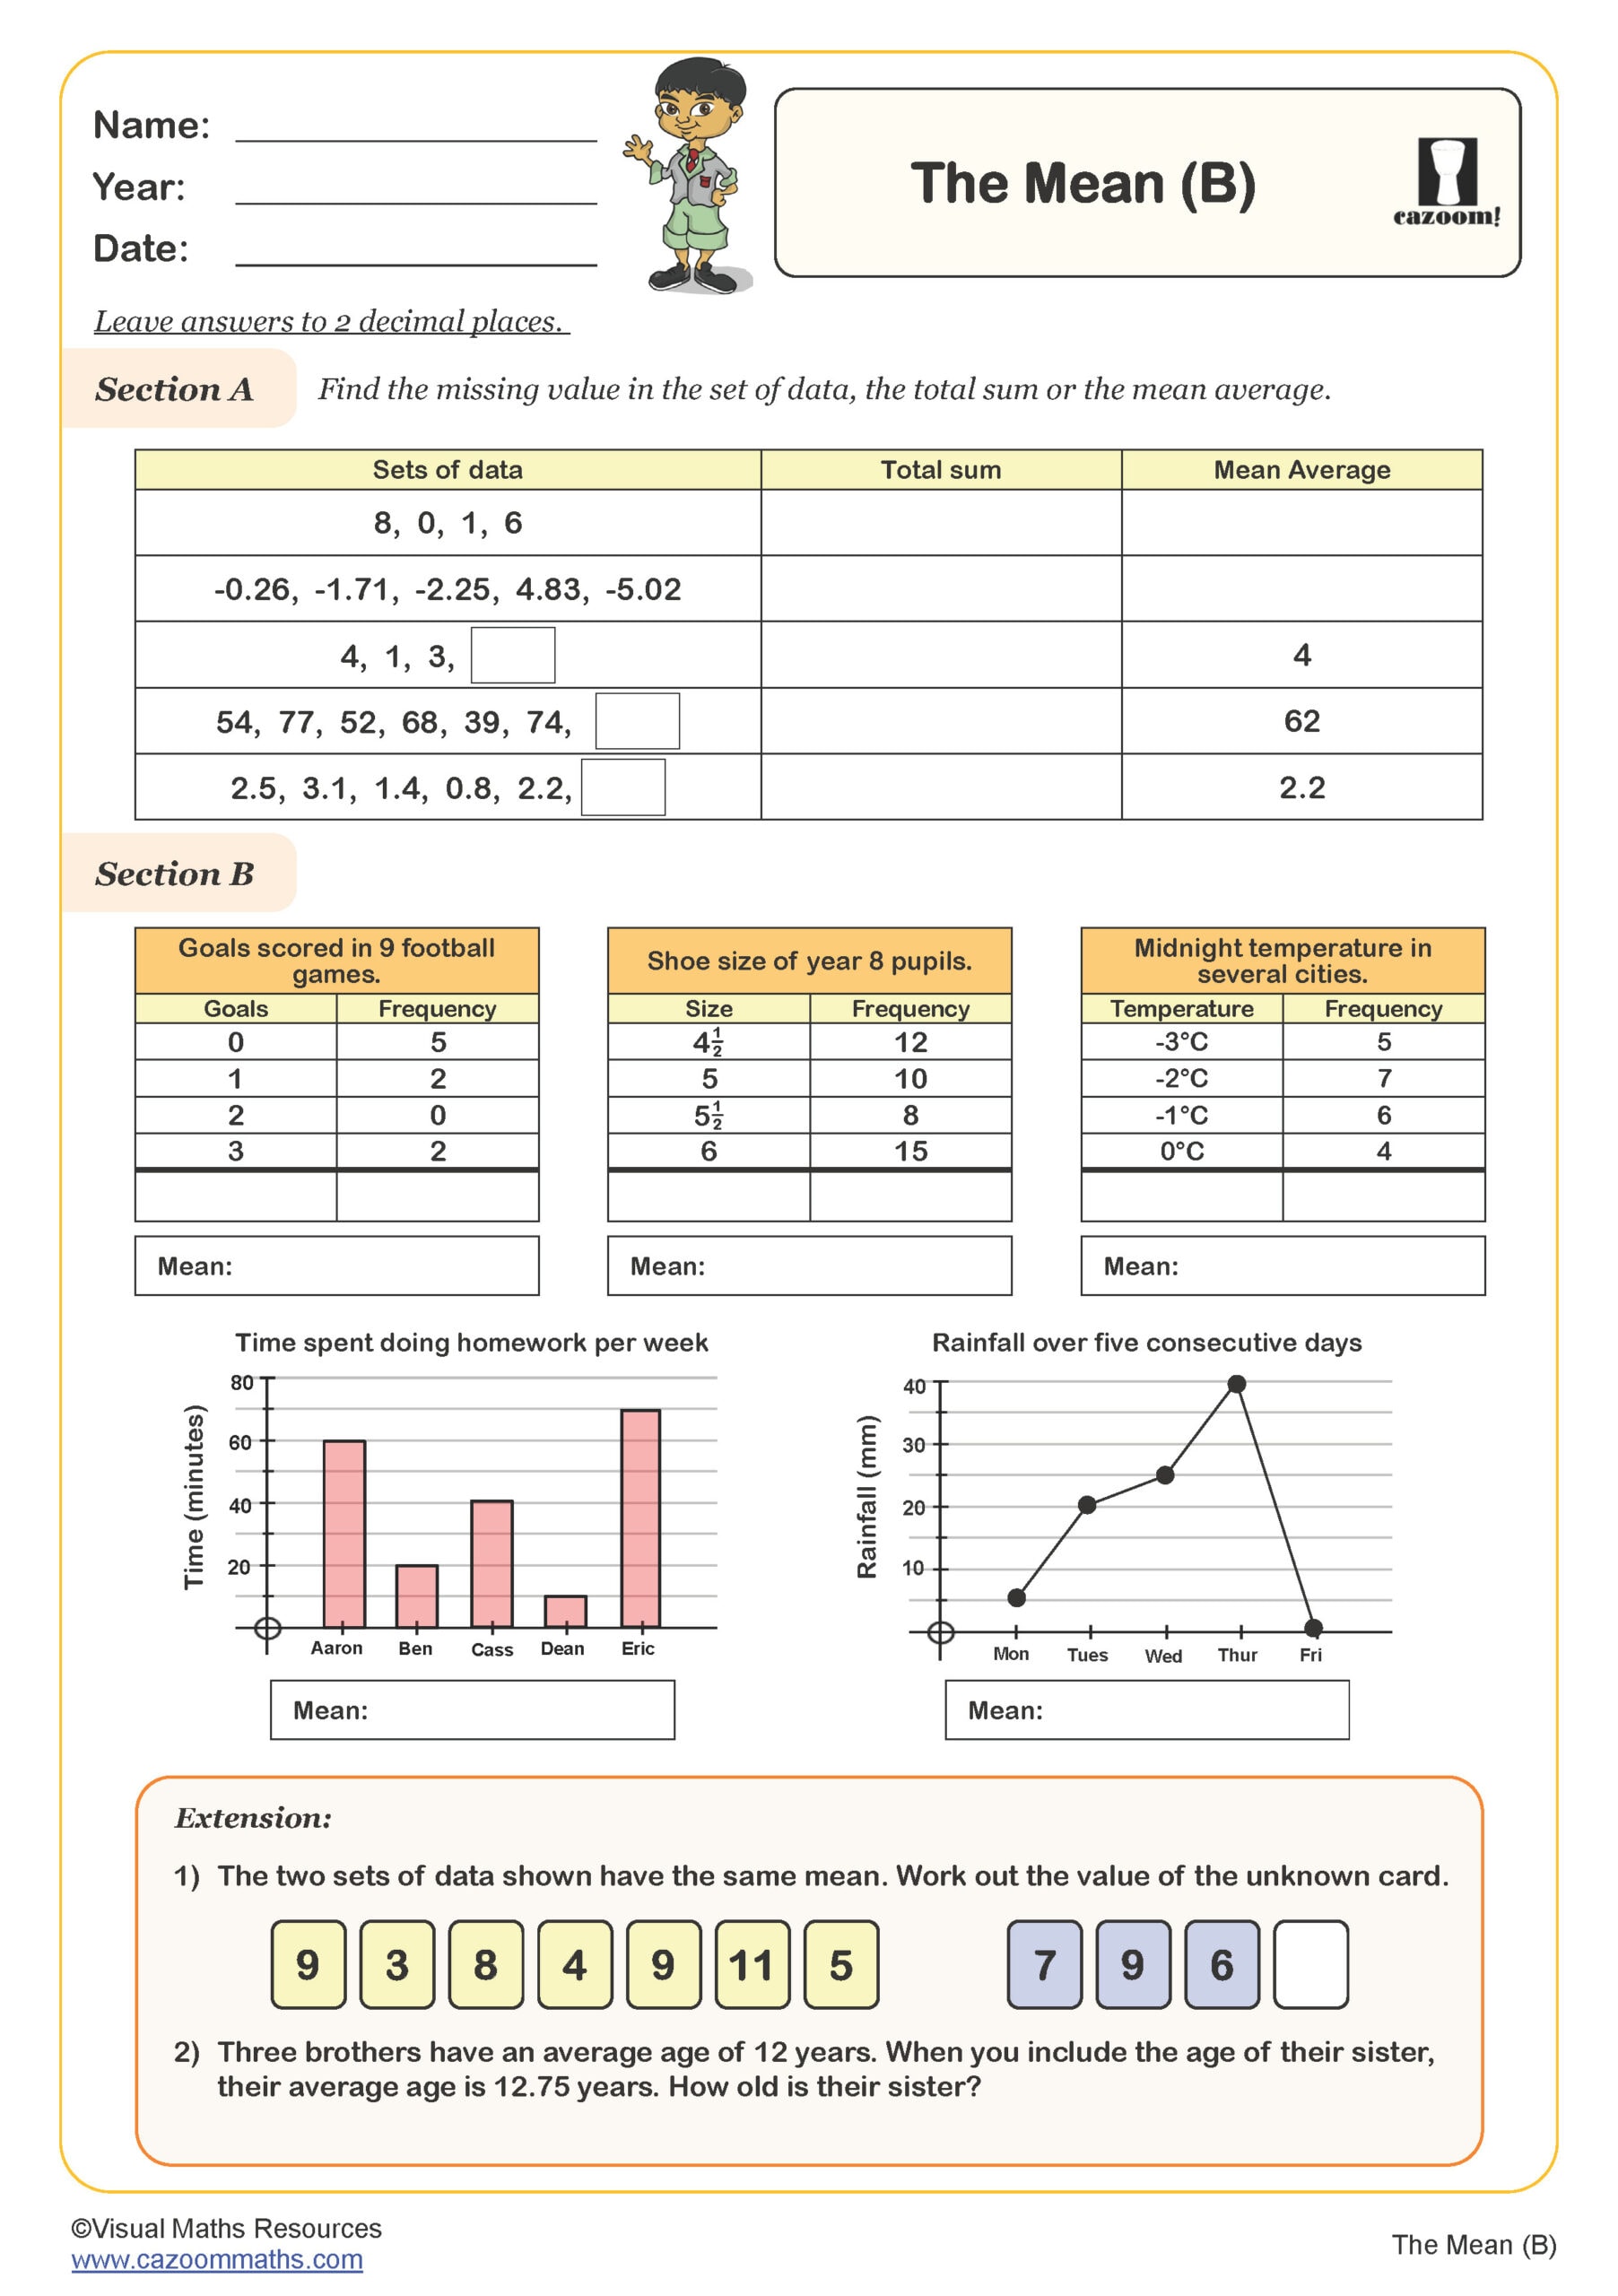
By Years 5 and 6, students tackle more complex statistical concepts including line graphs for continuous data, pie charts, and calculating averages. They learn to solve comparison and sum-difference problems using information from graphs and tables, developing the critical thinking skills needed for GCSE mathematics. Understanding when to use different types of charts and graphs becomes equally important as constructing them accurately.
Which Year Groups Are These Statistics Worksheets Suitable For?
These statistics worksheets cover the complete Key Stage 2 curriculum from Year 3 through to Year 6. The collection addresses age-appropriate objectives at each stage, ensuring proper progression through the statistics strand of the National Curriculum. Year 3 and 4 worksheets focus on foundational skills like pictograms and bar charts with suitable scales.
Year 5 and 6 resources introduce more advanced representations including line graphs and pie charts, alongside calculations such as finding the mean. The worksheets match statutory requirements for each year group, making it straightforward to select appropriate materials whether you're teaching mixed-ability classes, planning differentiated lessons, or providing additional practise for pupils working above or below their expected standard.
How Do Pupils Learn to Interpret Pictograms and Bar Charts?
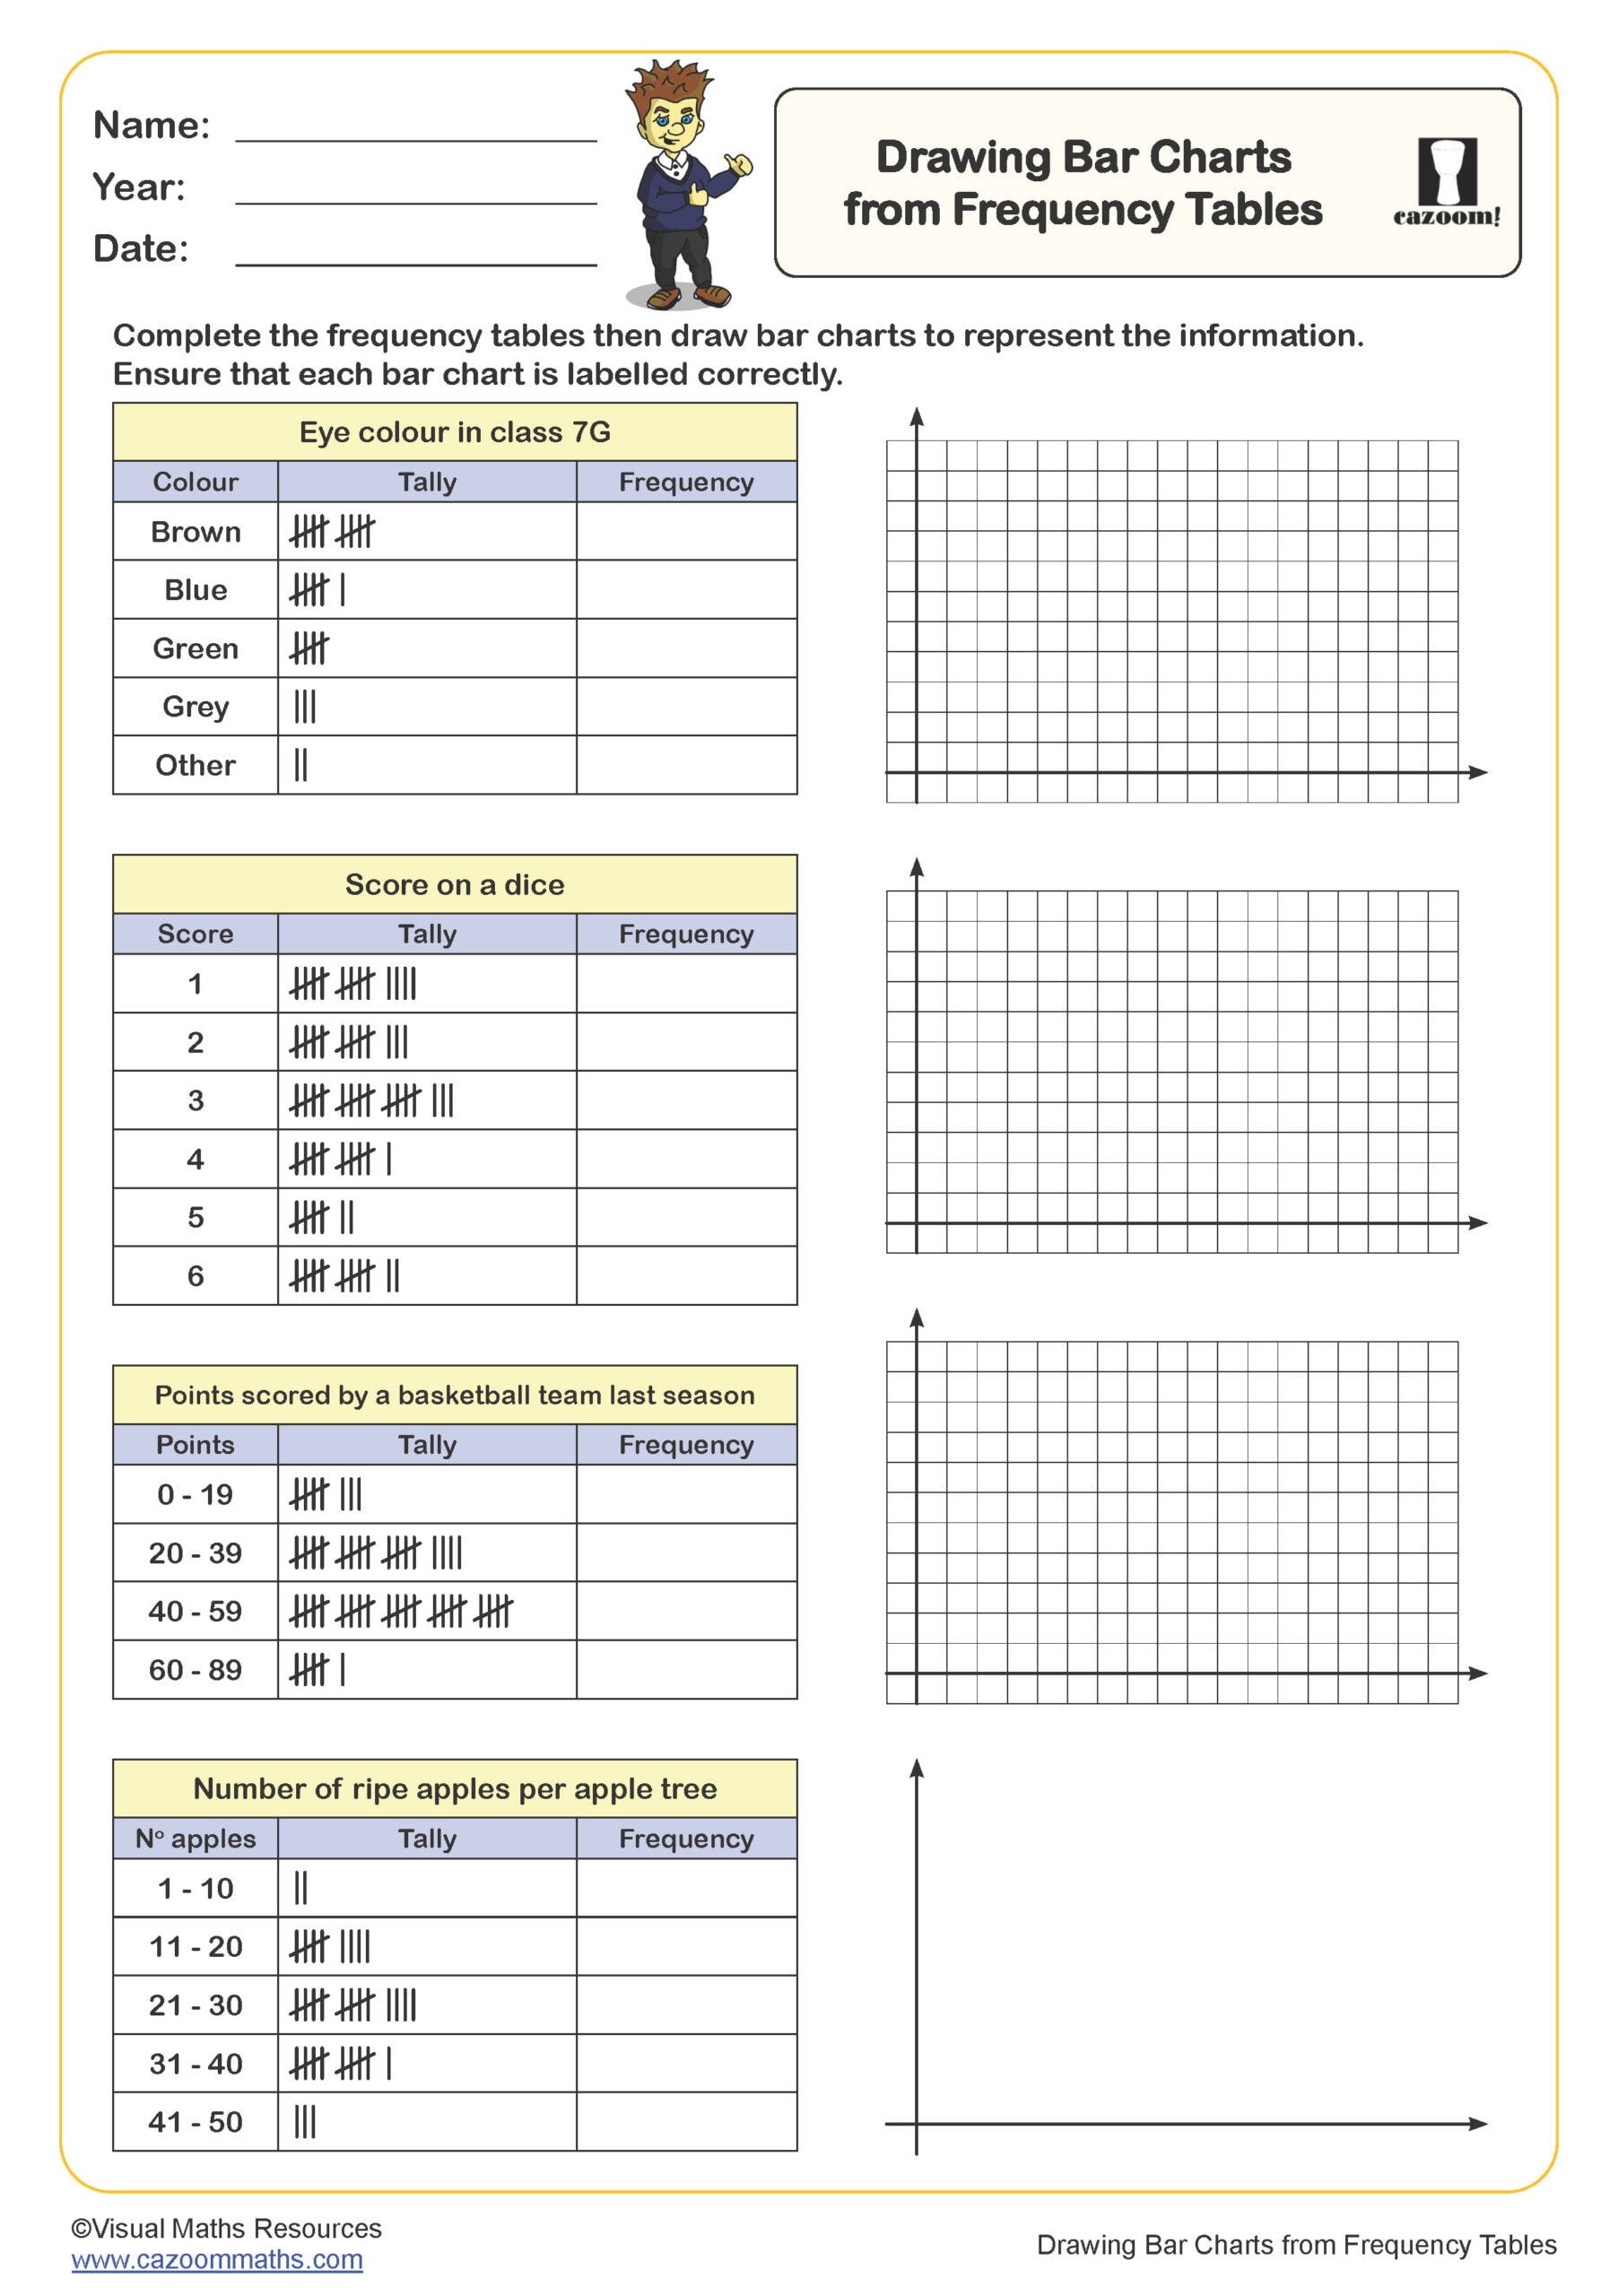
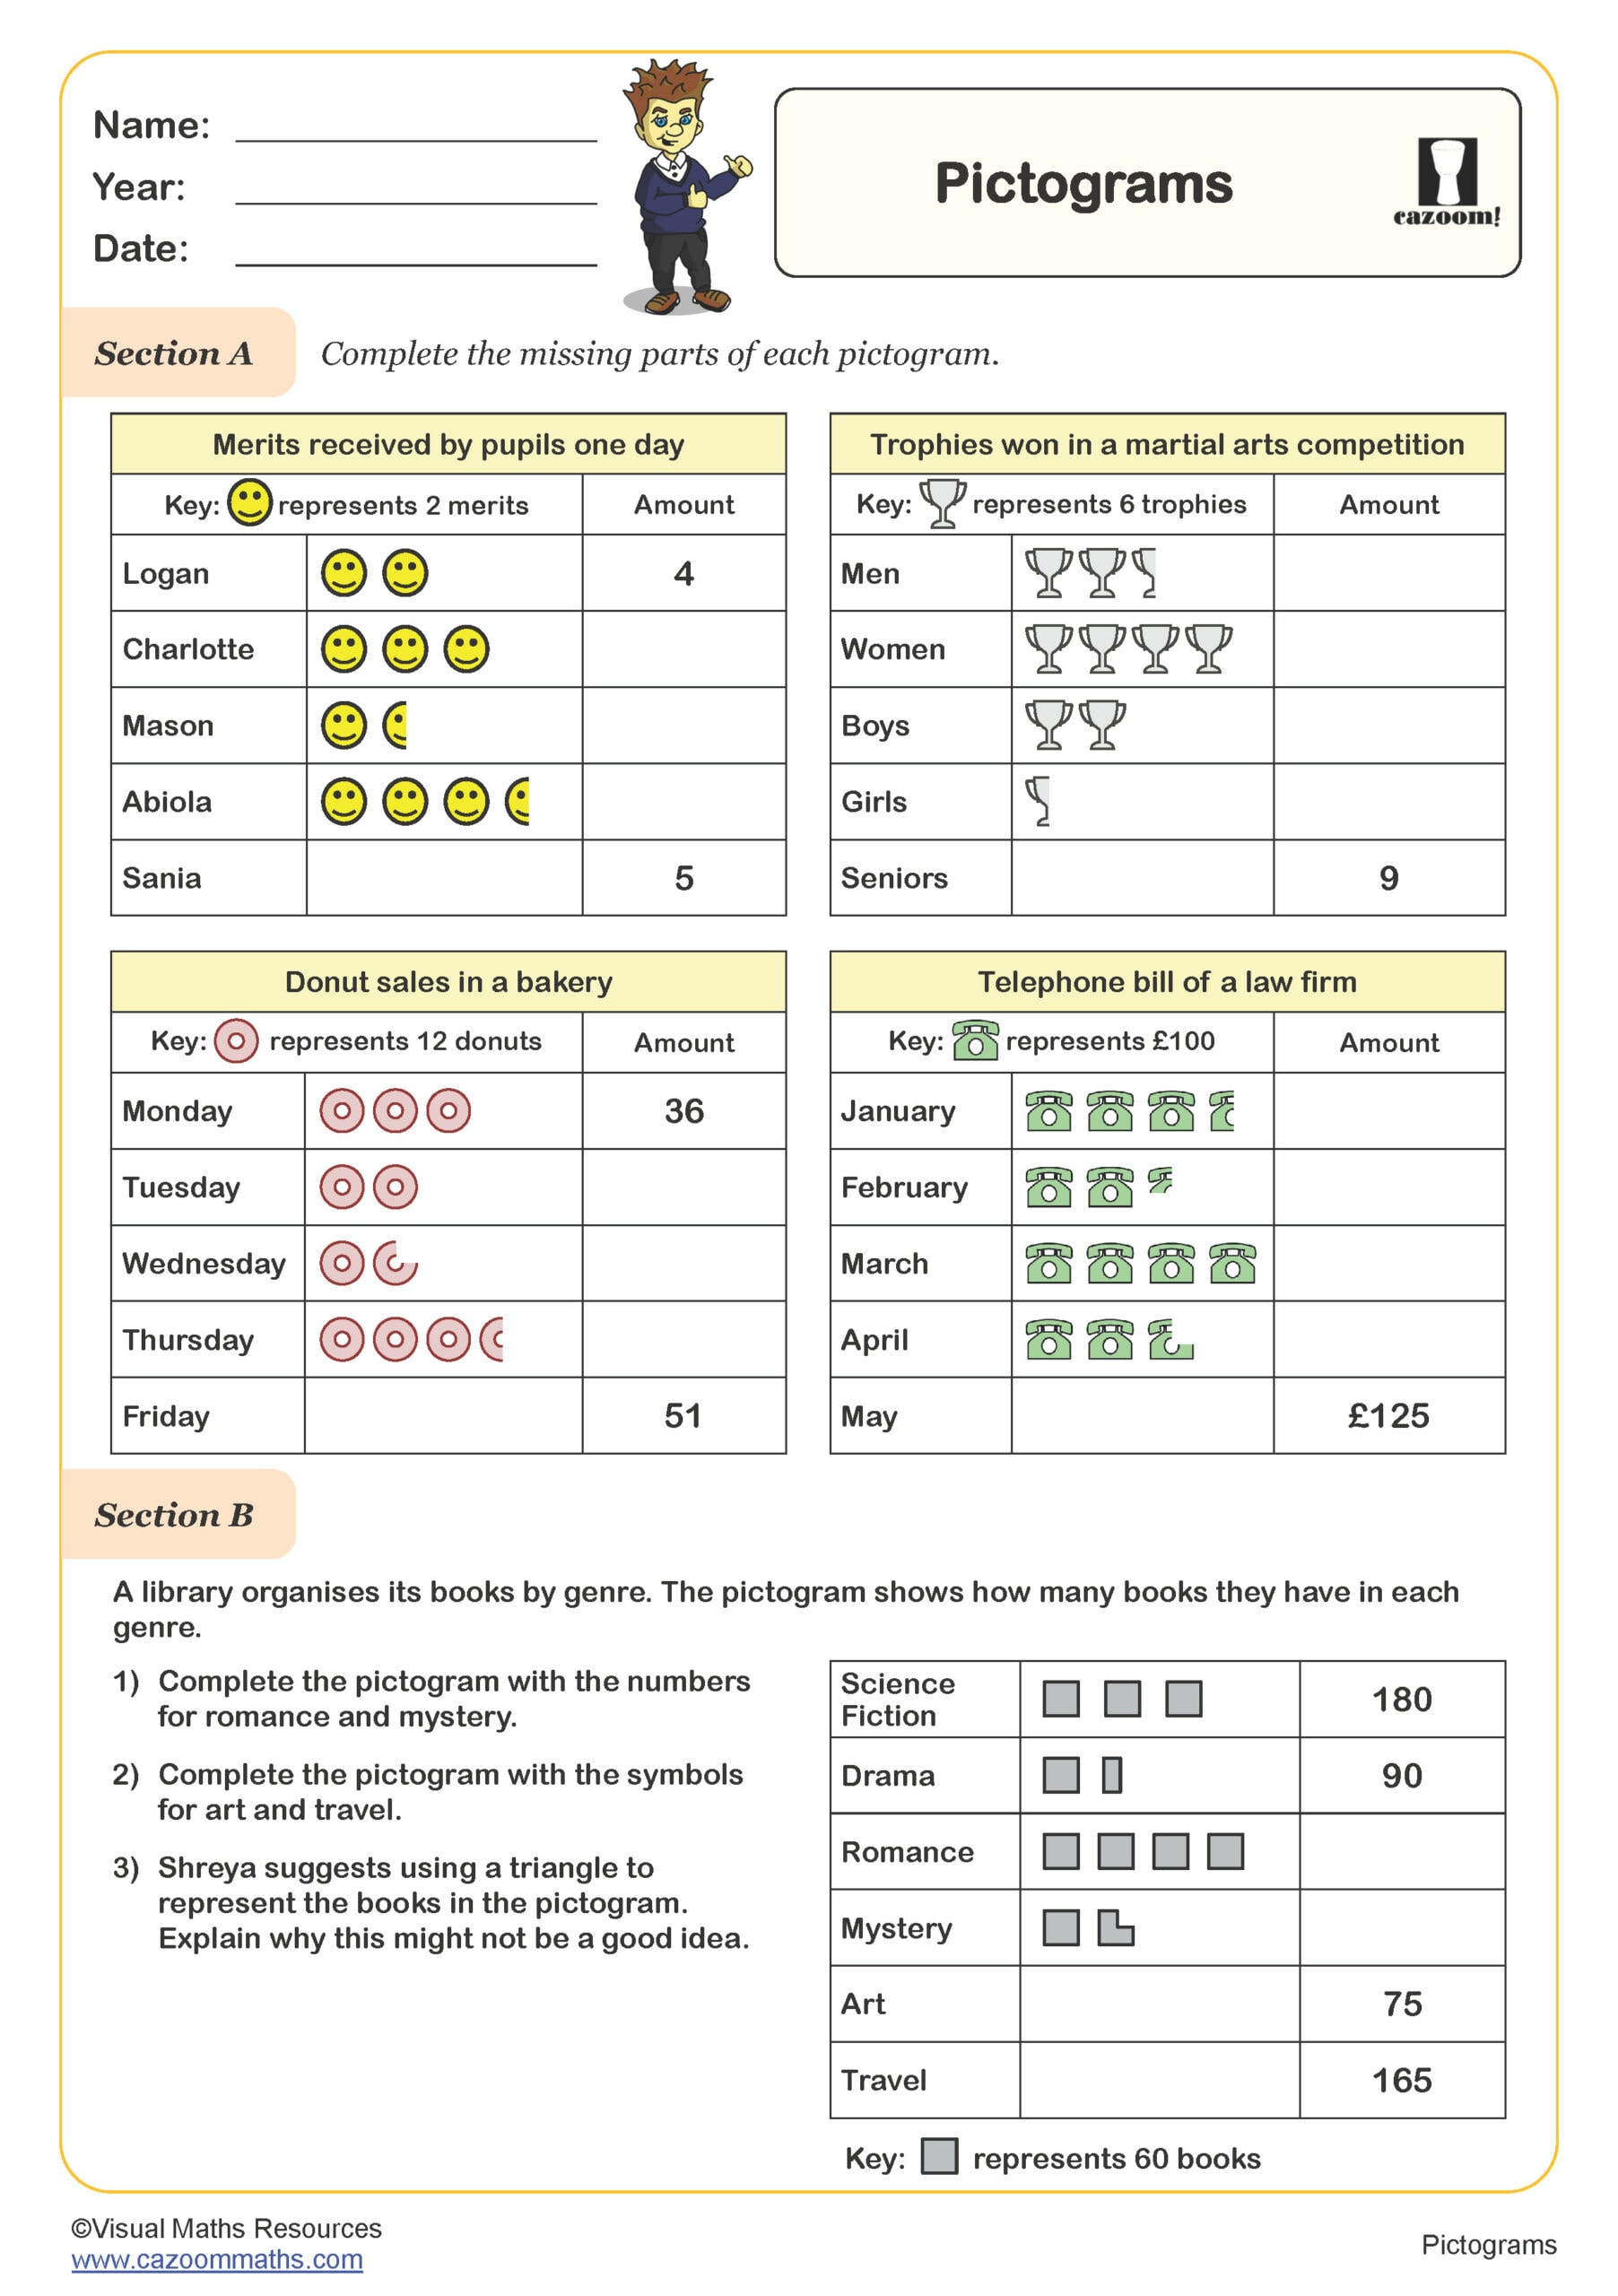
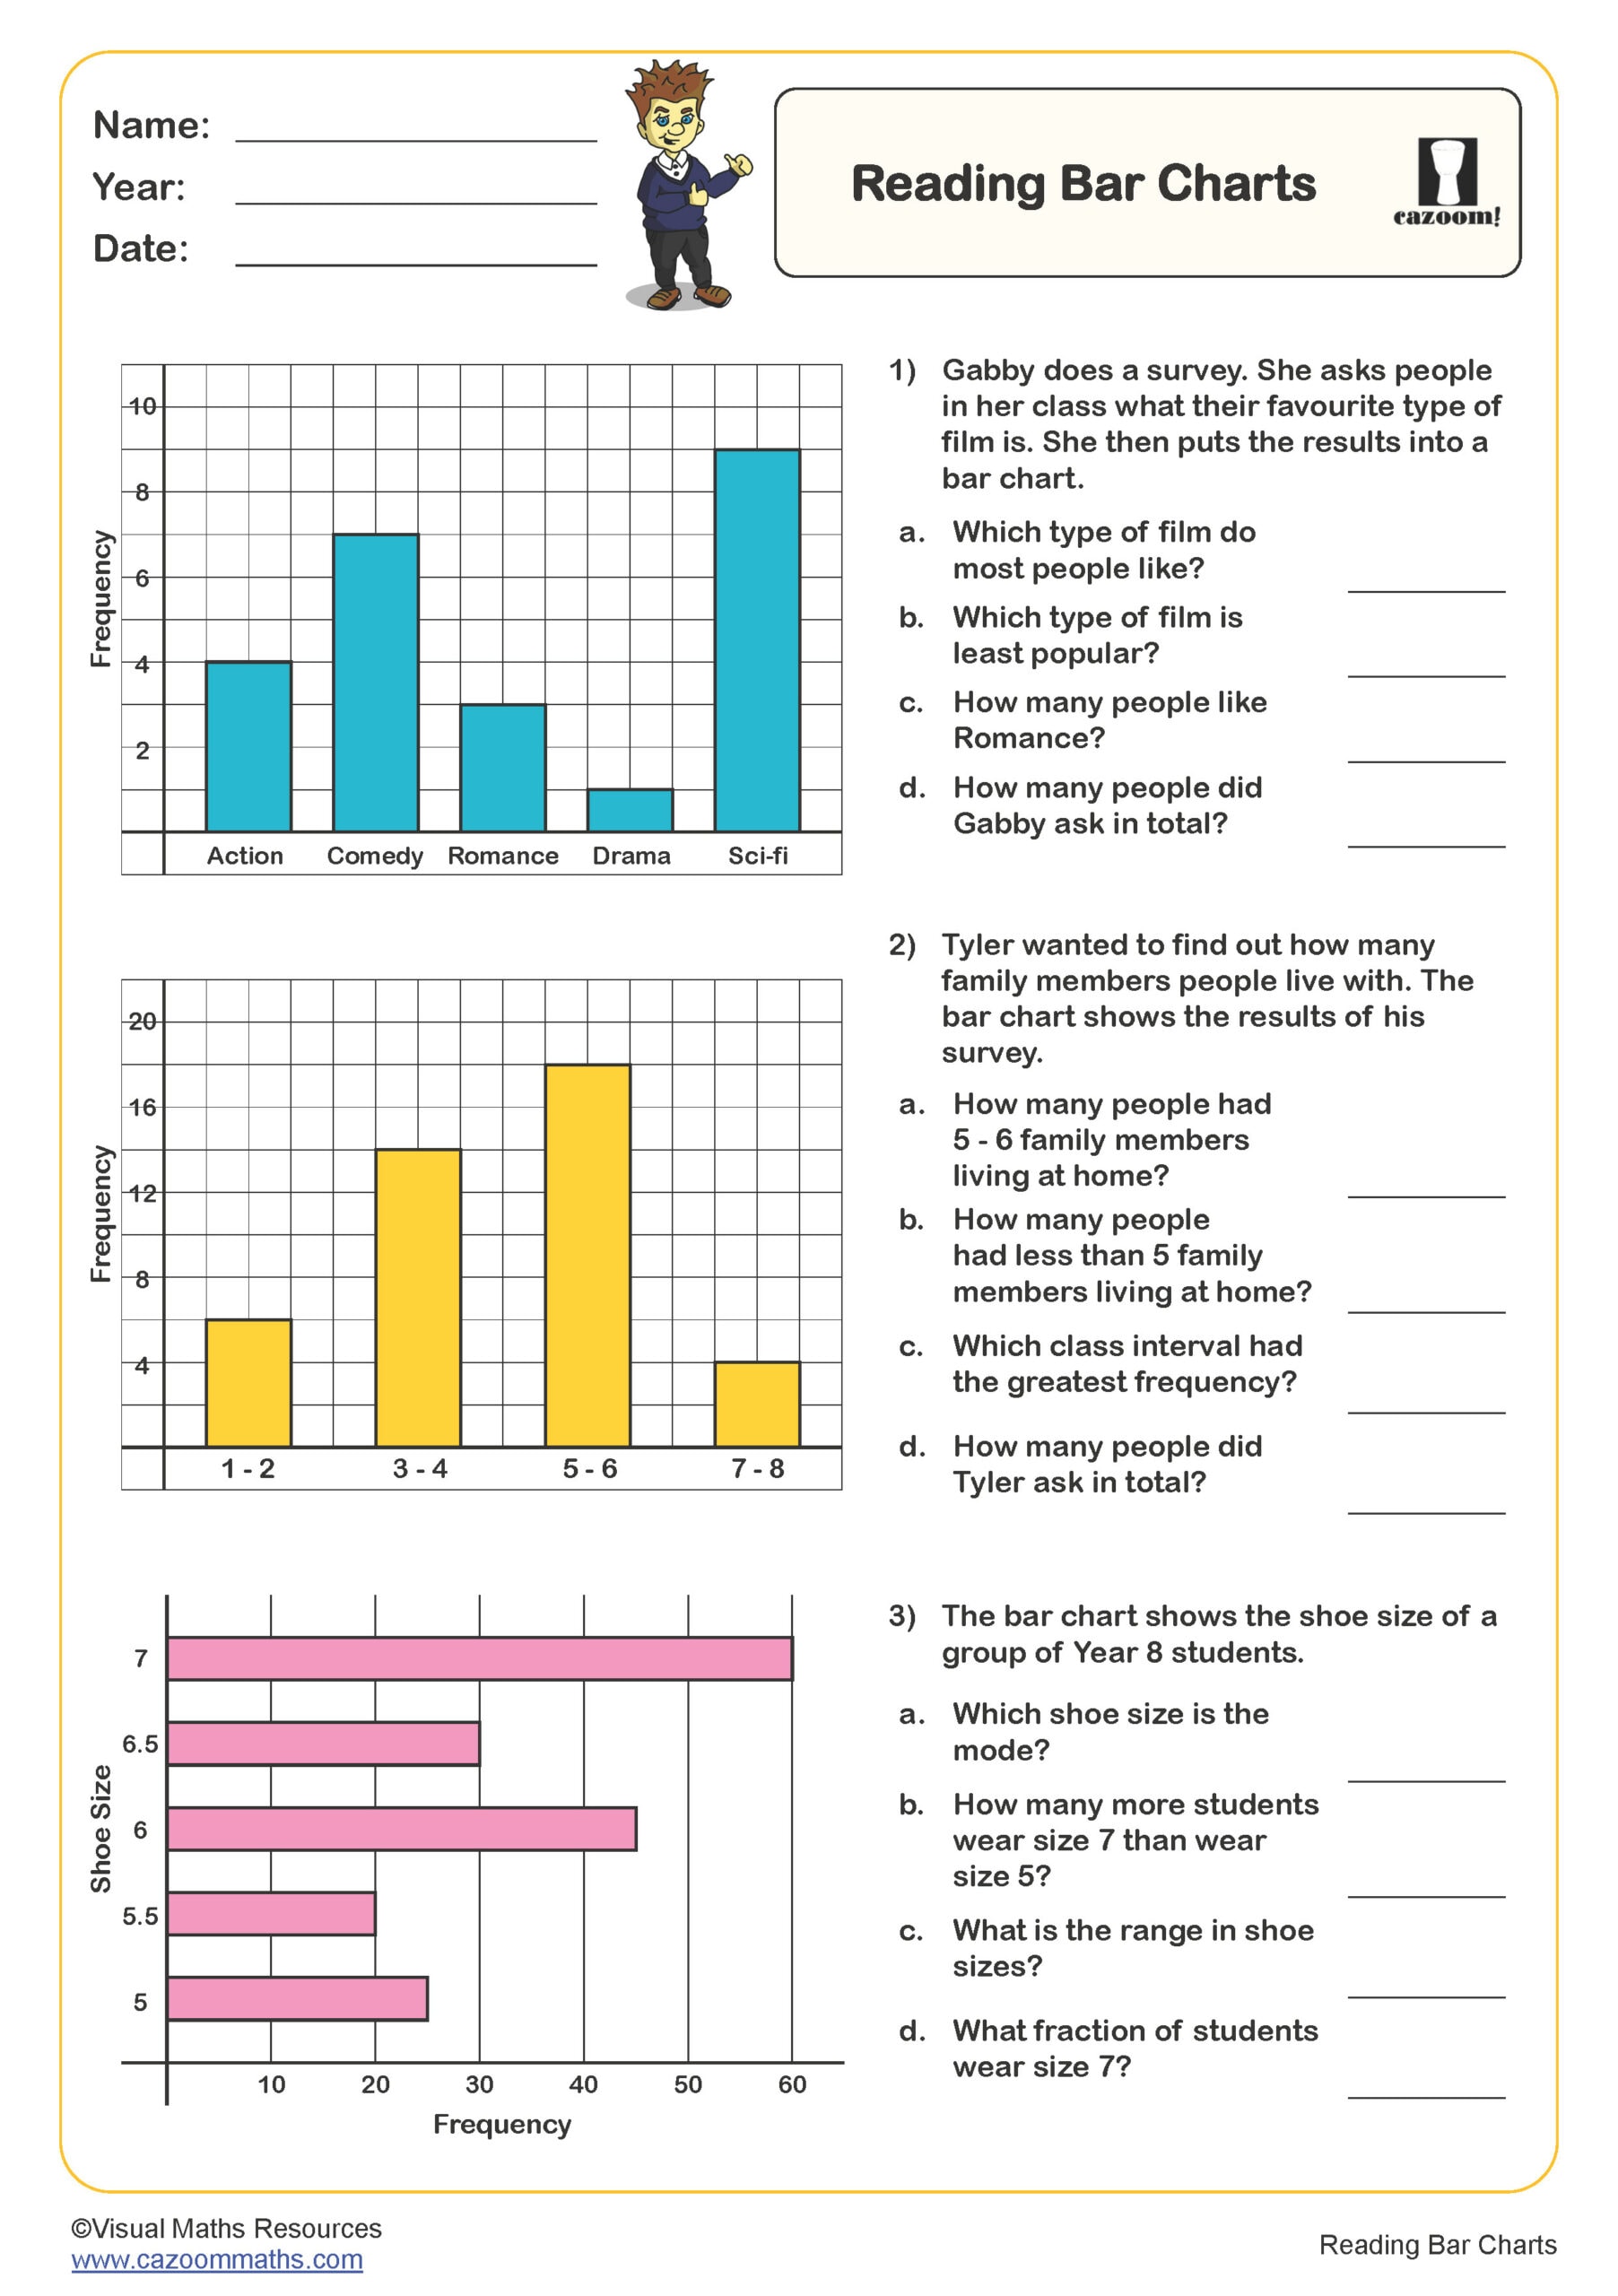
Pictograms and bar charts form the foundation of data representation in KS2, introducing pupils to how information can be displayed visually. Our worksheets guide students through reading these charts systematically—understanding keys and symbols in pictograms where one image might represent multiple items, and recognising scales on bar chart axes that don't always increase in ones.
Pupils answer increasingly complex questions that require comparing categories, finding totals, and calculating differences between values. They progress from simple reading tasks to multi-step problems that combine data interpretation with other mathematical operations. This scaffolded approach builds confidence before students move on to constructing their own charts from given datasets, developing the accuracy and attention to detail essential for statistical work.
Do the Worksheets Include Answers for Marking?
Every statistics worksheet includes a complete answer sheet, making marking efficient whether you're assessing whole-class work or homework assignments. The answers are comprehensive and clearly laid out, allowing teachers to quickly identify misconceptions and pupils to self-assess their understanding. This is particularly valuable for statistical work where multiple interpretations might seem plausible.
For independent learning at home, parents can support their children confidently without needing specialist mathematics knowledge. The answer sheets show not just final answers but expected values for charts and graphs, helping identify where errors occur in reading scales or interpreting data. All resources are provided as downloadable PDFs, ready to print for immediate classroom use or home learning.