Year 2 Statistics Worksheets
All worksheets are created by the team of experienced teachers at Cazoom Maths.
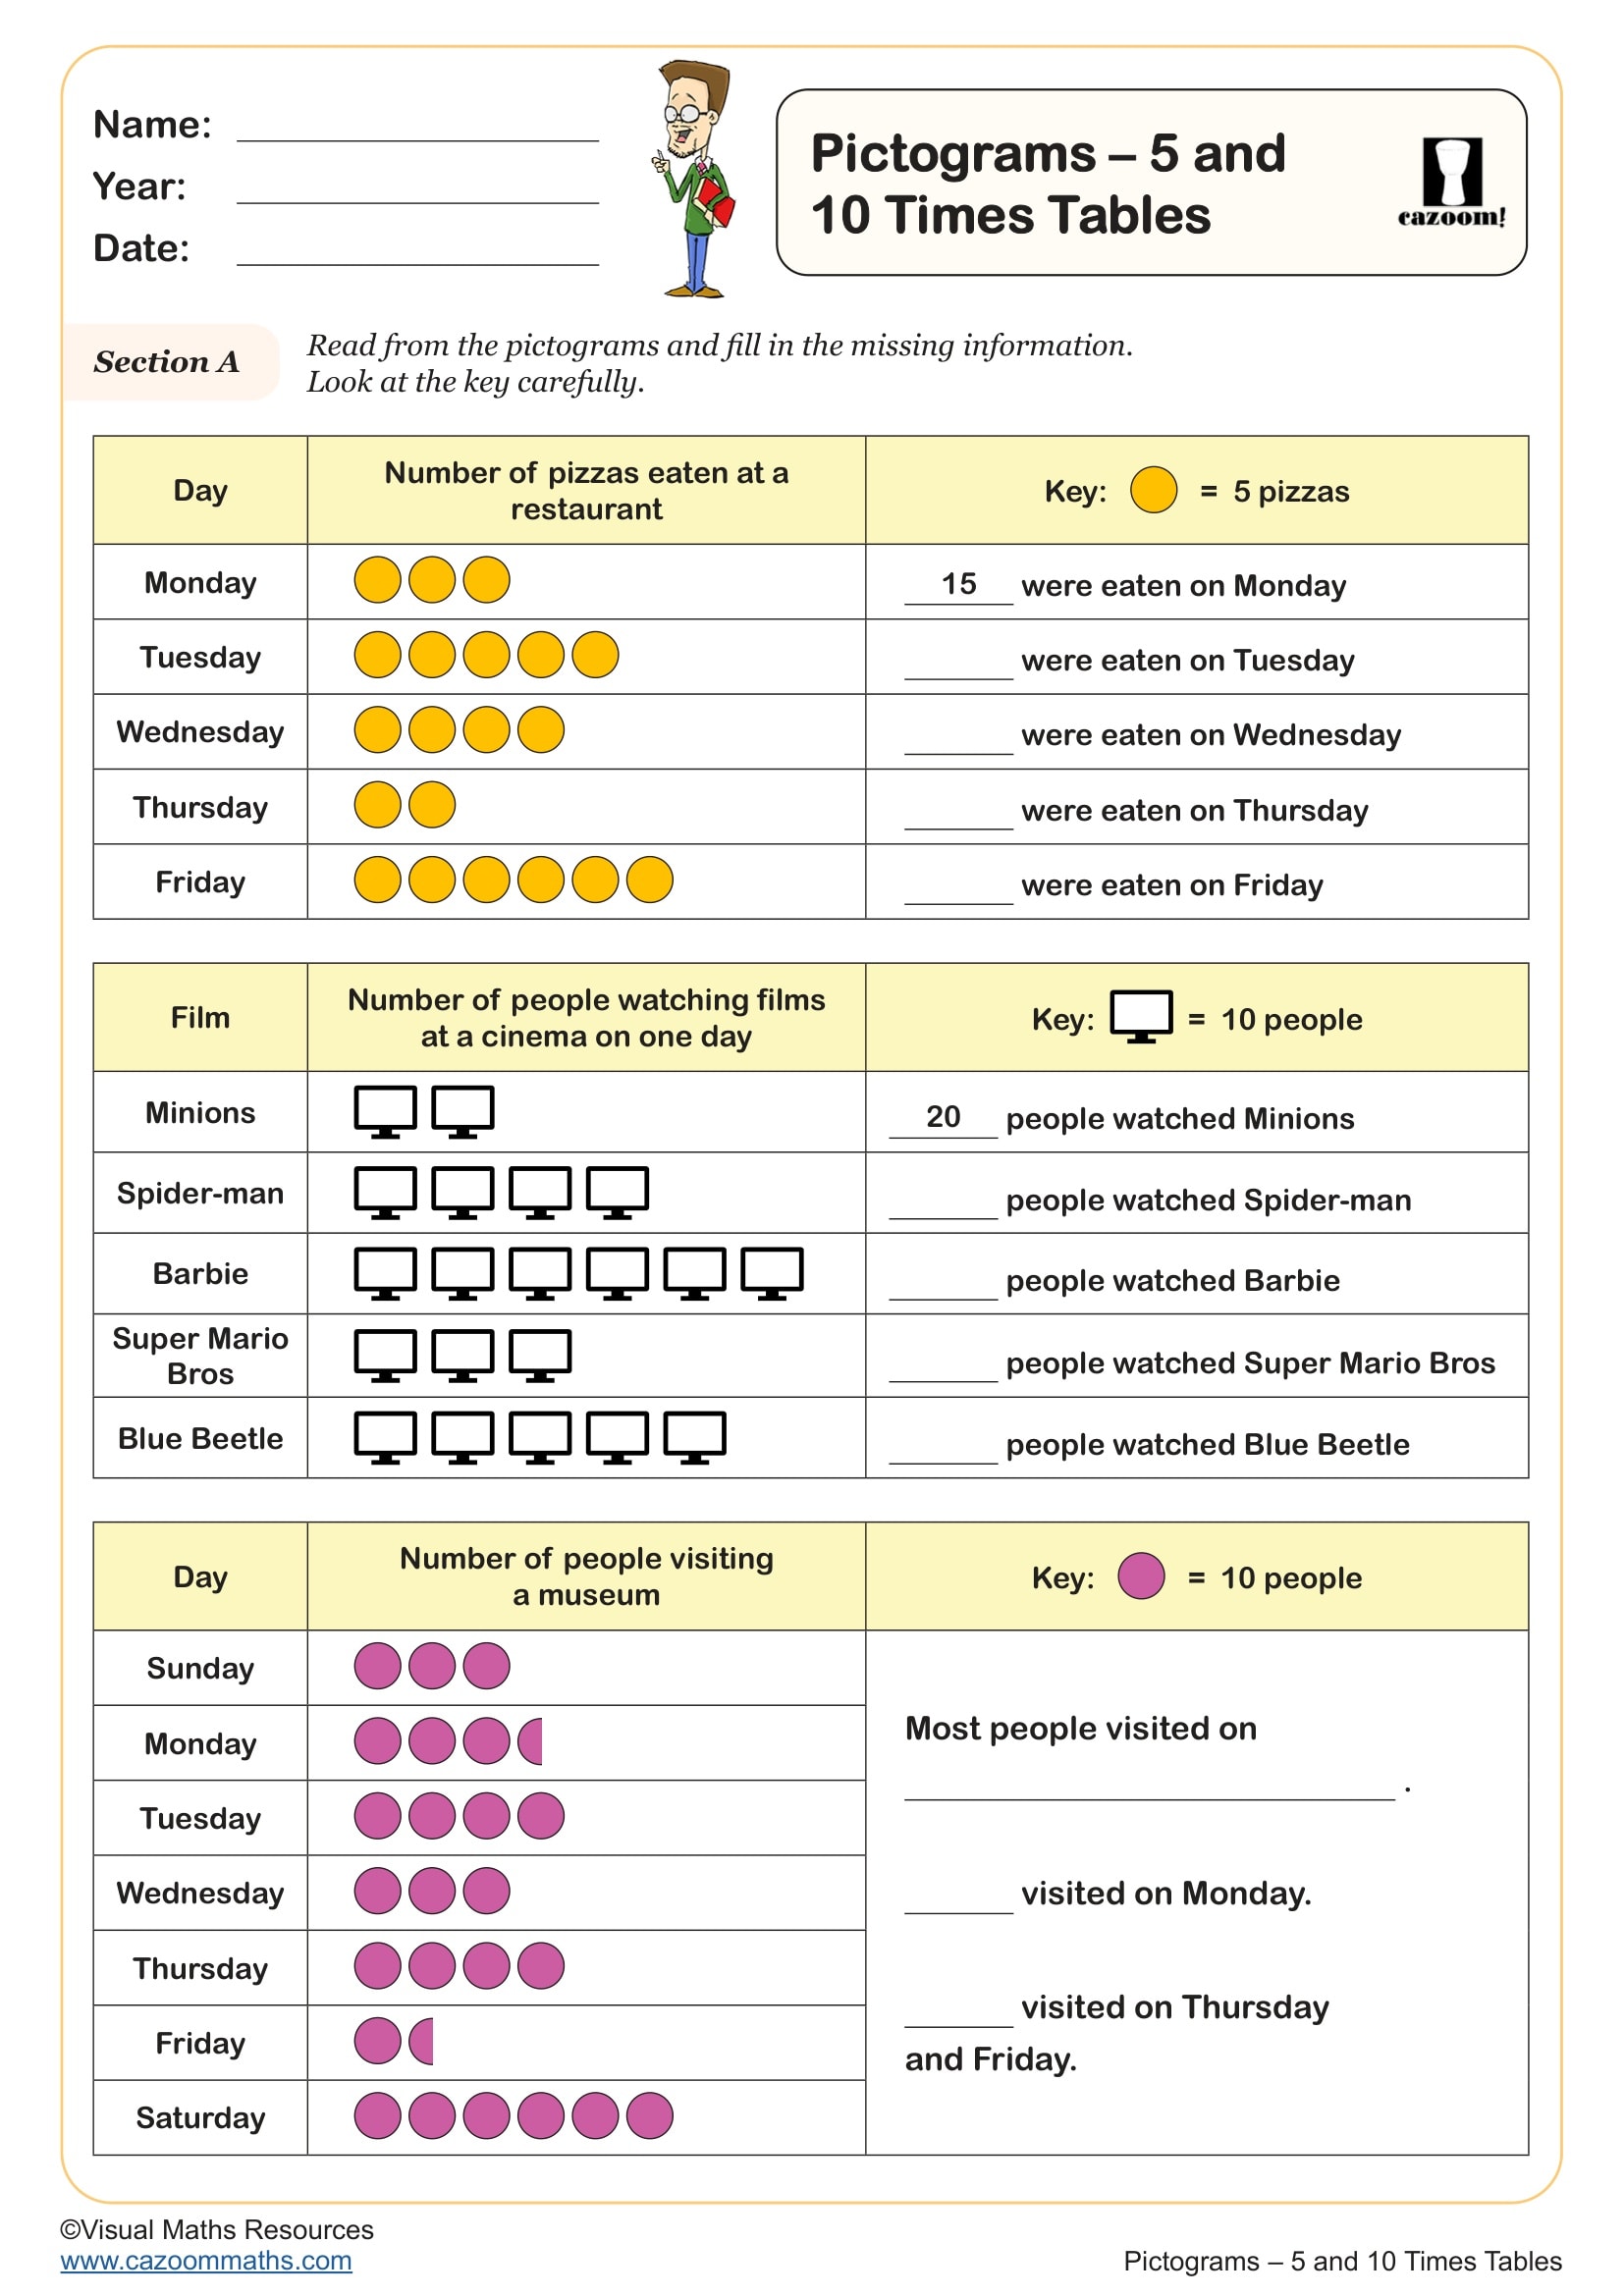
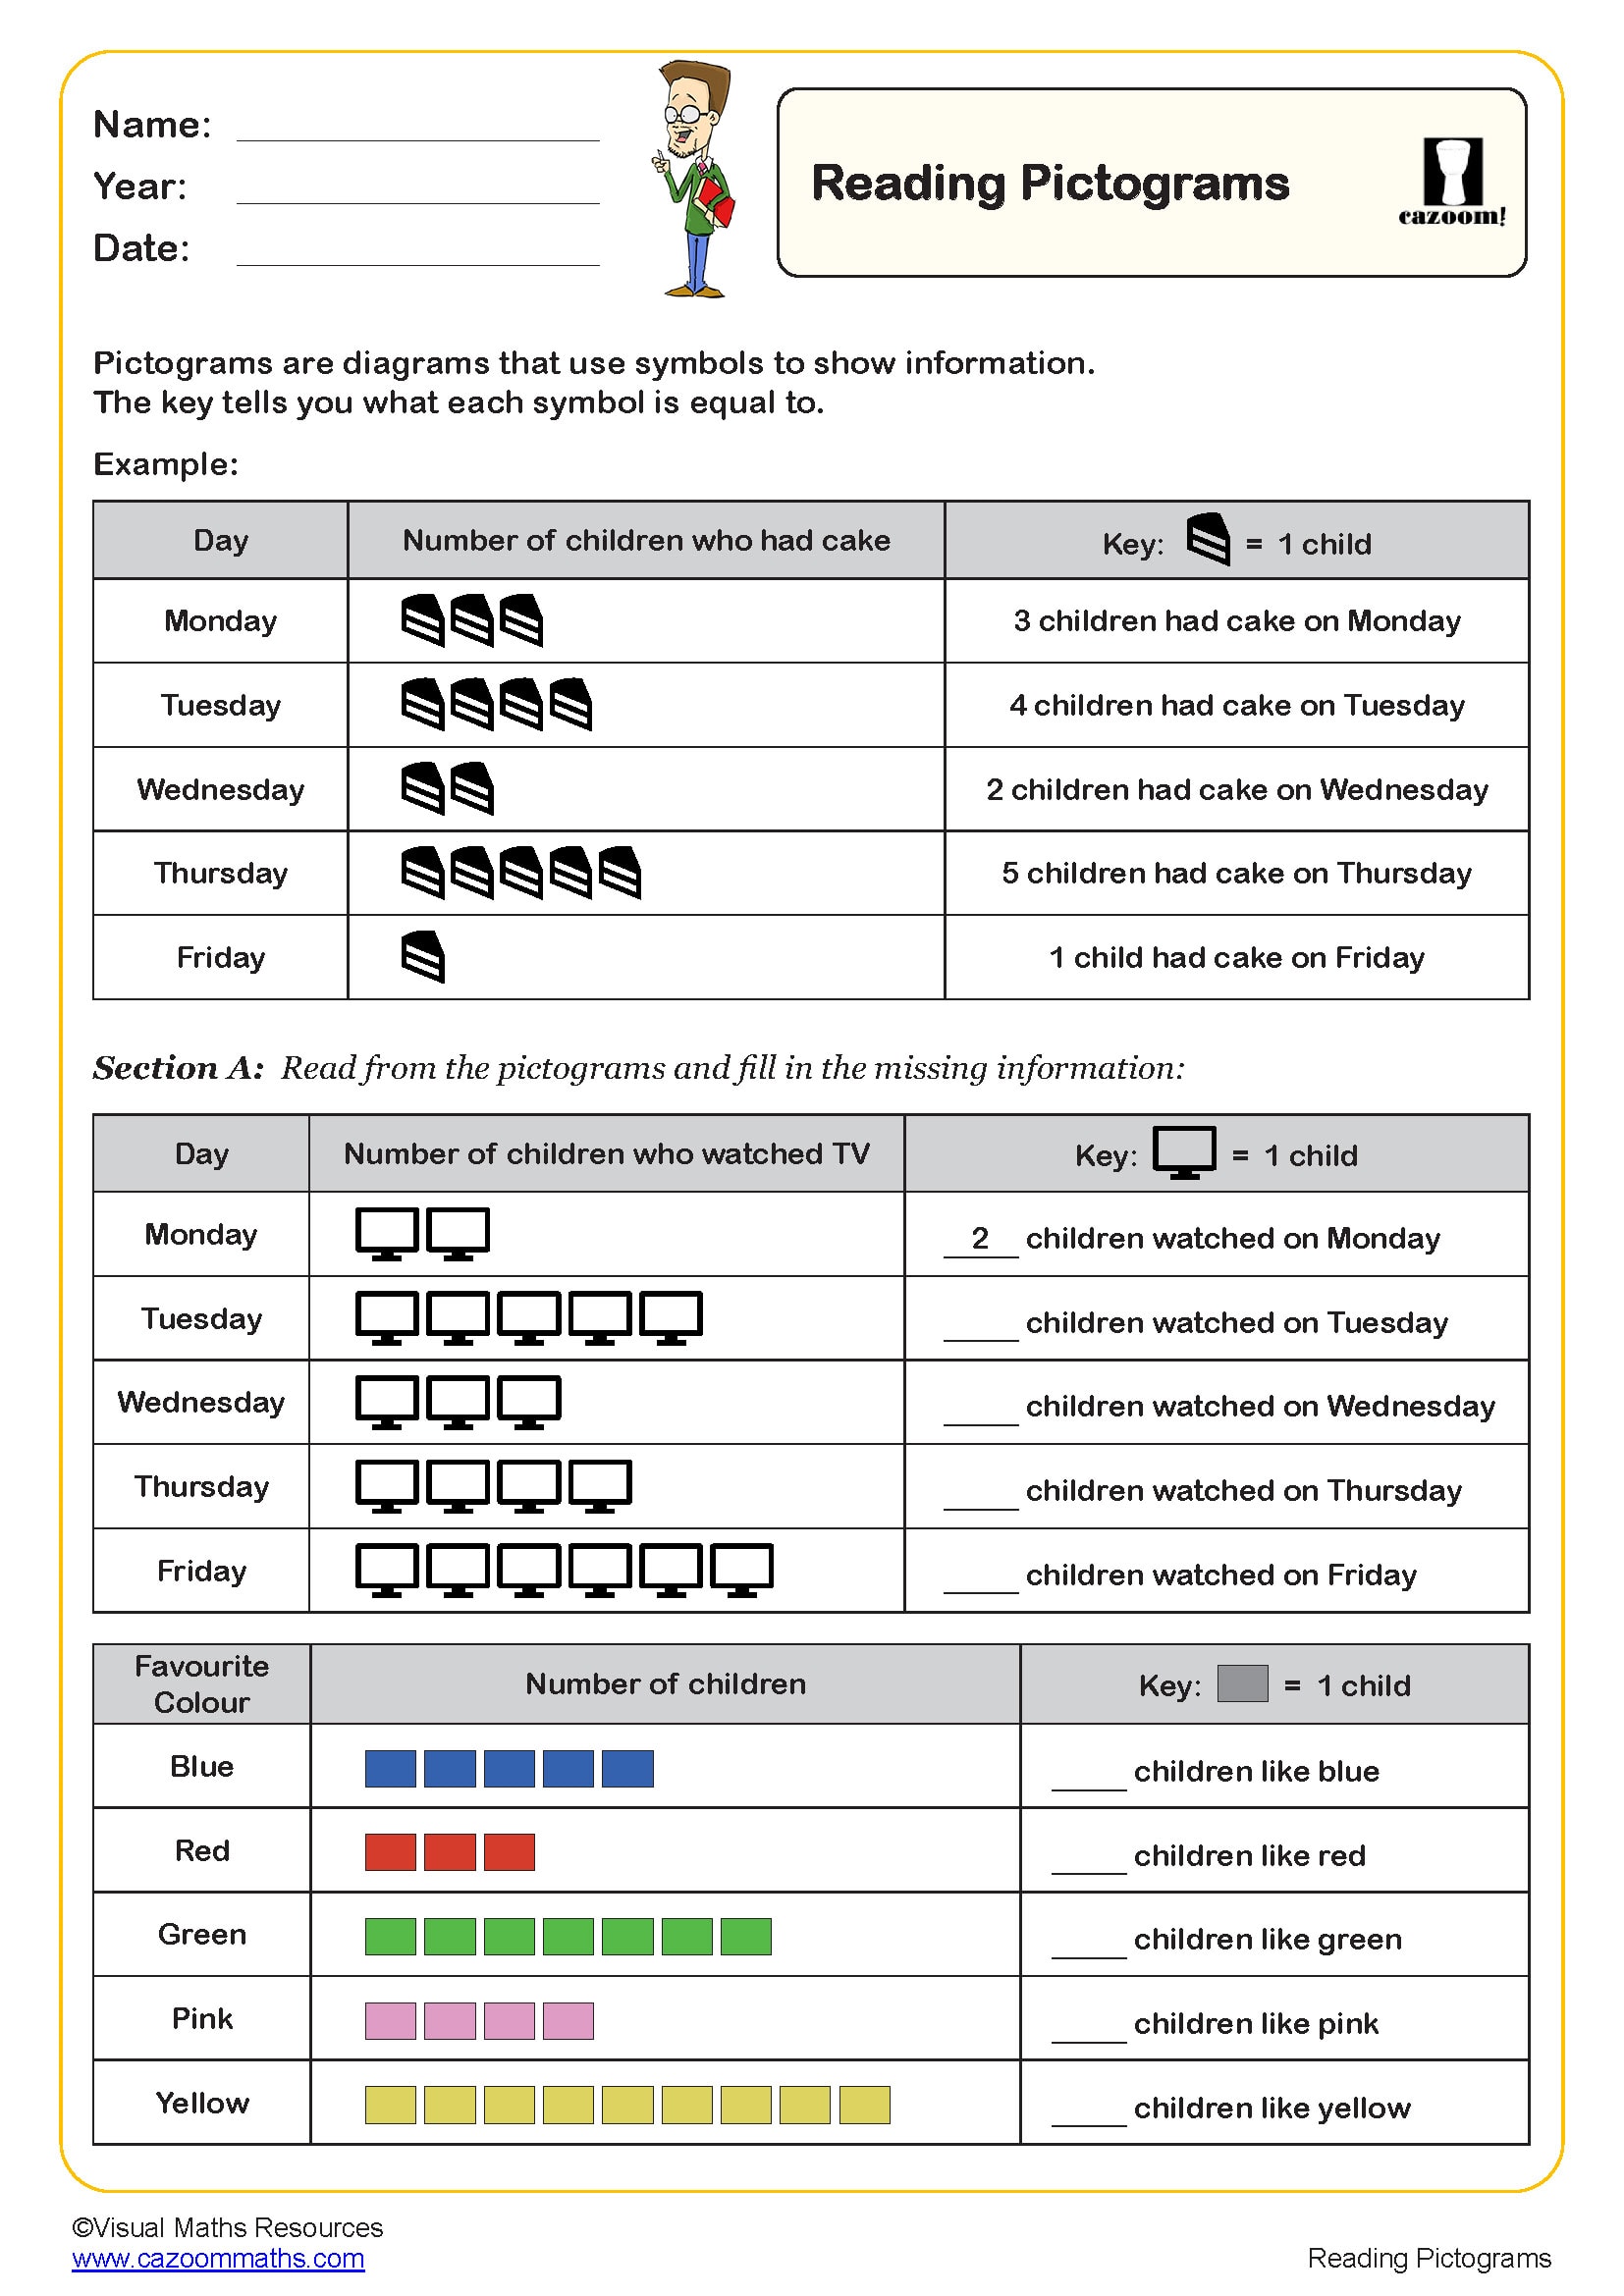
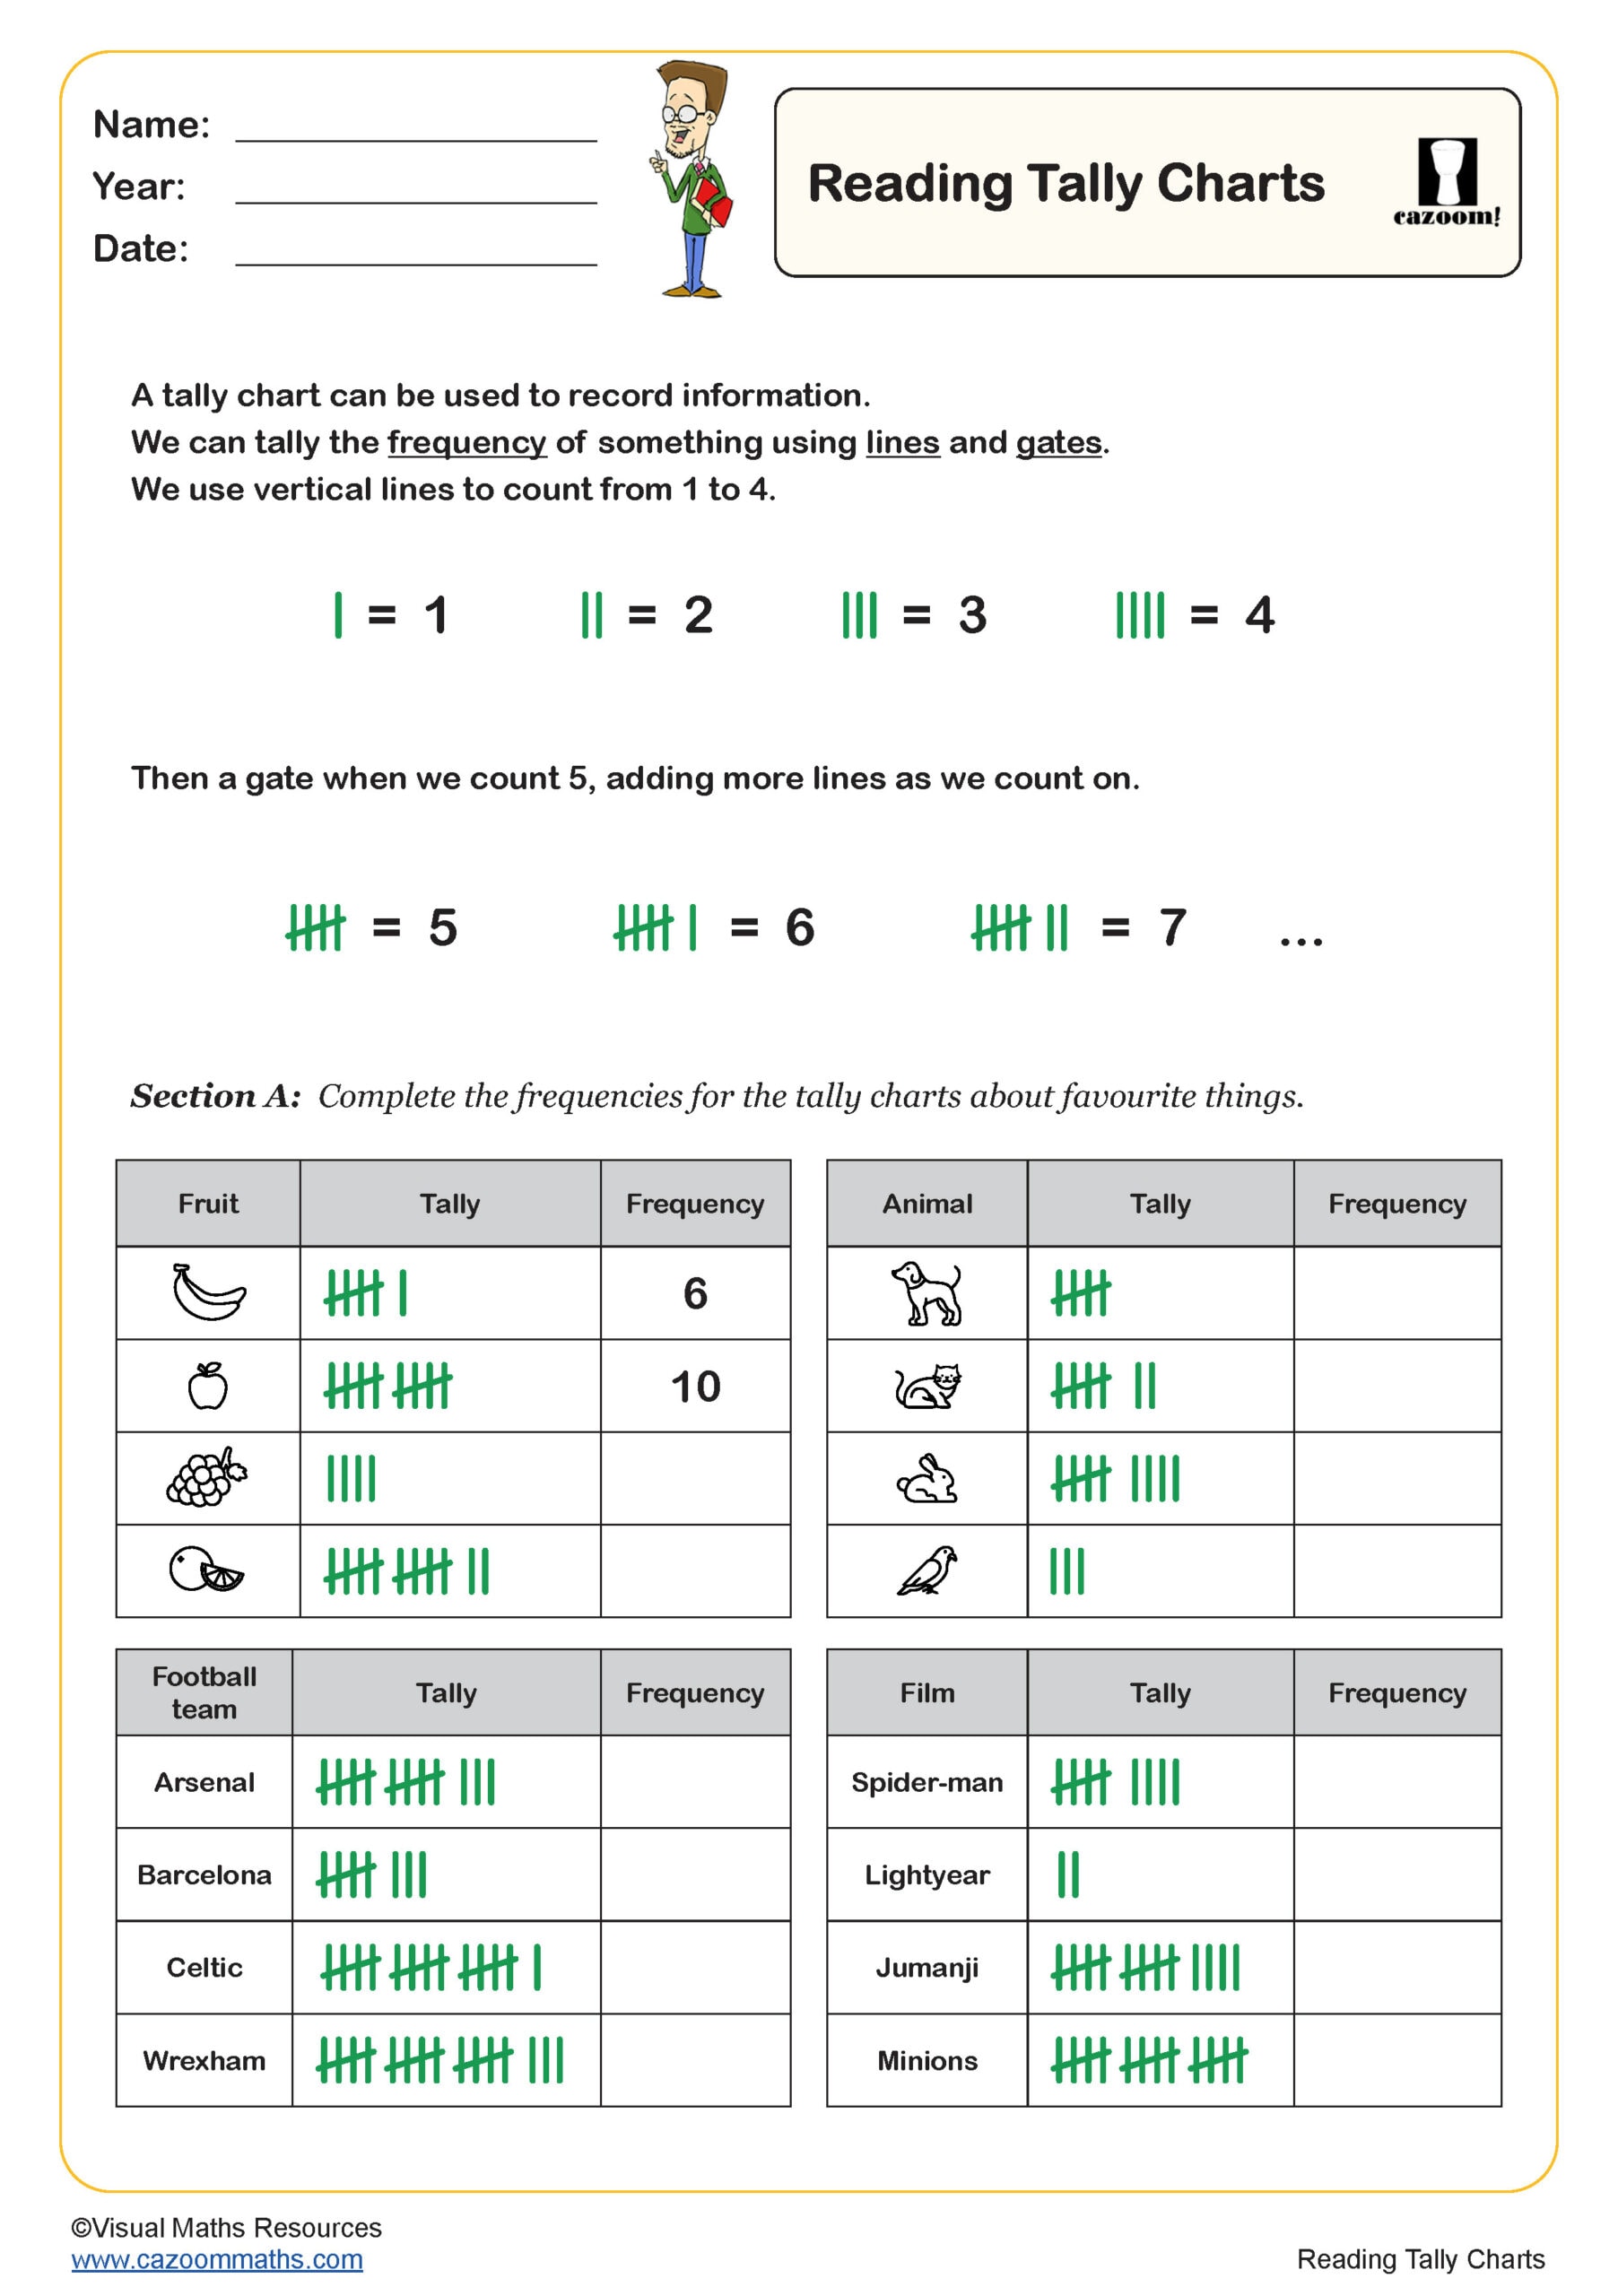
Tally Charts and Pictograms Worksheets with Step-by-Step Solutions
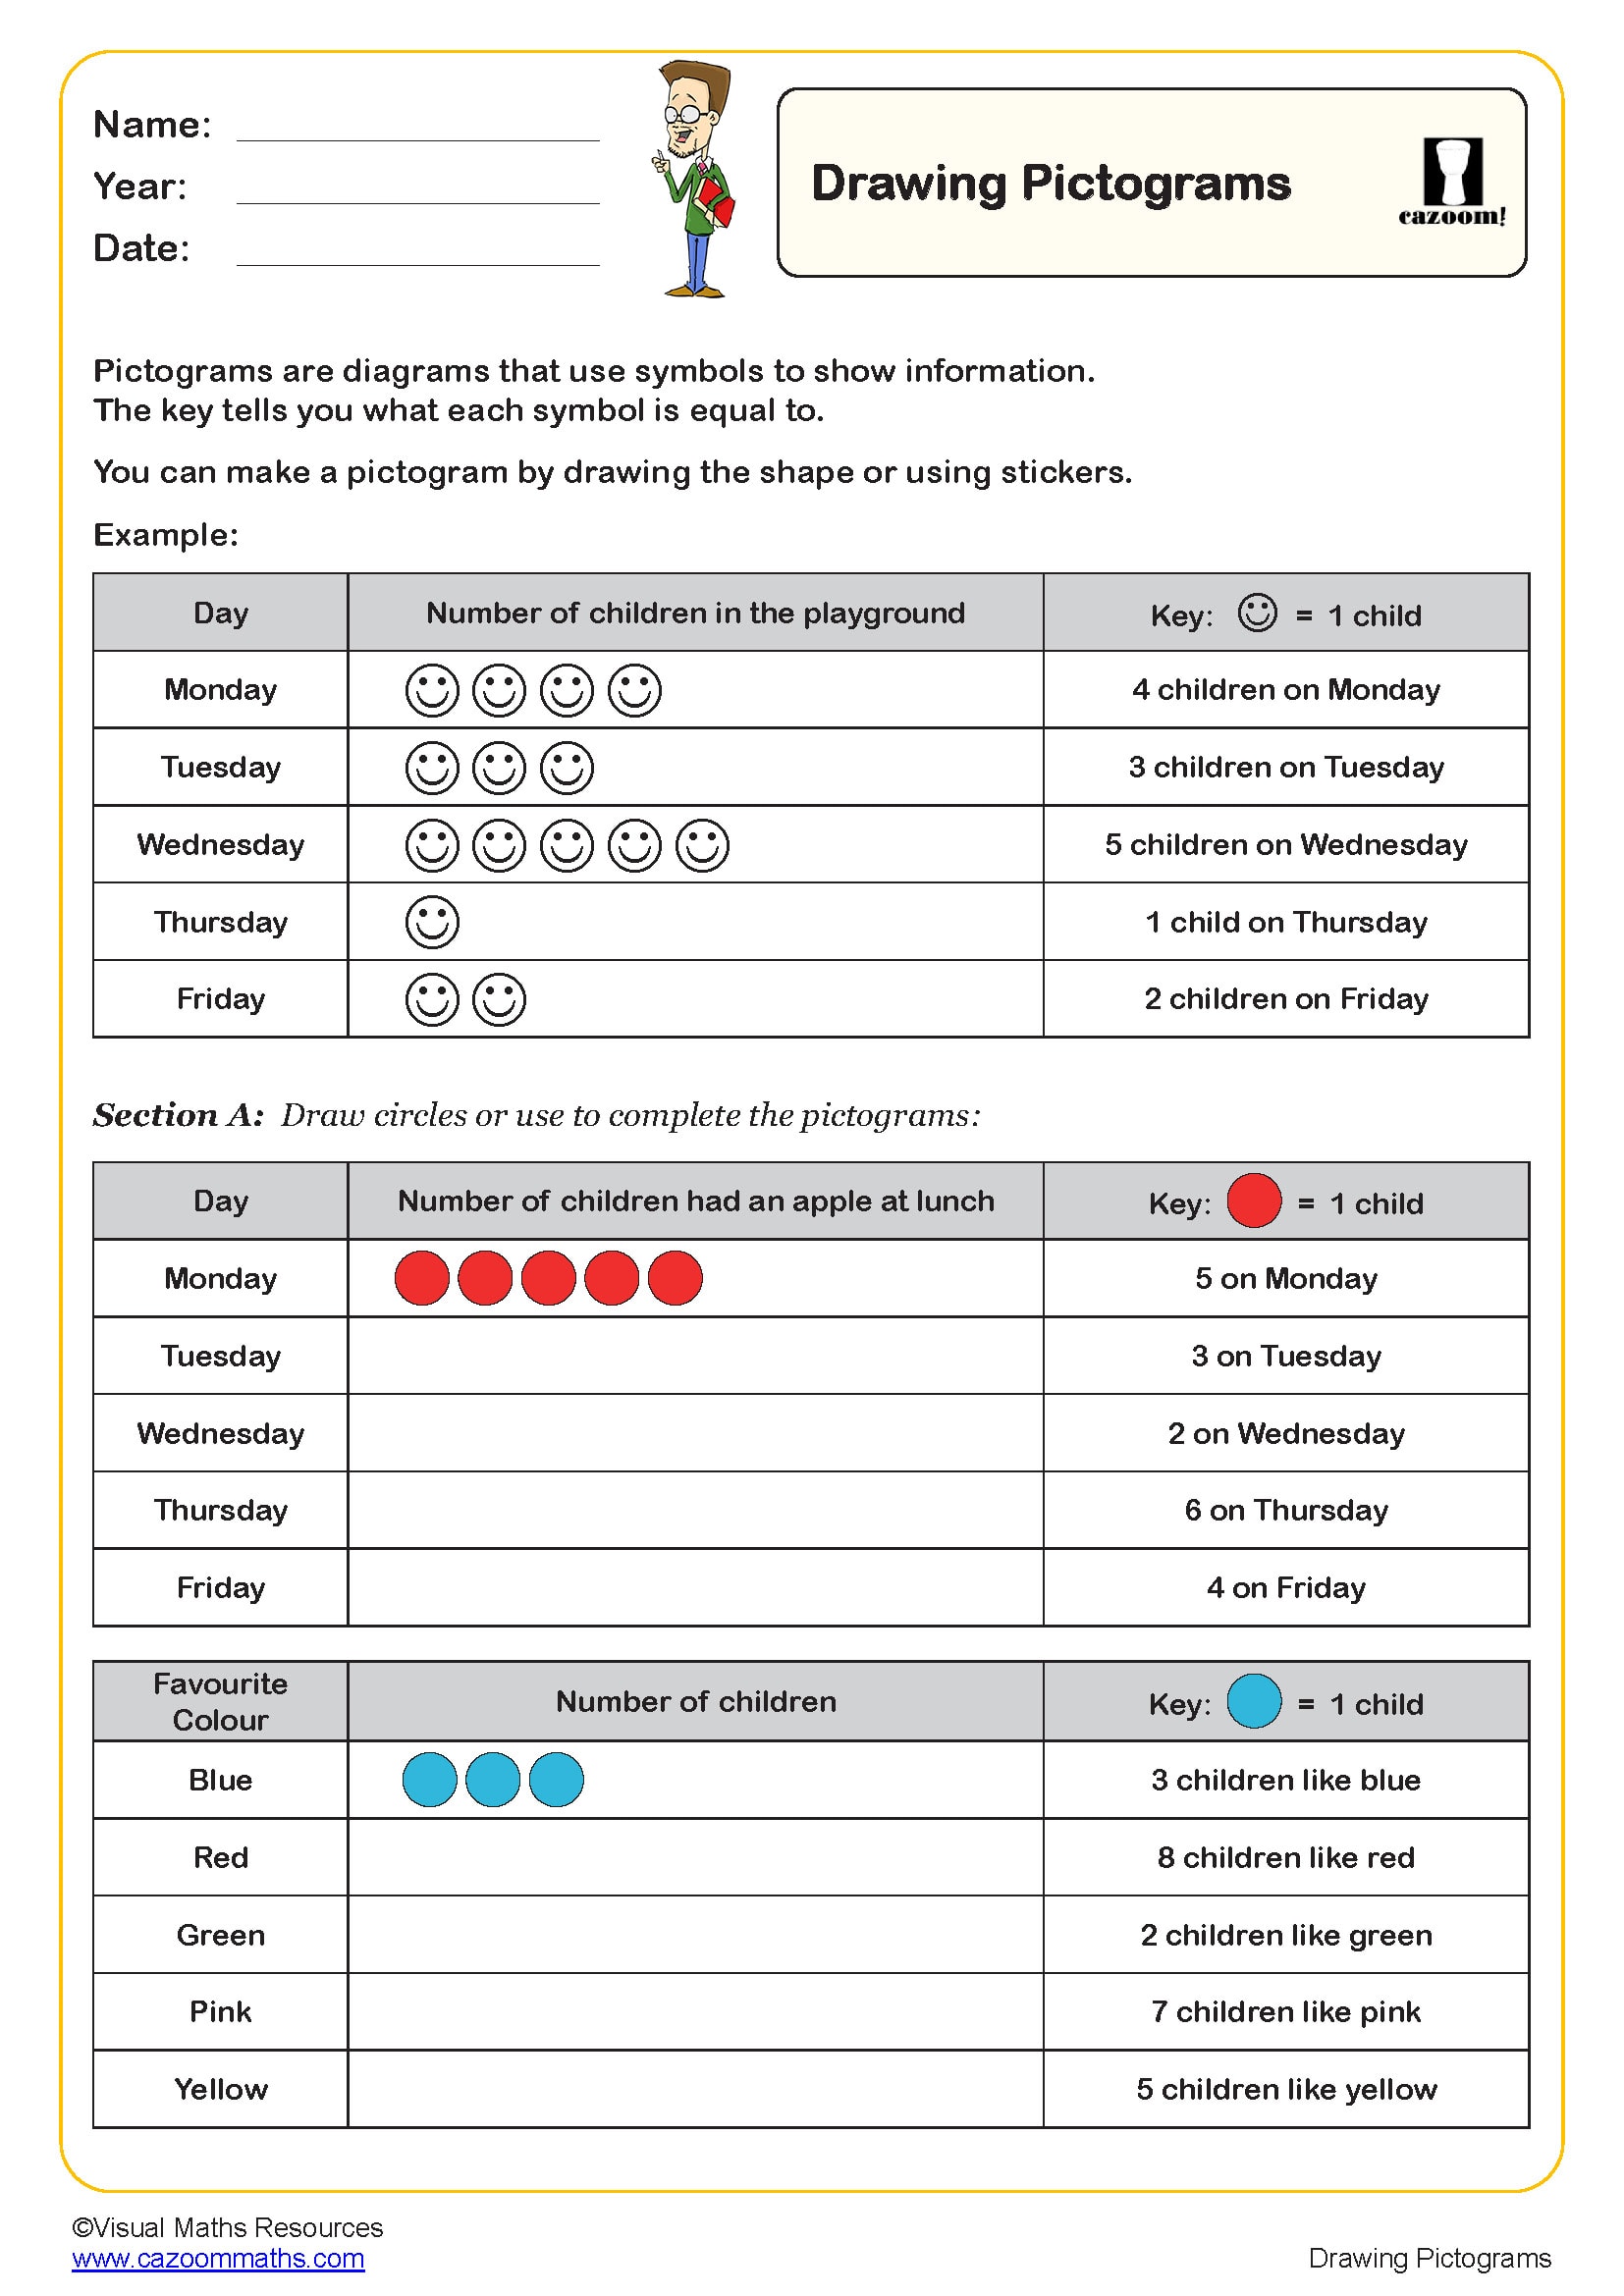
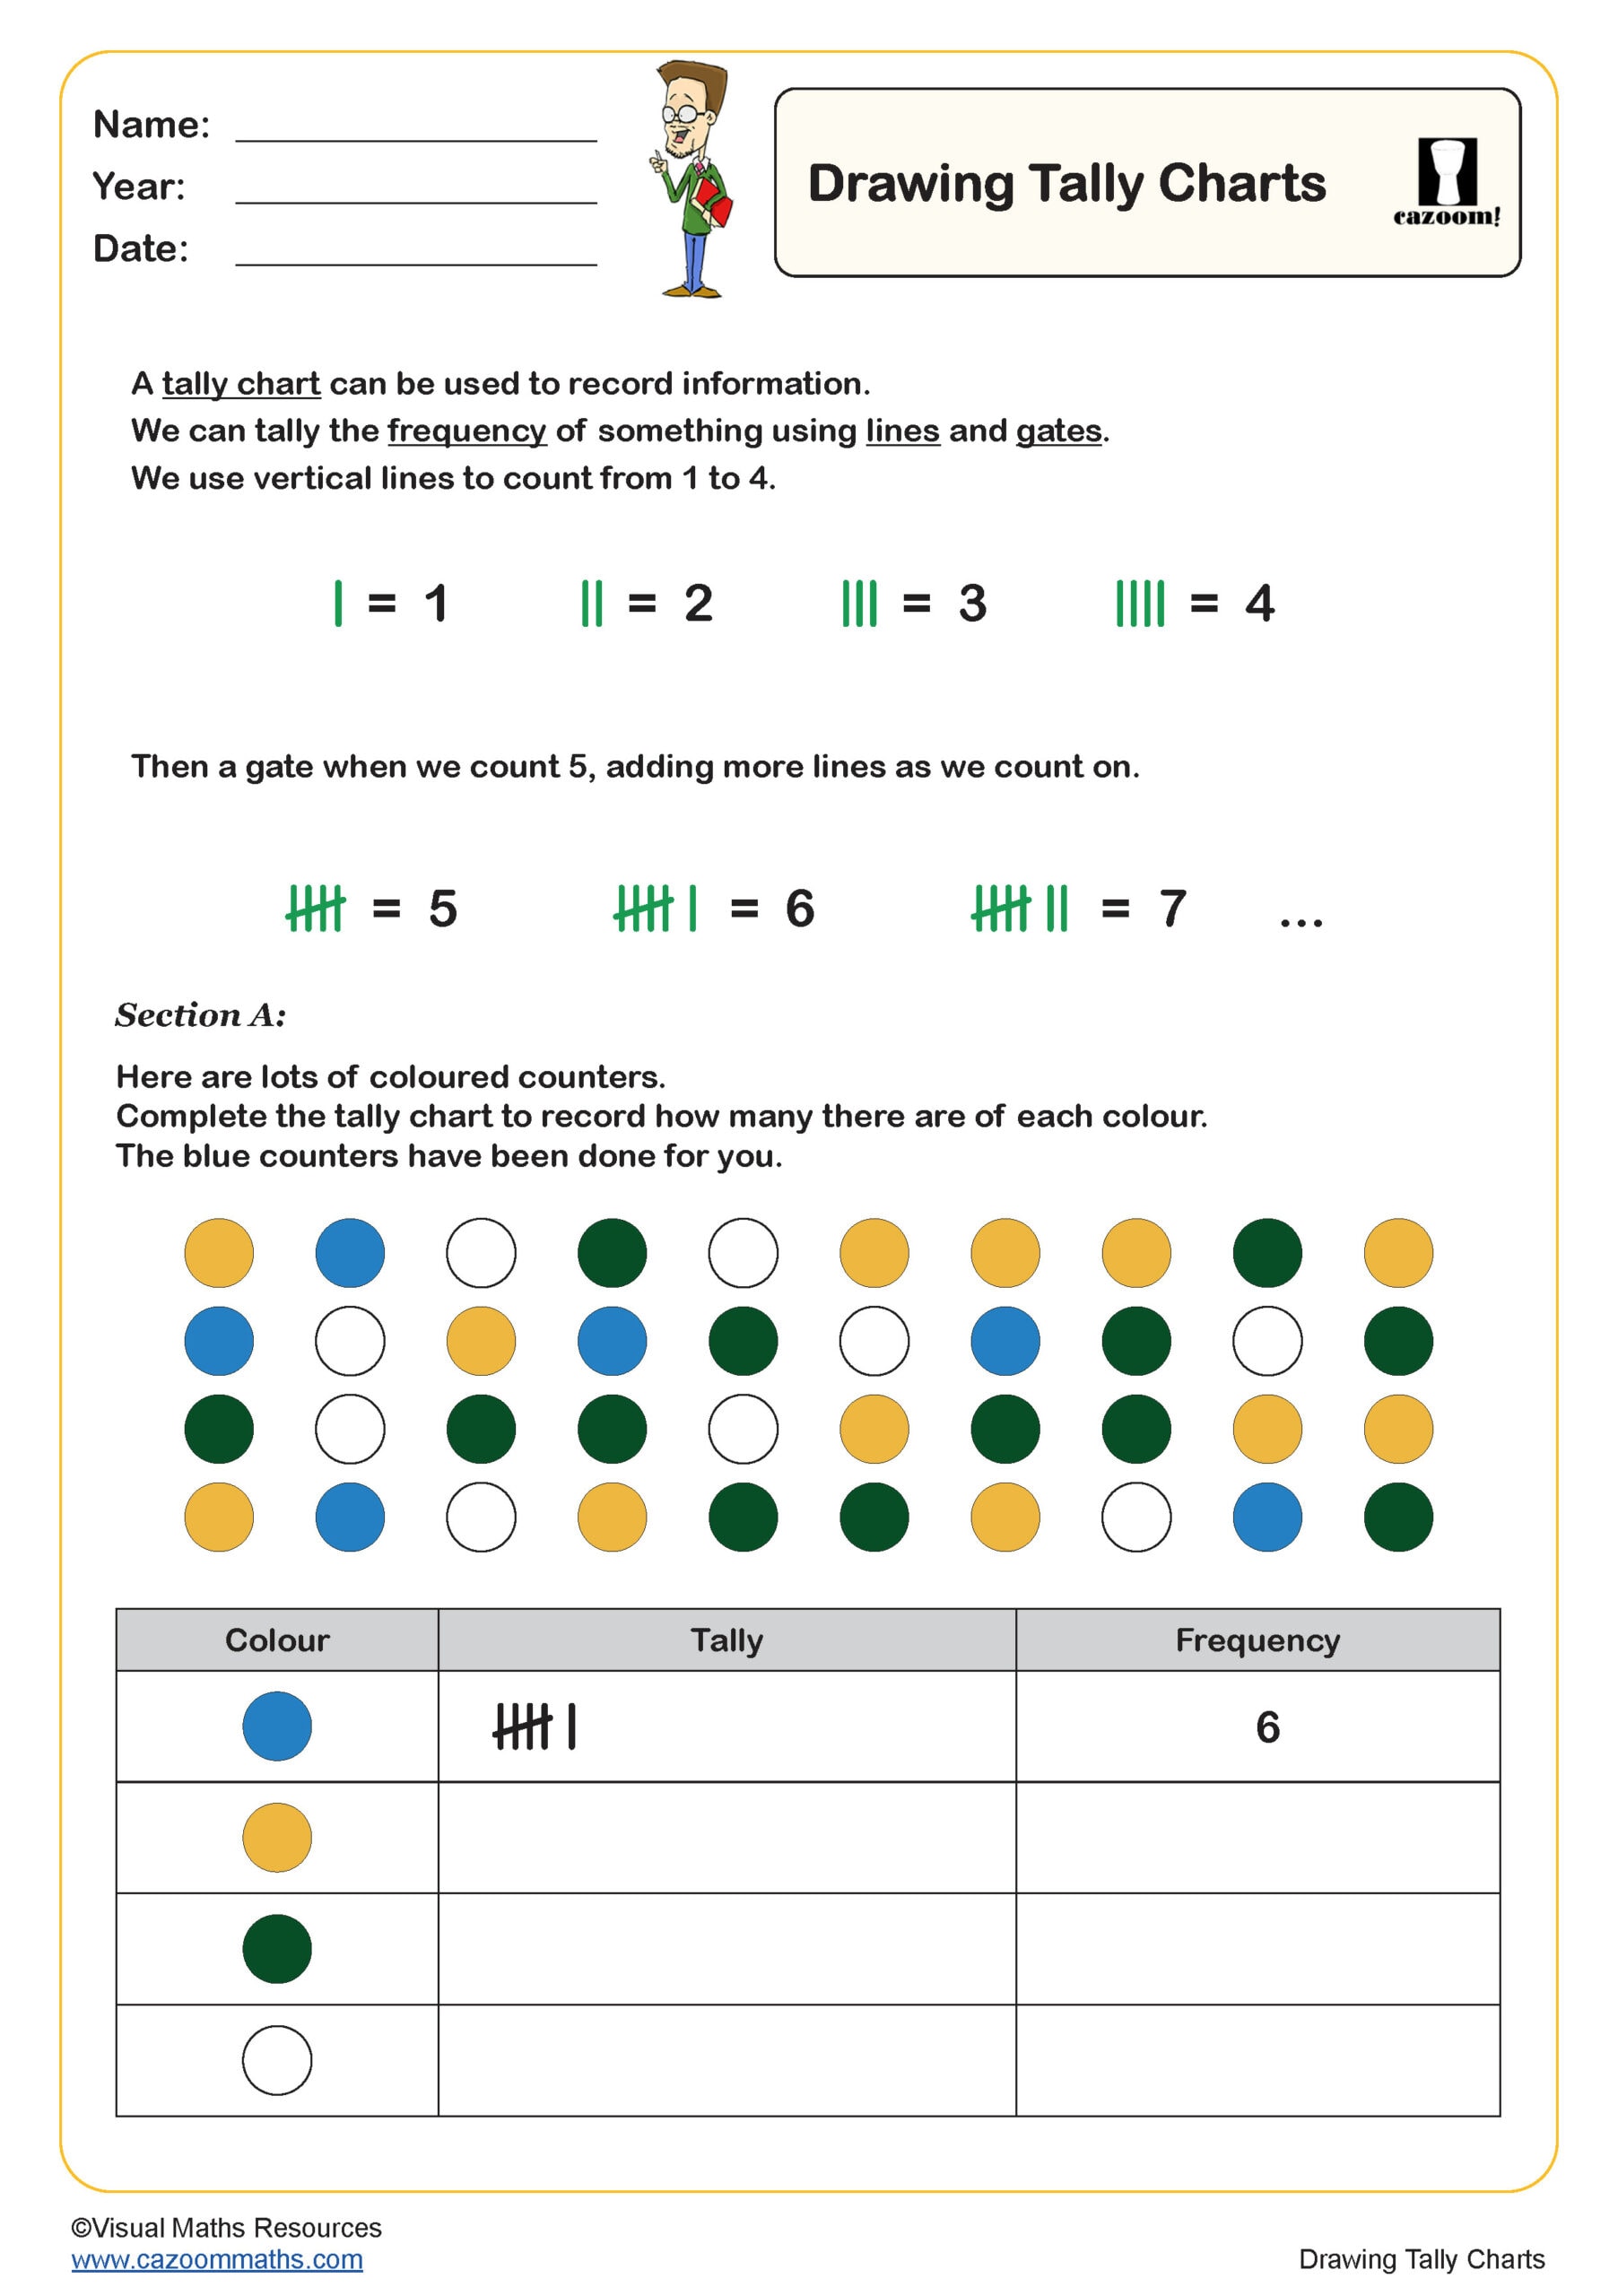
We have noticed that many KS1 statistics resources skip the foundation work - but that's exactly what Year 2 students need most. Our ready-to-use, printable, PDF worksheets are specifically designed to guide children through creating their own tally charts from real data, then transforming these into colourful pictograms. The detailed answer sheets don't just show the final result; they demonstrate the thinking process behind each step.
Essential Data Skills Covered in These Year 2 Worksheets
Basic statistics is simply the art of collecting, organizing, and making sense of numbers - it's how we turn messy data into useful information that helps us understand patterns and make better decisions. Think of it as the essential toolkit for answering questions like "What's typical?" or "How do these things compare?" using everything from simple averages to charts and graphs.
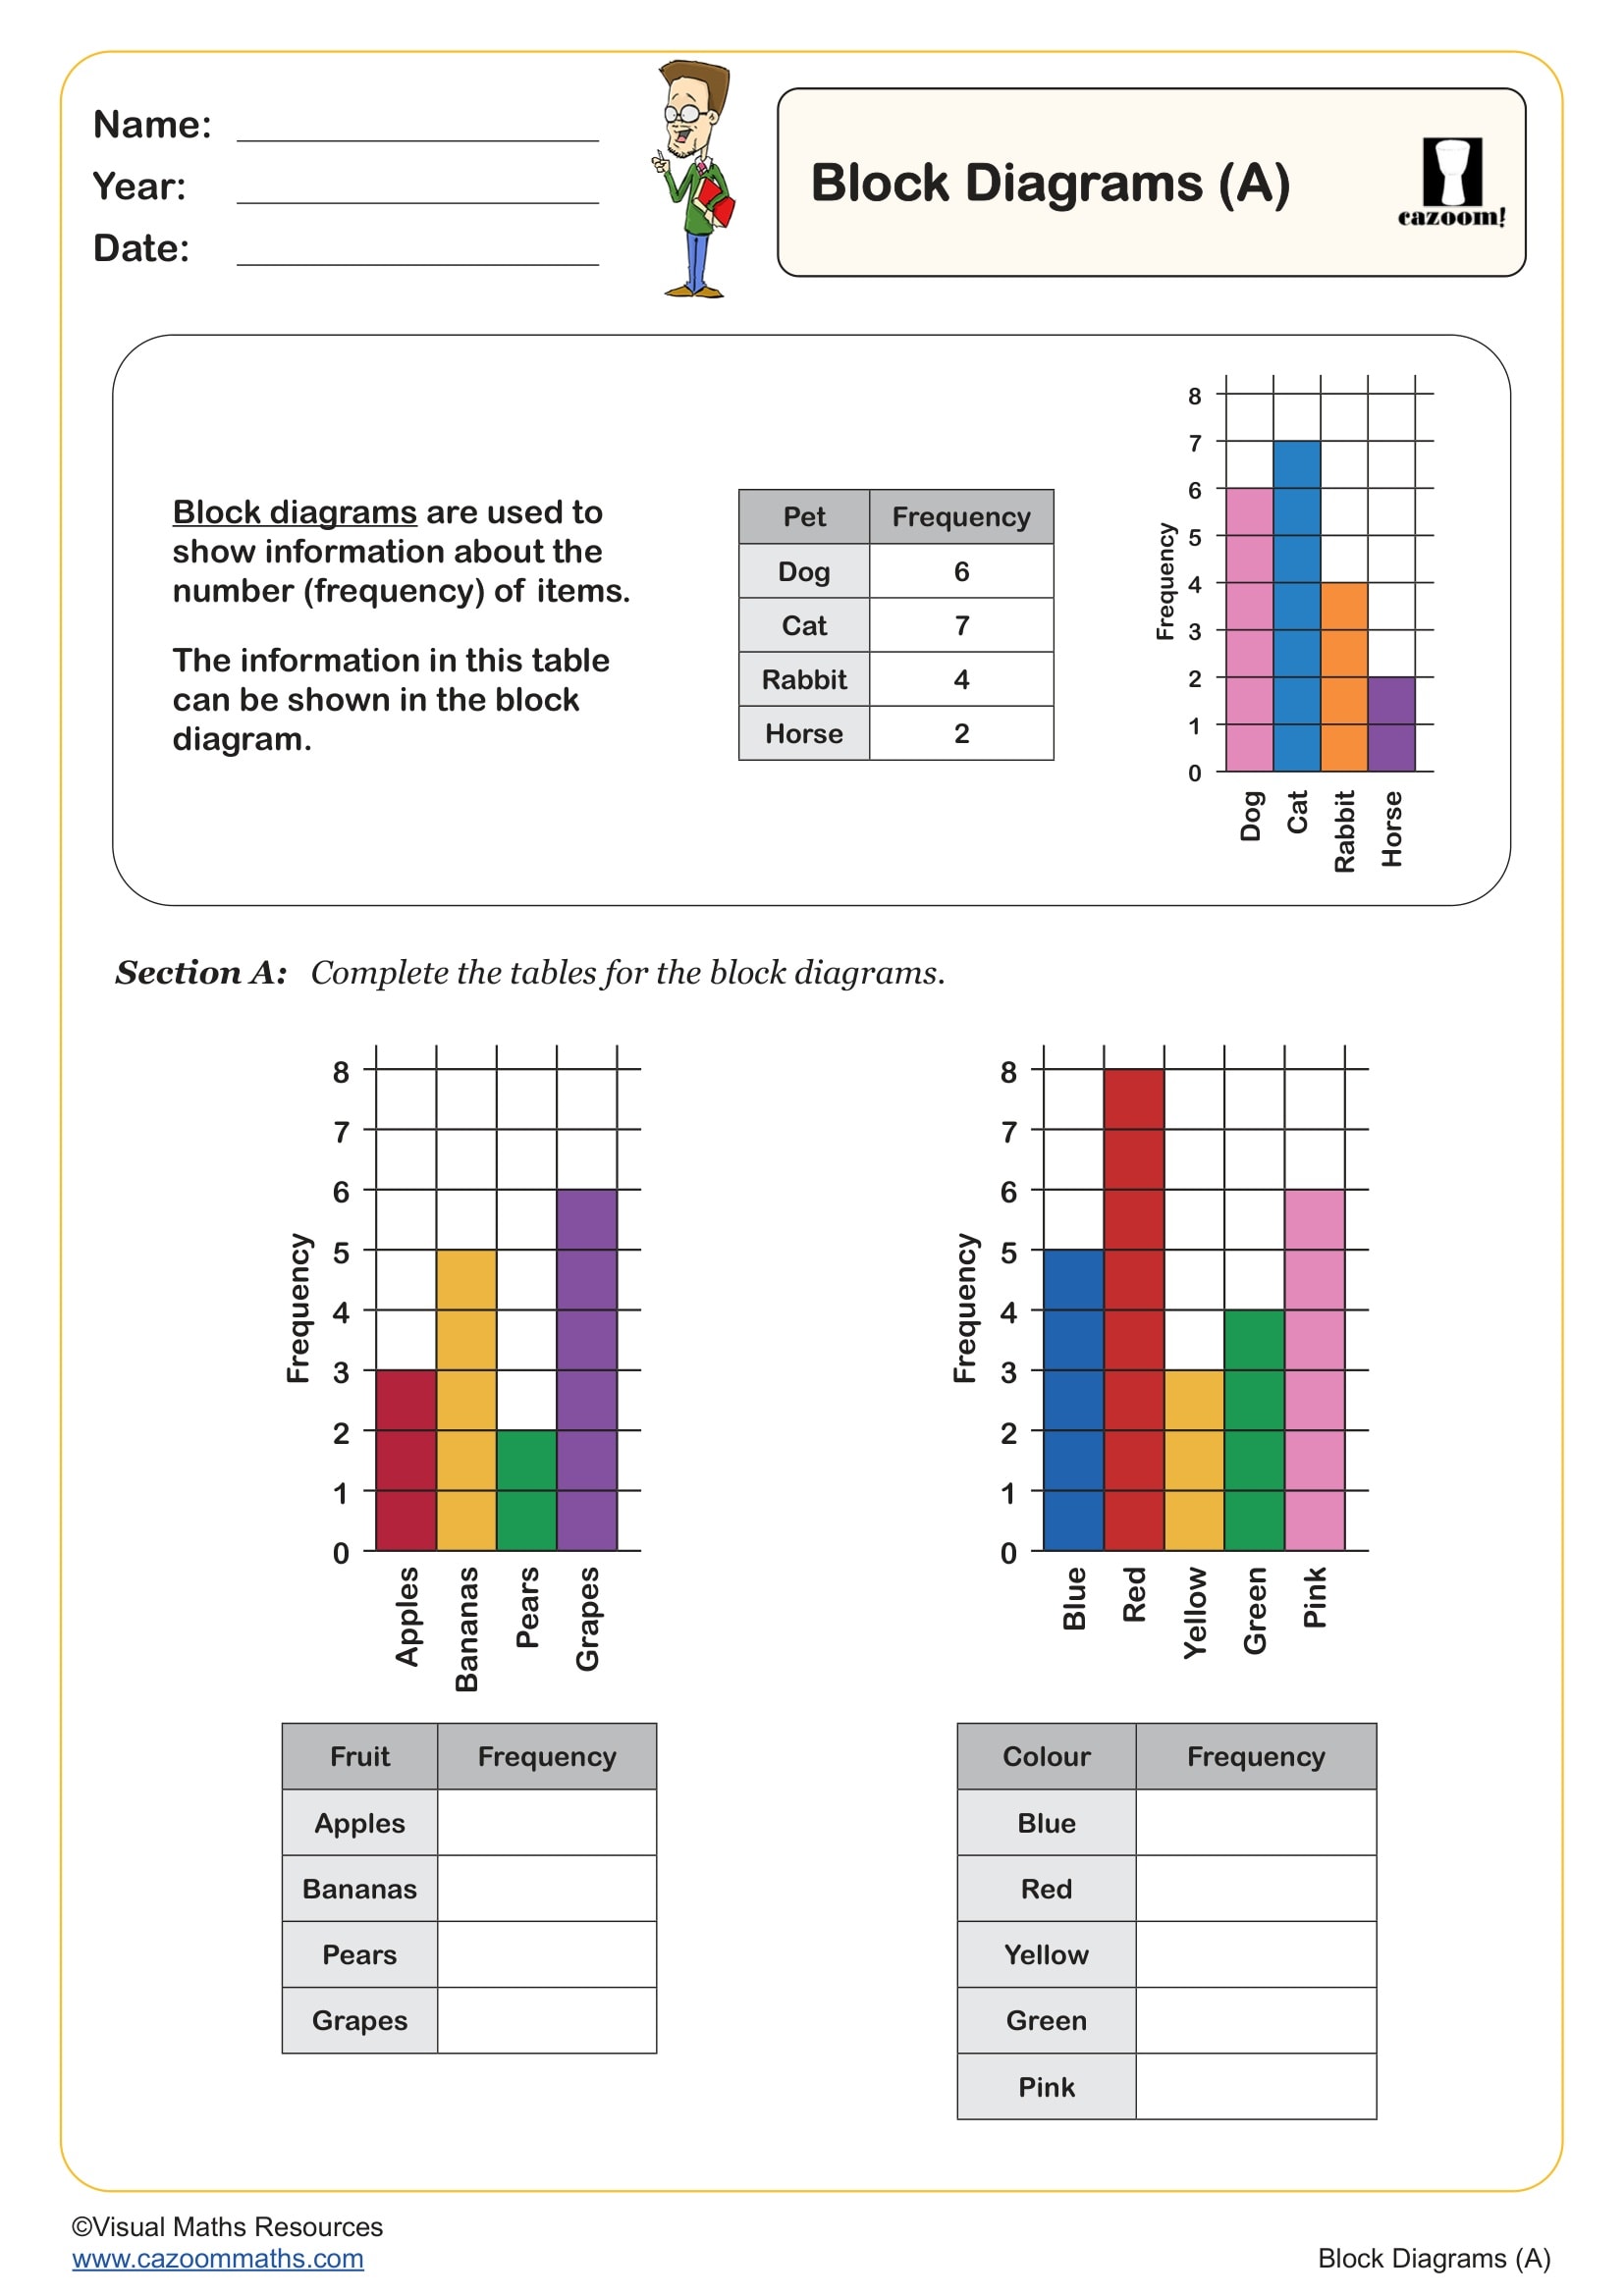
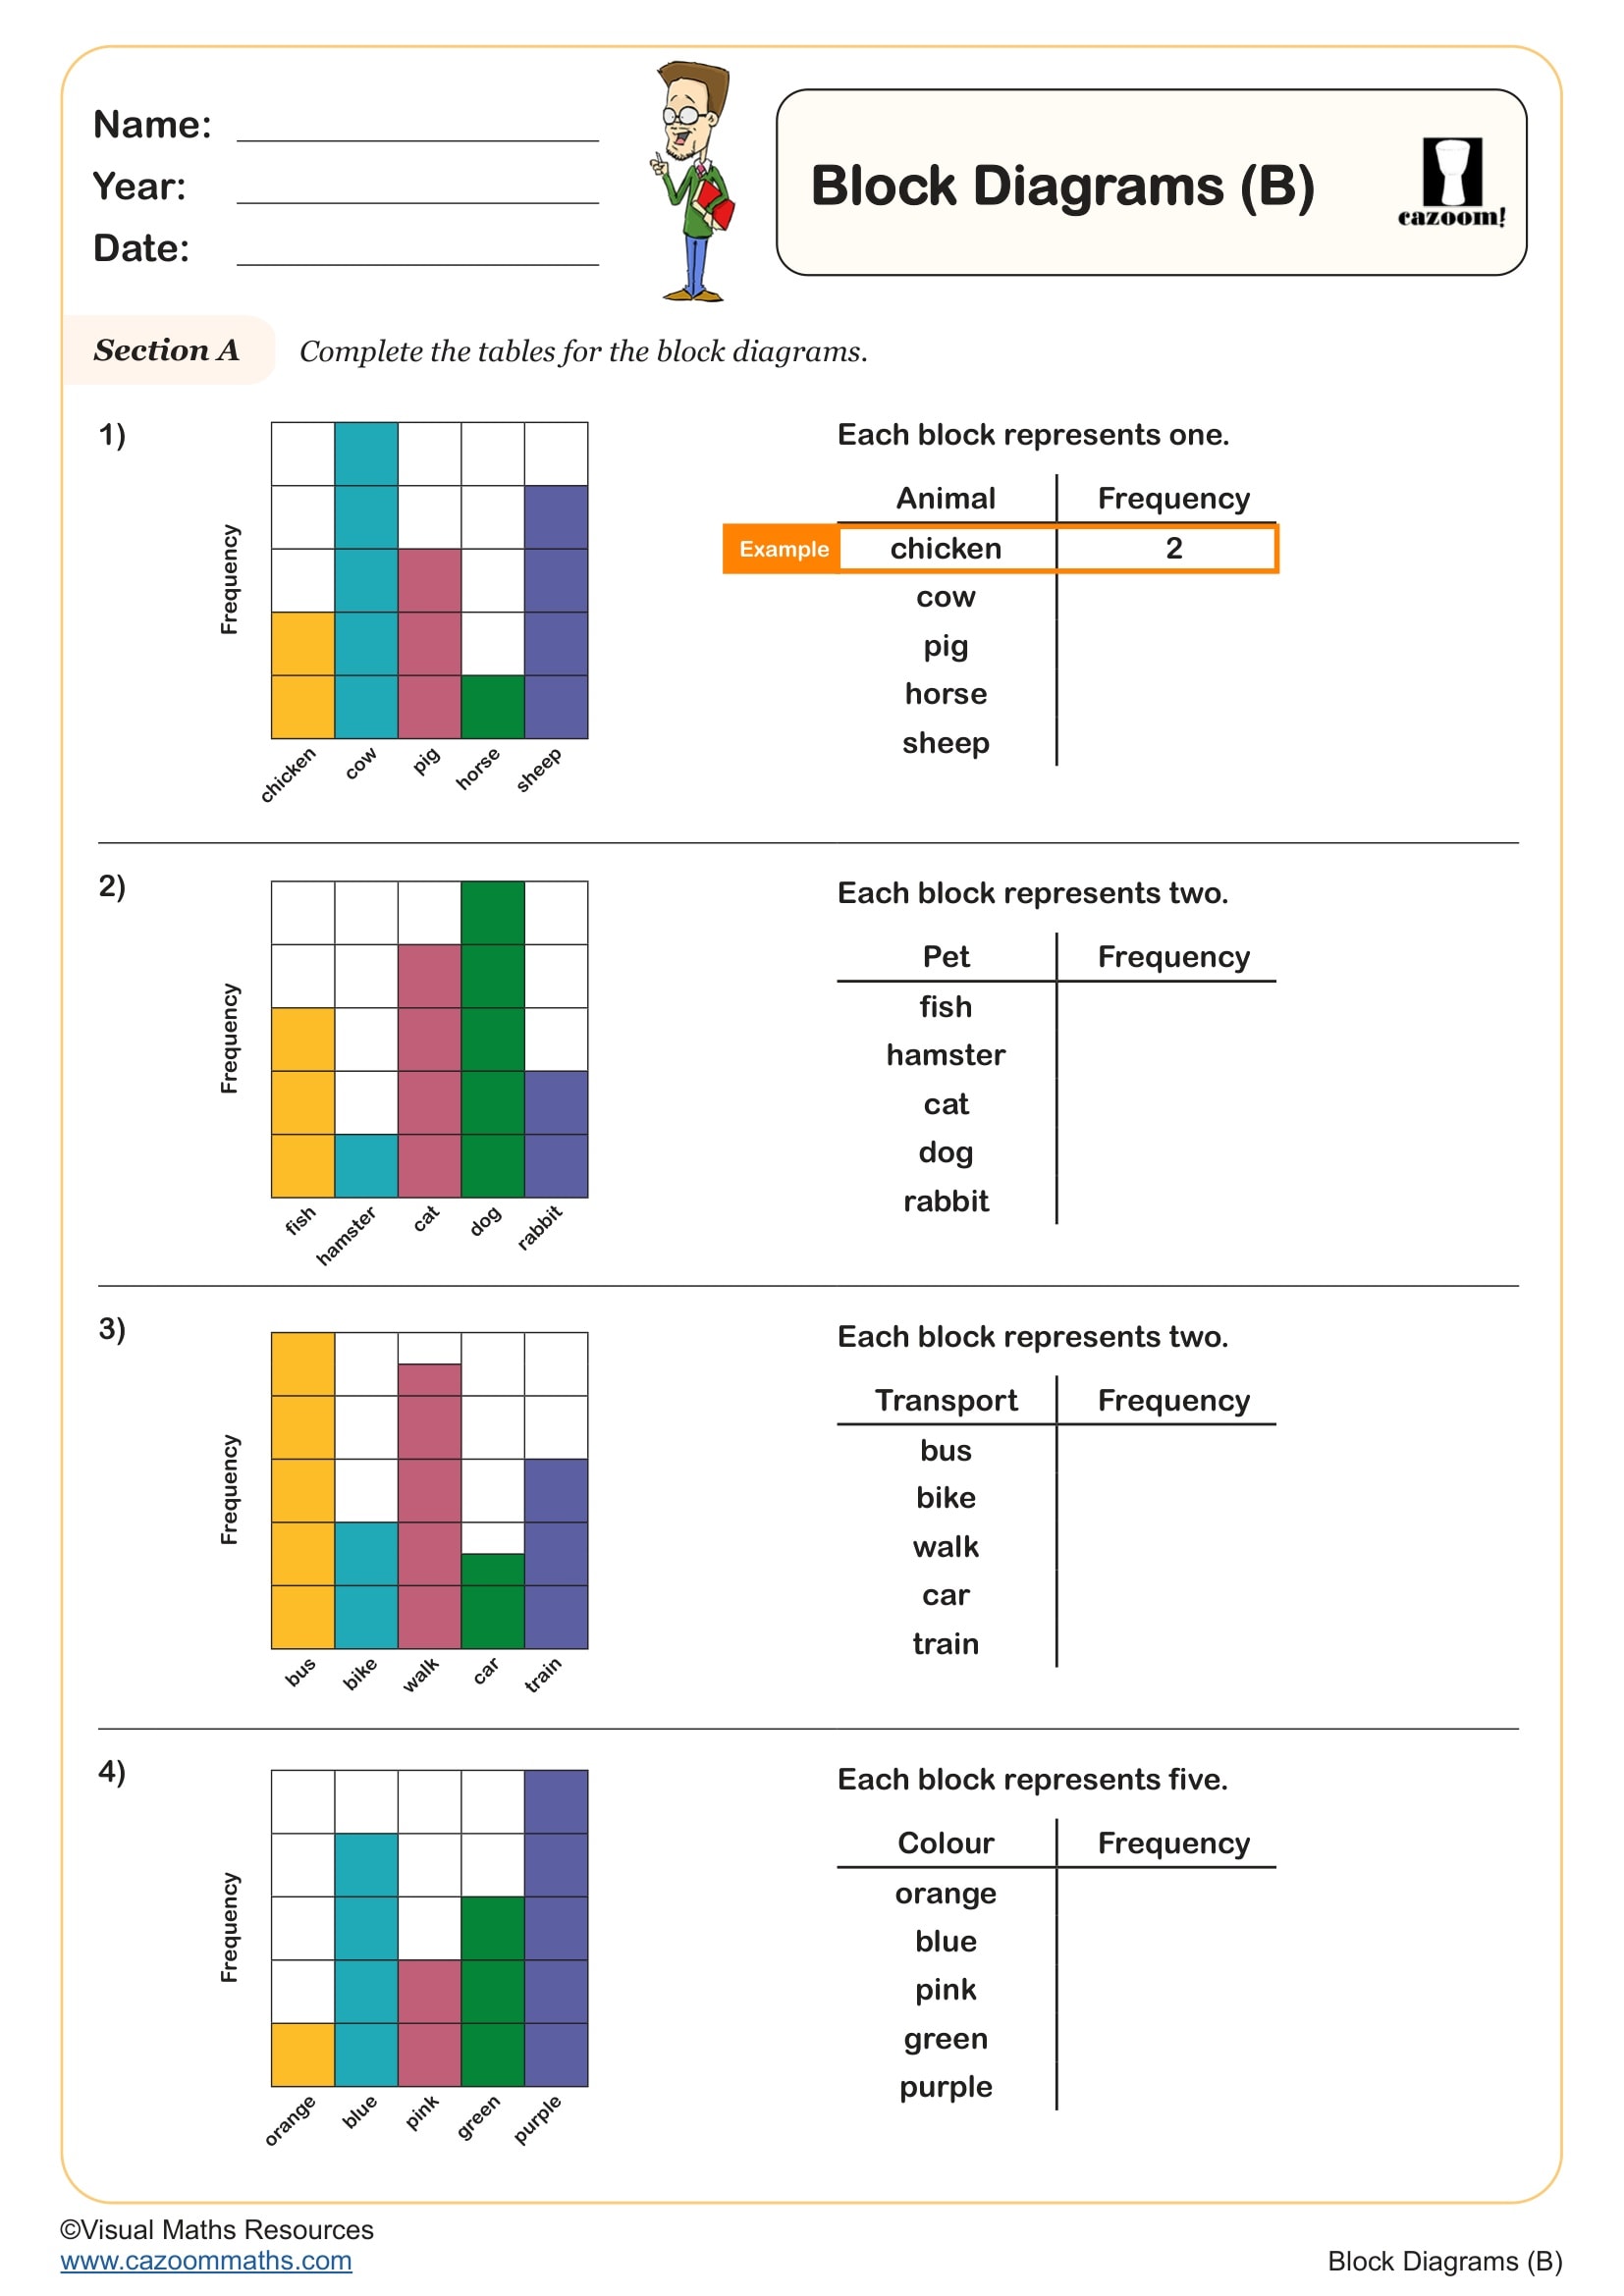
We have included quite a lot into these worksheets! Students progress from simple counting and tallying to constructing block diagrams and comparing categorical data. The favourite animals surveys are particularly popular - children love discovering which pets their classmates prefer. Each activity builds confidence in interpreting charts and asking meaningful questions about data.
Why Year 2 Learners Need Regular Statistics Practice
Here's what we've observed: children who get consistent practice with data handling develop much stronger mathematical reasoning skills. These worksheets help students meet their KS1 statistics objectives while building the foundation for more complex data work in Key Stage 2. The practical applications make abstract concepts feel real and relevant.
Key benefits for your classroom:
• Develops counting and sorting skills through engaging contexts
• Builds confidence in reading and creating visual data representations
• Strengthens problem-solving abilities through data comparison questions
• Supports the National Curriculum requirements for KS1 statistics
• Provides excellent assessment opportunities for tracking progress
Everyday Situations Where Children Use These Data Skills
Data handling appears everywhere in their world - from sports league tables to weather charts, from birthday calendars to choosing class monitors. These worksheets connect classroom learning to situations they encounter daily, making the skills feel purposeful and exciting.
Real-world applications they'll recognise:
• Reading sports results and league tables in newspapers
• Understanding weather symbols and temperature charts
• Interpreting food packaging information and nutrition labels
• Analysing survey results for school councils and class decisions
• Creating personal trackers for reading goals or pocket money
• Making sense of TV viewing figures and popularity polls