Year 5 Statistics Worksheets
All worksheets are created by the team of experienced teachers at Cazoom Maths.
Data Handling Worksheets for Year 5 Maths with Complete Answer Keys
Finding suitable Year 5 statistics resources that genuinely engage Year 5 learners is challenging. That is exactly why our curriculum experts developed these comprehensive worksheets covering everything from reading simple charts to interpreting complex data sets. Each of these Cazoom Maths statistics resources is created in ready-to-print PDF and comes with step-by-step solutions that show the thinking process, perfect for independent learning or guided practice sessions.
Essential Skills Covered in Our Year 5 Data and Statistics Collection
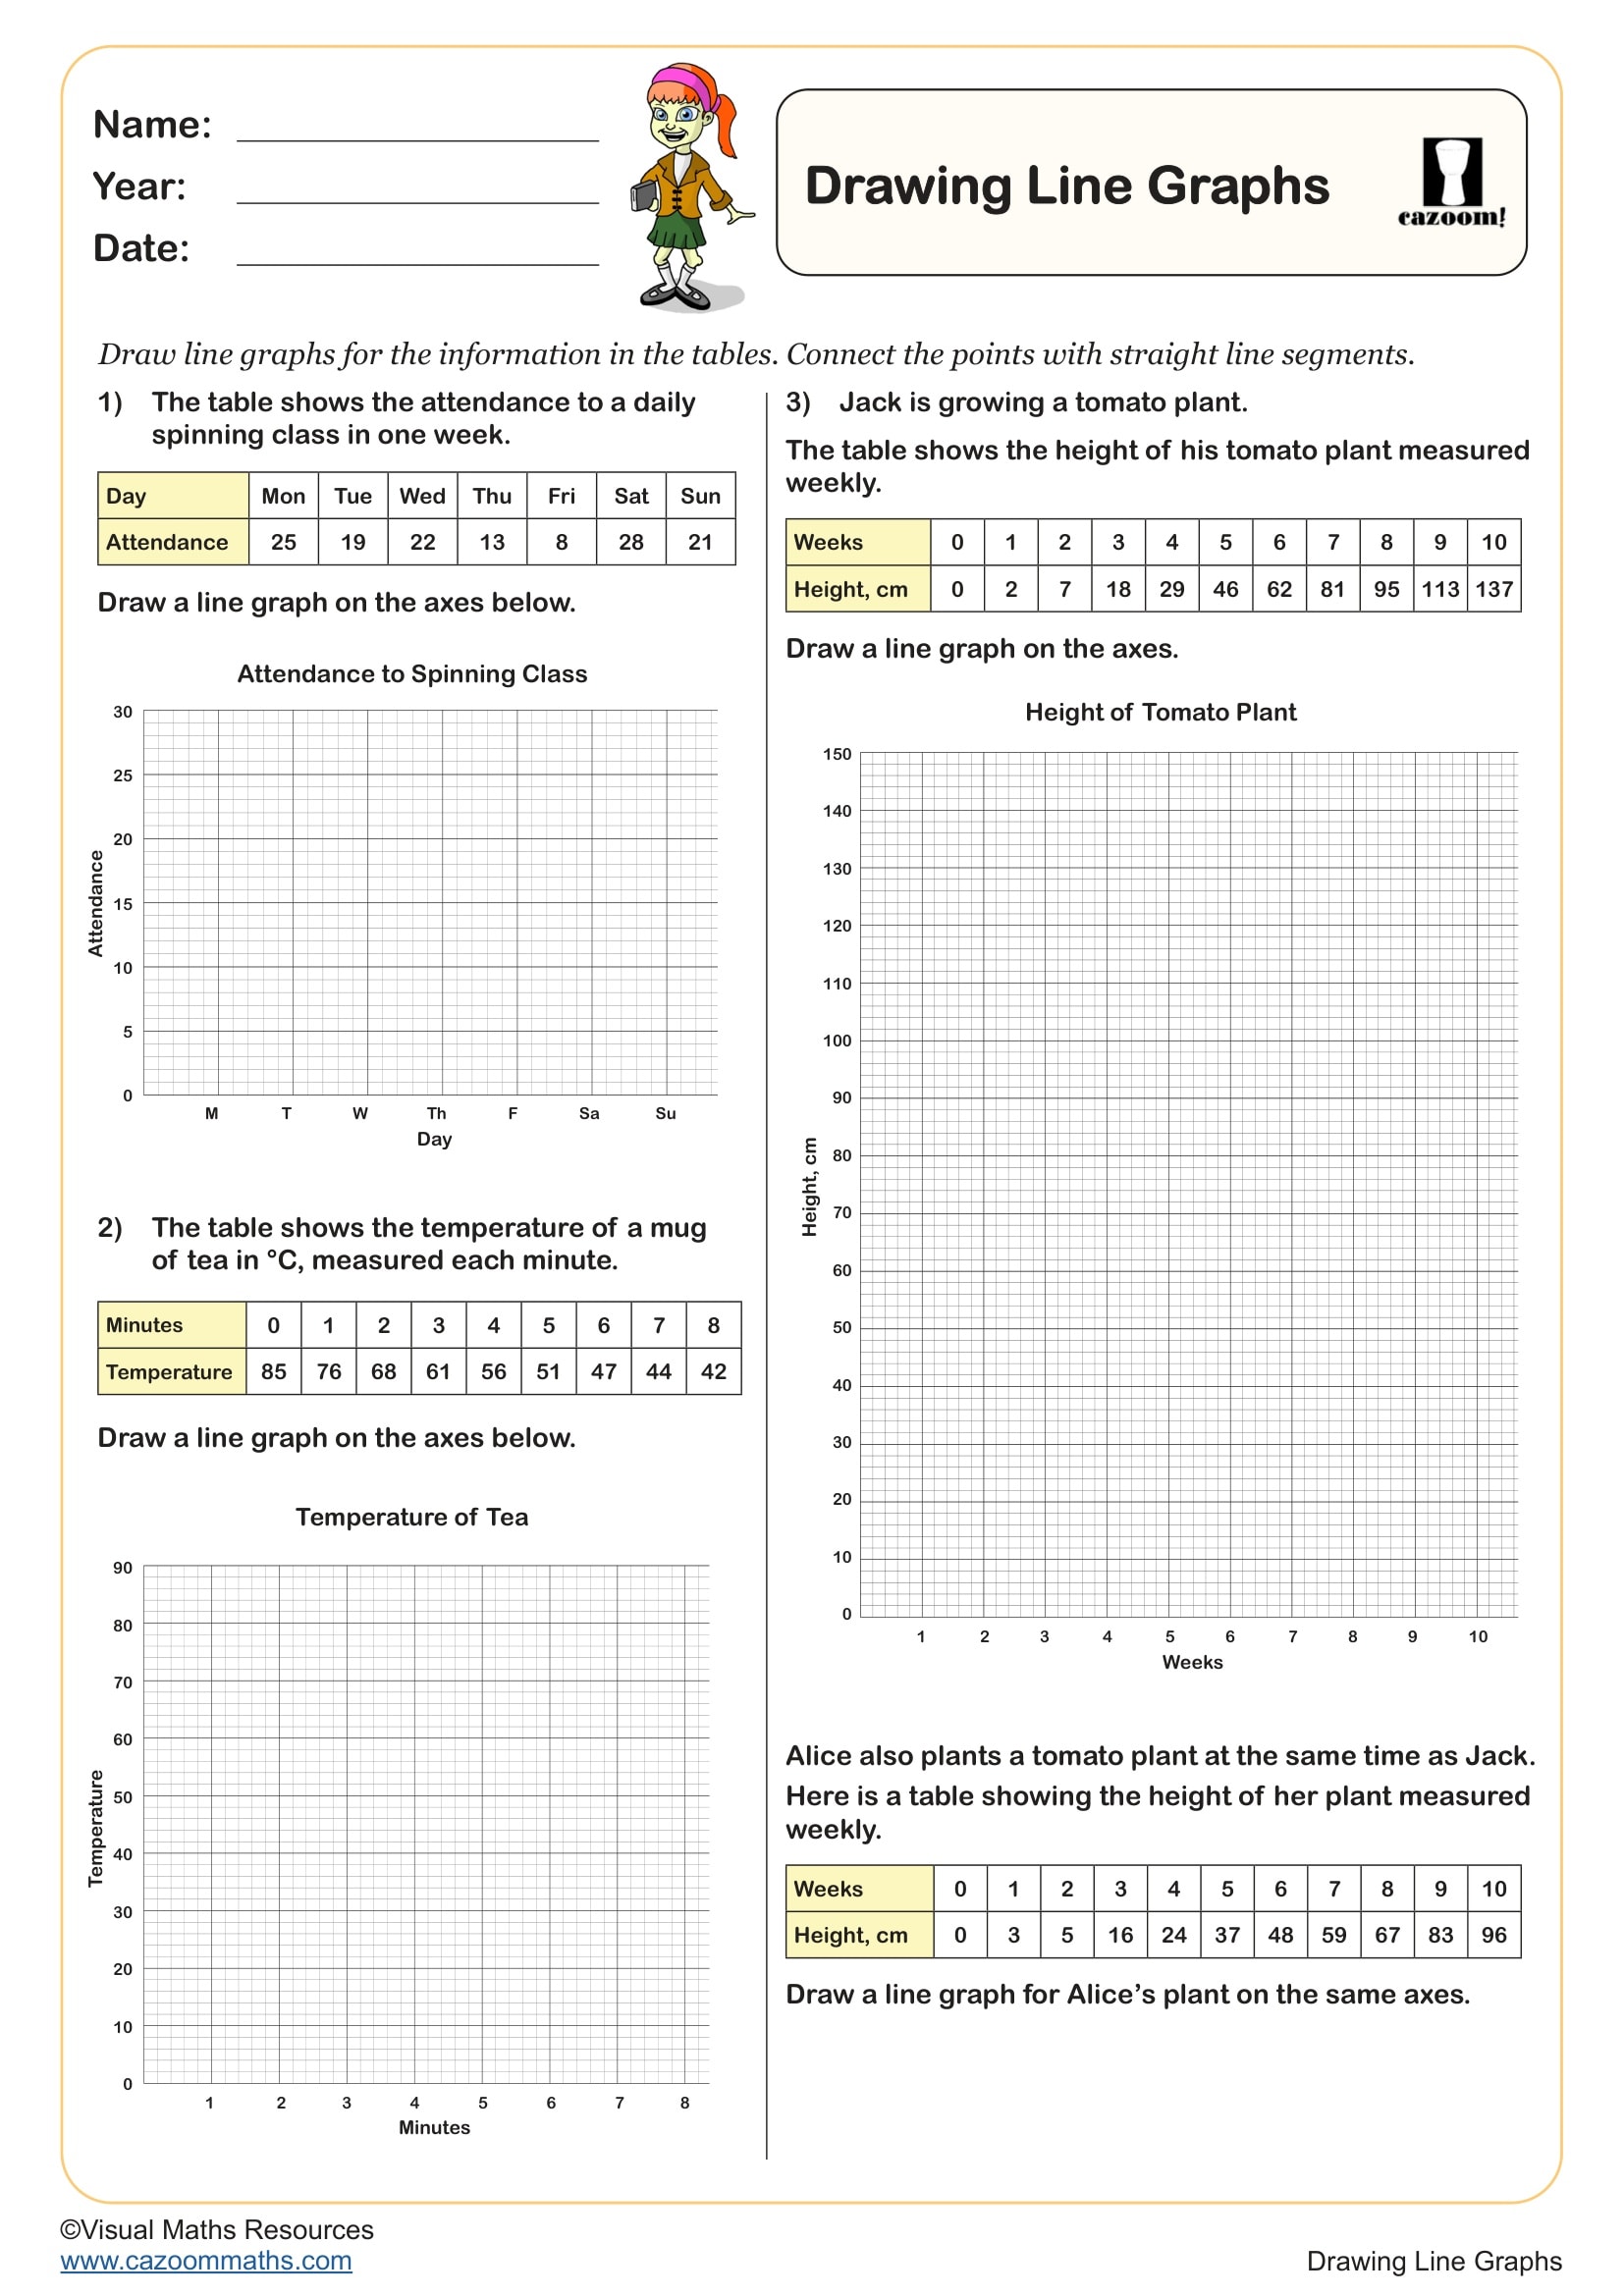
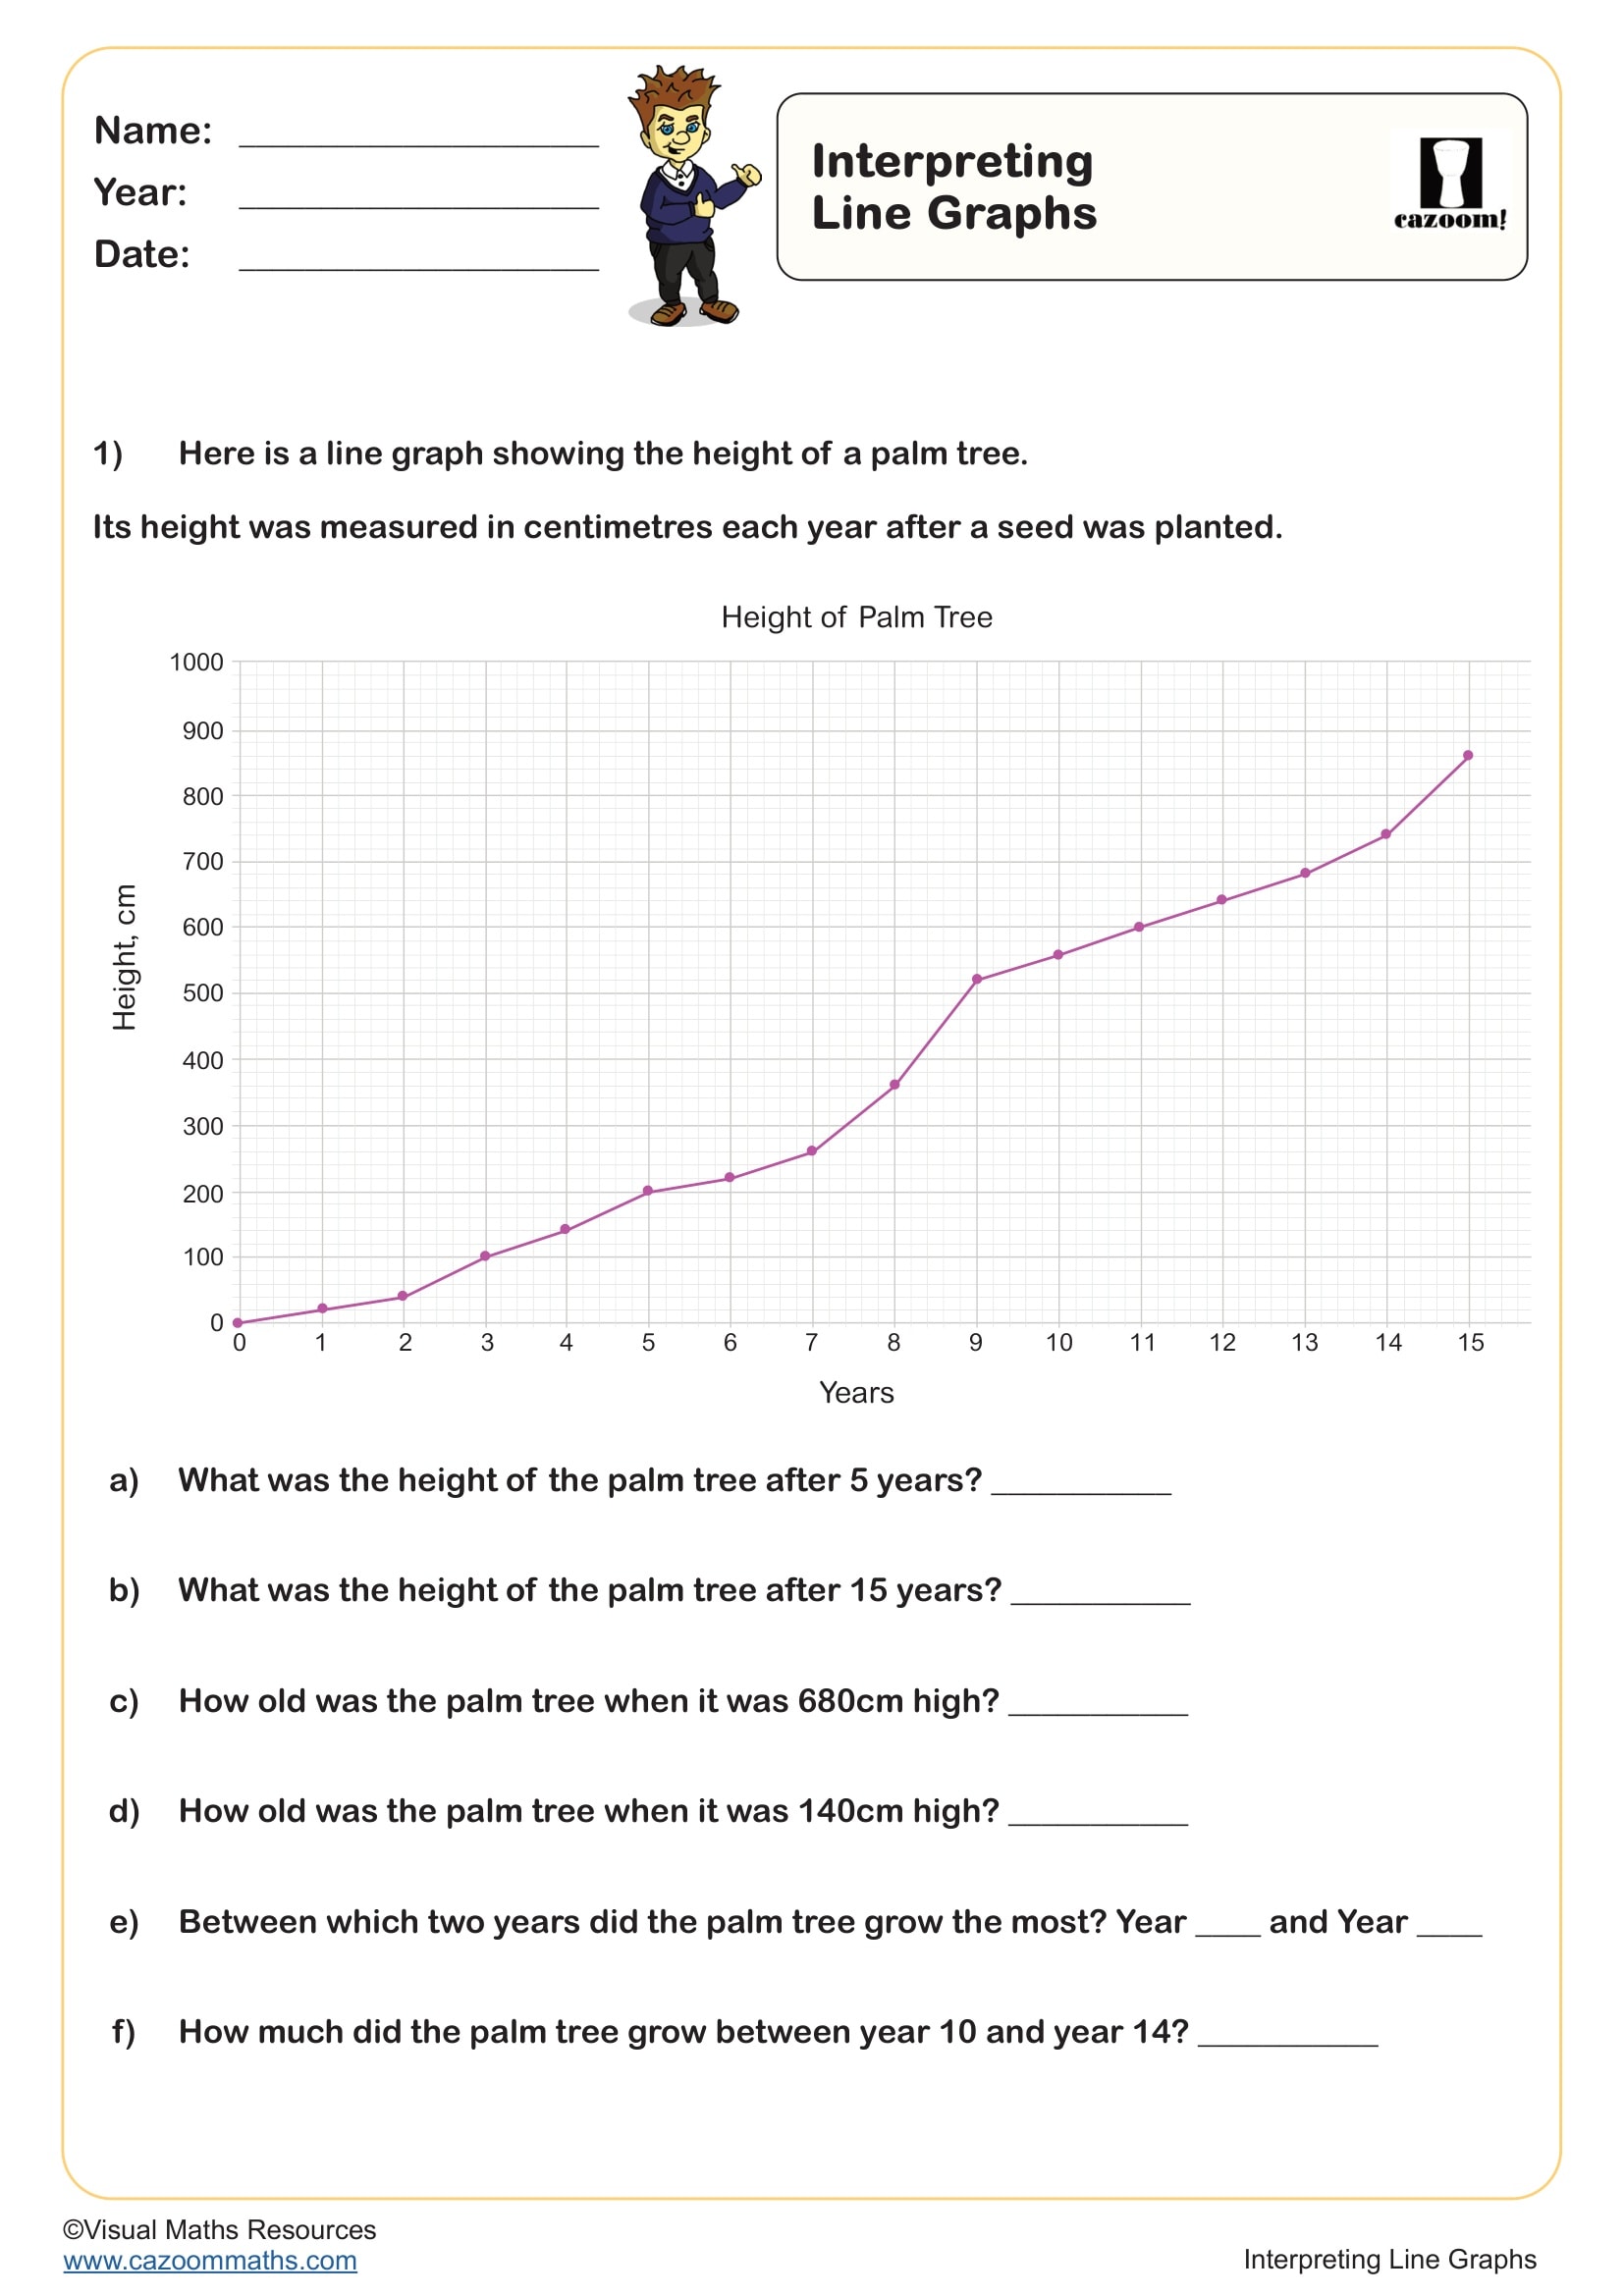
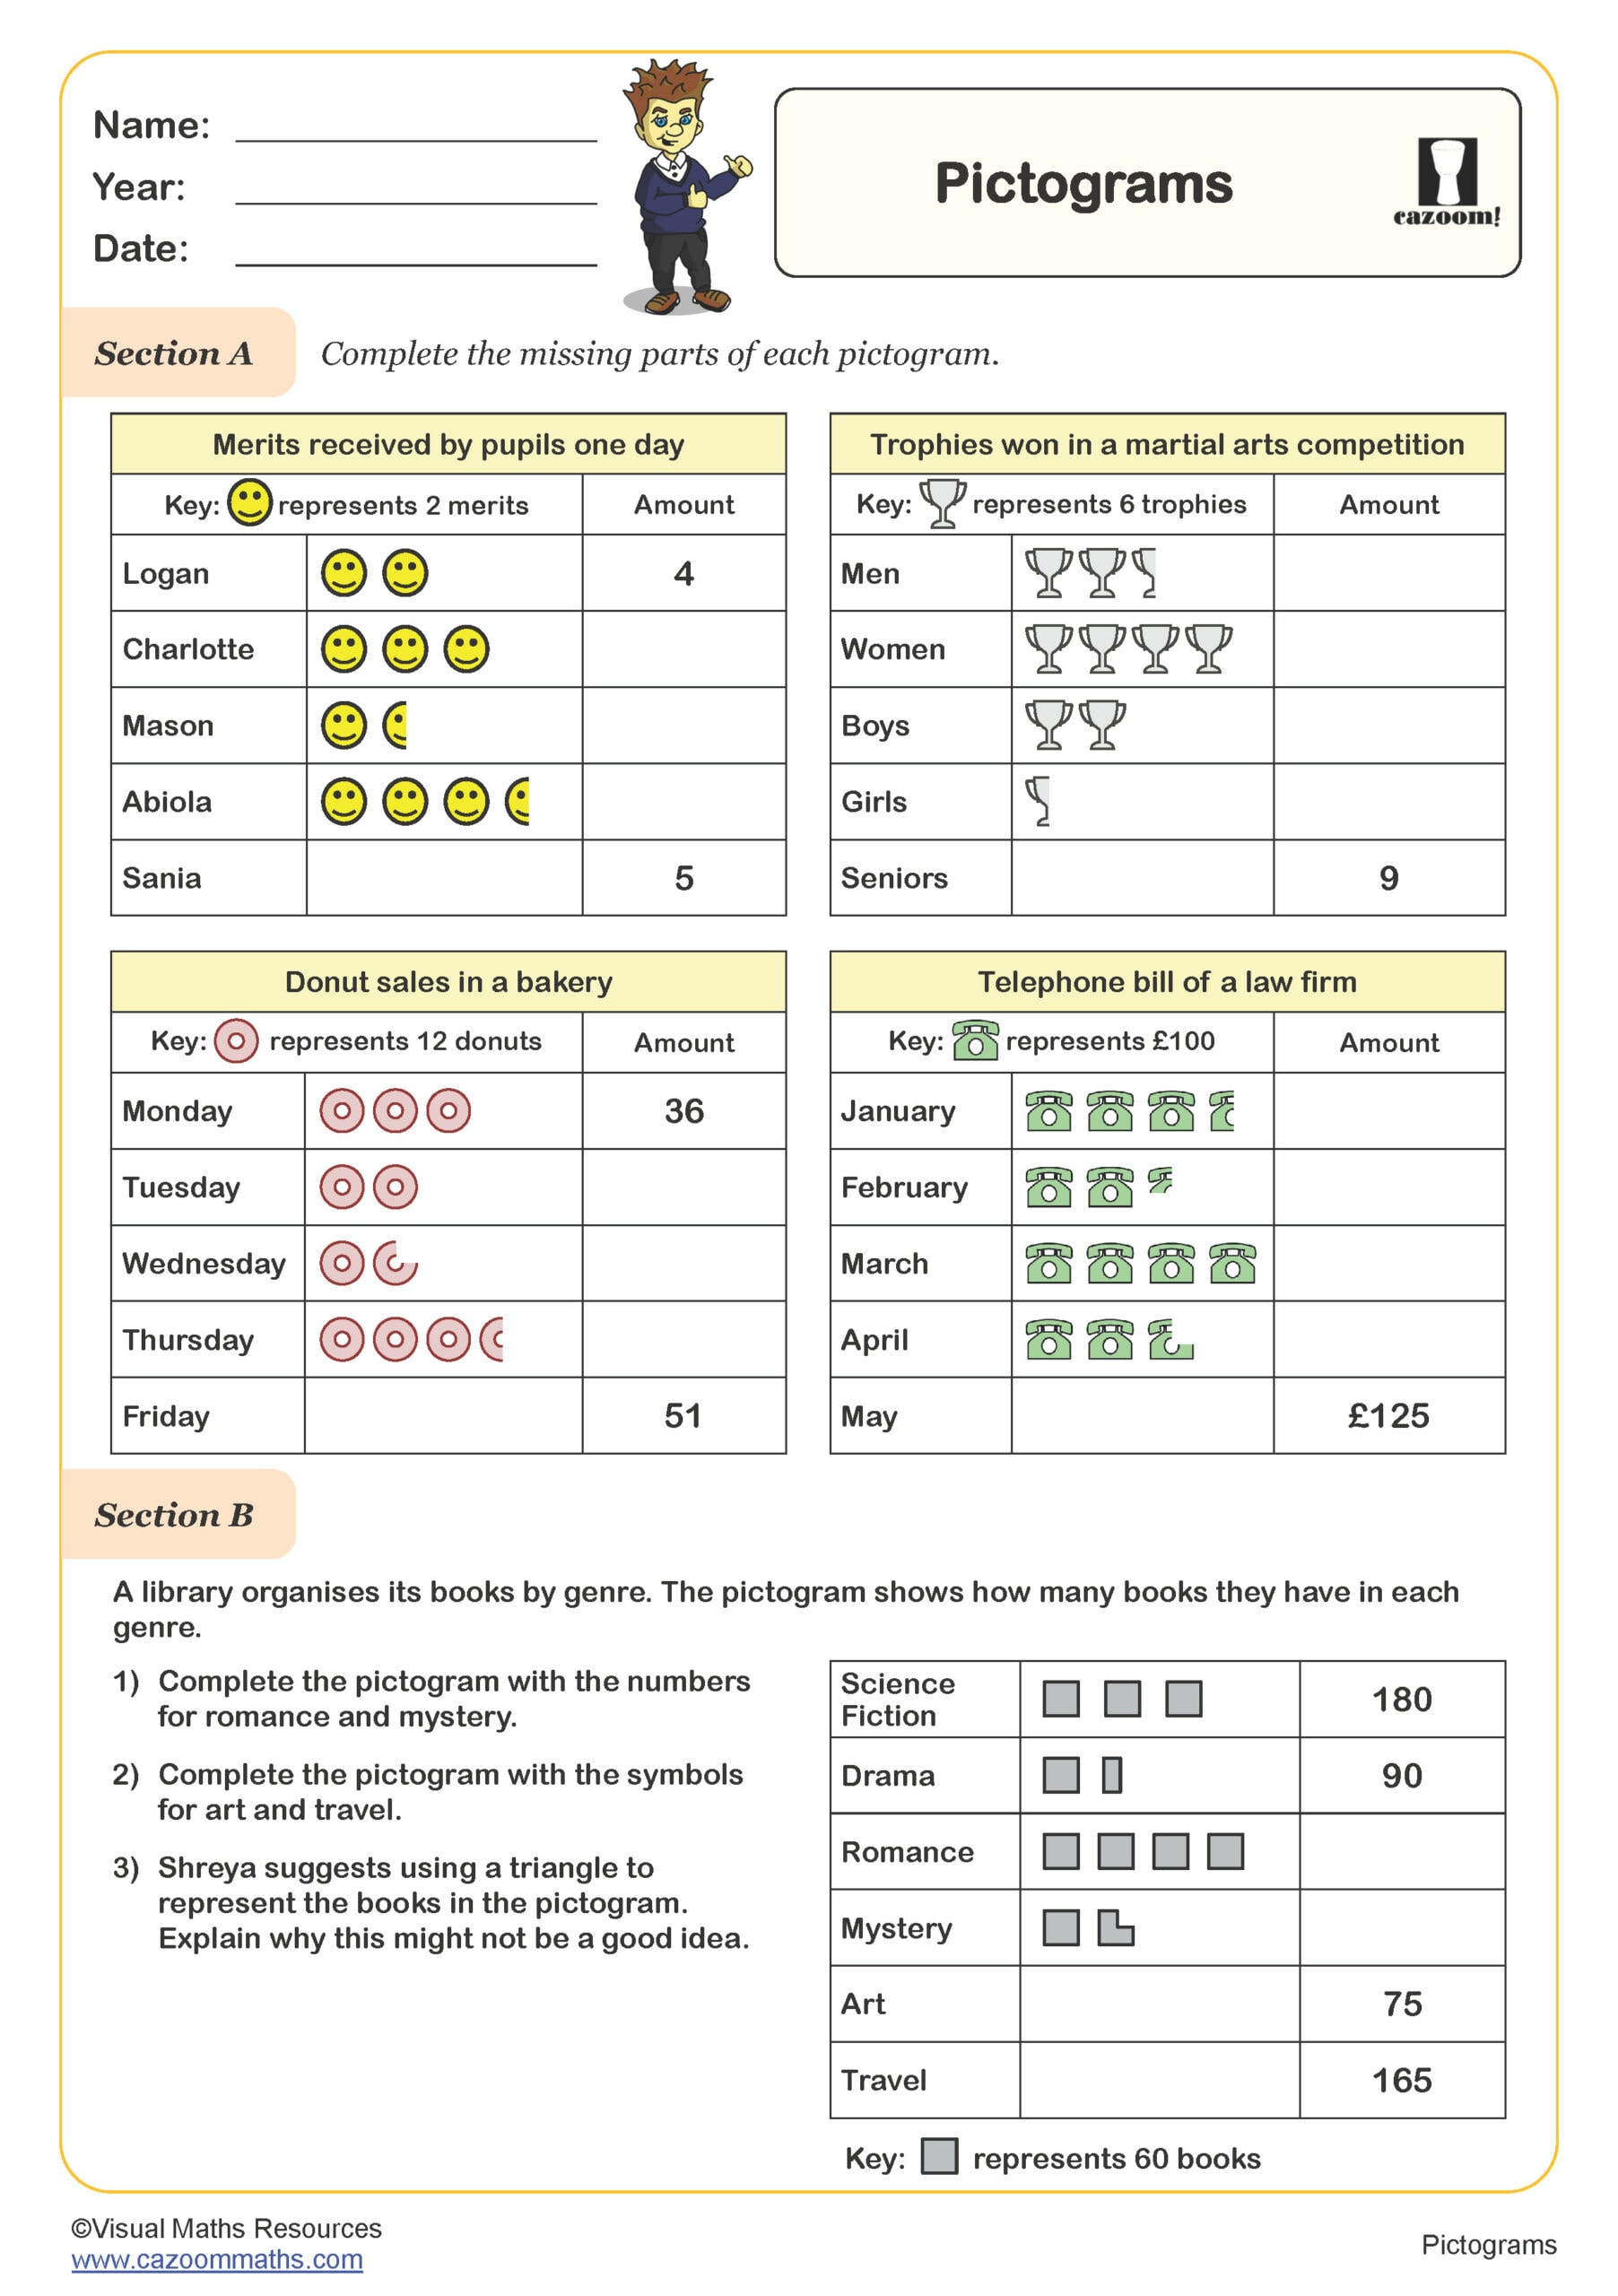
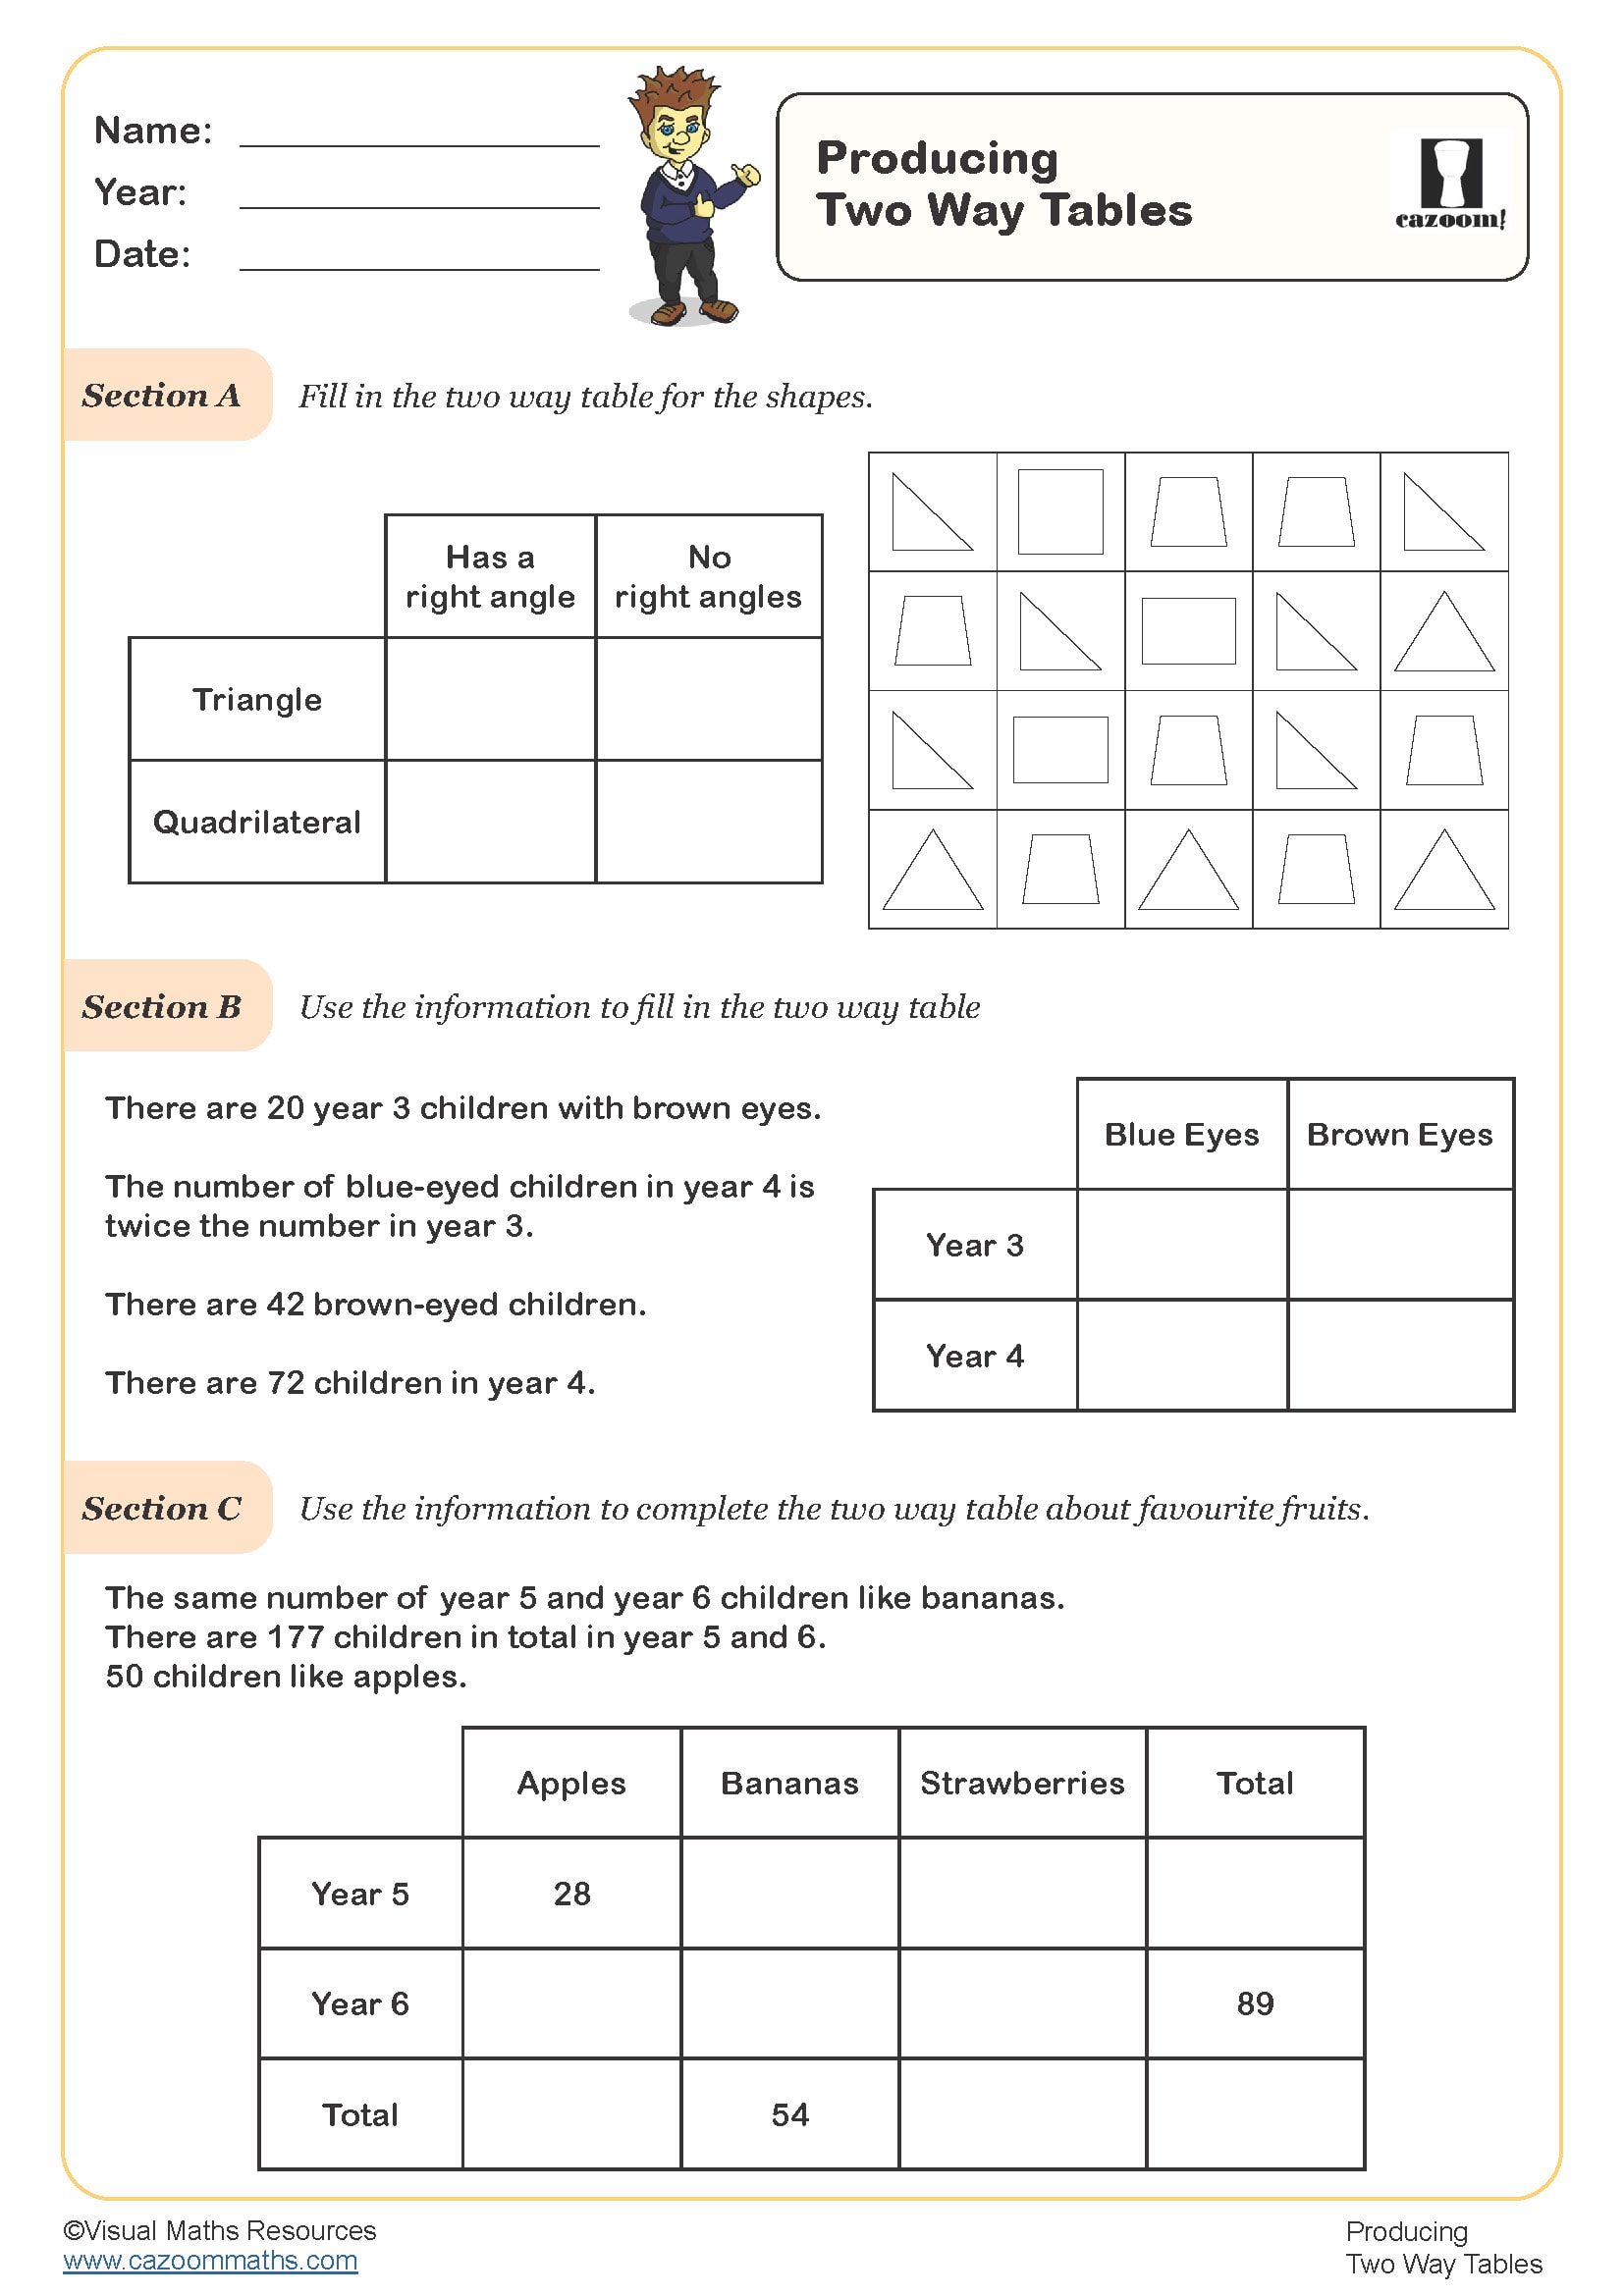
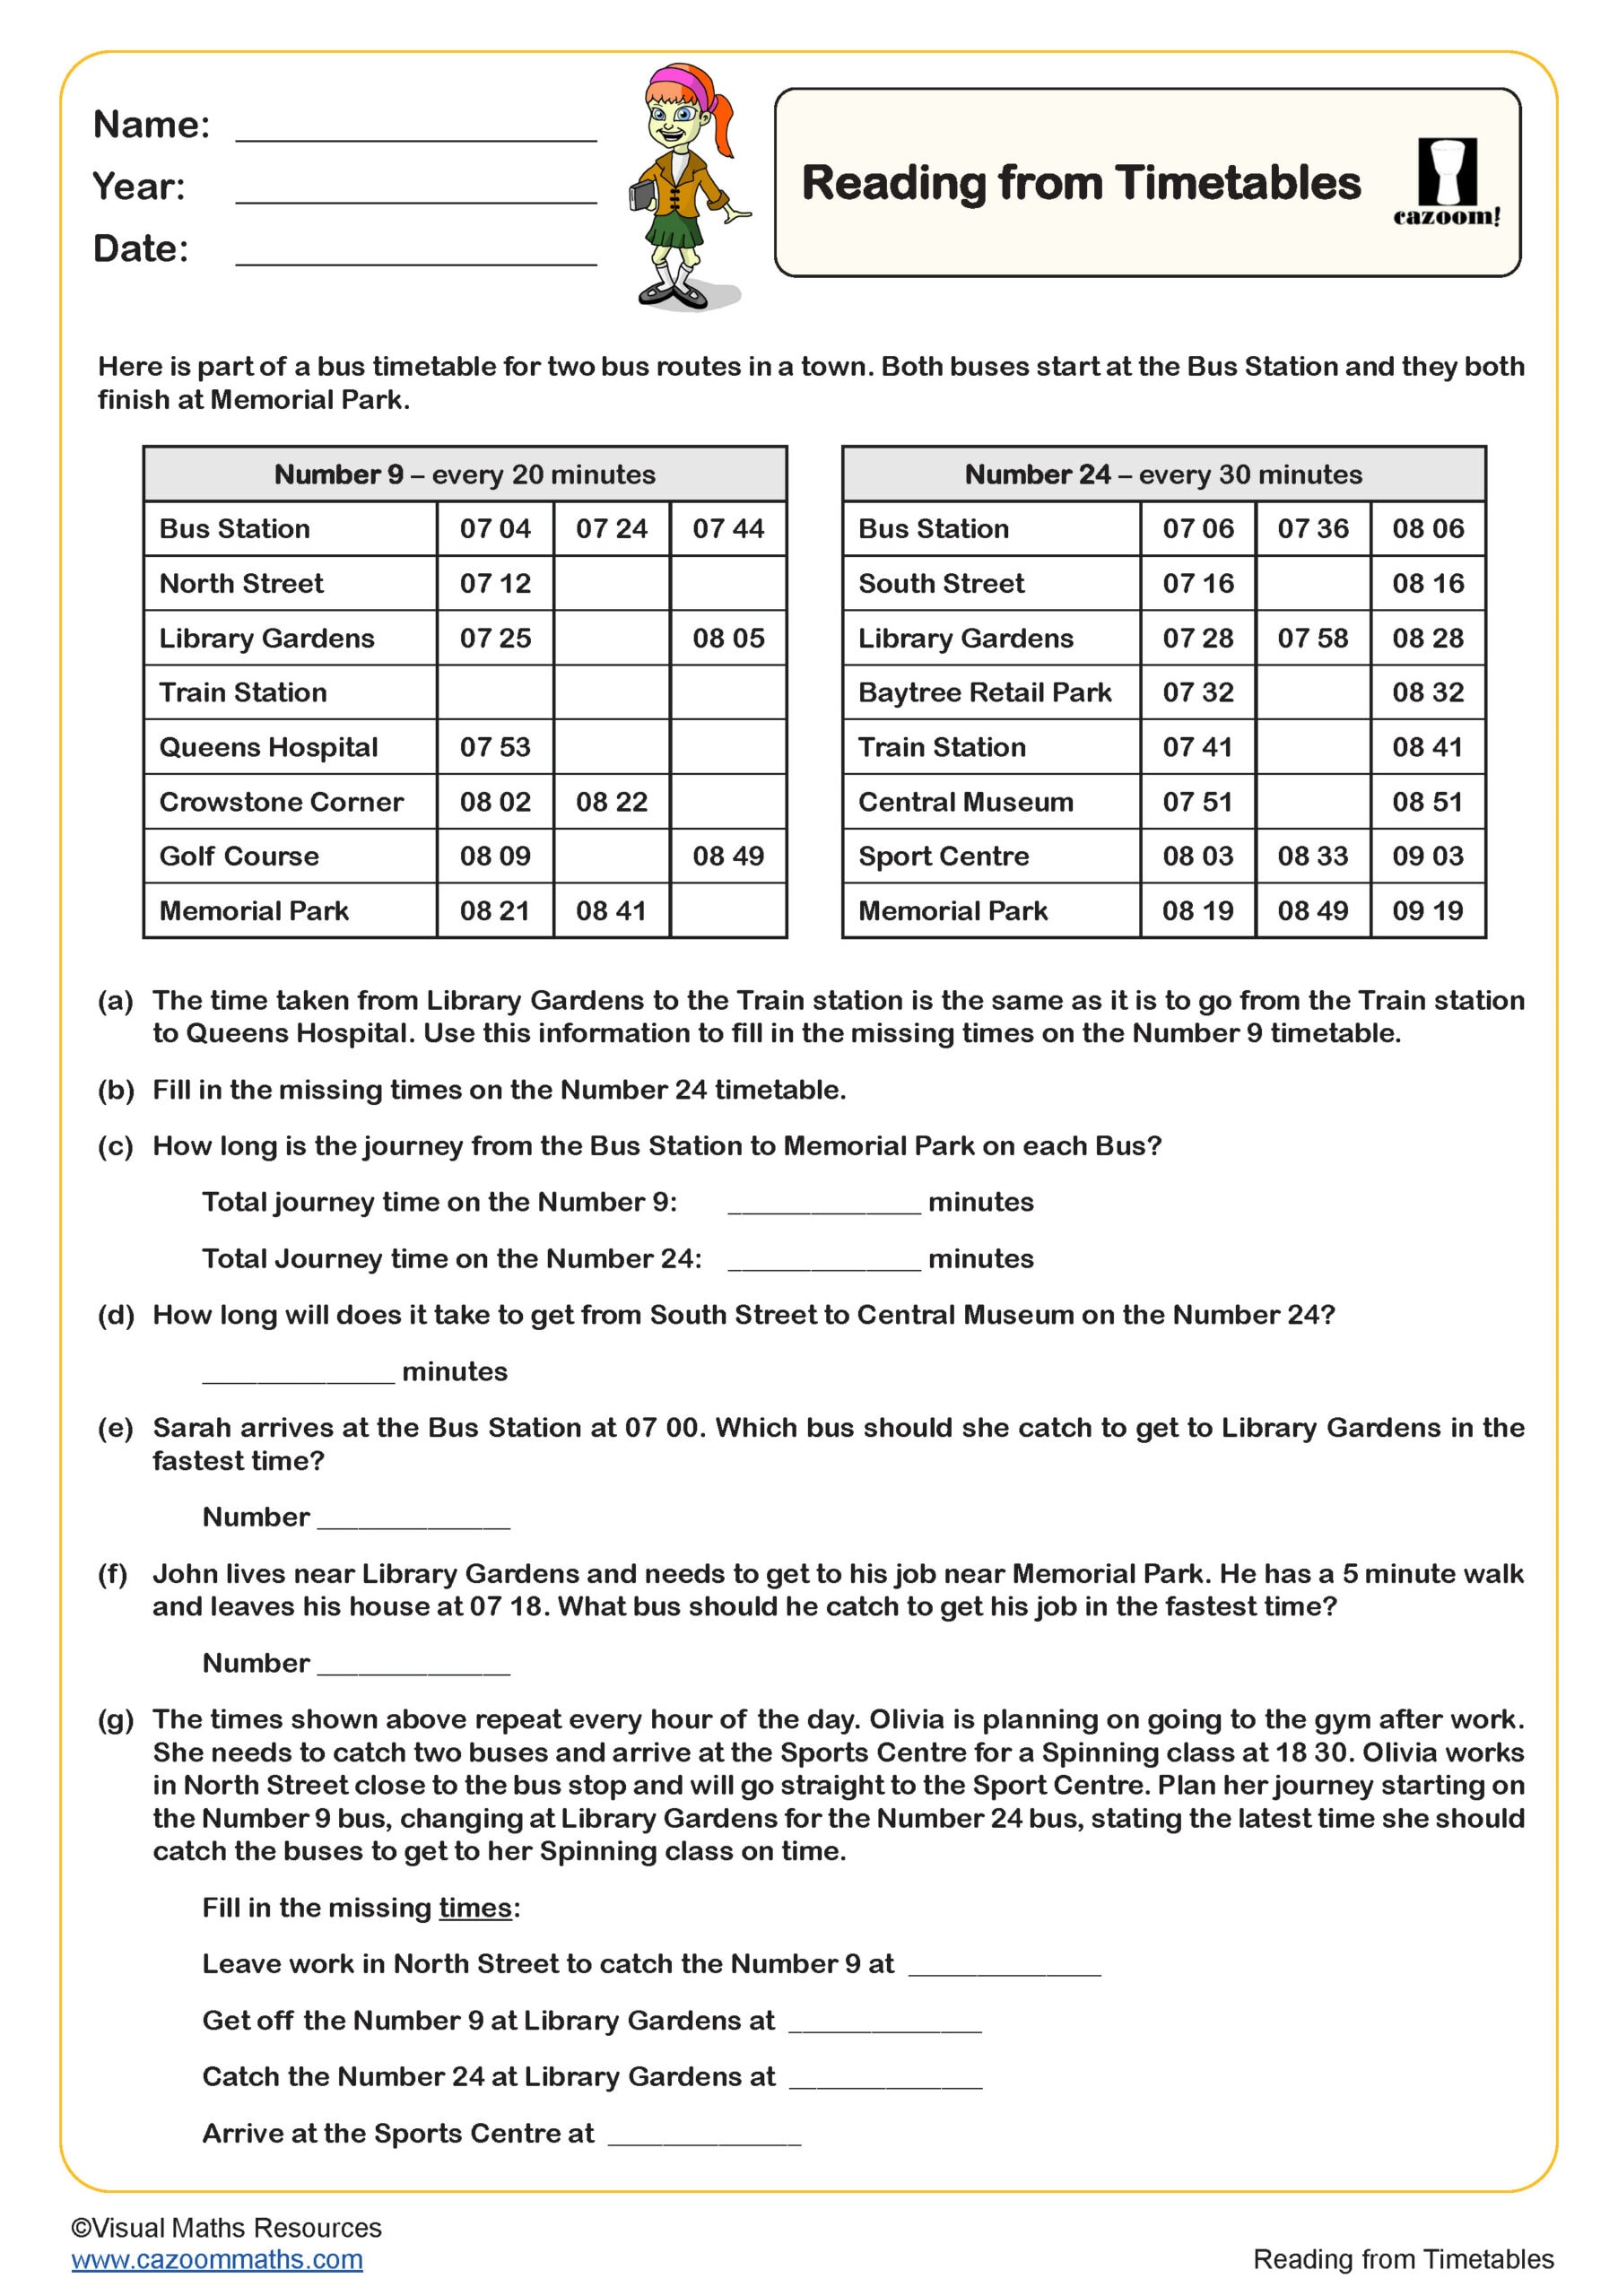
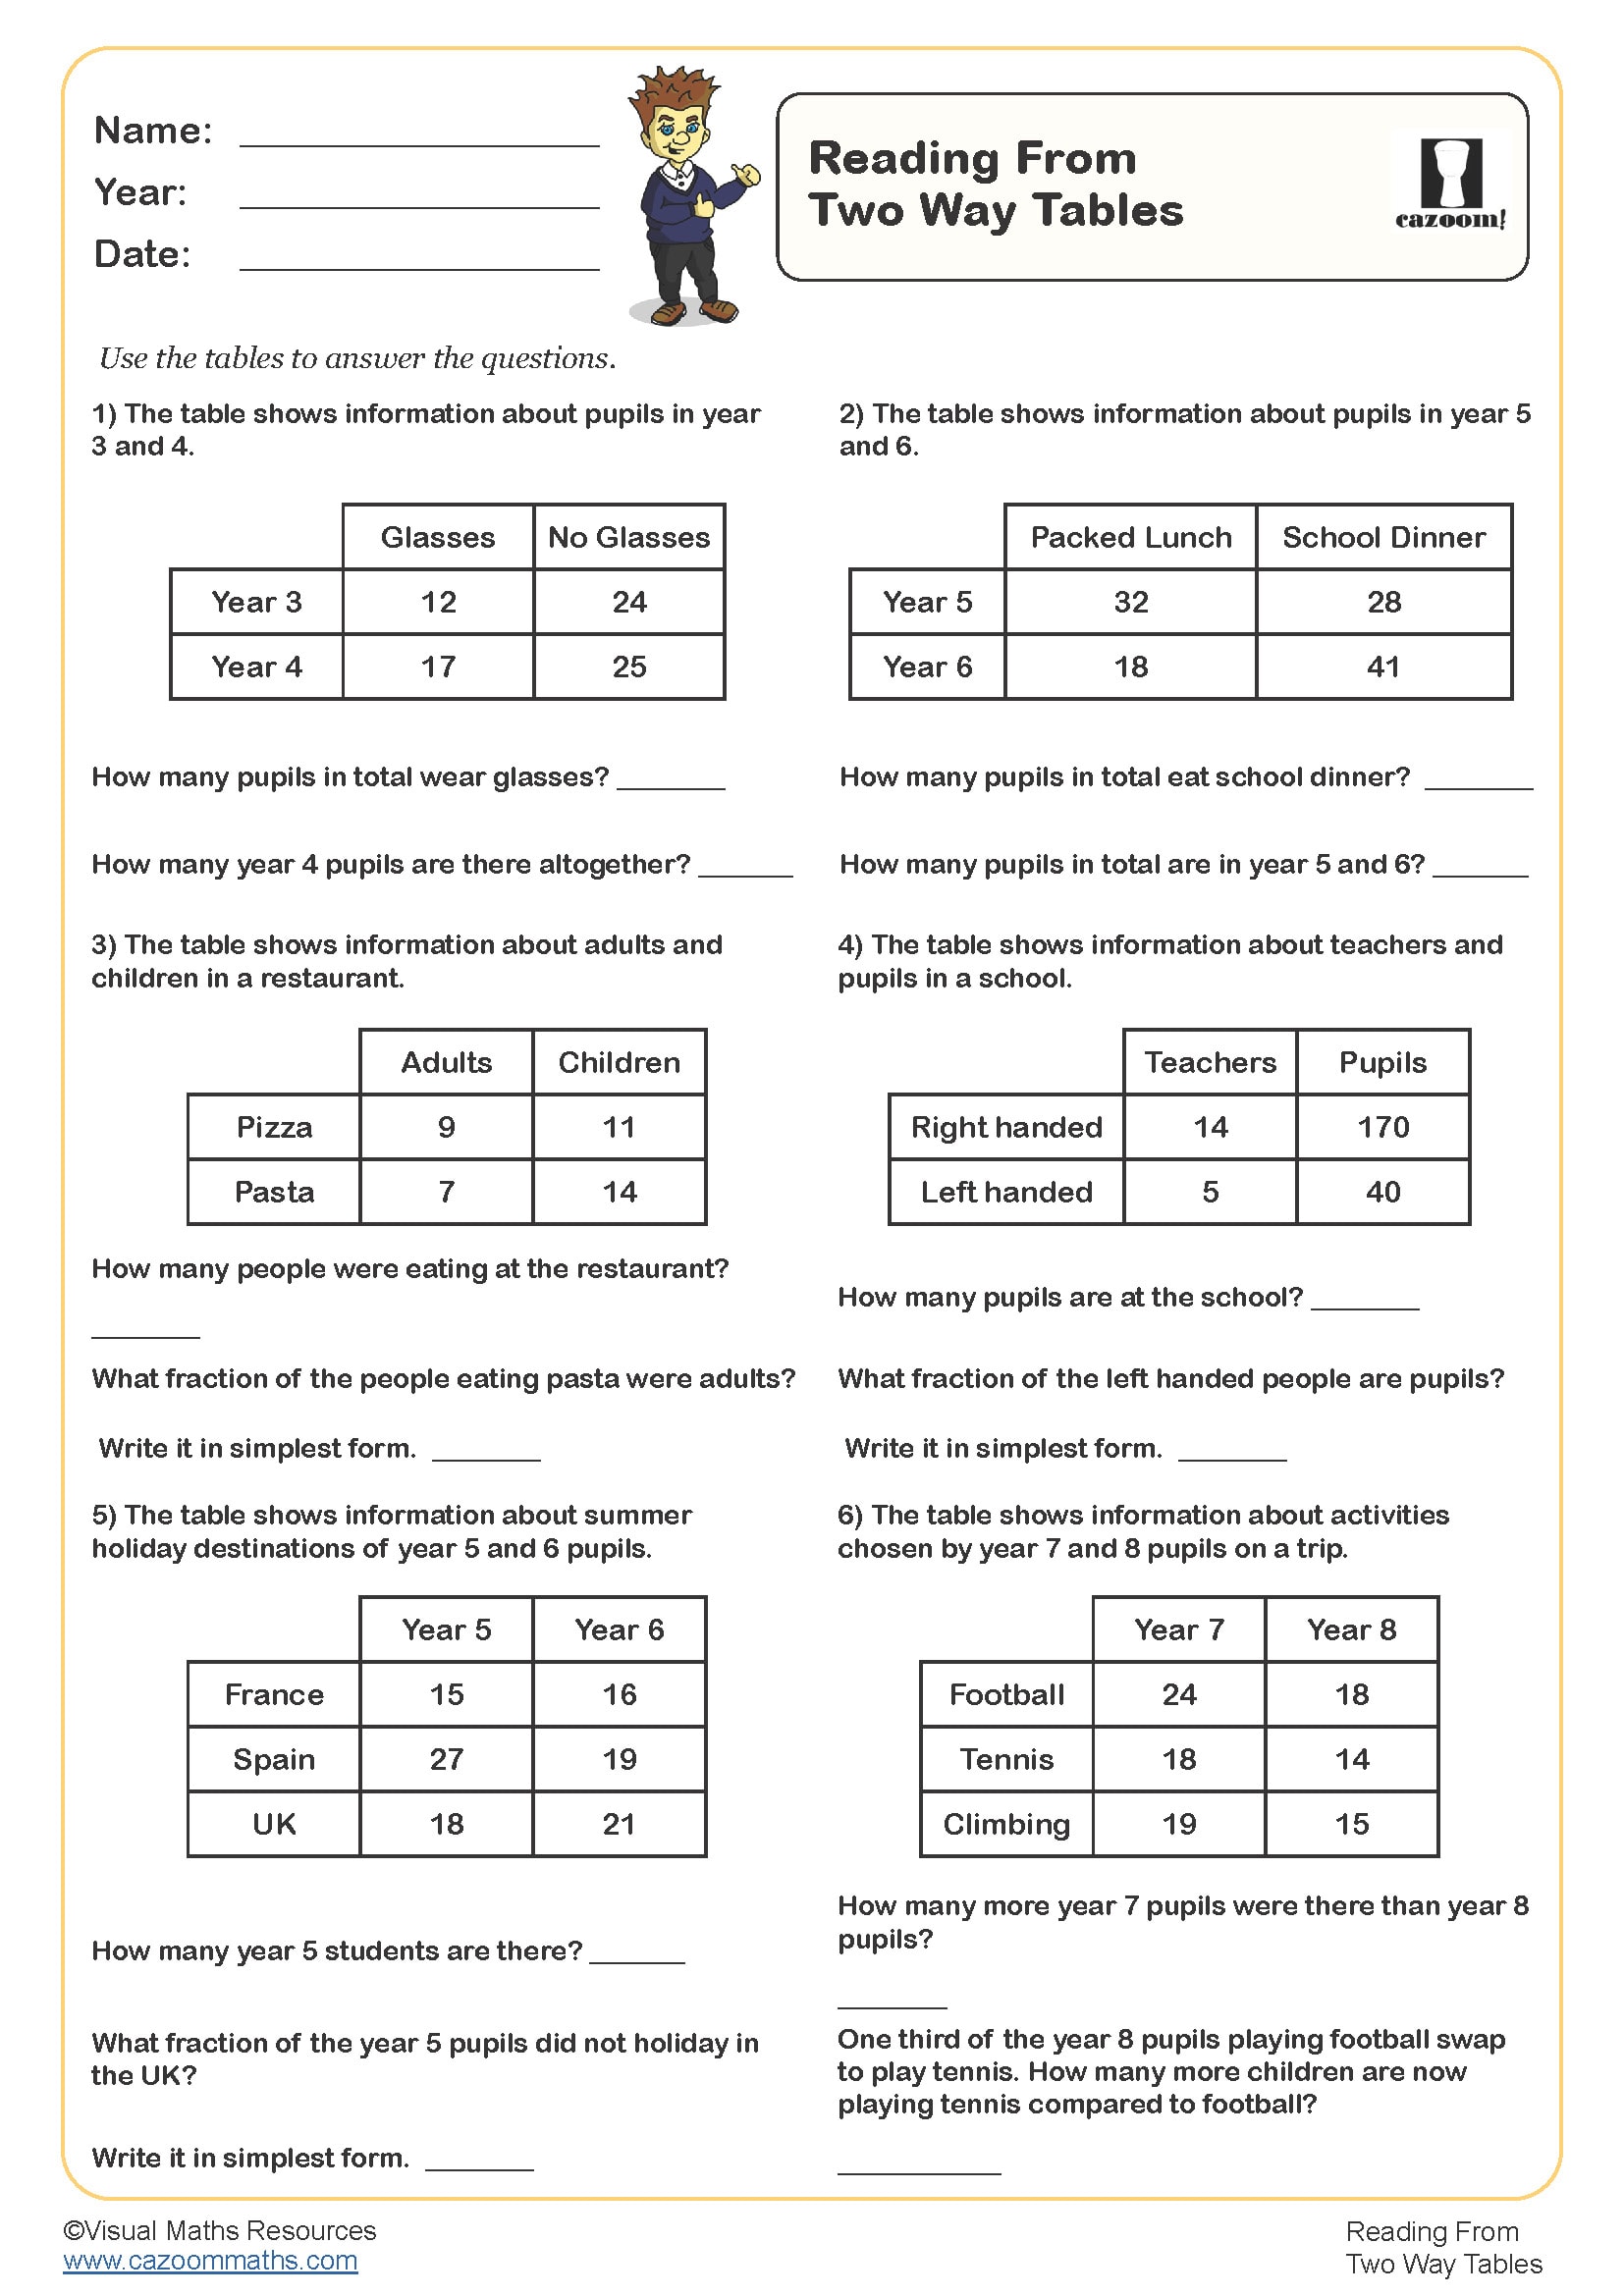
In Year 5 maths, statistics teaches students how to collect, organise, and interpret data using pictograms, bar charts, line graphs, and tables - basically turning numbers into visual stories that make sense. Students learn to read different types of graphs, find averages, and draw conclusions from data, which builds the analytical thinking skills they'll use throughout their education and daily life.
We have packed quite a lot into these statistics worksheets! Students progress from basic data collection to advanced graph interpretation. The collection includes pictograms, bar charts, line graphs, and tables - all the essentials for KS2 success. Students particularly love the real-world data examples (they're surprisingly engaging when it's about football scores or pocket money!).
Building Mathematical Confidence Through Year 5 Statistics Practice
Here's what we've noticed: students who practice statistics regularly perform significantly better in assessments. These worksheets bridge the gap between understanding concepts and applying them confidently. Regular practice builds the analytical thinking skills that'll serve them well in GCSE maths and beyond.
• Develops critical data interpretation skills
• Builds confidence with mathematical vocabulary
• Prepares students for KS2 SATs requirements
• Strengthens problem-solving abilities
• Creates a solid foundation for secondary maths
Where Year 5 Students Actually Use Data Analysis in Daily Life
Statistics appear everywhere! From comparing sports performance to understanding weather forecasts, these skills connect directly to science, geography, and even art projects. It's actually quite rewarding when students start spotting graphs and charts in their everyday lives.
• Analysing sports league tables and player statistics
• Understanding weather data and climate patterns
• Comparing shopping prices and making smart choices
• Reading survey results in newspapers and online
• Creating presentations for school projects
• Interpreting scientific experiment results