Year 6 Statistics Worksheets
All worksheets are created by the team of experienced teachers at Cazoom Maths.
Statistics Worksheets with Answers PDF - Complete Teaching Solutions
Our Cazoom Maths expert team has observed that advanced statistics skills can be overwhelming for your young students who are transitioning from KS1 to KS2. However, without mastering these basic statistical equations, your primary school students will face difficulties in KS3. To make this learning process smooth and convenient, we have created our worksheets in ready-to-use, printable PDF format. Each of these worksheets includes separate answer sheets to facilitate an easy checking process. Download our maths activities right now to provide the extra help your young learners need!
Essential Data Skills Covered in Our Statistics Worksheets
We have included a wide variety of concepts into our statistics worksheets! Your primary school pupils particularly enjoy the real-world data sets we use. Here are the important concepts that are included in our KS2 statistics resources-
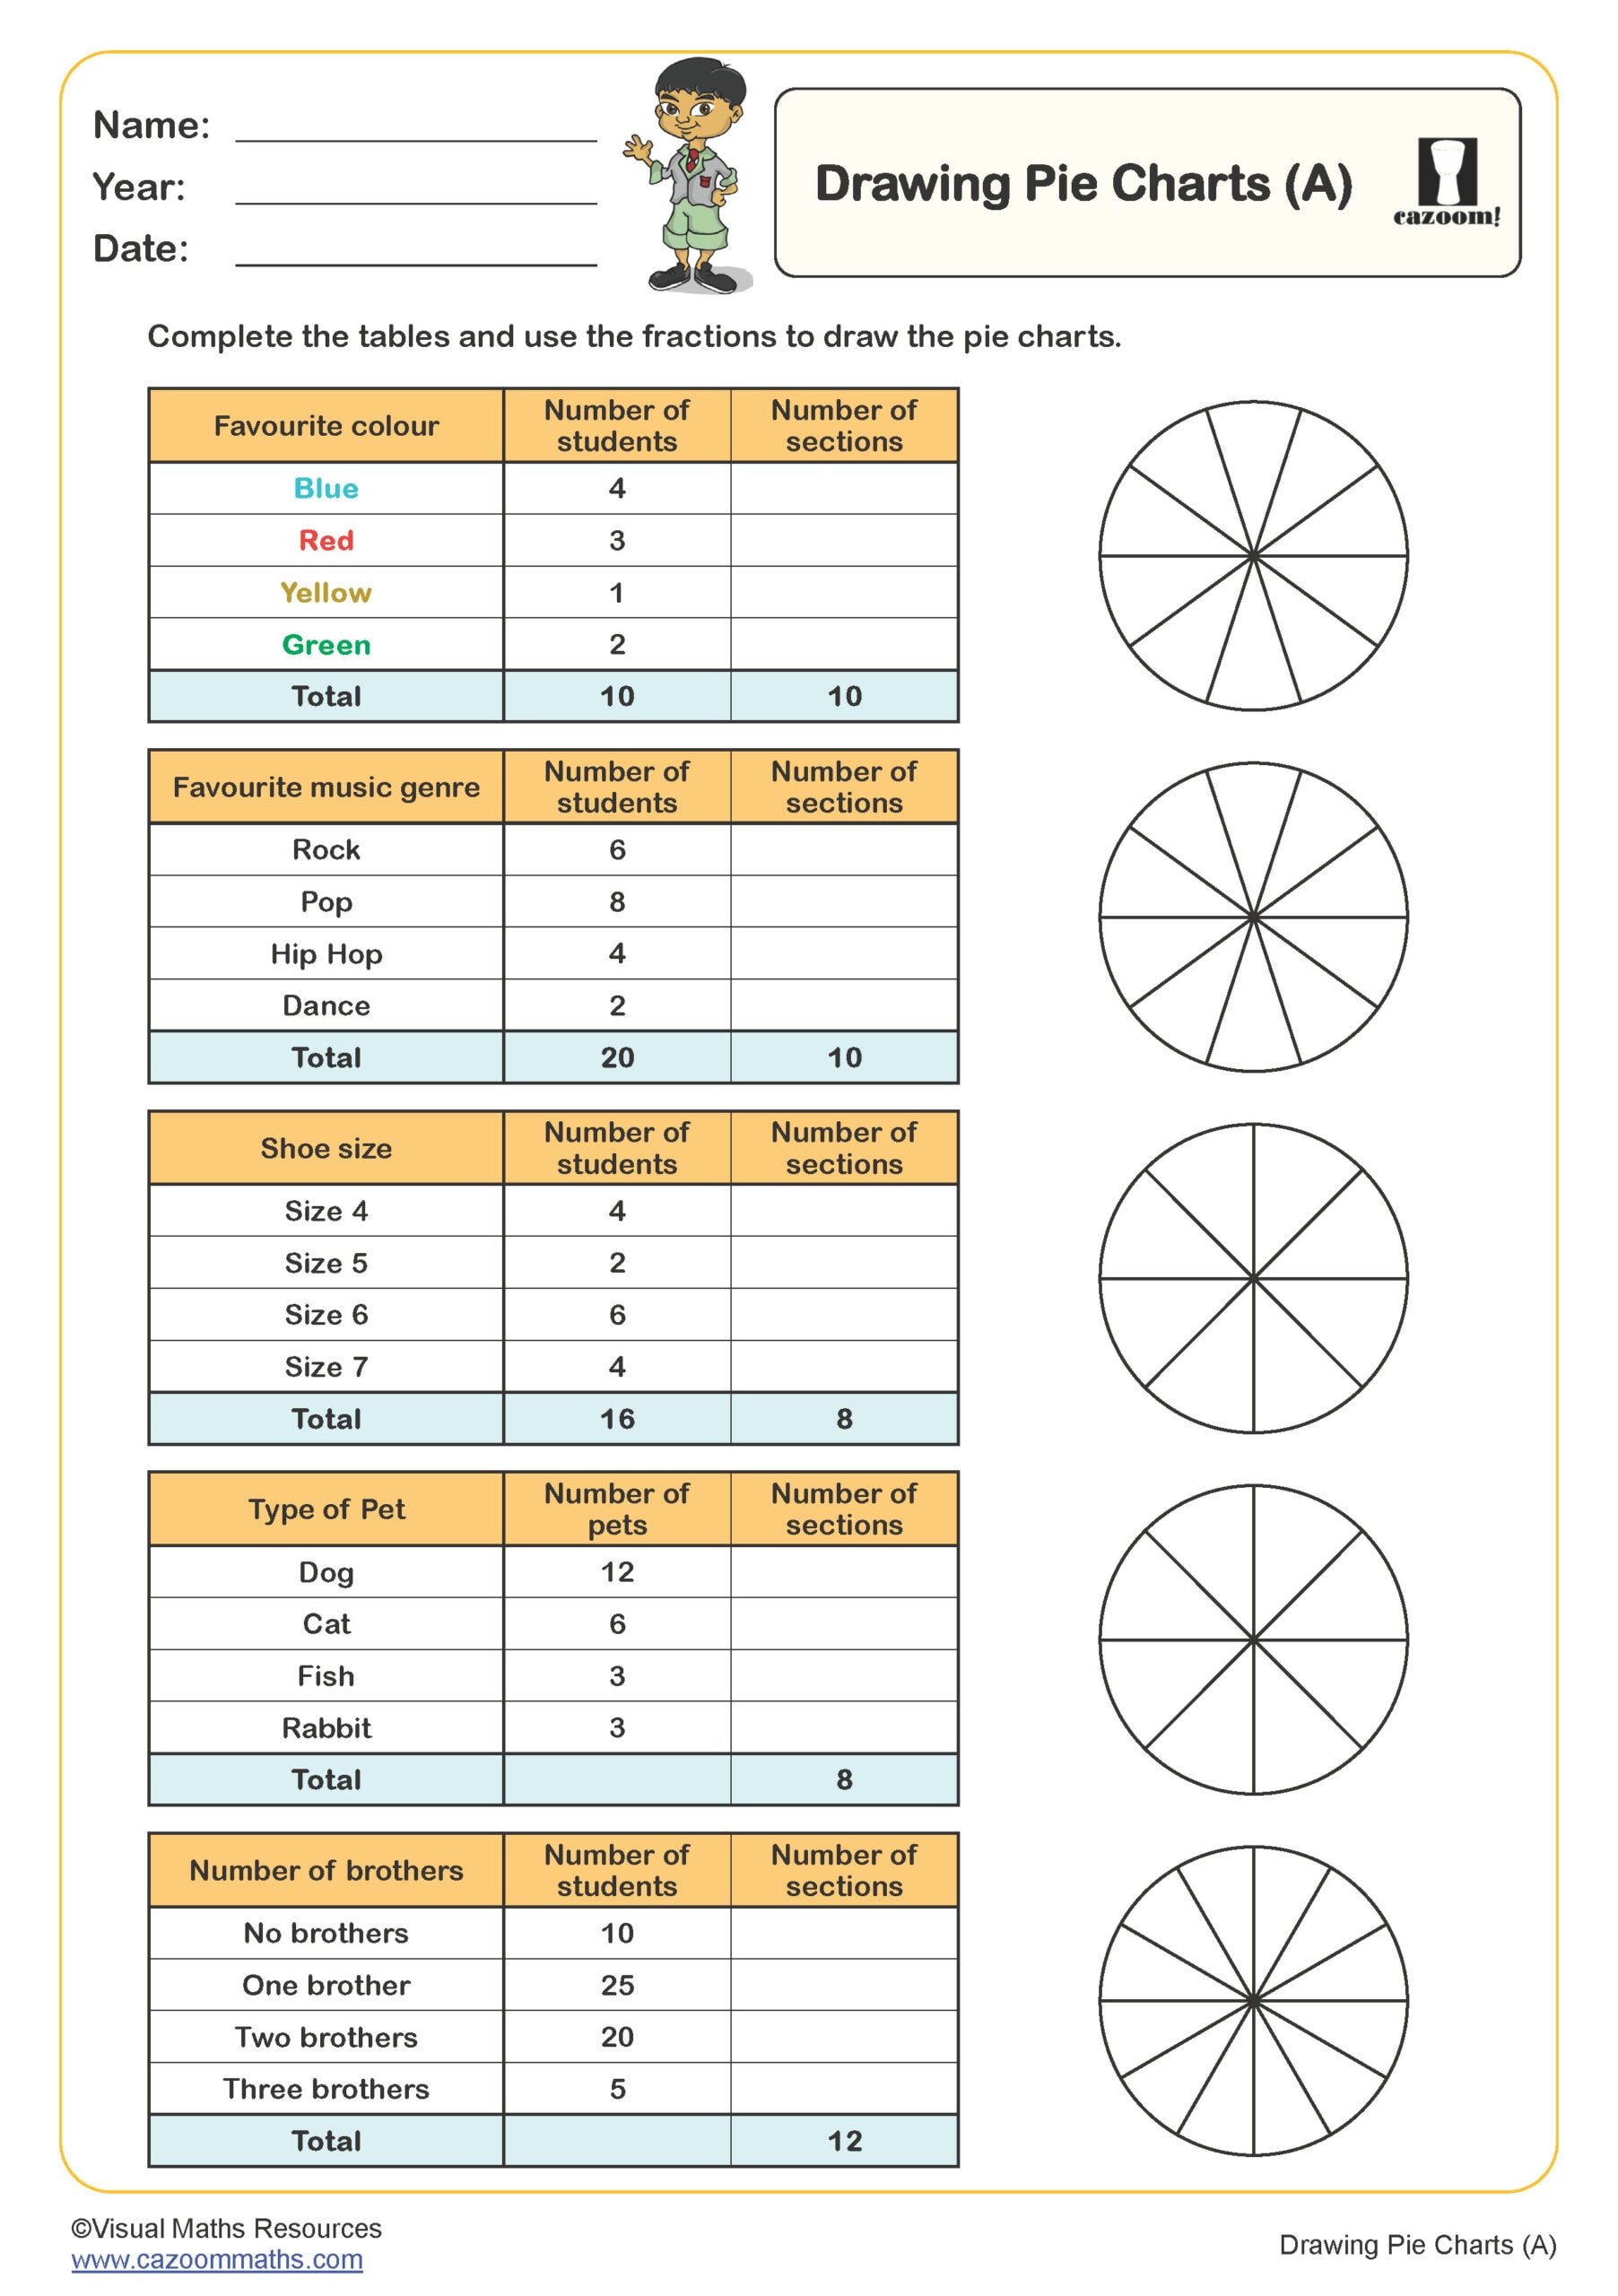
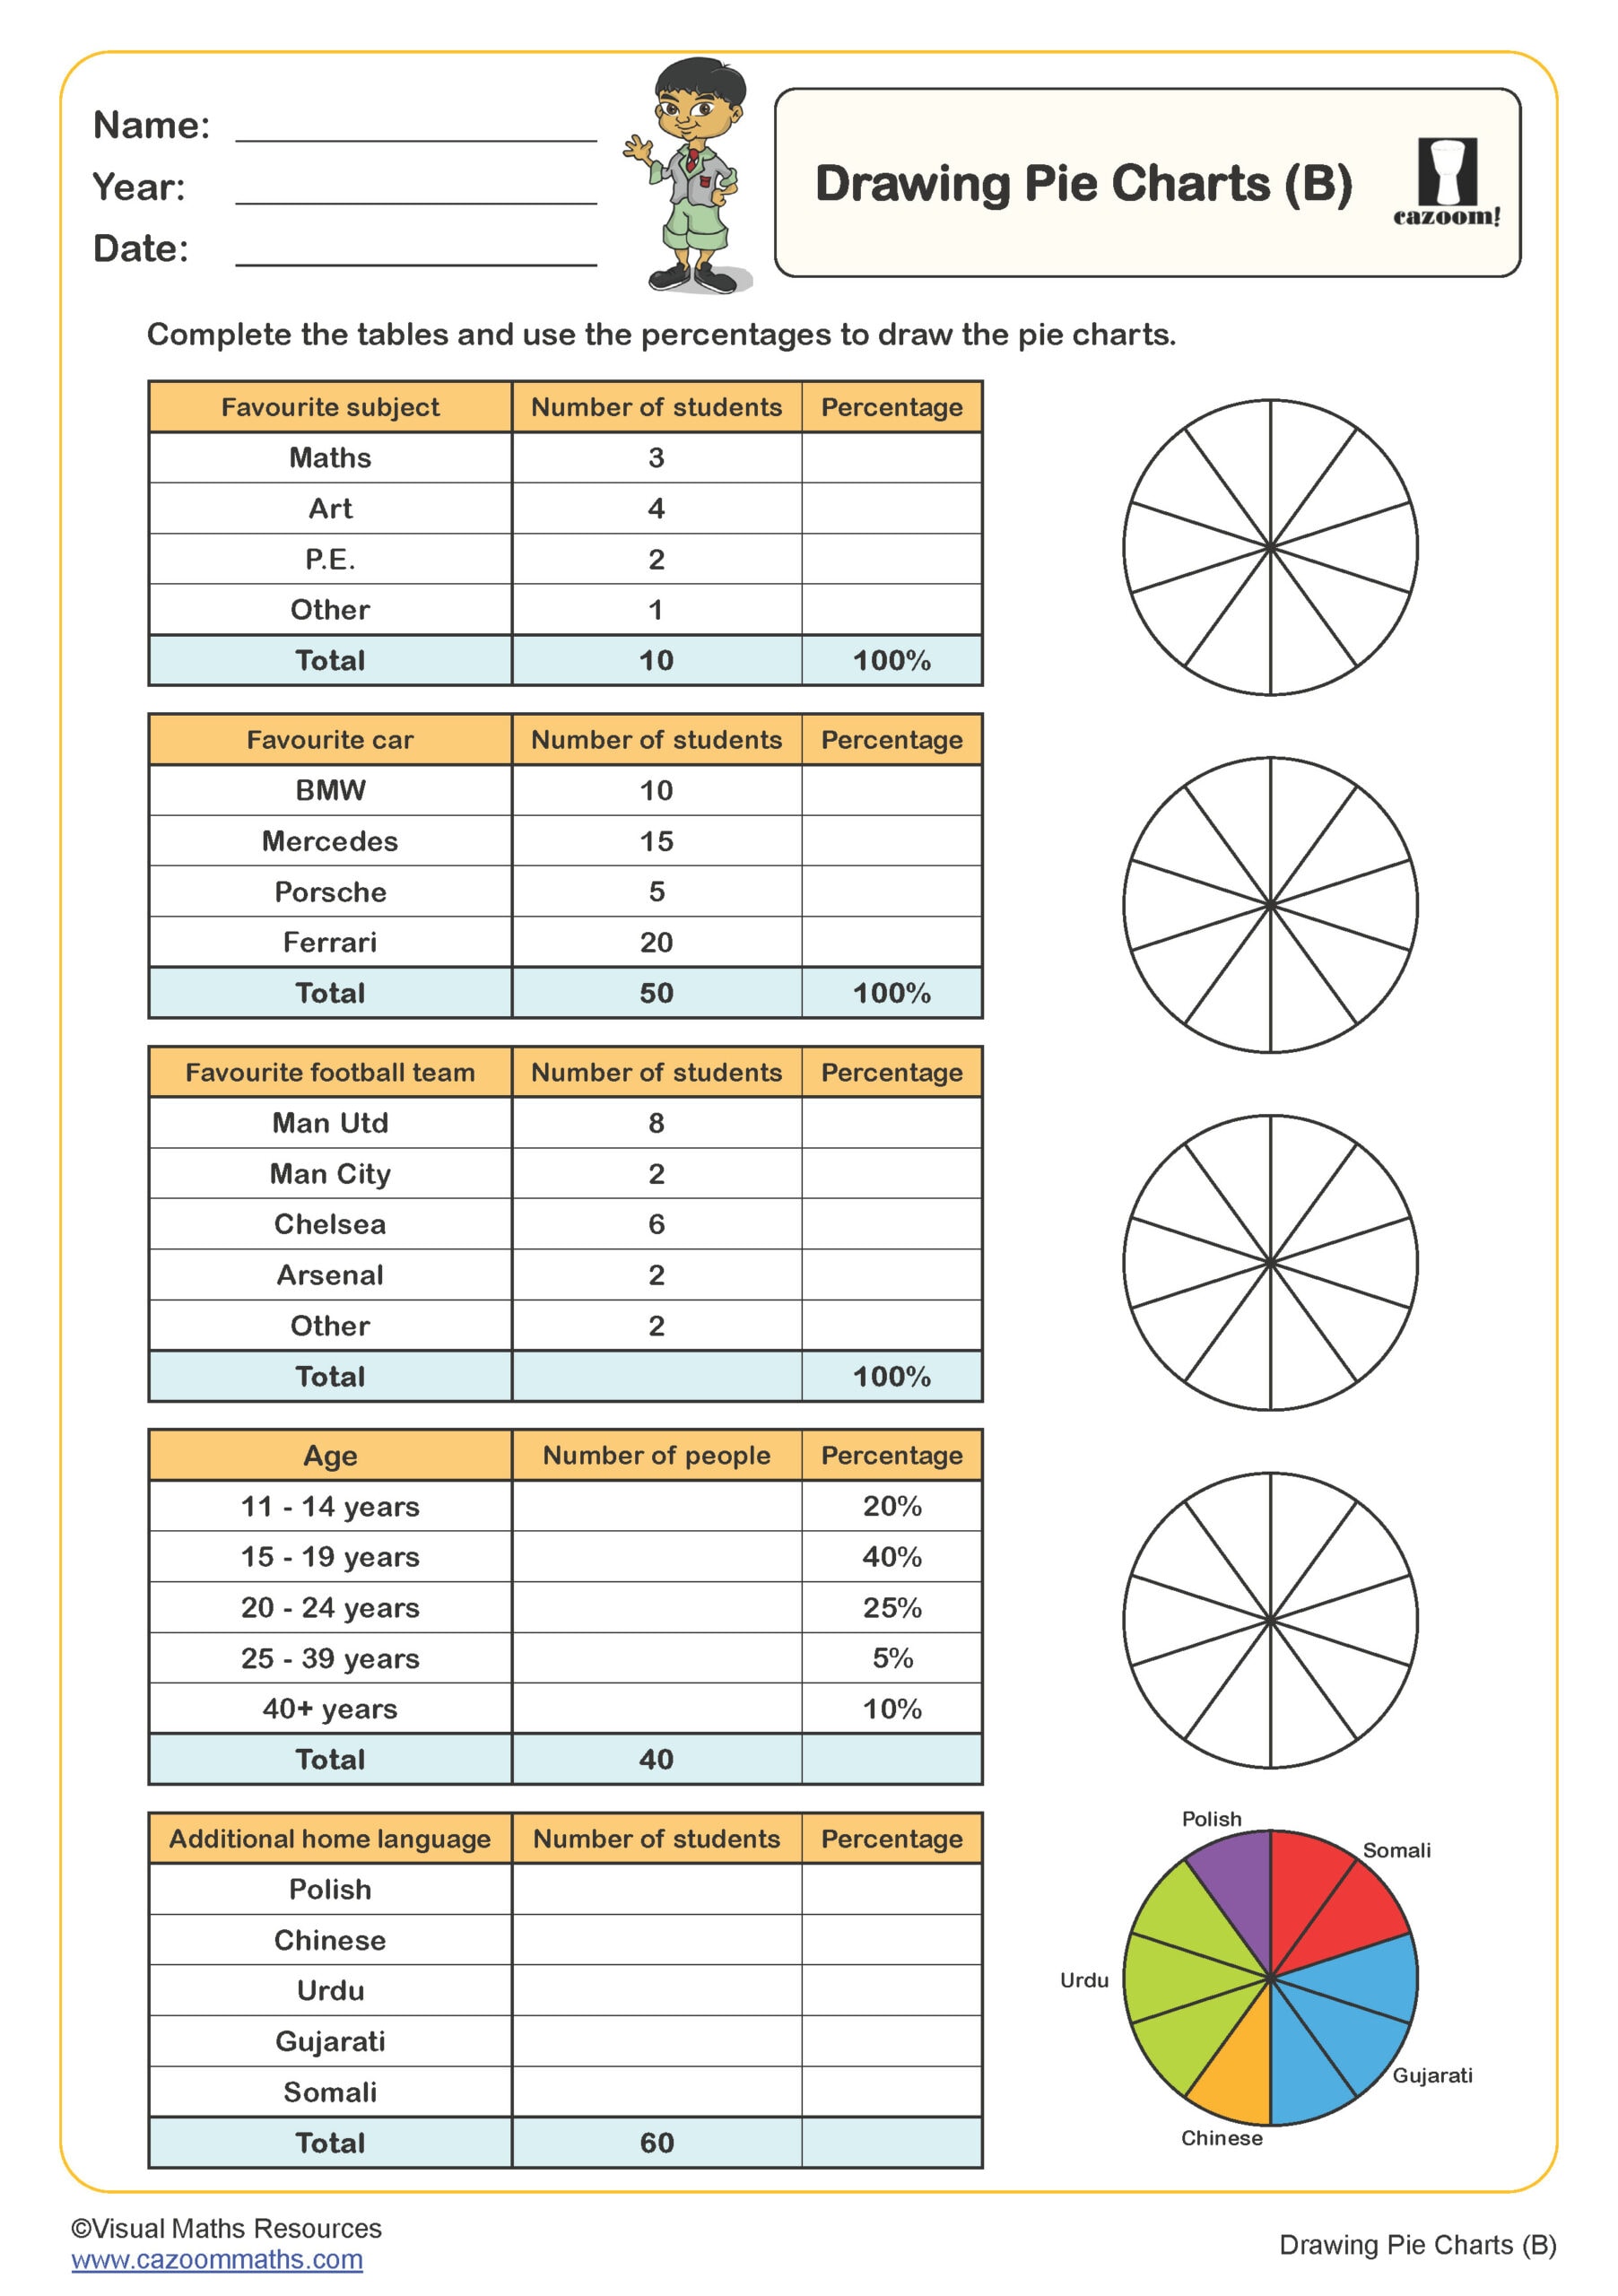
• Drawing Pie Charts
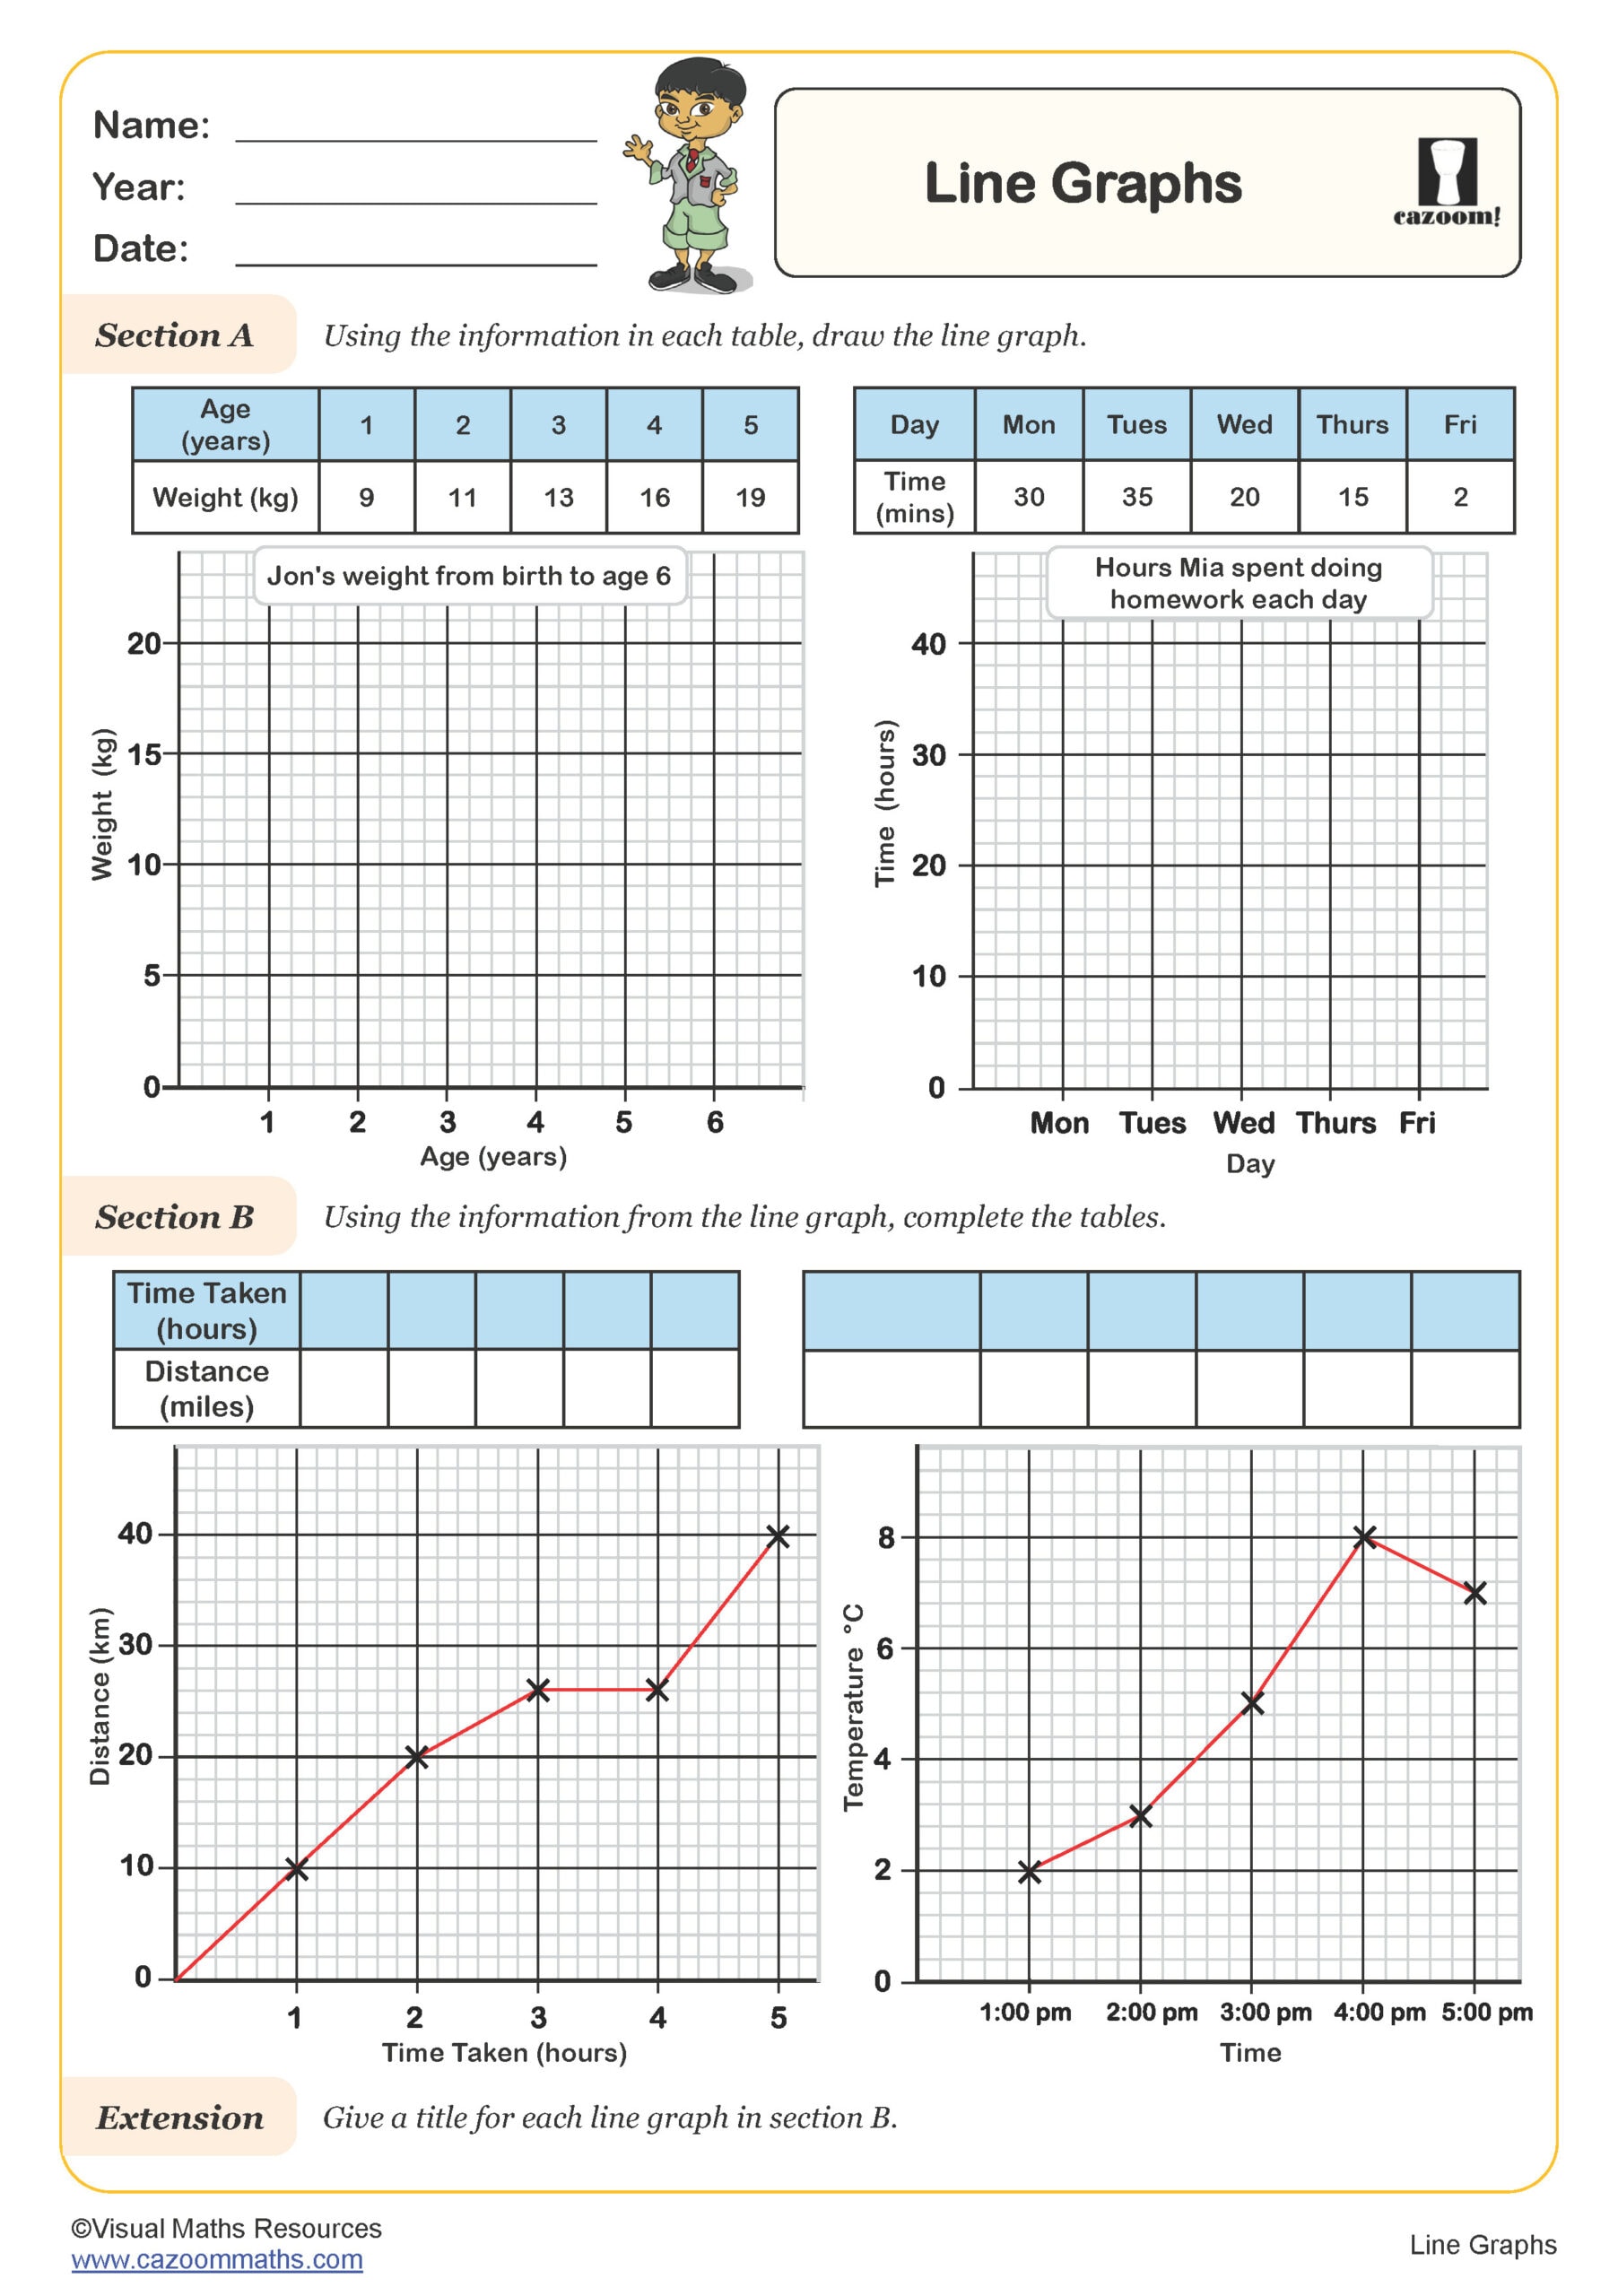
• Line Graphs
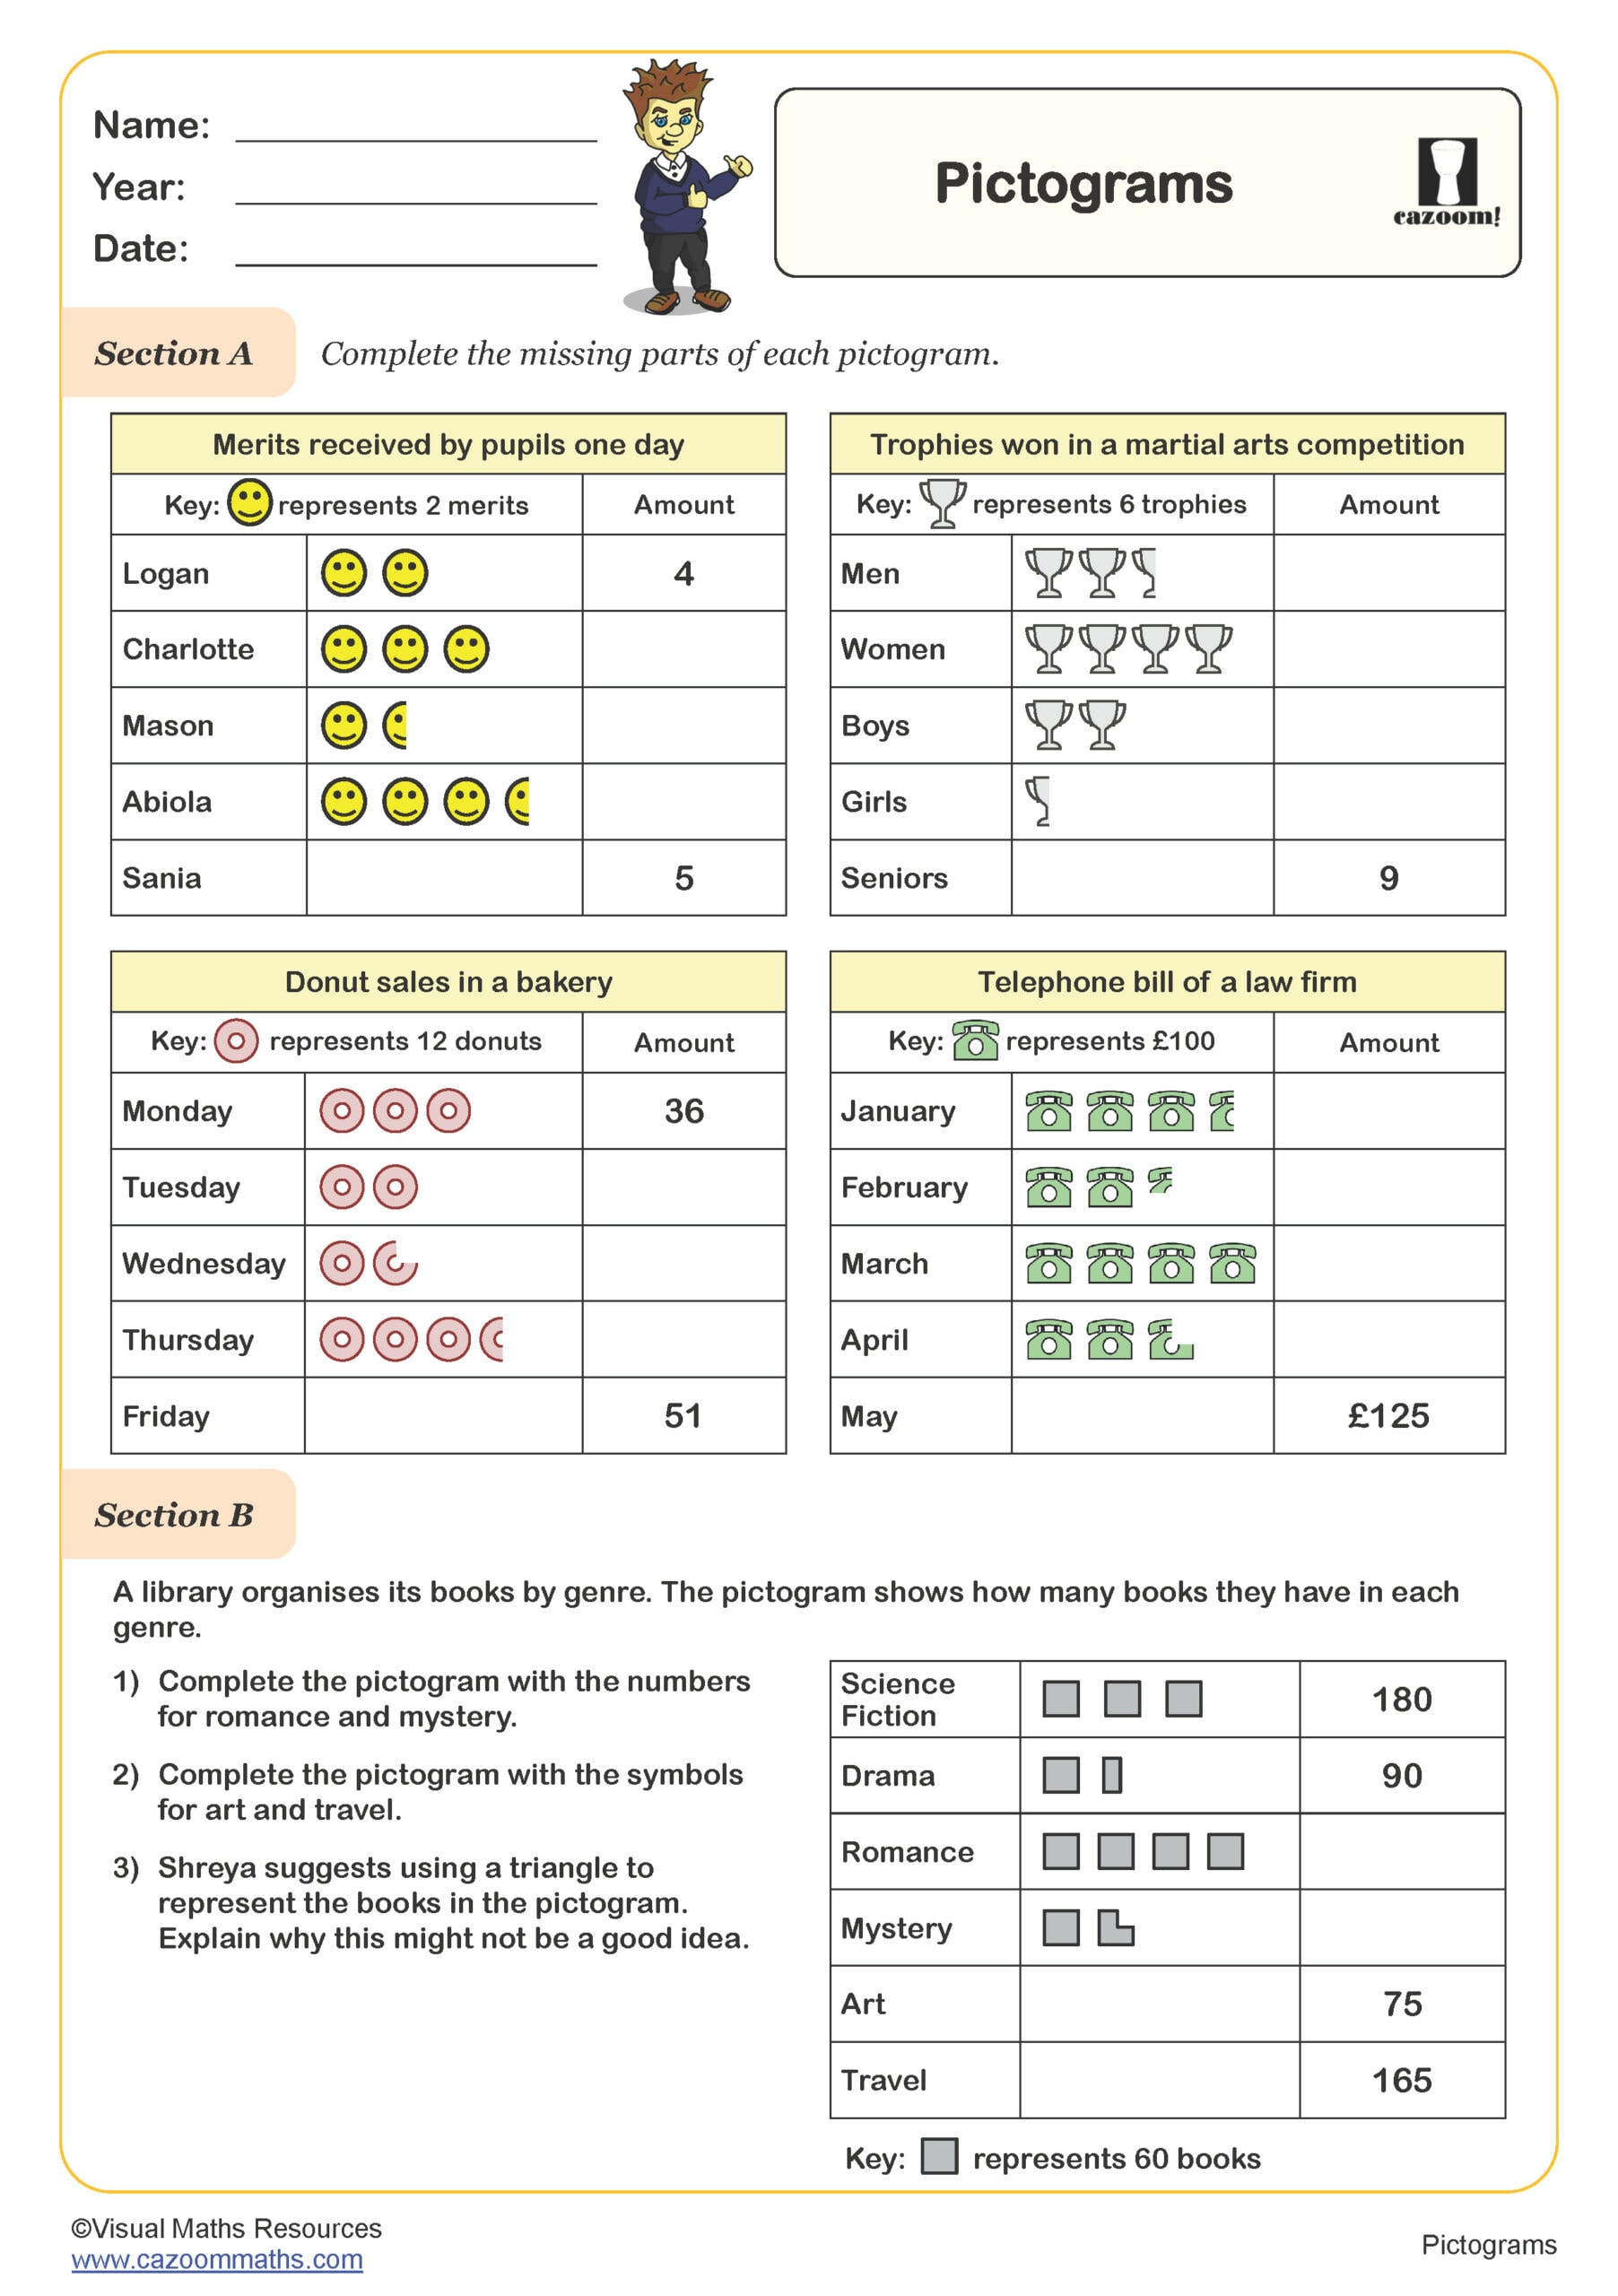
• Pictograms
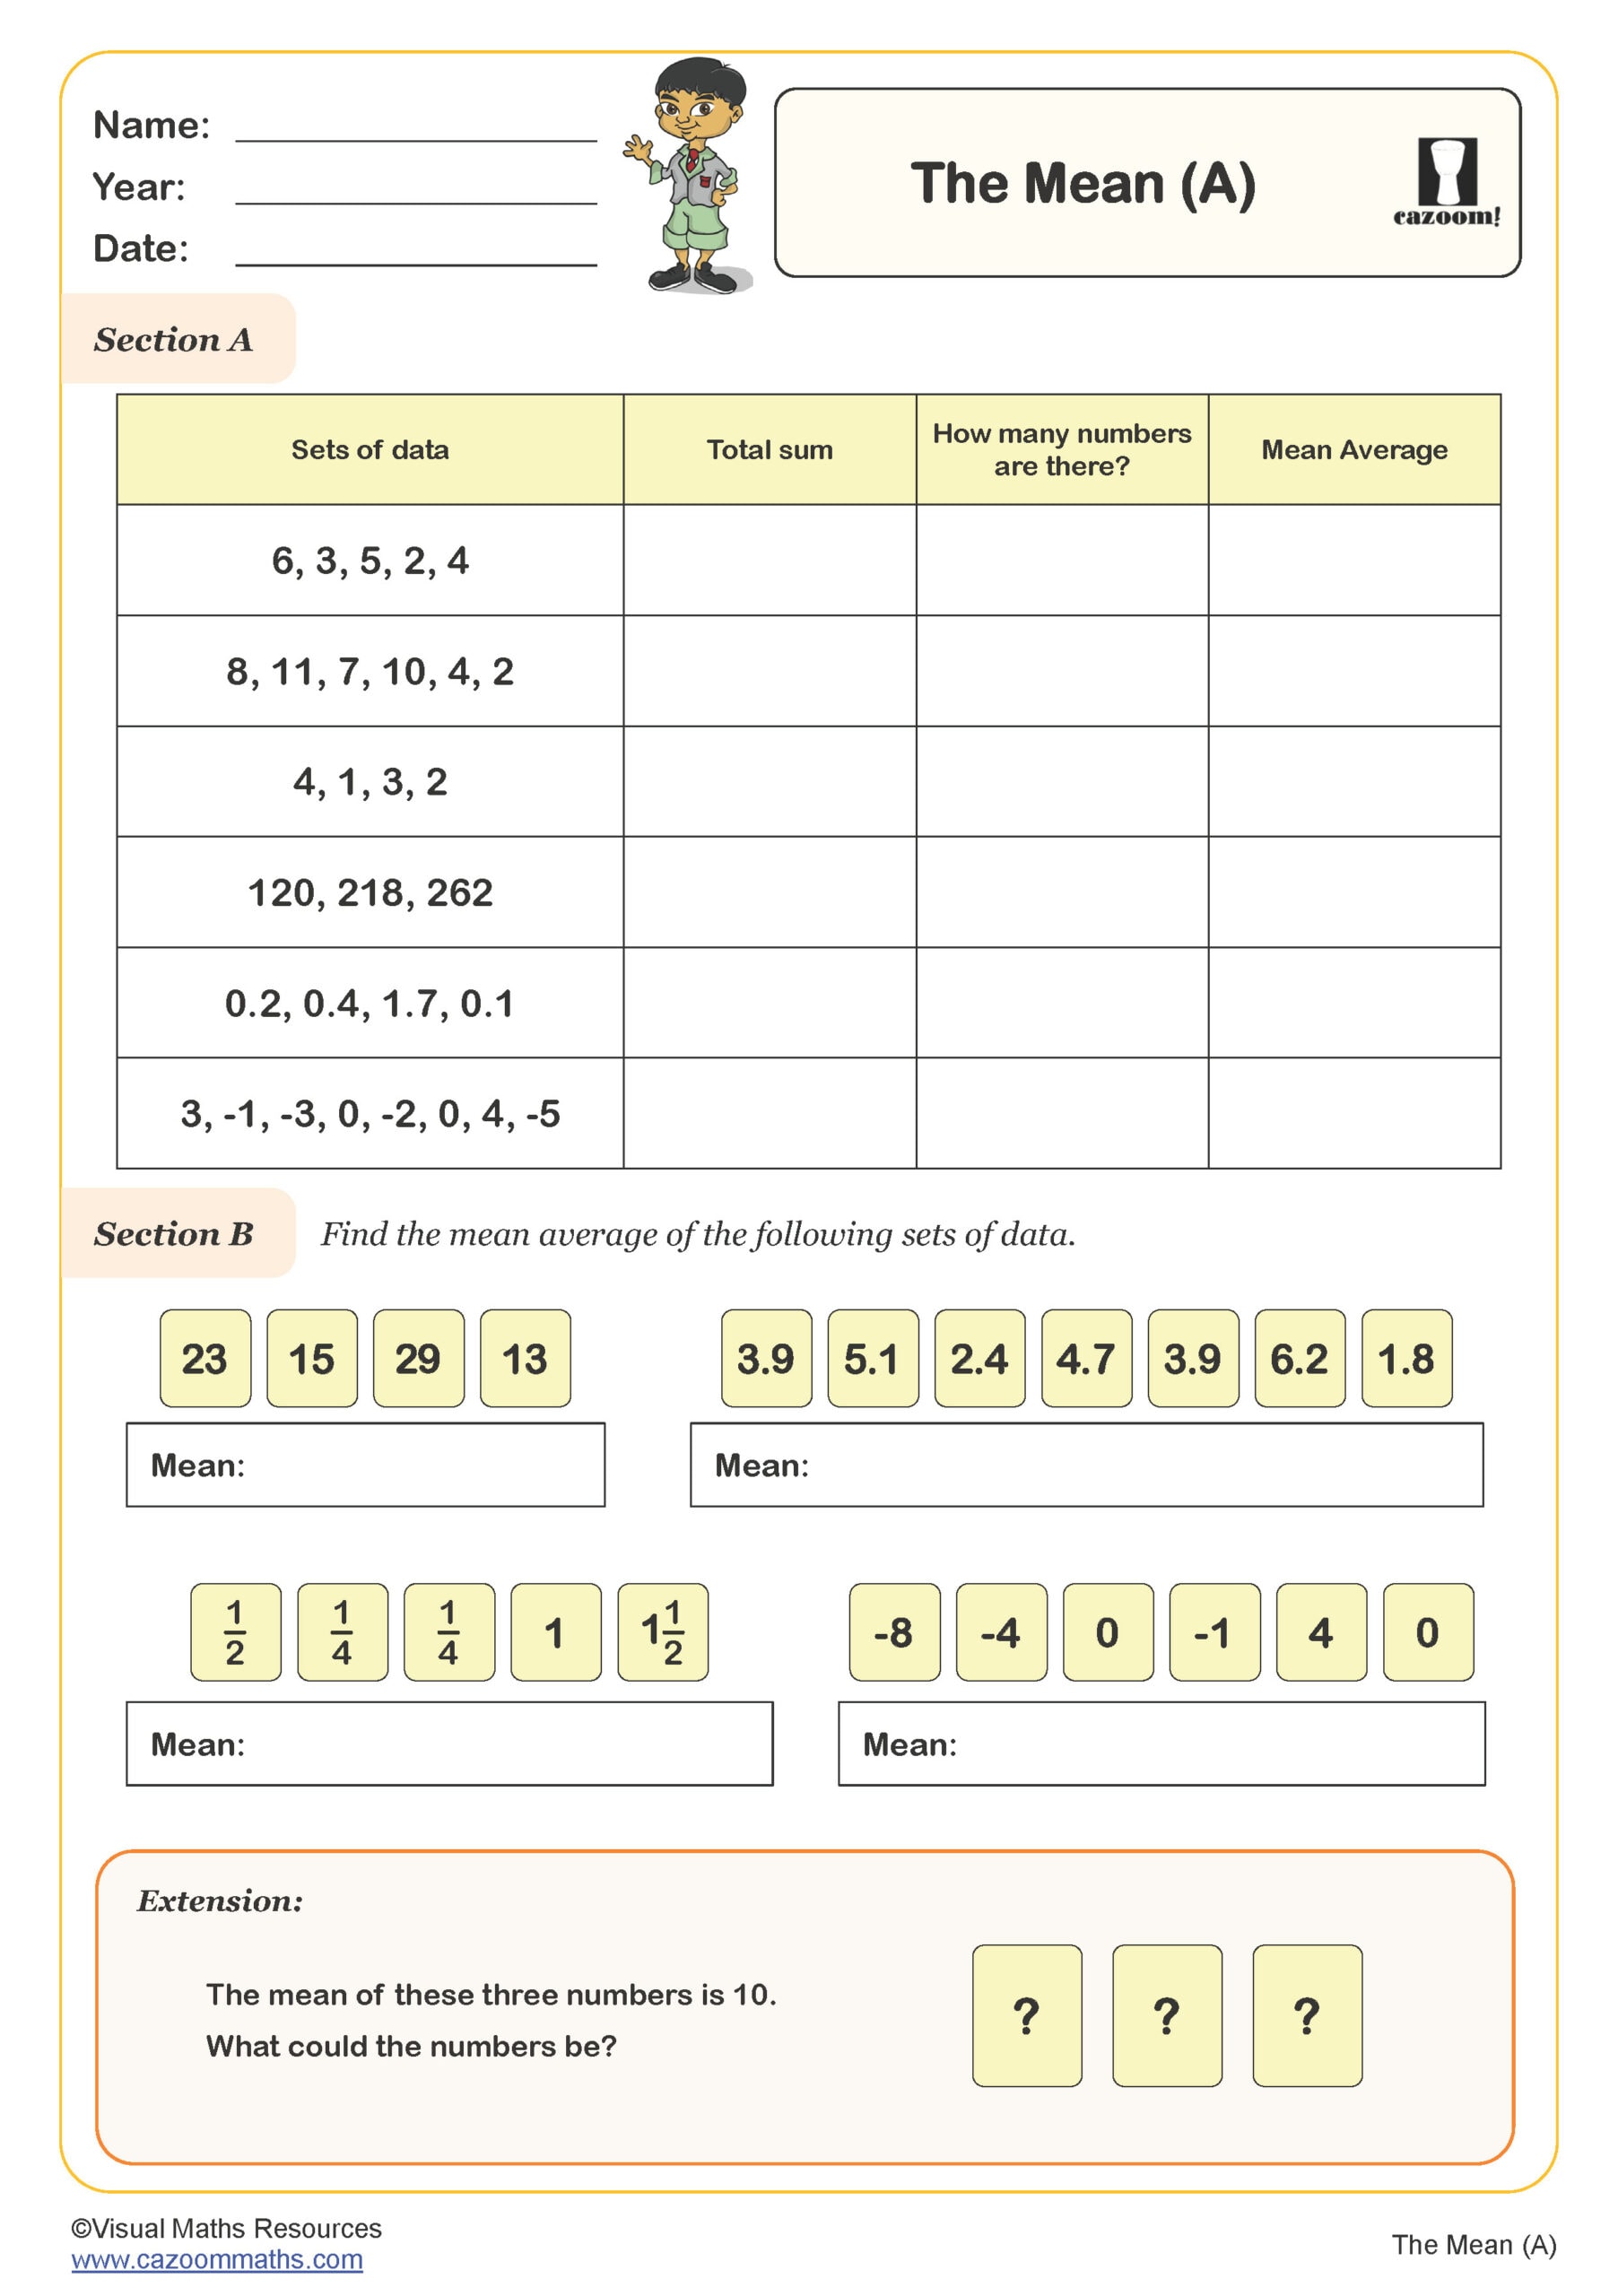
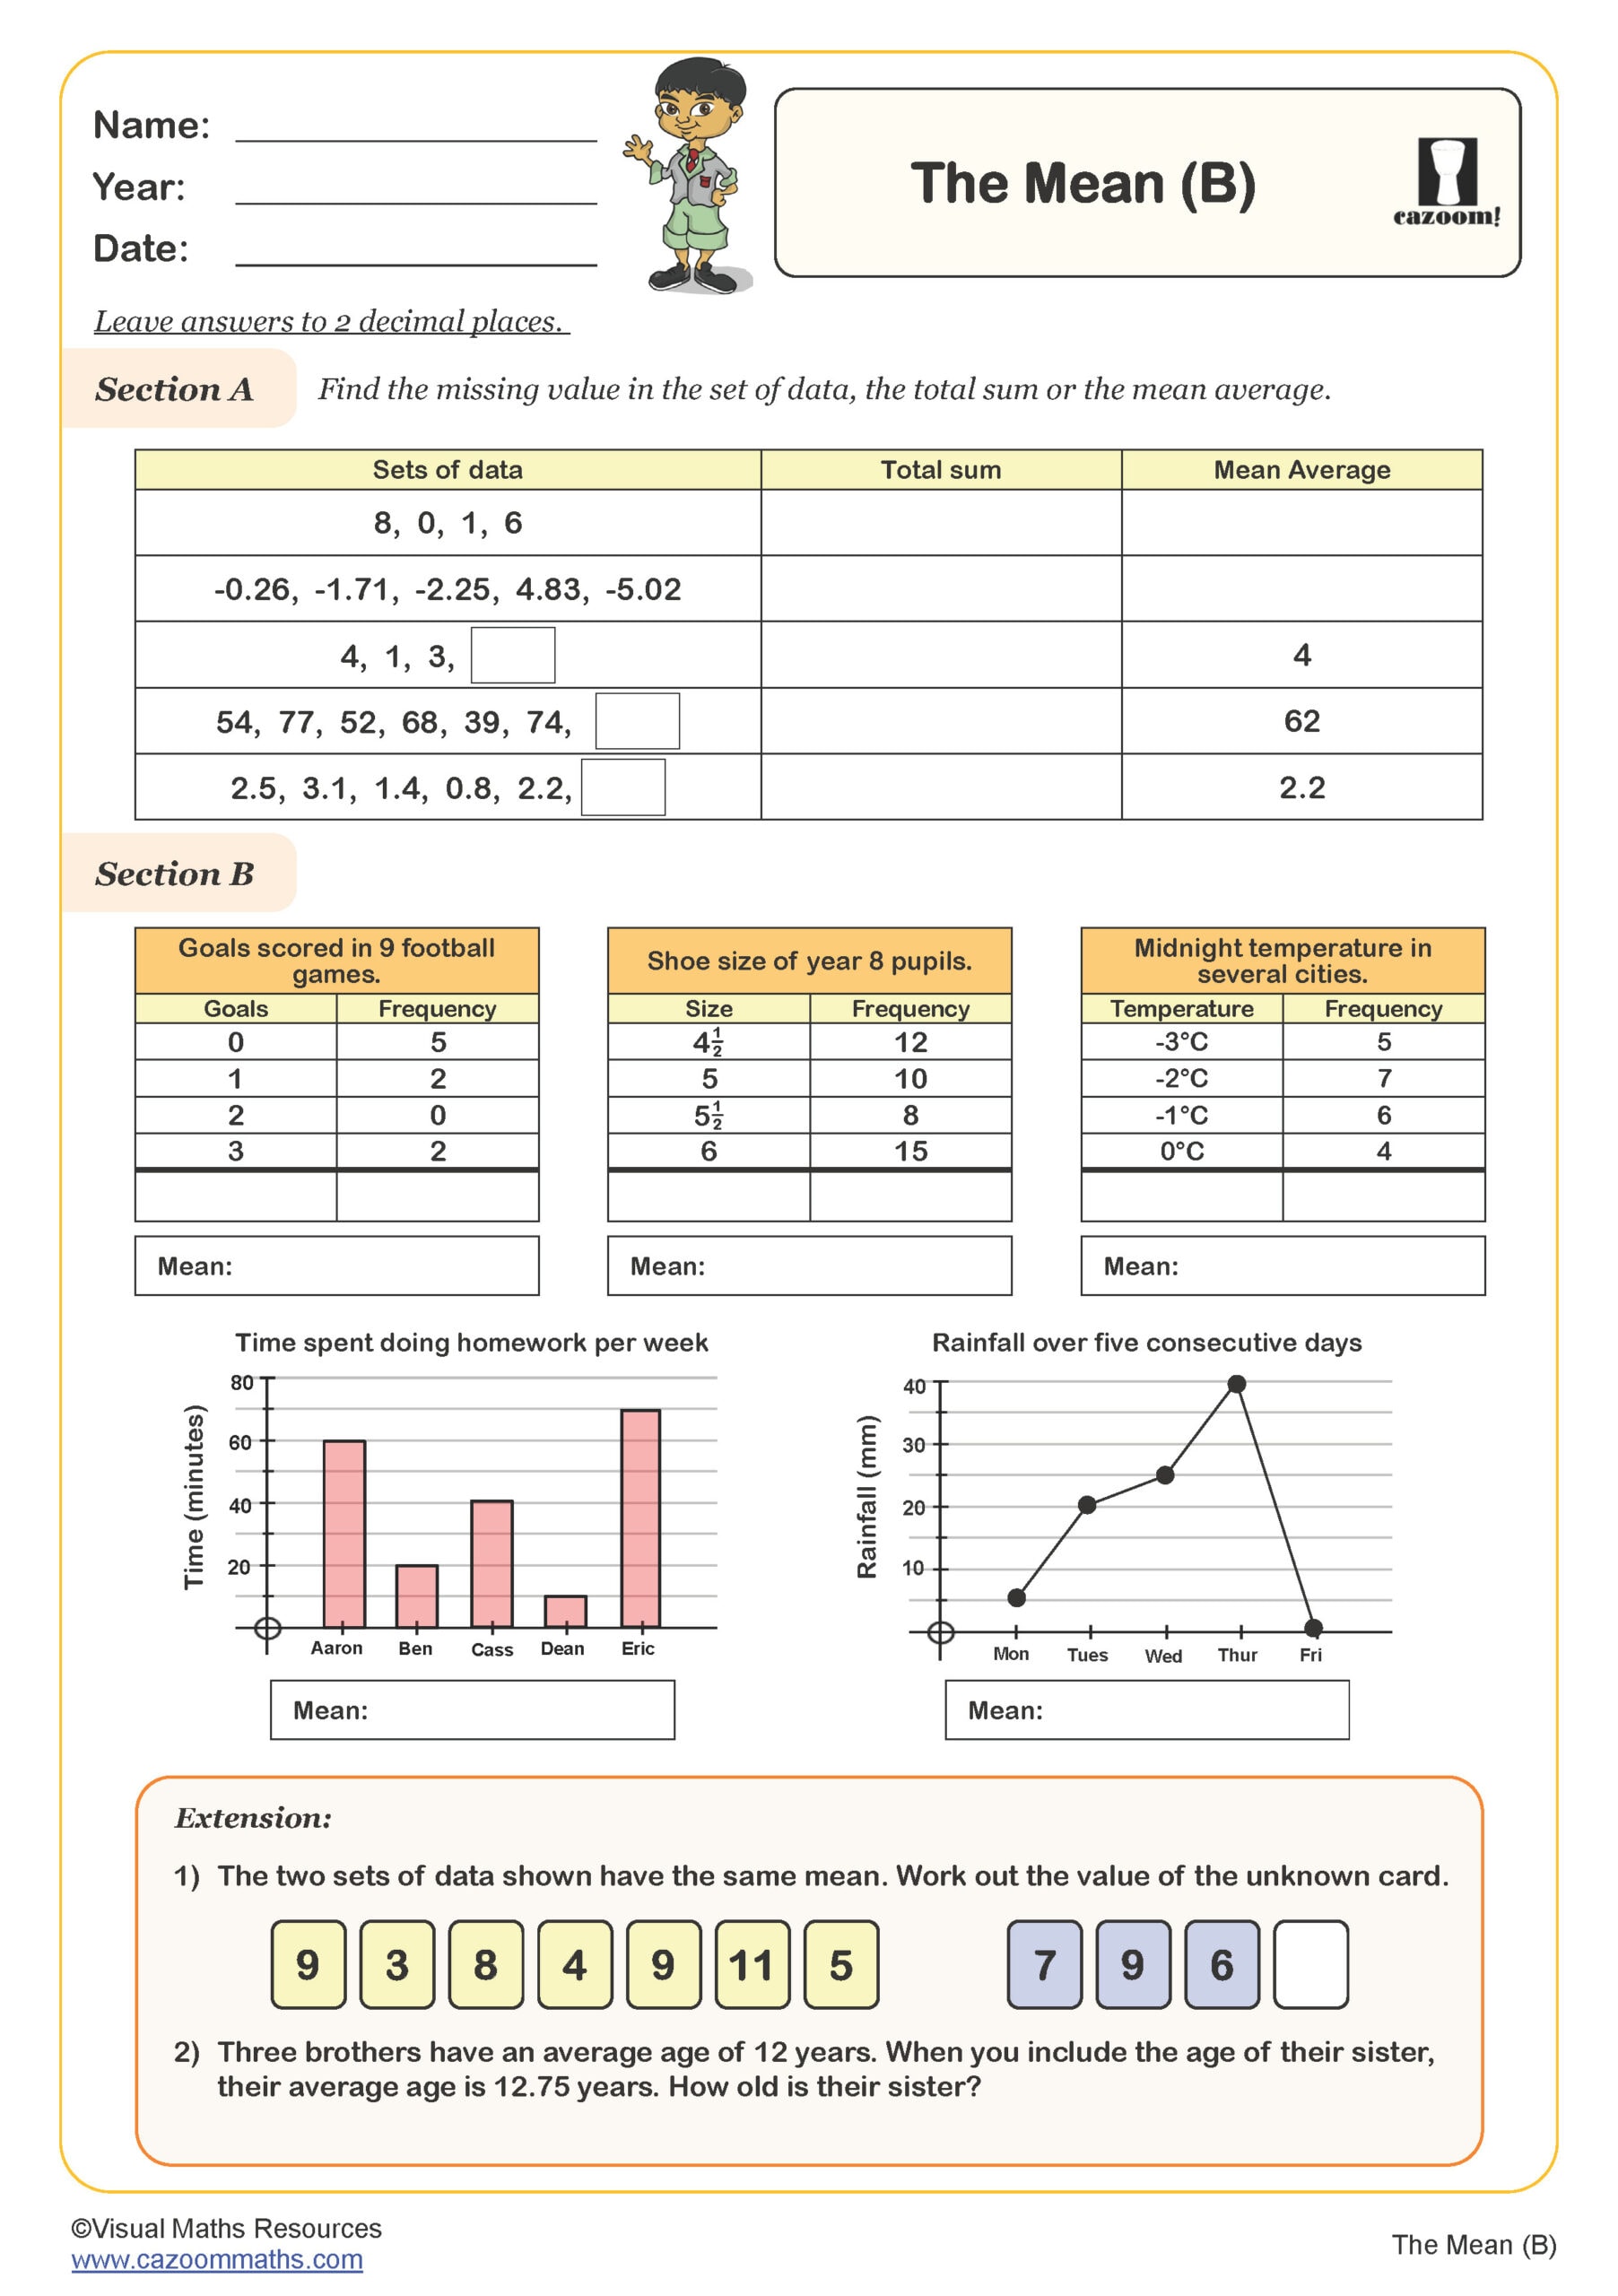
• The Mean
Why Year 6 Students Need Regular Statistics Practice Worksheets
Our expert team observed that primary school students who practice statistics regularly do much better in tests. These worksheets help children master reading charts and understanding data. The skills help with SATs and getting ready for secondary school. Benefits include:
• Improved confidence when reading graphs and charts
• Better understanding of data collection methods
• Stronger analytical thinking skills
• Enhanced problem-solving abilities
• Preparation for more complex statistics in secondary school
Everyday Situations Where Statistics Skills Matter Most
Statistics appear everywhere in their daily lives. From comparing mobile phone deals to understanding weather forecasts, these skills prove surprisingly useful. We've seen students apply their learning to sports statistics, pocket money surveys, and even family budget discussions. Real-world applications include:
• Reading weather charts and rainfall data
• Understanding sports league tables and player statistics
• Interpreting survey results in newspapers and magazines
• Comparing prices and value for money in shopping
• Analyzing social media trends and usage patterns
• Understanding scientific data in other school subjects
