Drawing Bar Charts from Frequency Tables WORKSHEET
Drawing Bar Charts from Frequency Tables WORKSHEET DESCRIPTION
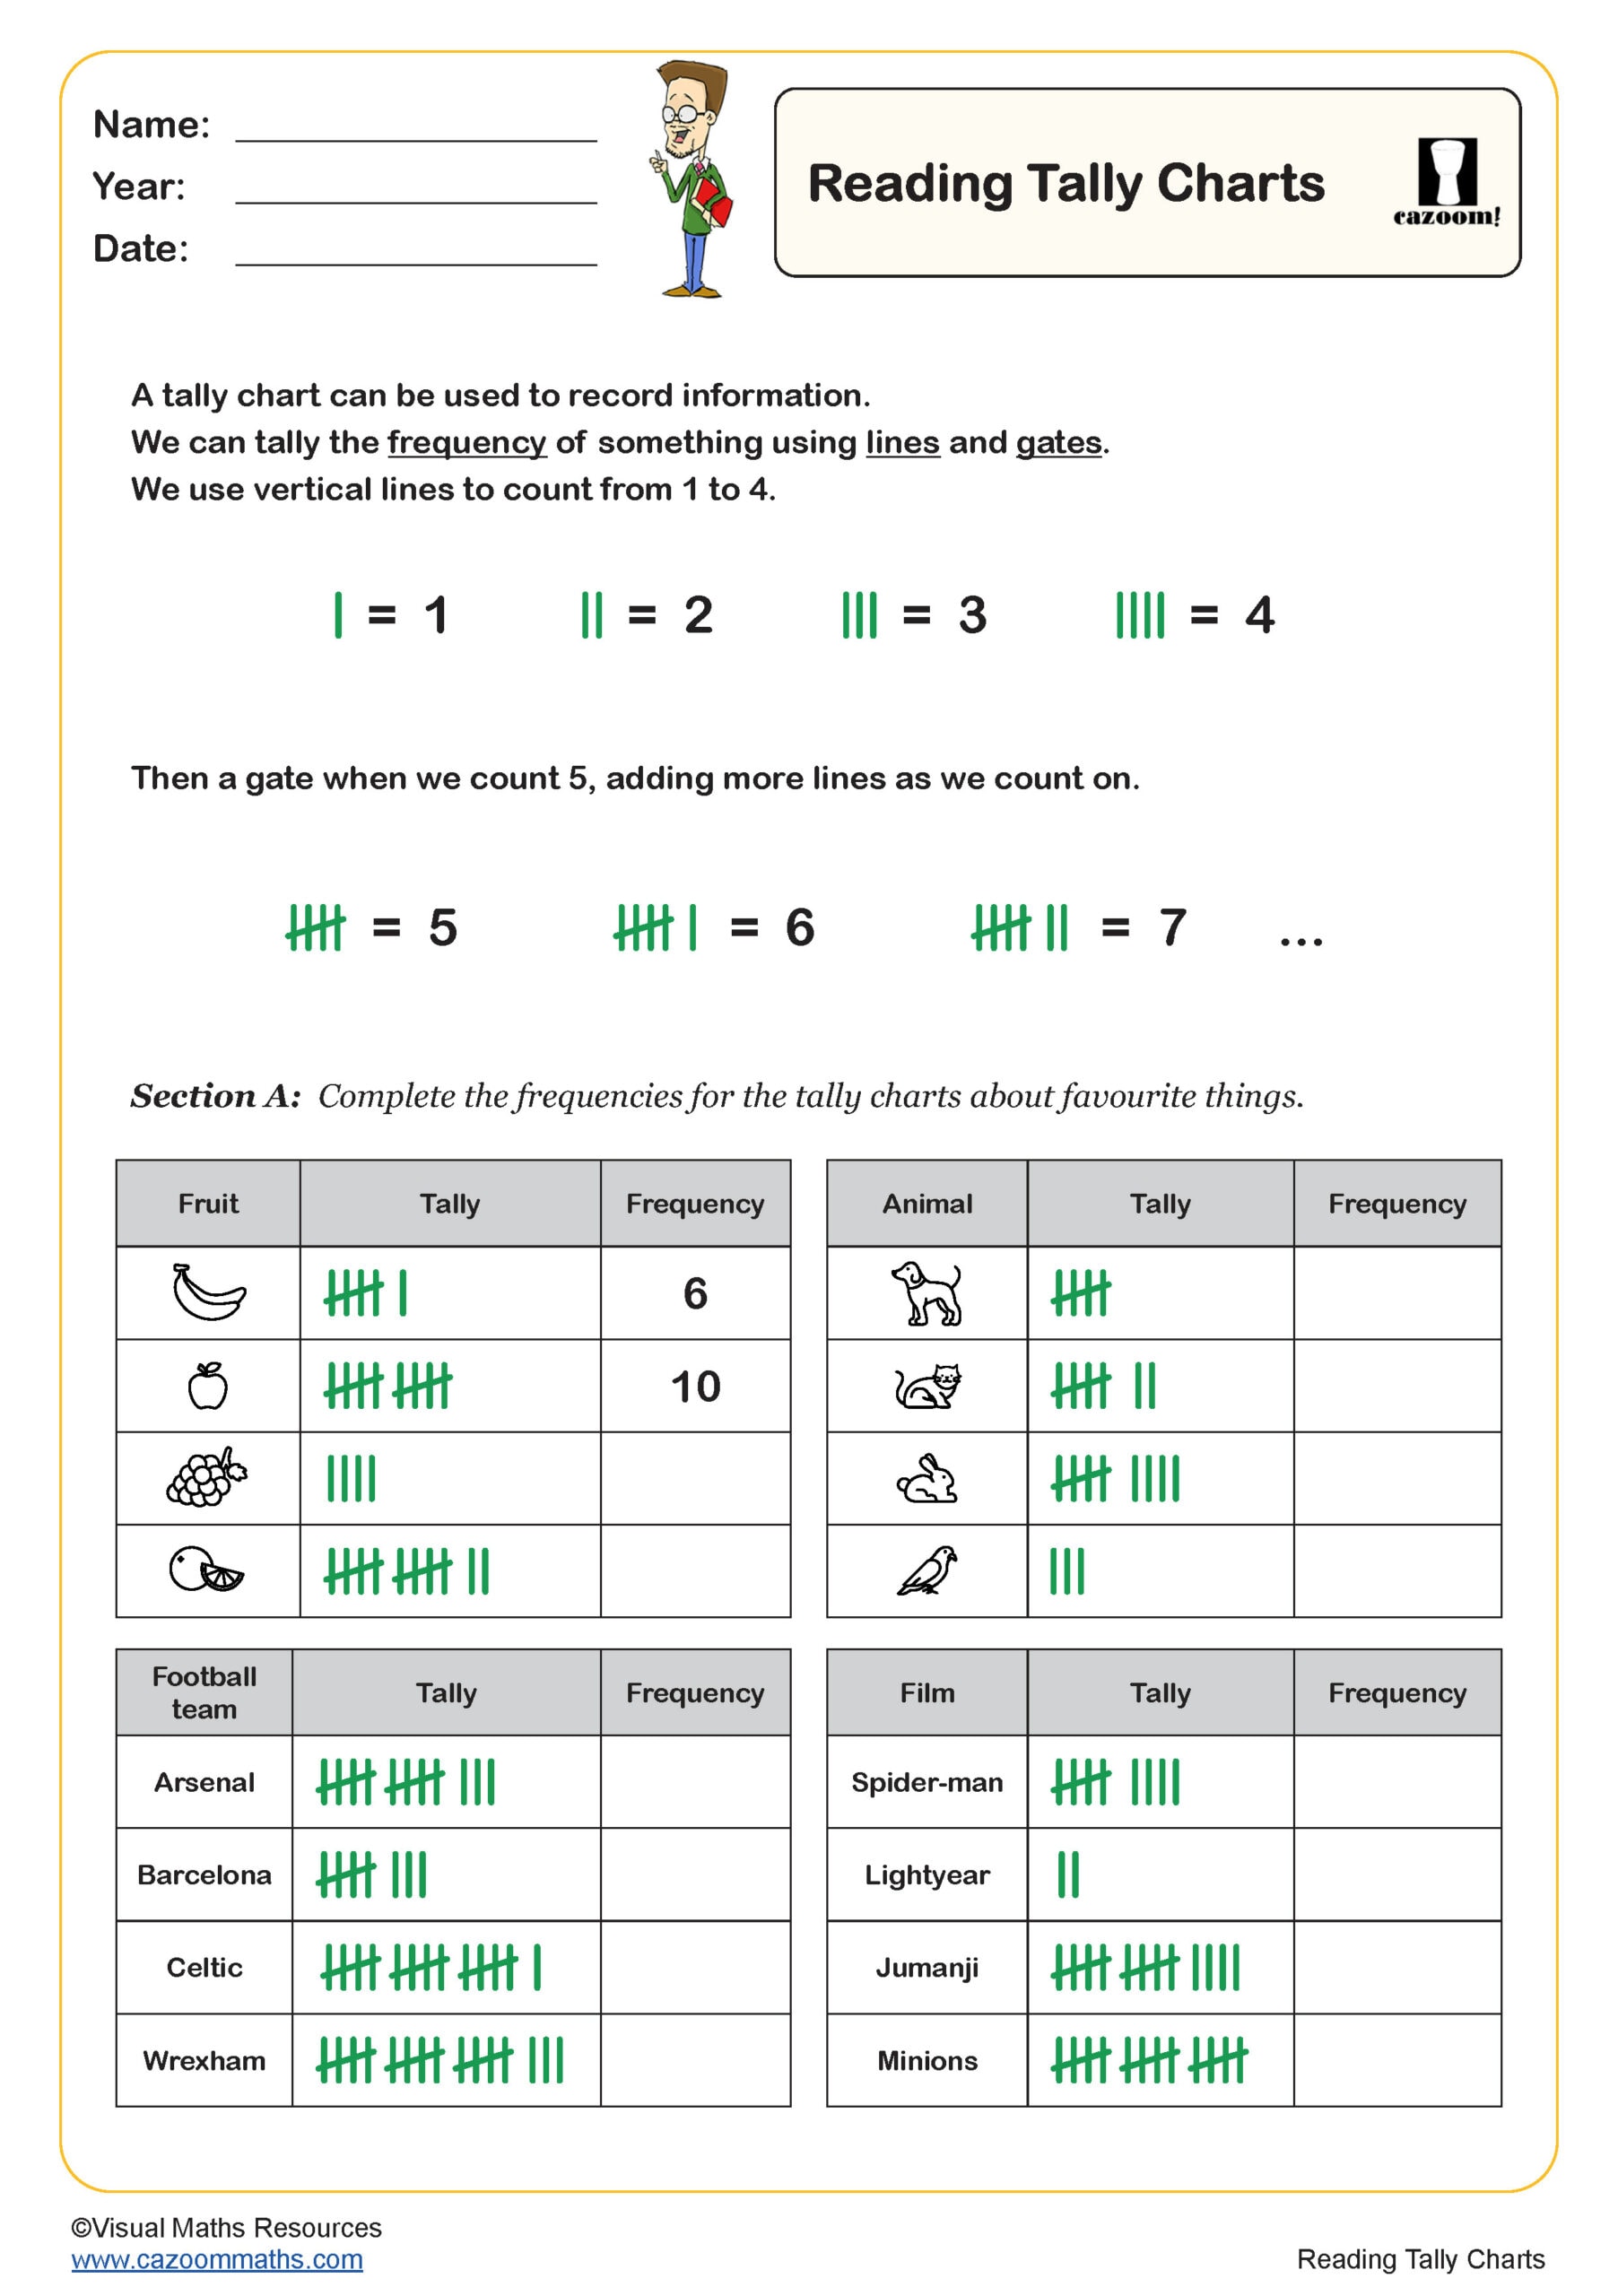
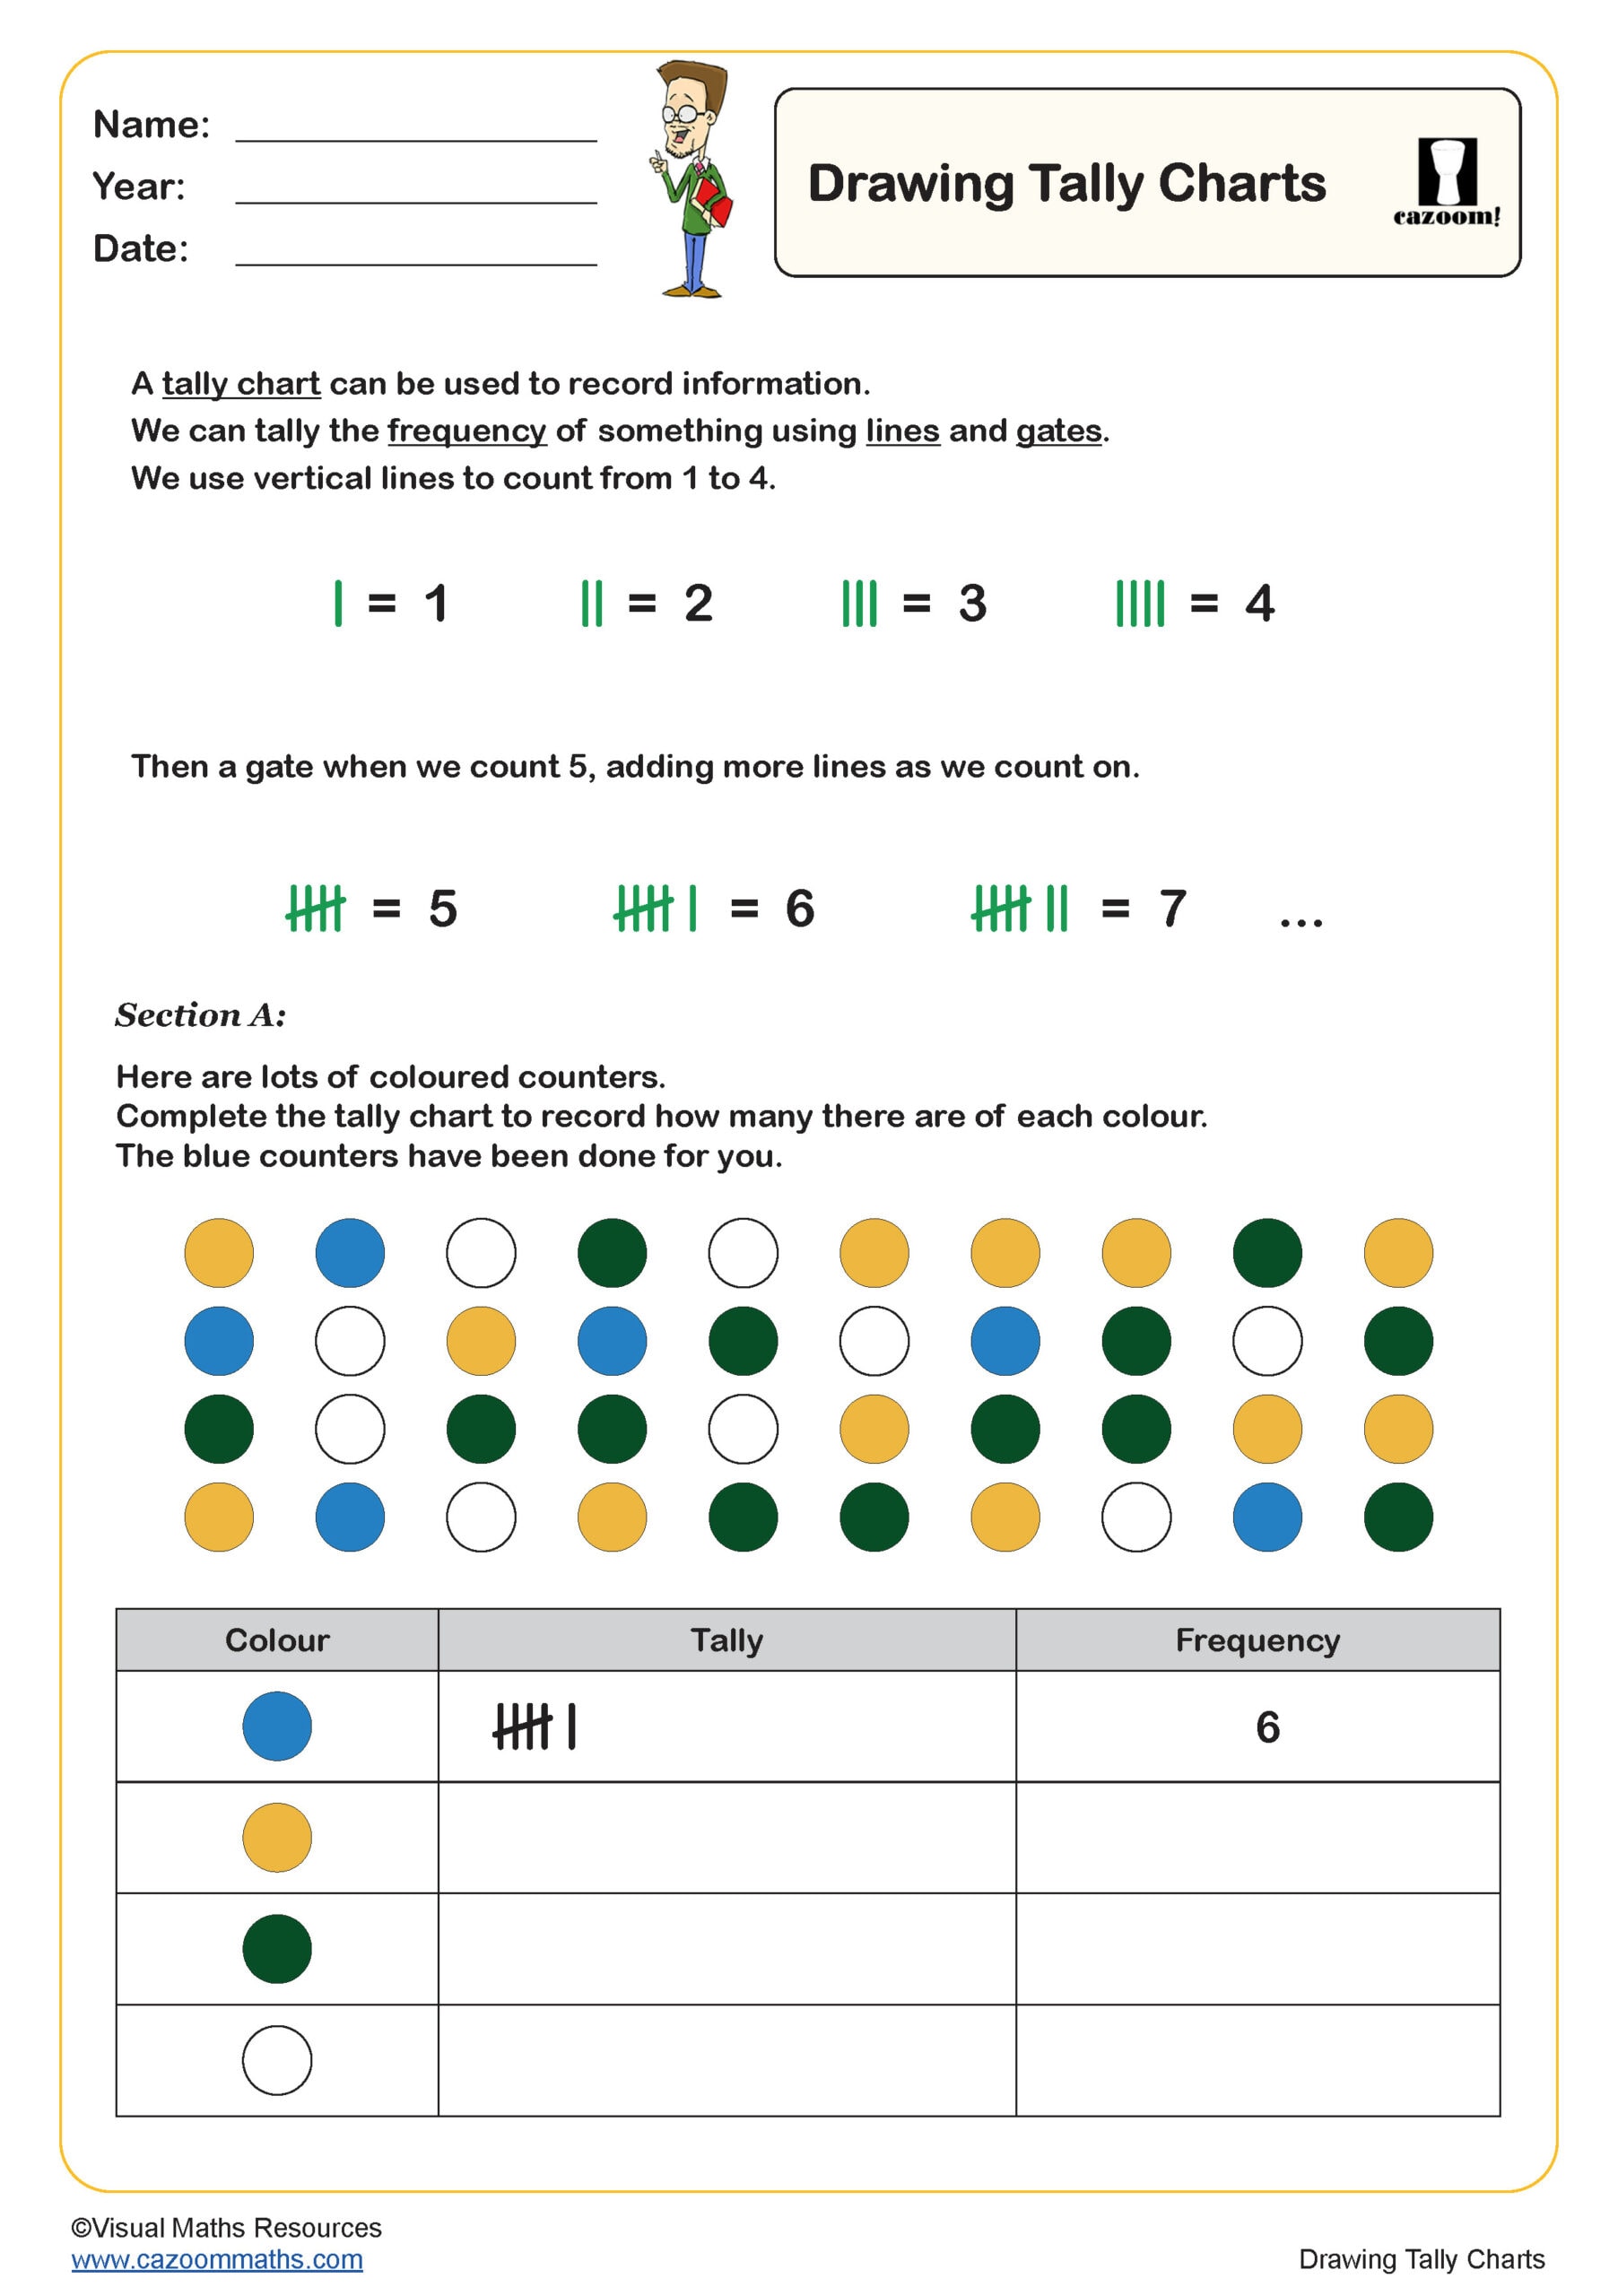
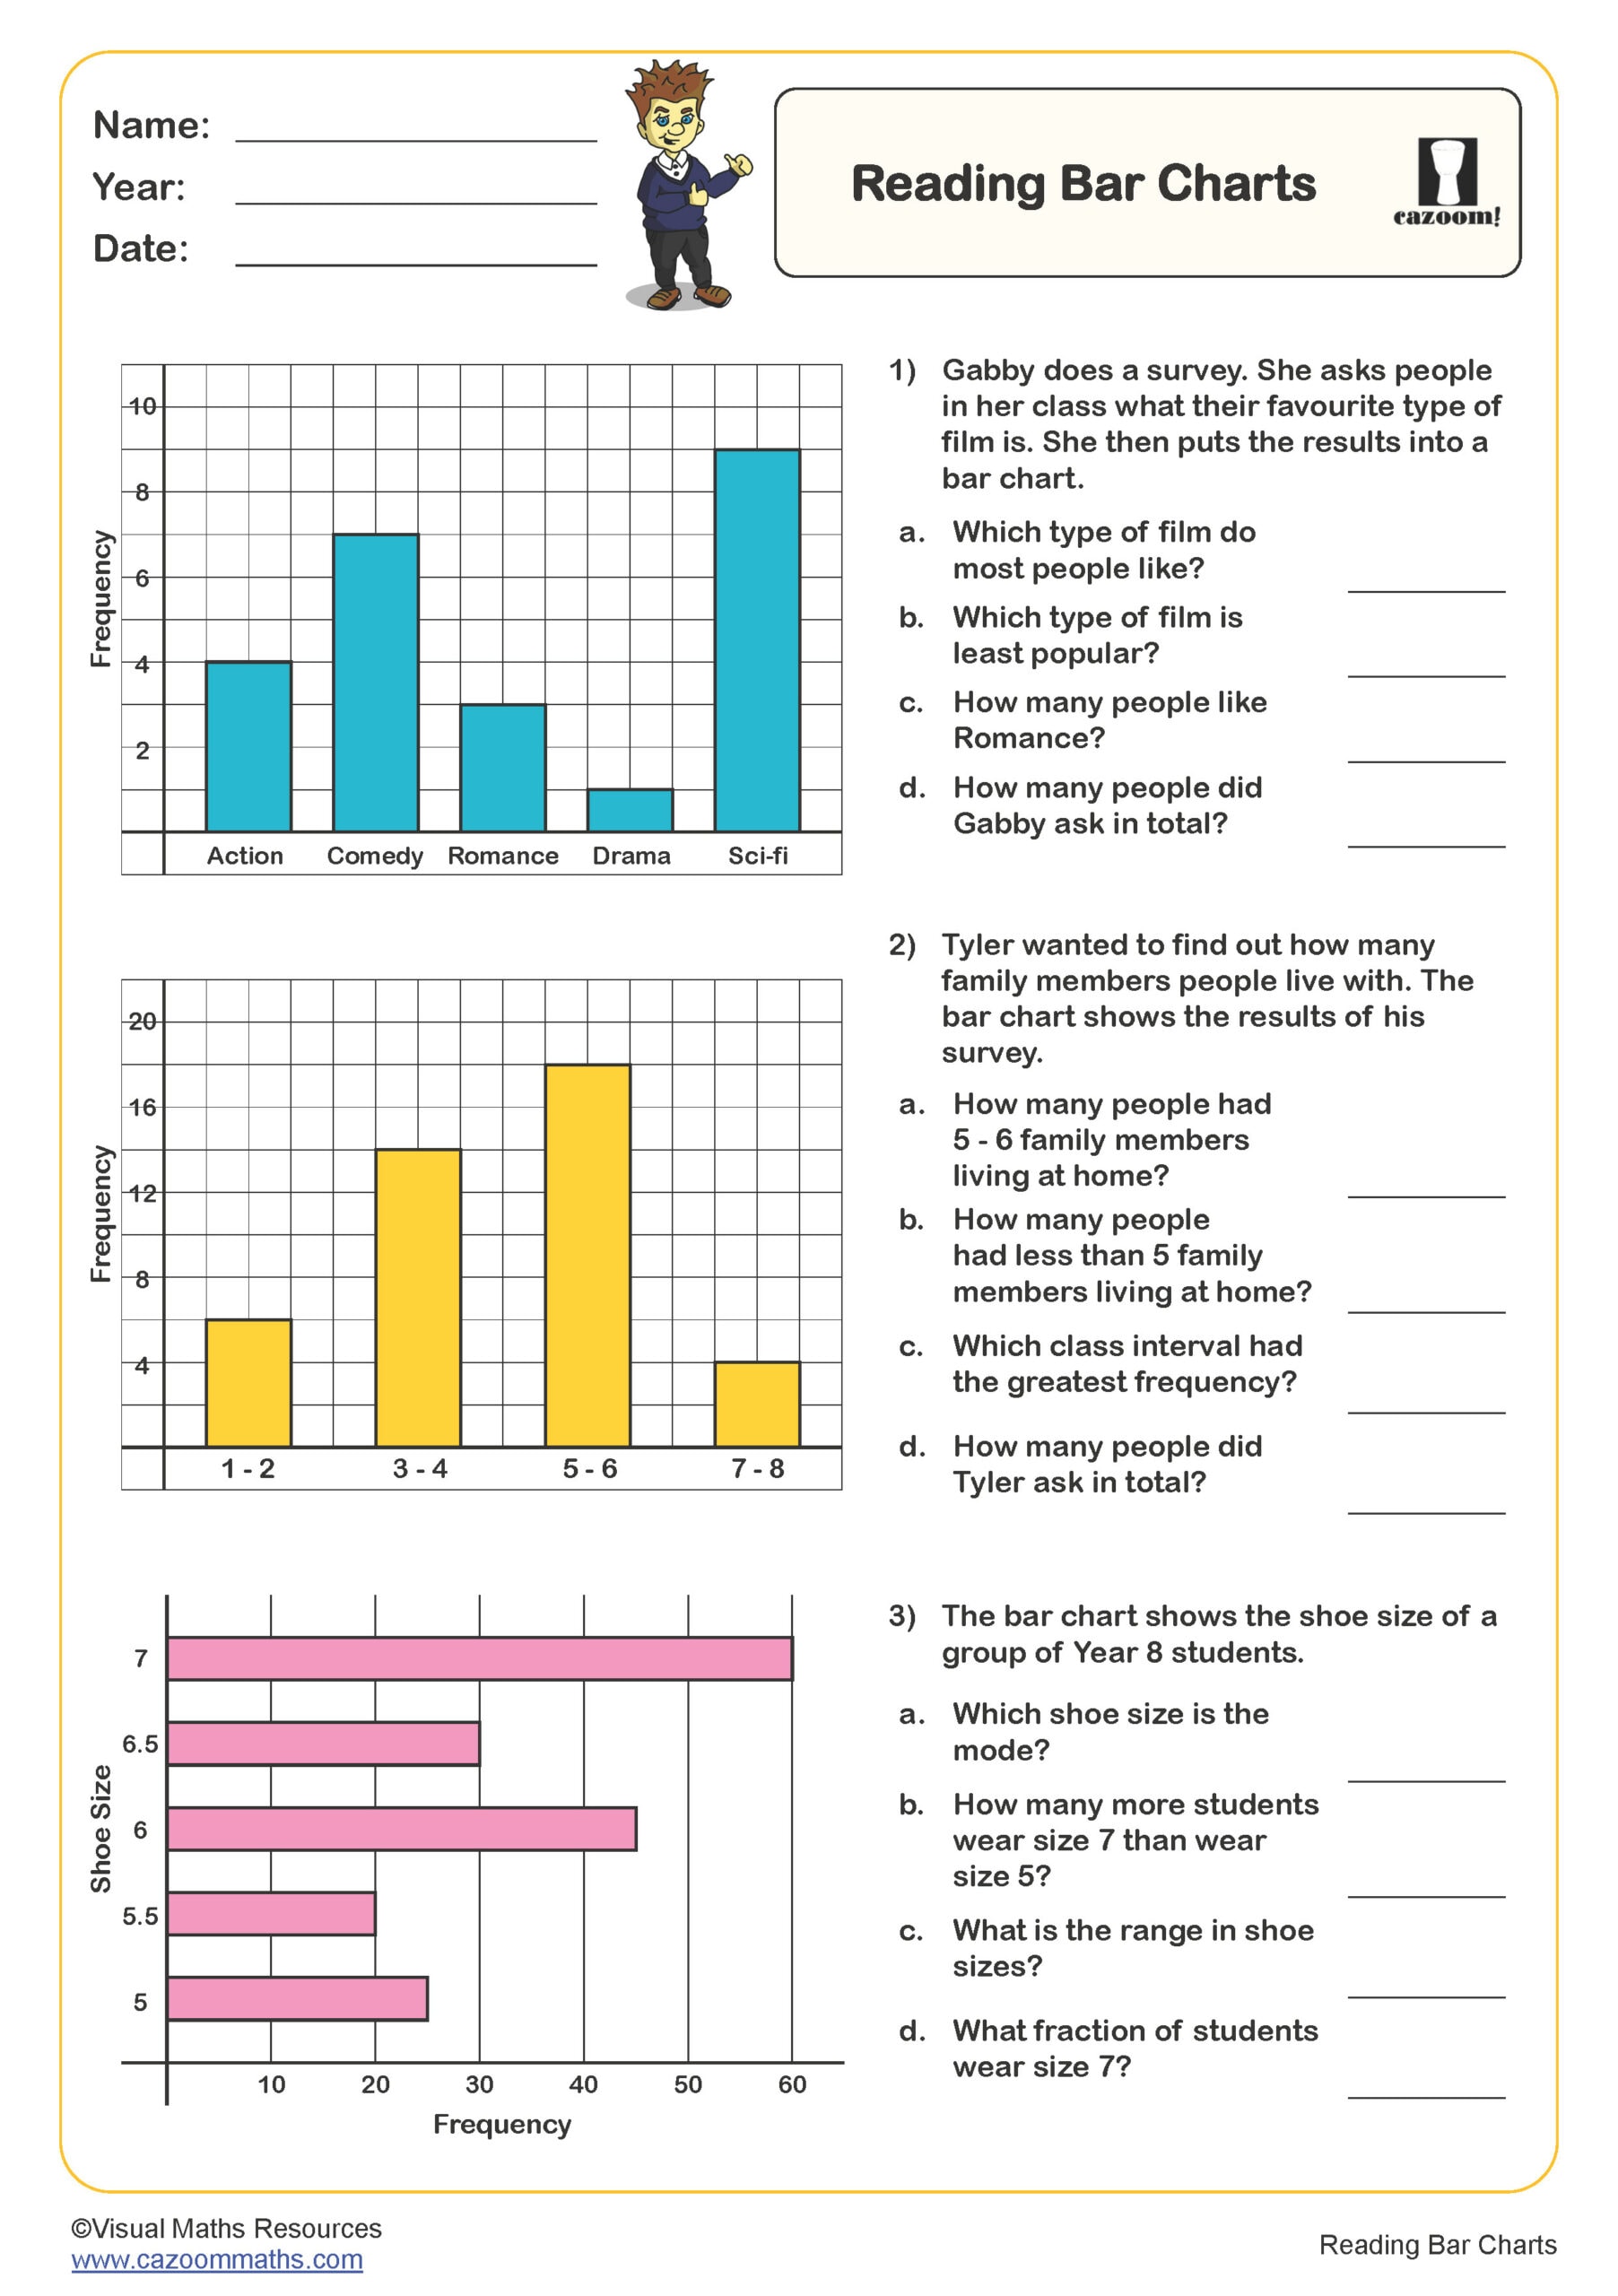
This worksheet gives an opportunity for learners to practise taking information from a tally chart to produce a bar chart.
Learners will need to complete the frequency columns of the four tally charts and then use the axes provided to make their own bar chart.
The importance of correct scales and labelling can be highlighted during this task.
All worksheets are created by the team of experienced teachers at Cazoom Maths.

RELATED TO Drawing Bar Charts from Frequency Tables WORKSHEET
Frequently Asked Questions
Your child will learn the essential skill of drawing bar charts from a frequency table, which is a key part of the Year 3 statistics curriculum. They'll practice converting numerical data from tally charts into visual representations, helping them understand how the same information can be presented in different formats. This foundational skill builds their confidence with data handling and prepares them for more complex statistical work in later years.