Back to:
Drawing Pie Charts (B) WORKSHEET
Suitable for Year groups: Year 6
Learning objective: Drawing pie charts using fractions, percentages and sectors.
Drawing Pie Charts (B) WORKSHEET DESCRIPTION
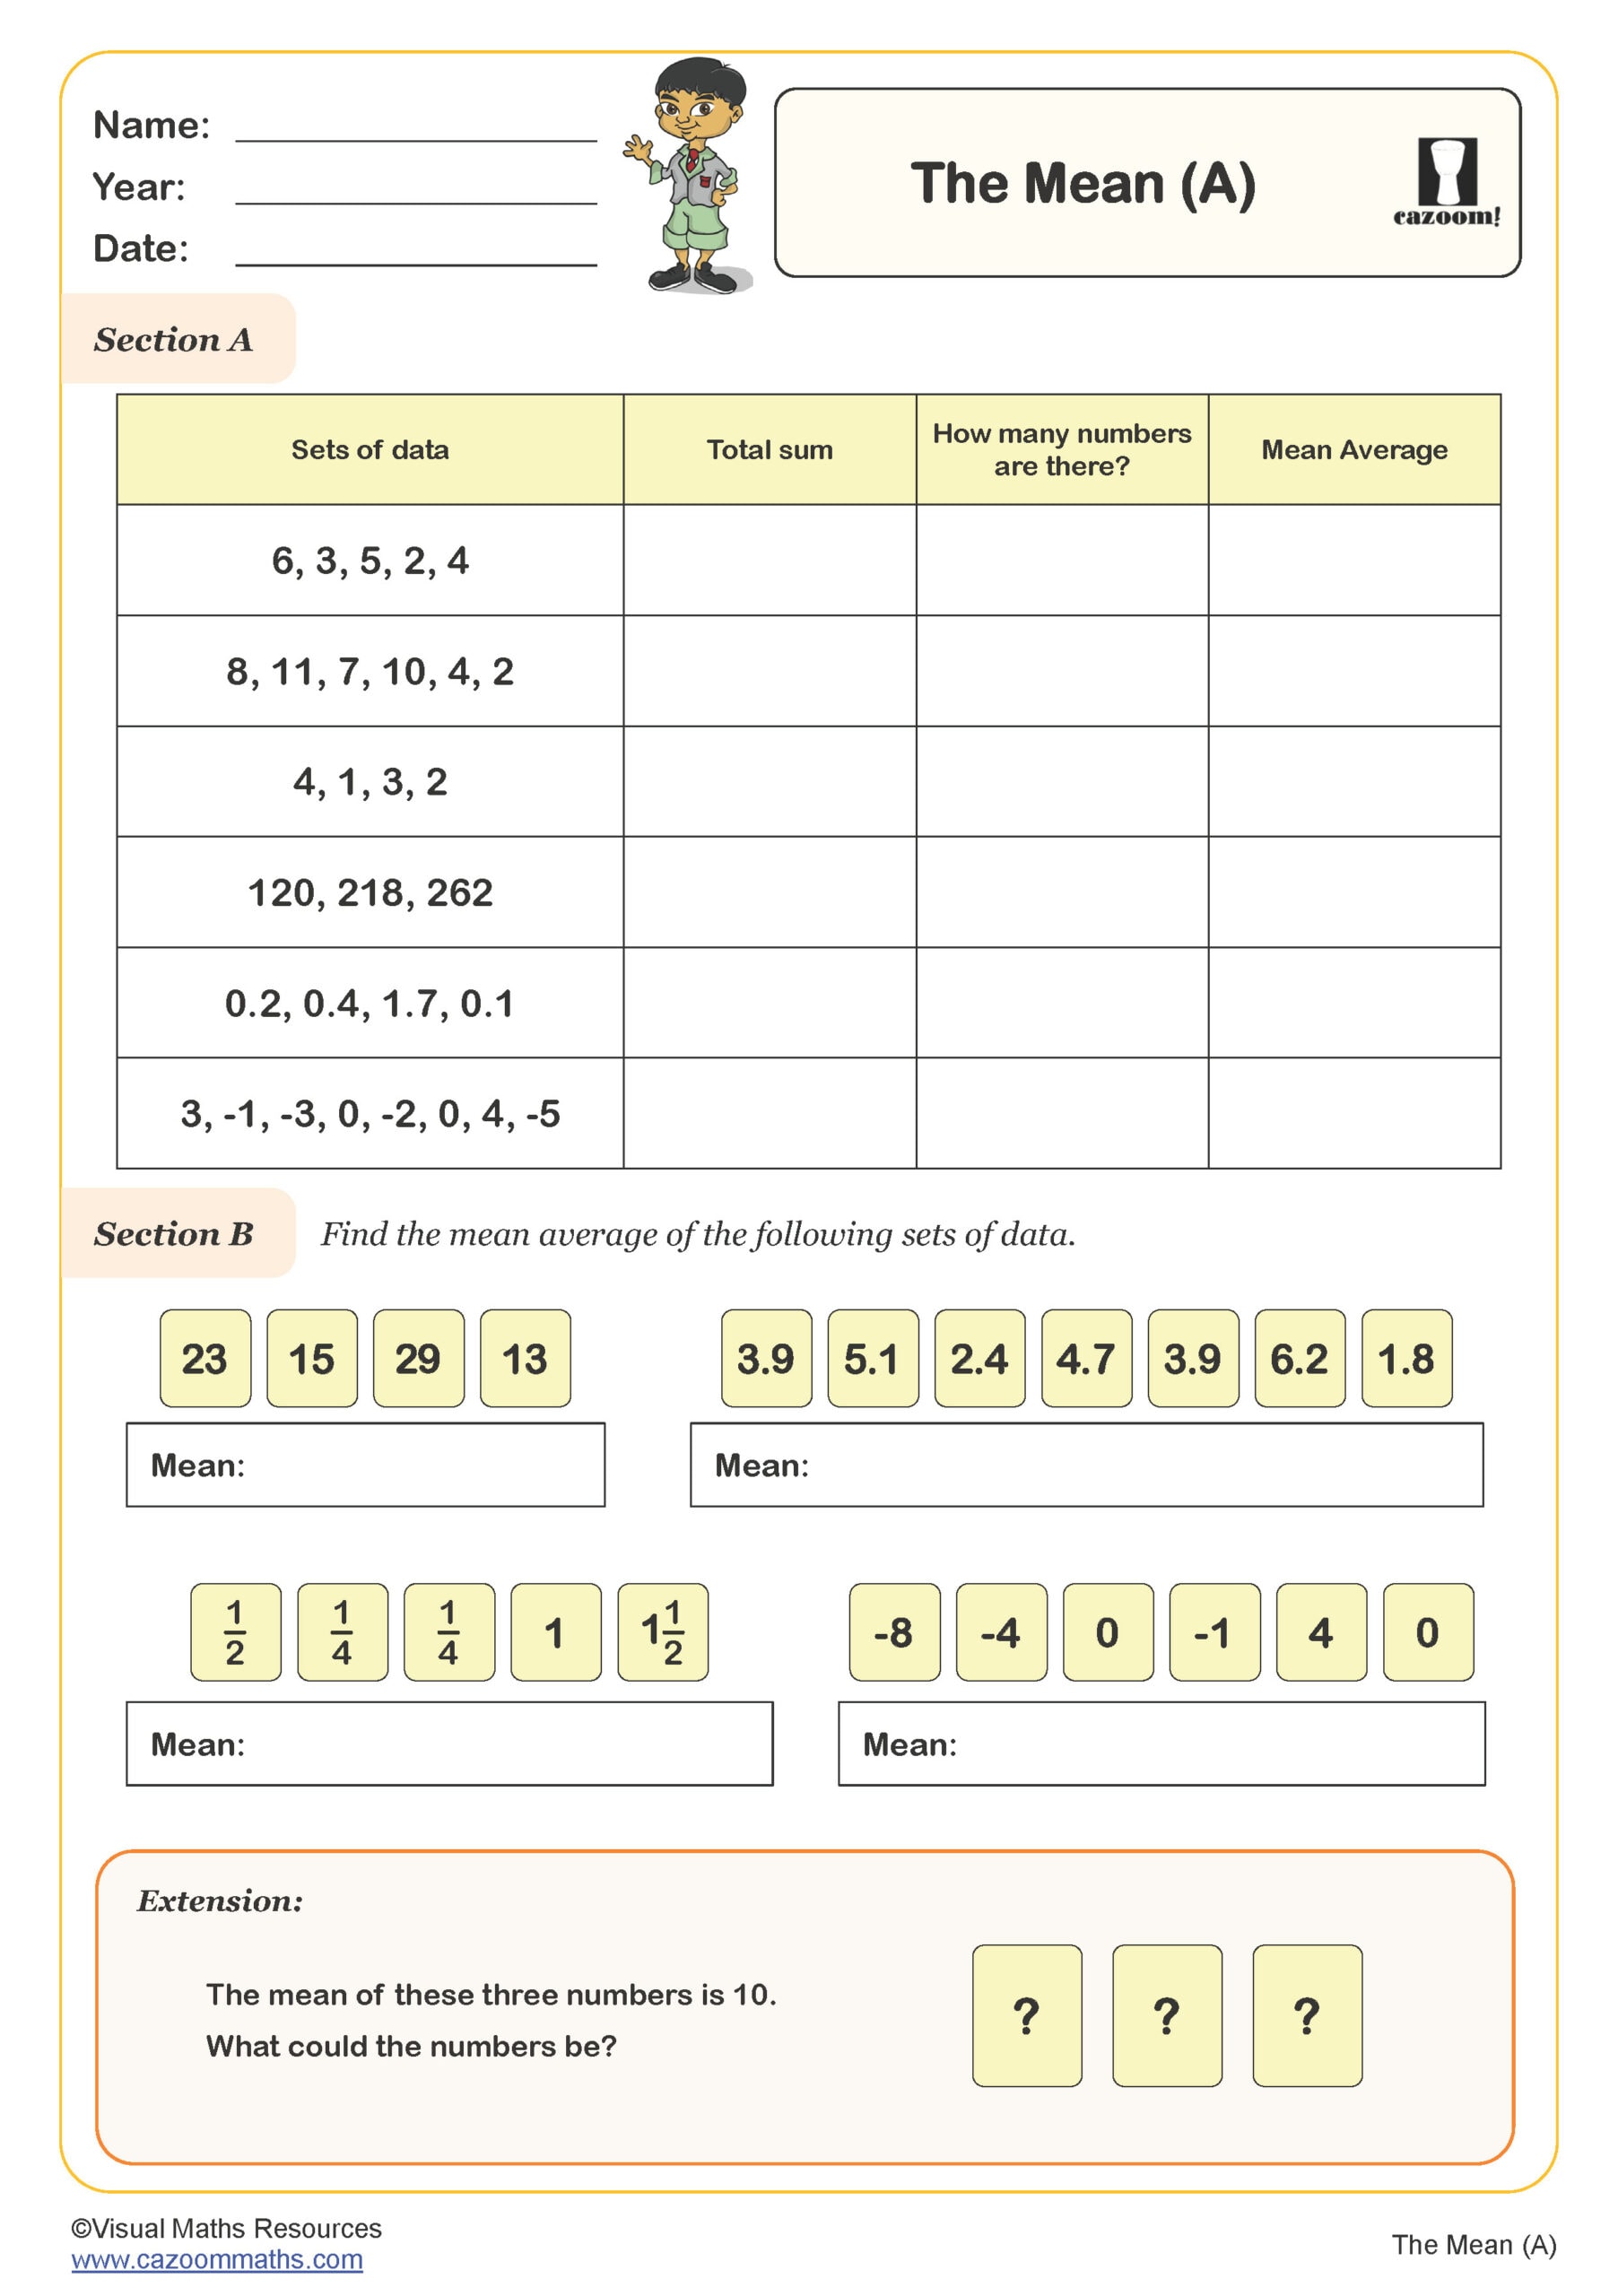
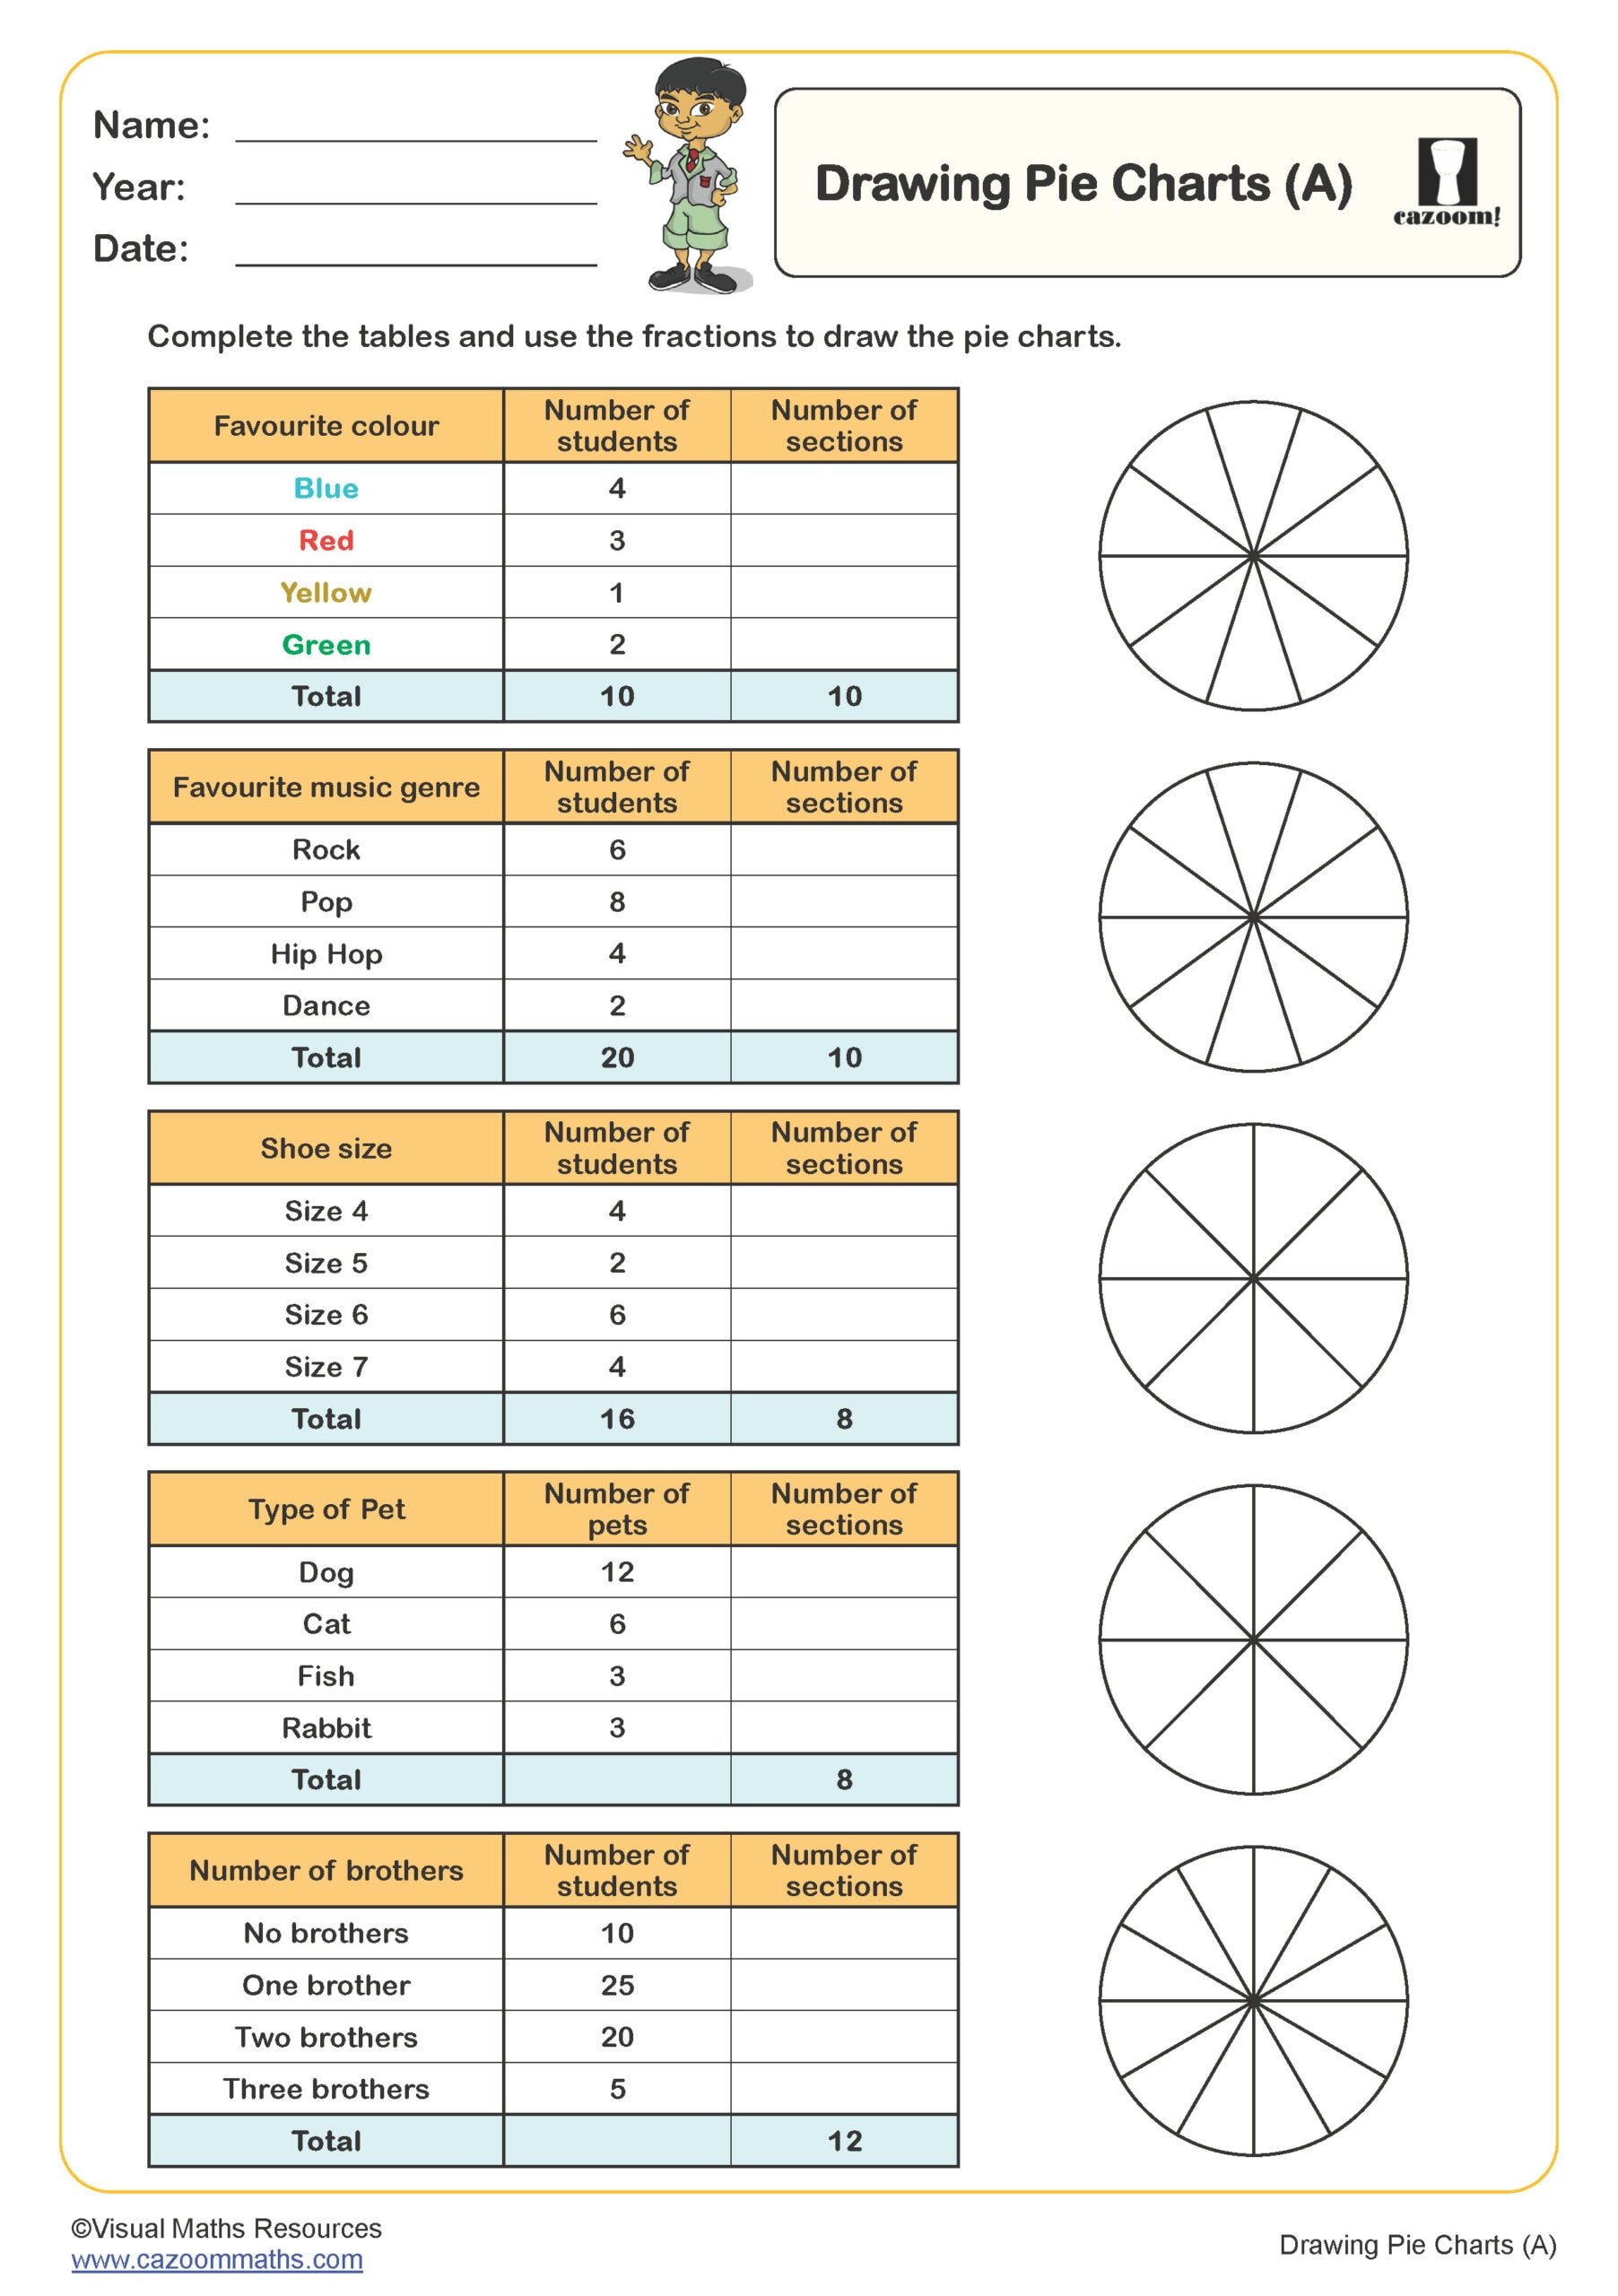
This worksheet provides some tables of information that can be presented as pie charts by shading sectors.
Each pie chart is split into tenths and learners will need to work out the number of sections using percentages from the data in each table.
All worksheets are created by the team of experienced teachers at Cazoom Maths.
 Worksheet")
RELATED TO Drawing Pie Charts (B) WORKSHEET
Frequently Asked Questions
Your child will develop their understanding of statistics by learning to draw pie charts using fractions, percentages and sectors. They'll need to convert percentage data from tables into the correct number of sections on each chart, which helps strengthen their grasp of how different mathematical representations connect together.