Averages from Stem and Leaf Diagrams WORKSHEET
Suitable for Year groups: Year 7, Year 8
GCSE Tier: Foundation/Higher
Targeting grades: 4 - 5
Prerequisite knowledge: Construct and interpret stem and leaf diagrams. Find the mean, median, mode and range from data in lists.
Learning Objective: Calculate and compare averages and range from raw data displayed in diagrams.
Averages from Stem and Leaf Diagrams WORKSHEET DESCRIPTION
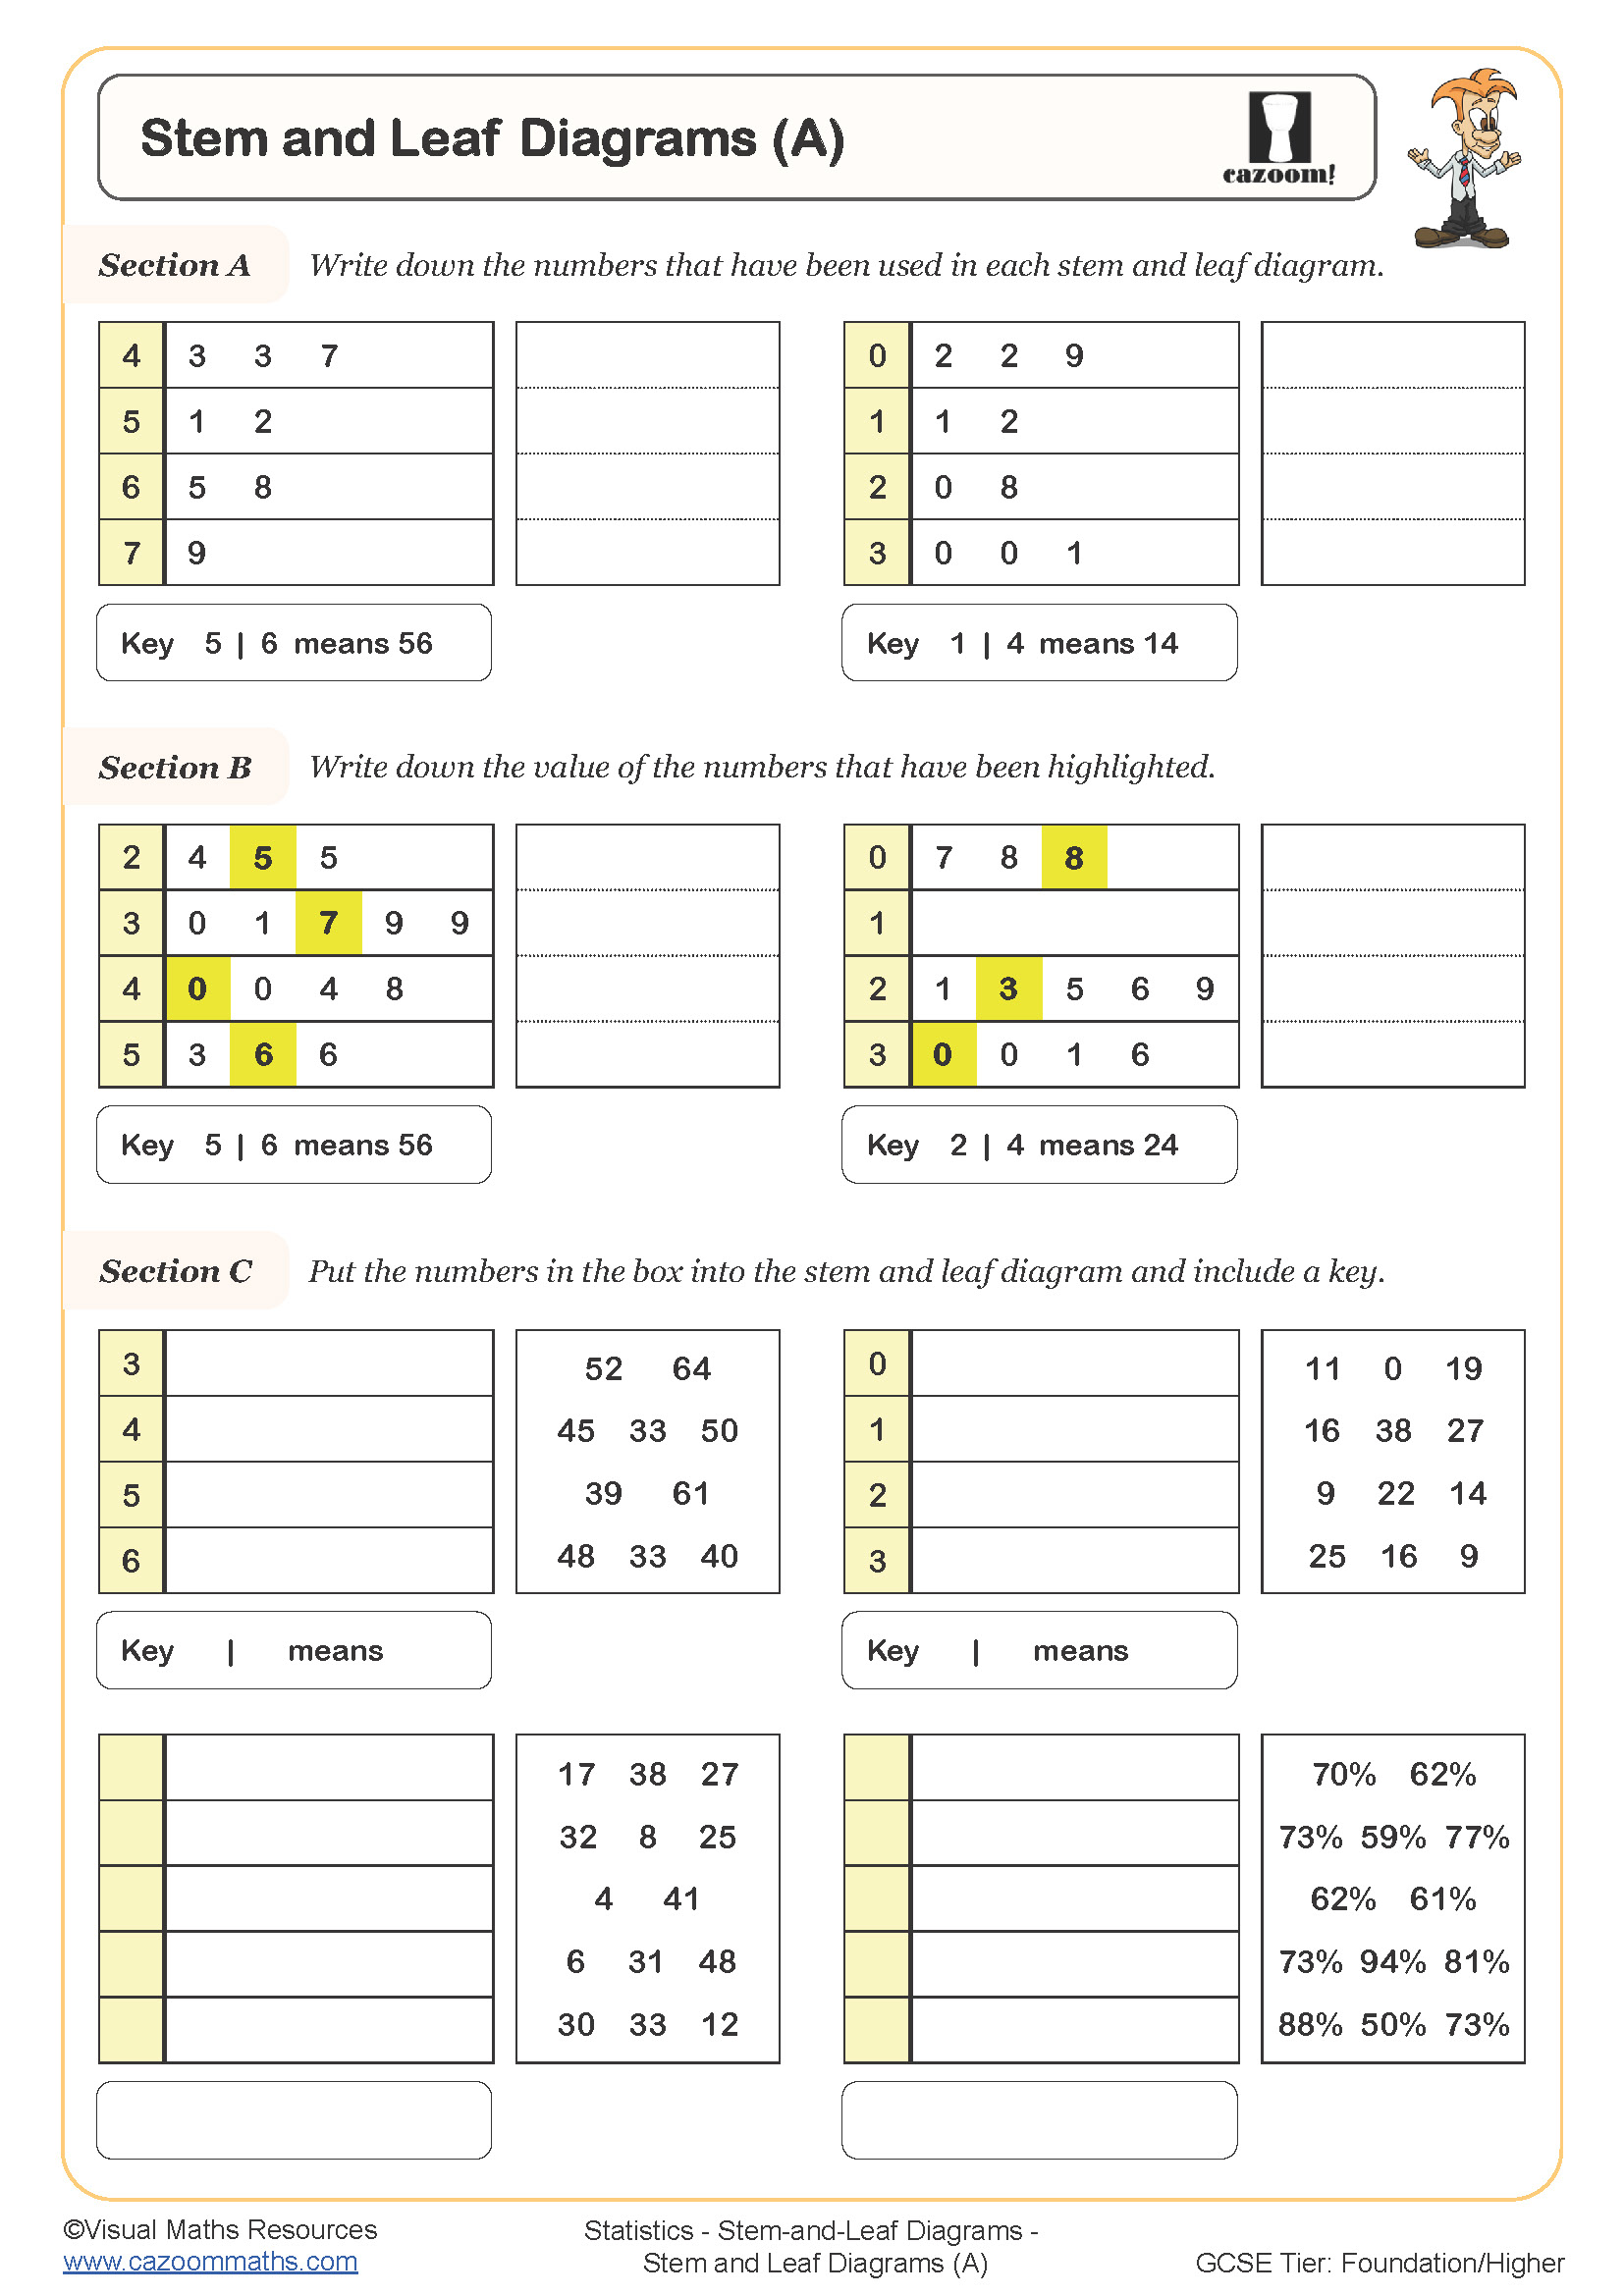
This worksheet guides students through a clear and structured progression in finding averages and range from stem-and-leaf diagrams.
Section A introduces the idea of identifying the lowest and highest values before calculating the range.
Section B moves on to the mode, with carefully chosen diagrams that highlight common misconceptions about repeated values and the meaning of “most frequent.”
In Section C, students learn to locate the median using positional reasoning, and explain how different values influence the middle of an ordered set.
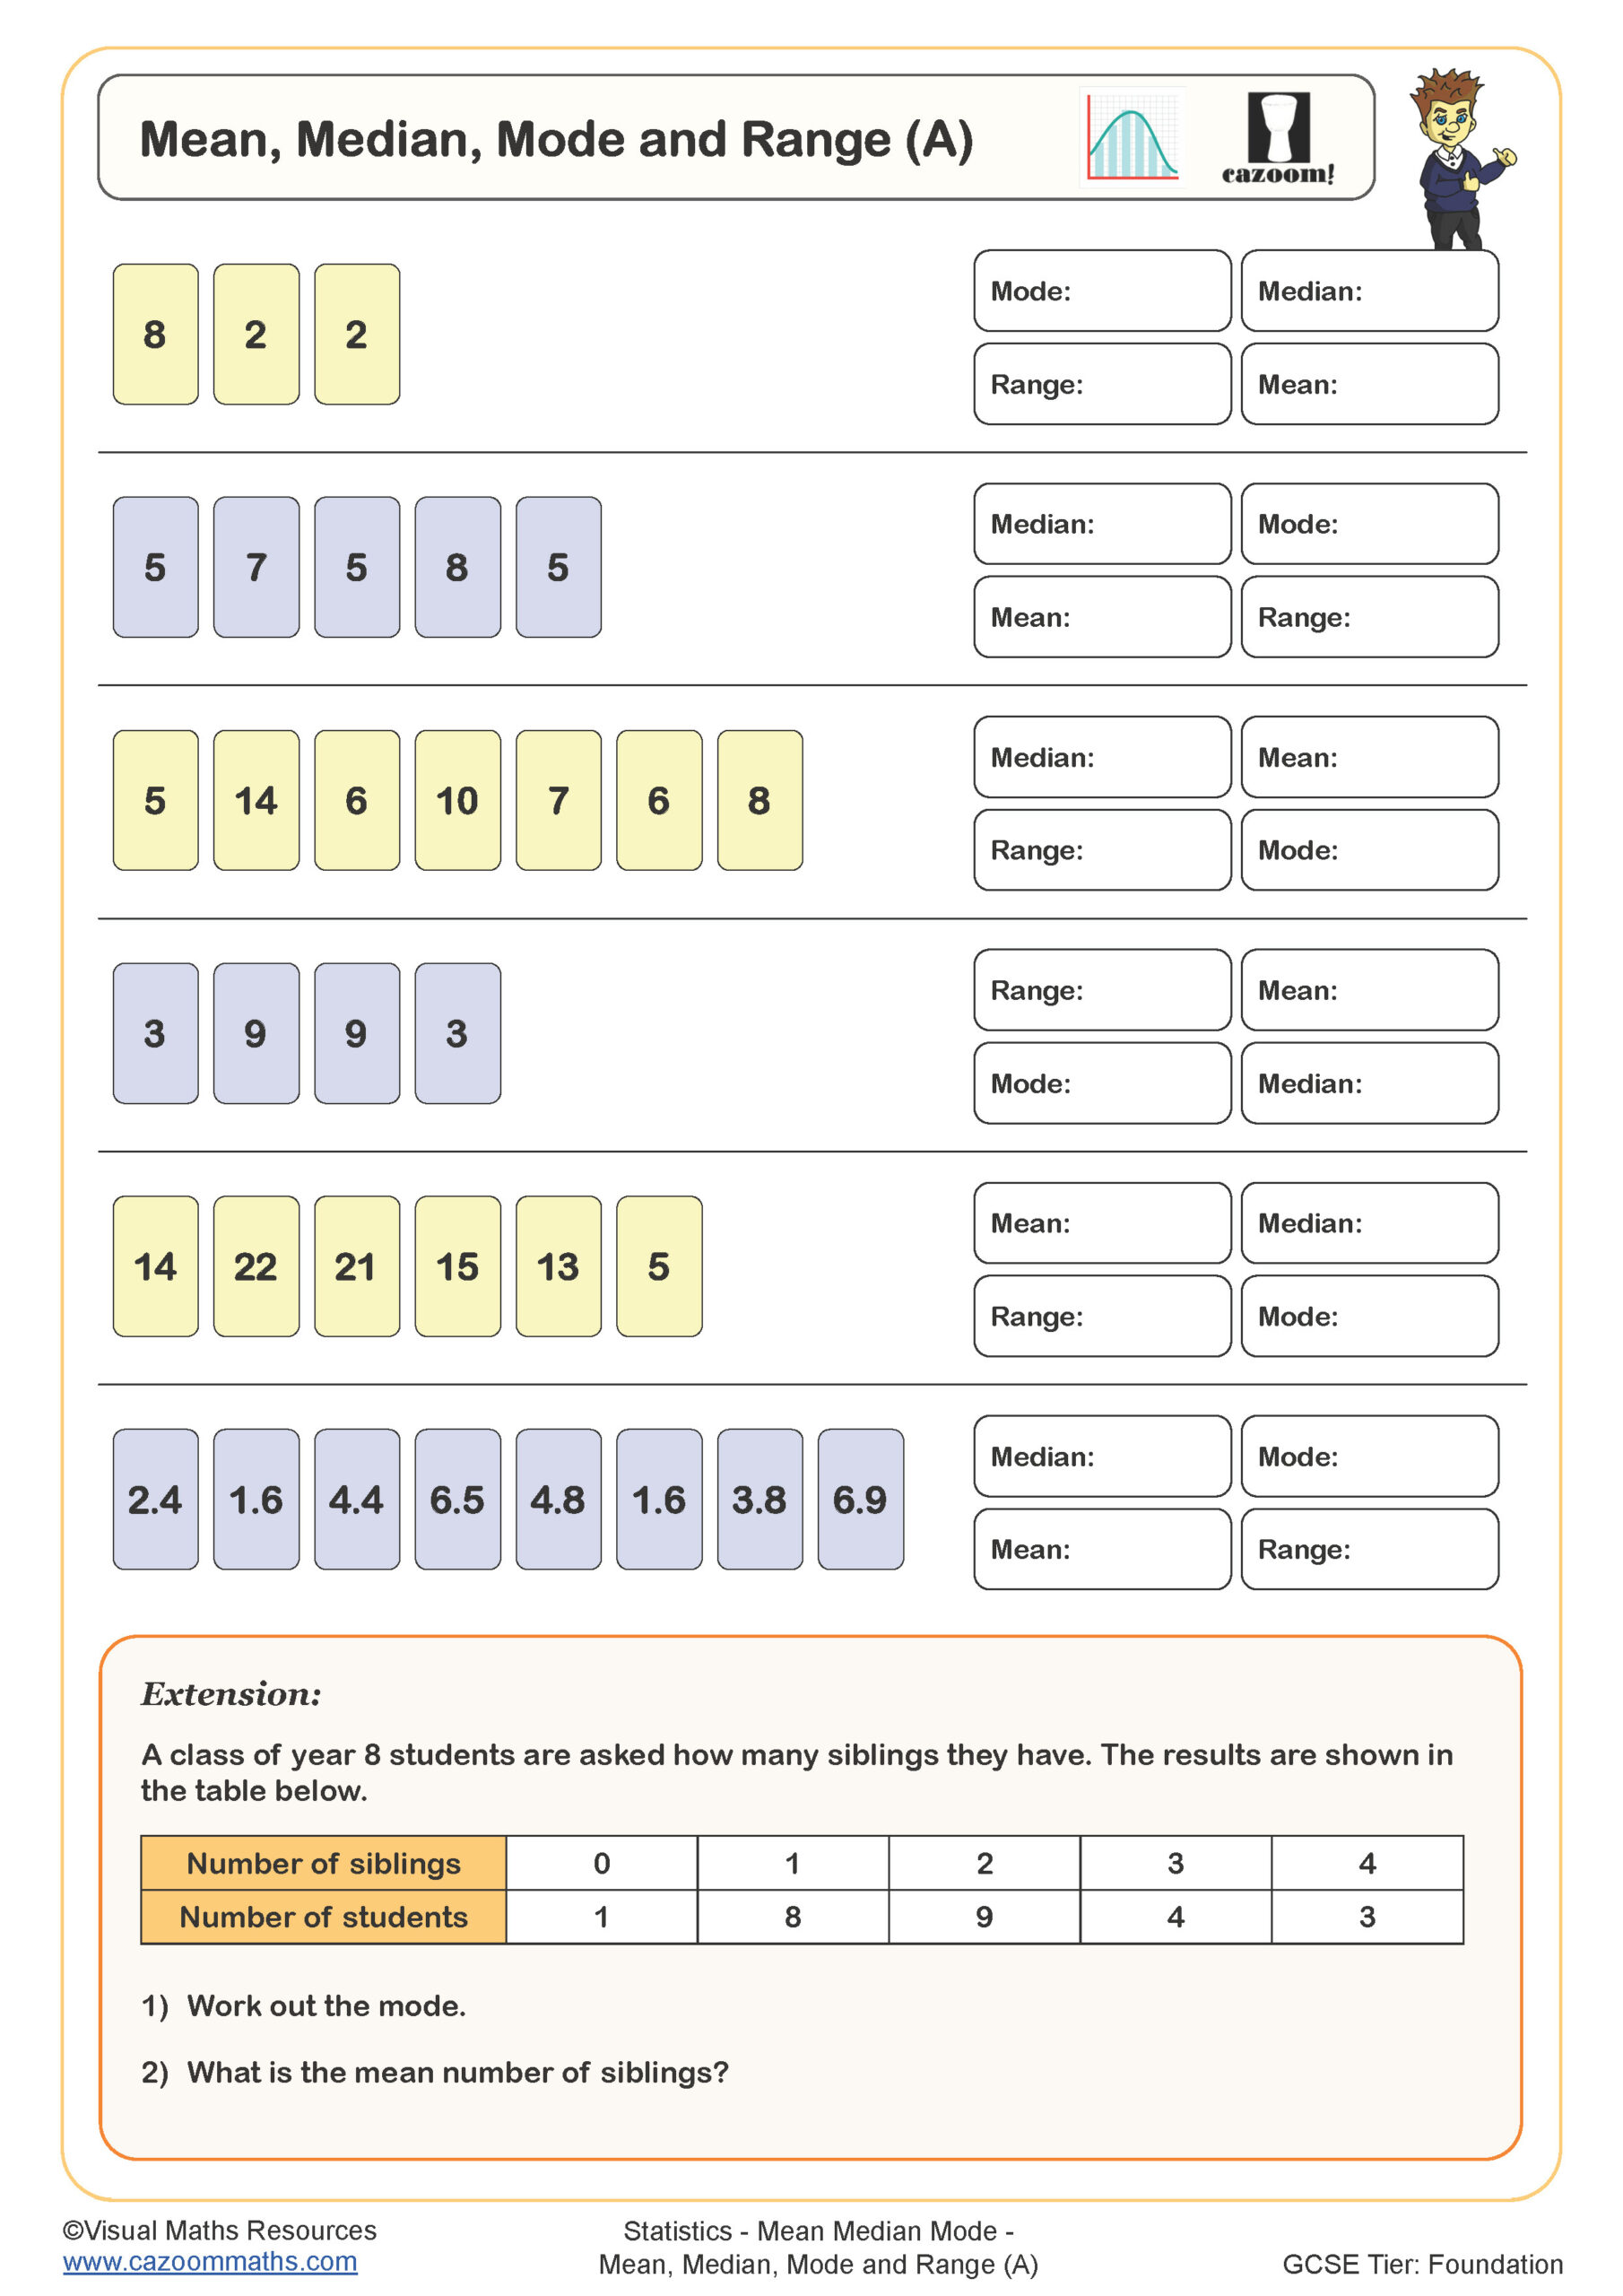
Section D concludes with dual stem-and-leaf diagrams, allowing students to calculate and compare means between two groups and evaluate the effect of new data.
The tasks steadily build confidence by blending procedure with explanation and justification.
Section A introduces the idea of identifying the lowest and highest values before calculating the range.
Section B moves on to the mode, with carefully chosen diagrams that highlight common misconceptions about repeated values and the meaning of “most frequent.”
In Section C, students learn to locate the median using positional reasoning, and explain how different values influence the middle of an ordered set.
Section D concludes with dual stem-and-leaf diagrams, allowing students to calculate and compare means between two groups and evaluate the effect of new data.
The tasks steadily build confidence by blending procedure with explanation and justification.
All worksheets are created by the team of experienced teachers at Cazoom Maths.

RELATED TO Averages from Stem and Leaf Diagrams WORKSHEET
Frequently Asked Questions
Calculate and compare averages and range from raw data displayed in diagrams.