Box Plots (B) WORKSHEET
Suitable for Year groups: Year 9, Year 10
GCSE Tier: Higher
Targeting grades: 6-7
Prerequisite knowledge: Averages and range from listed data, stem and leaf diagrams.
Learning Objective: Plotting and reading from box plots
Box Plots (B) WORKSHEET DESCRIPTION
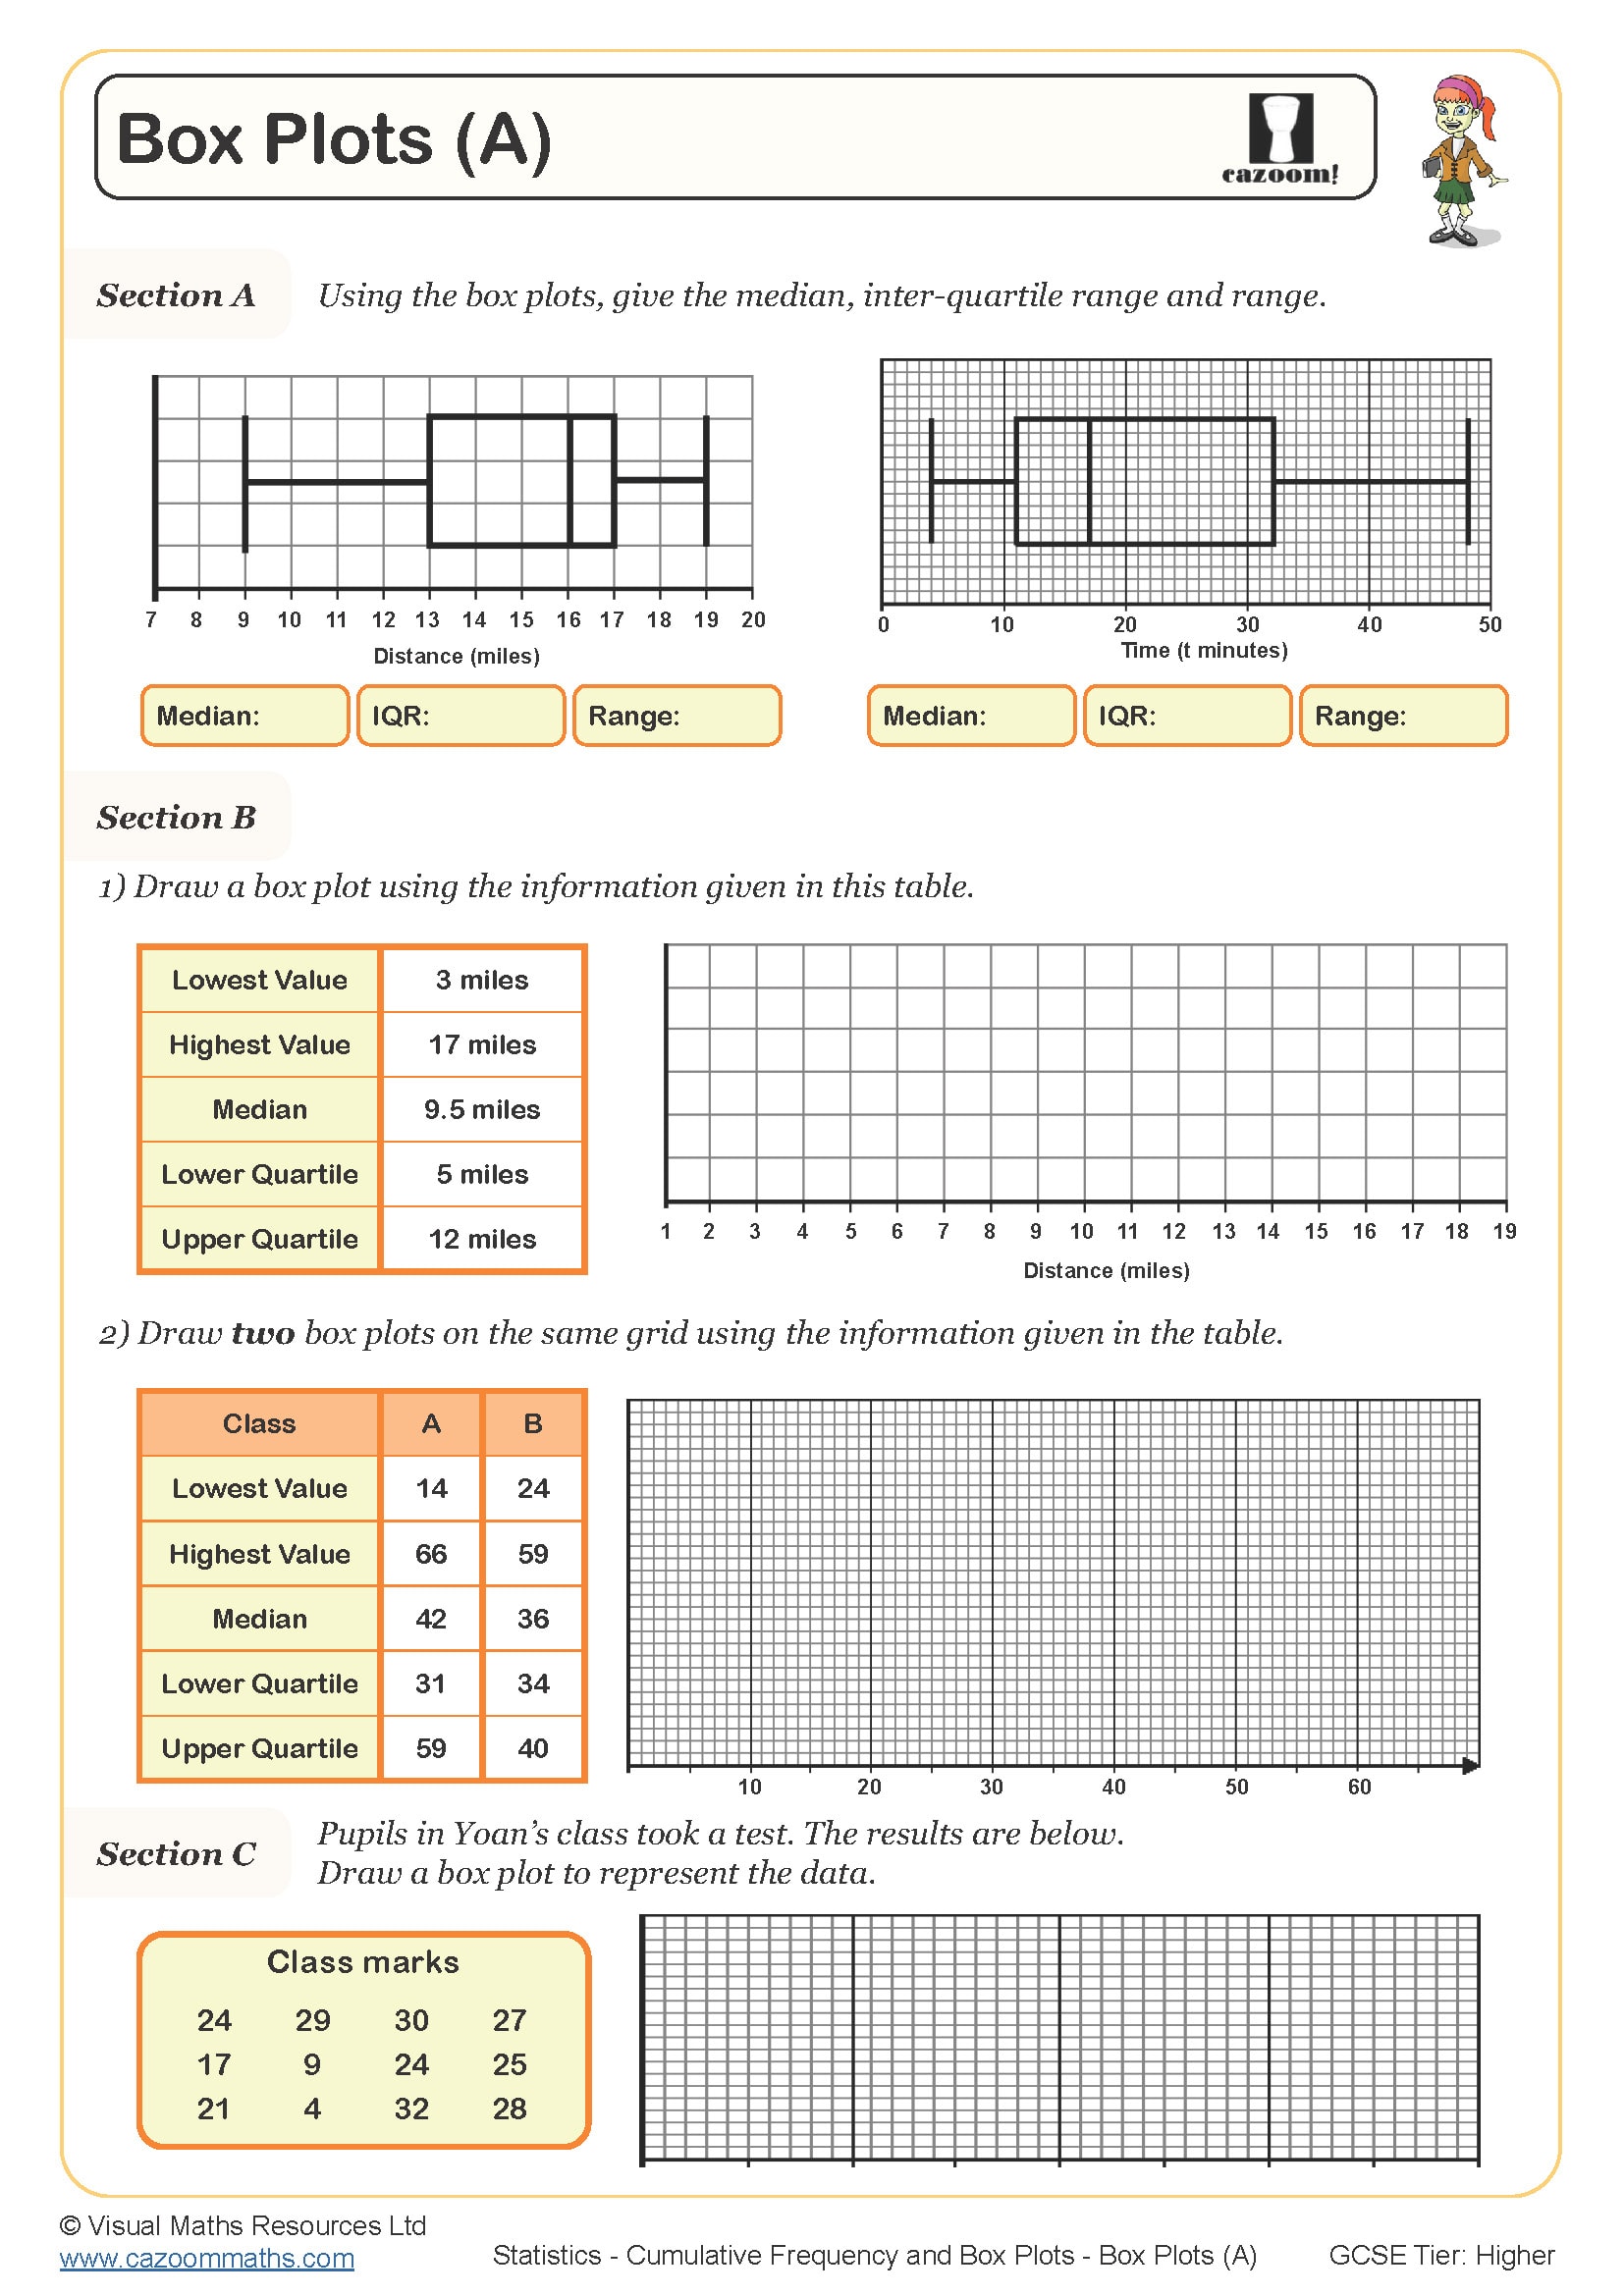
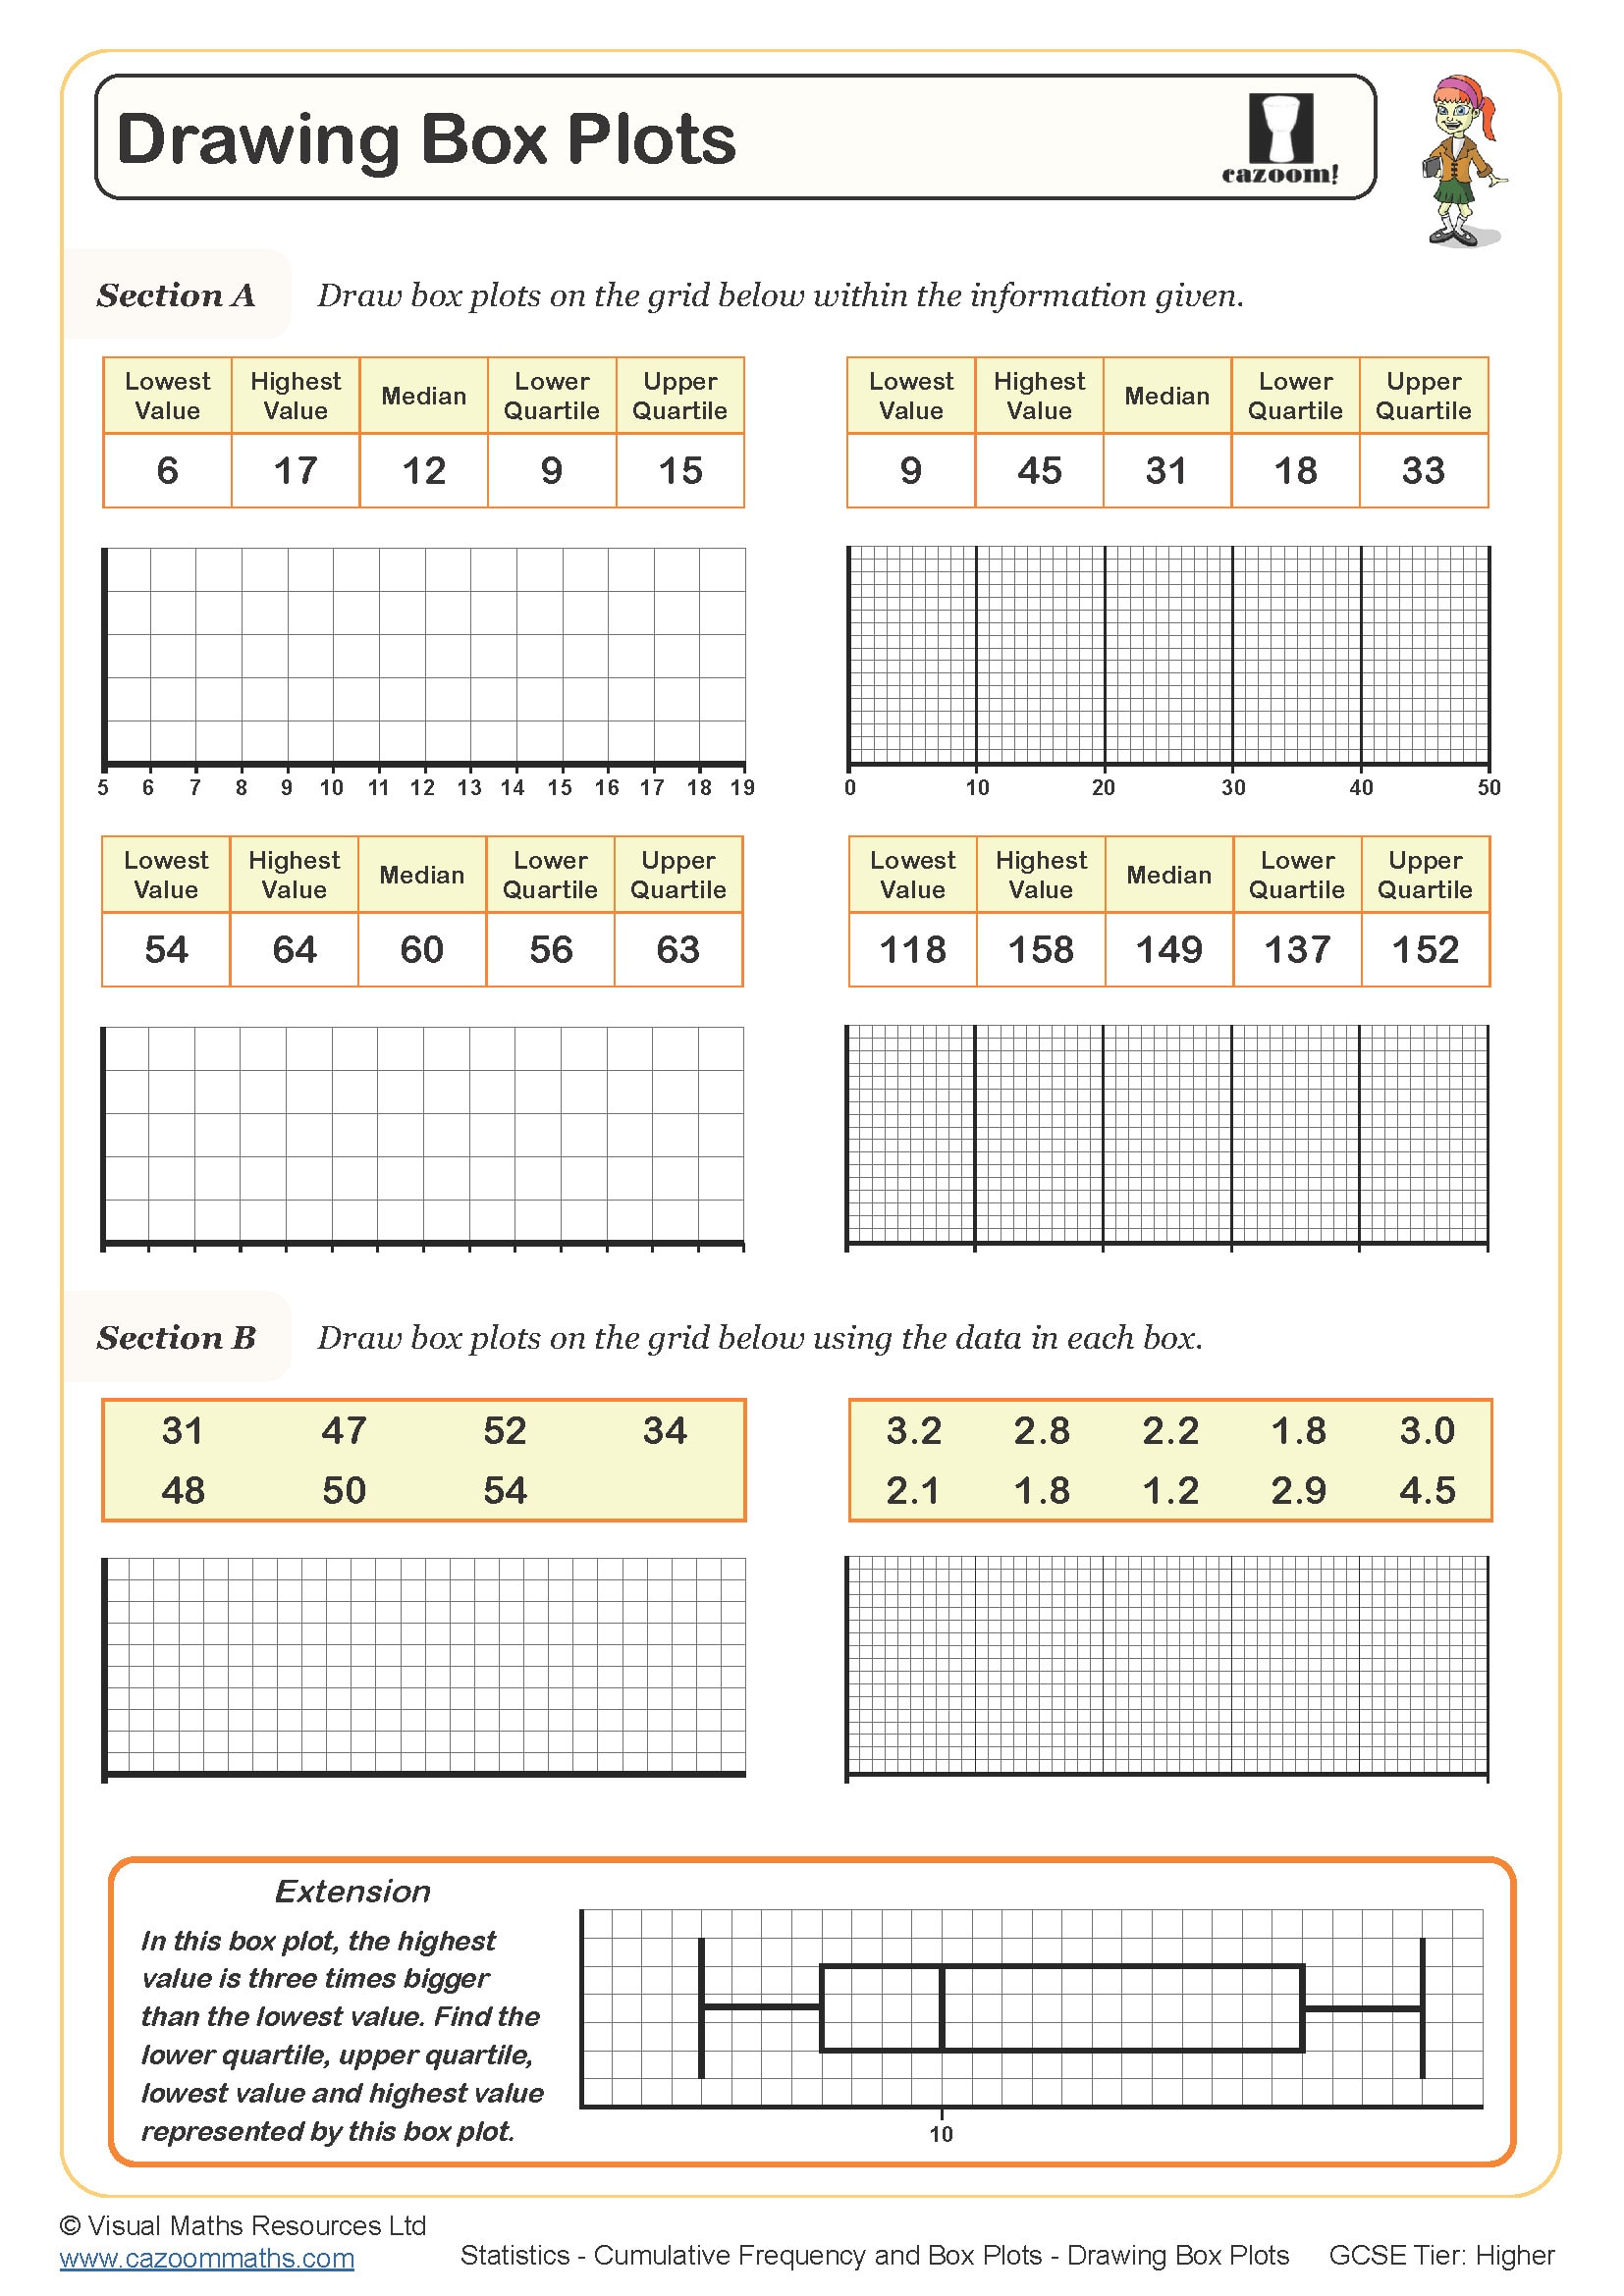
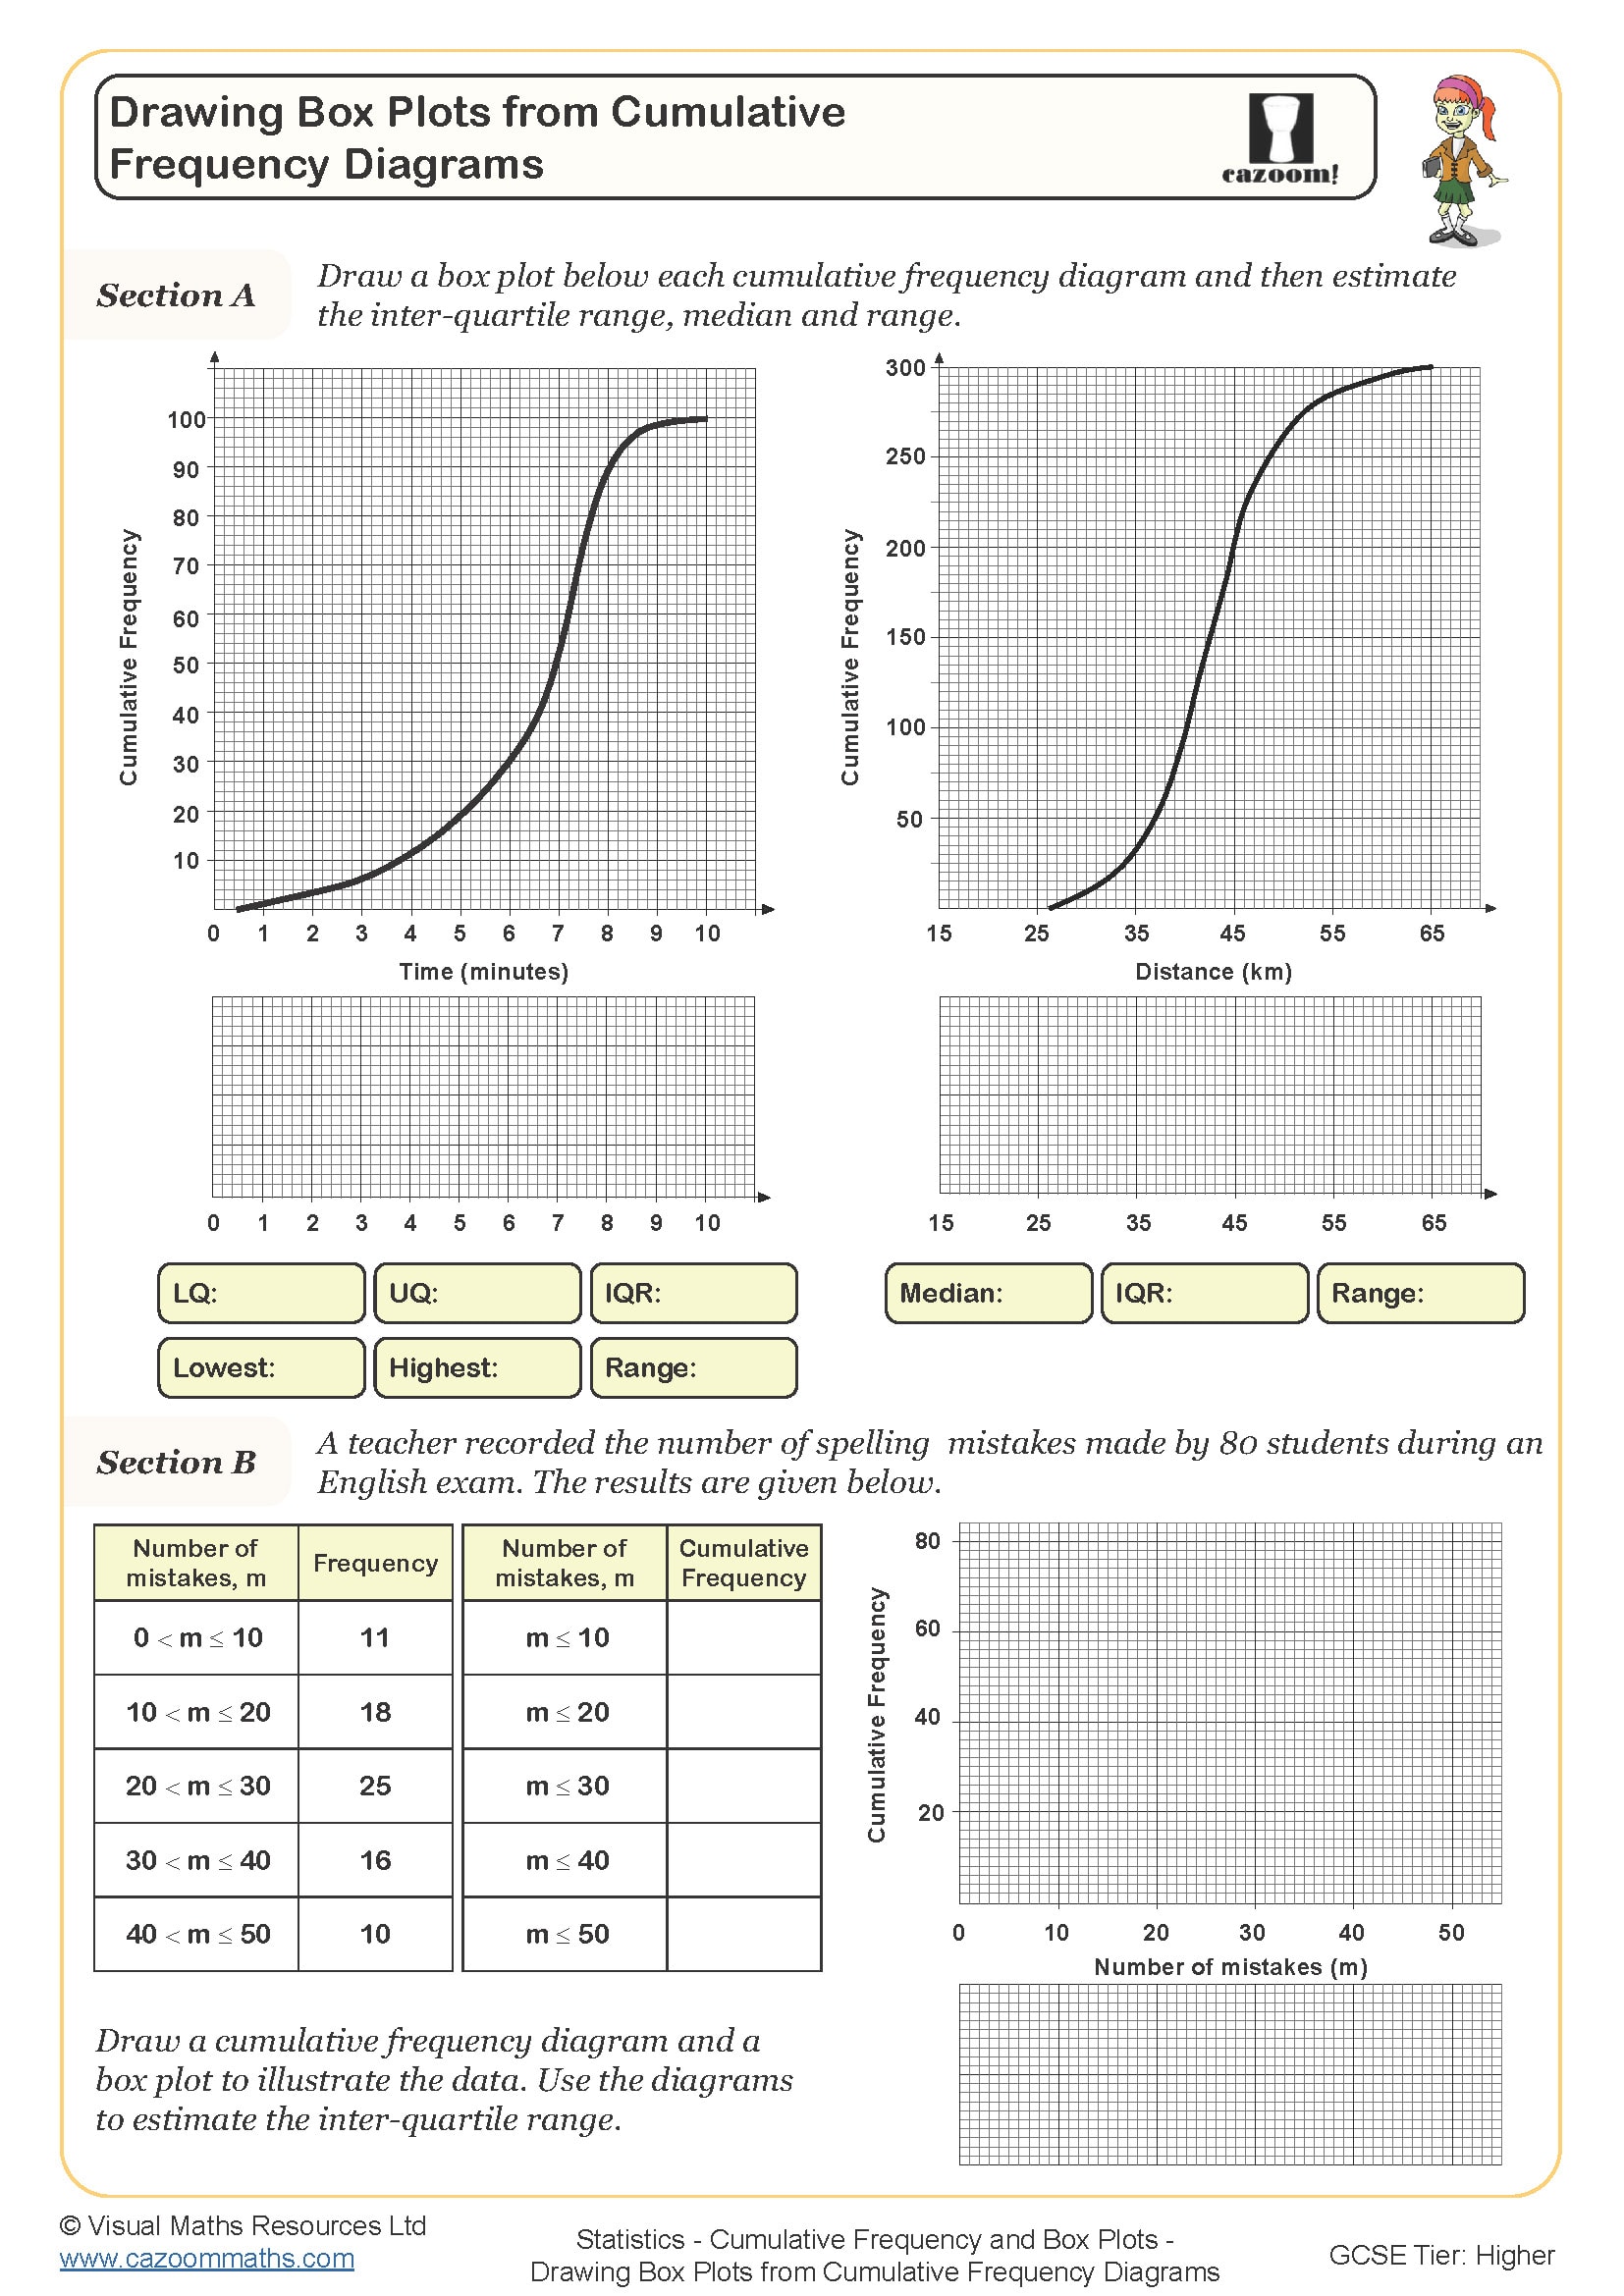
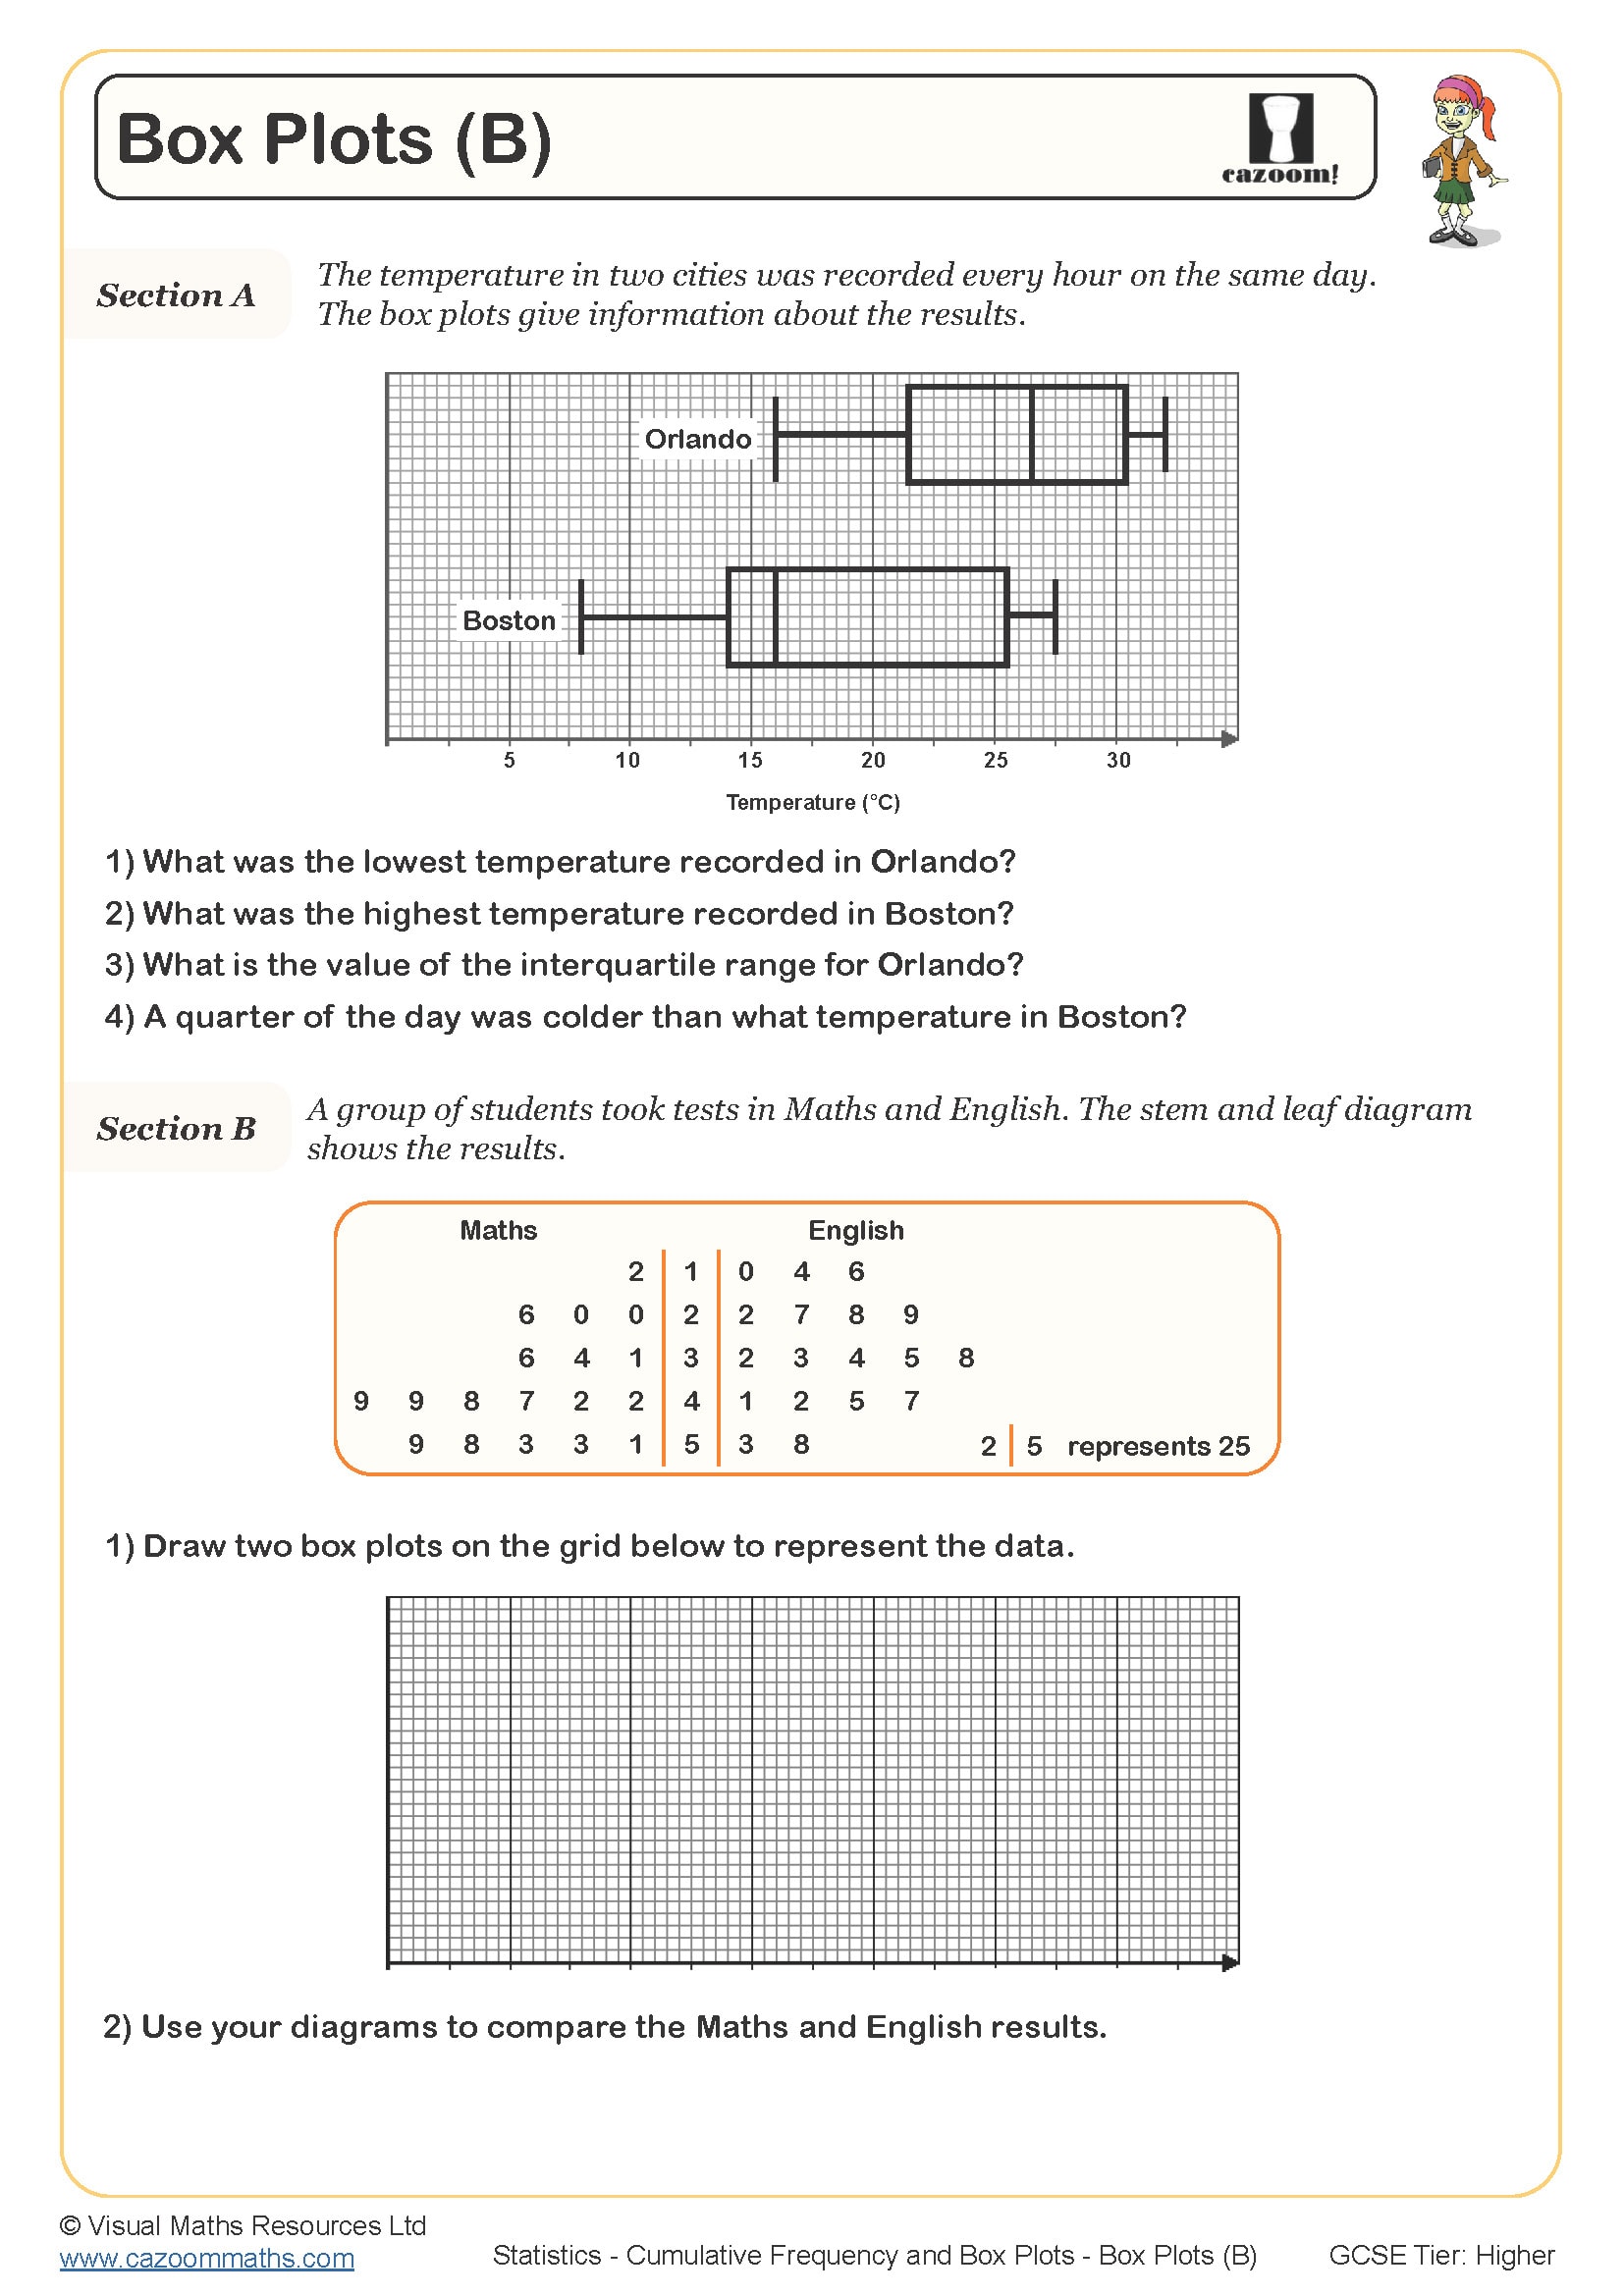
This worksheet gives a set of questions designed to help practise comparing two sets of data using box plots.
Section A provides two box plots about the temperature in two different areas. Learners are then given a set of questions to answer to help with the comparison.
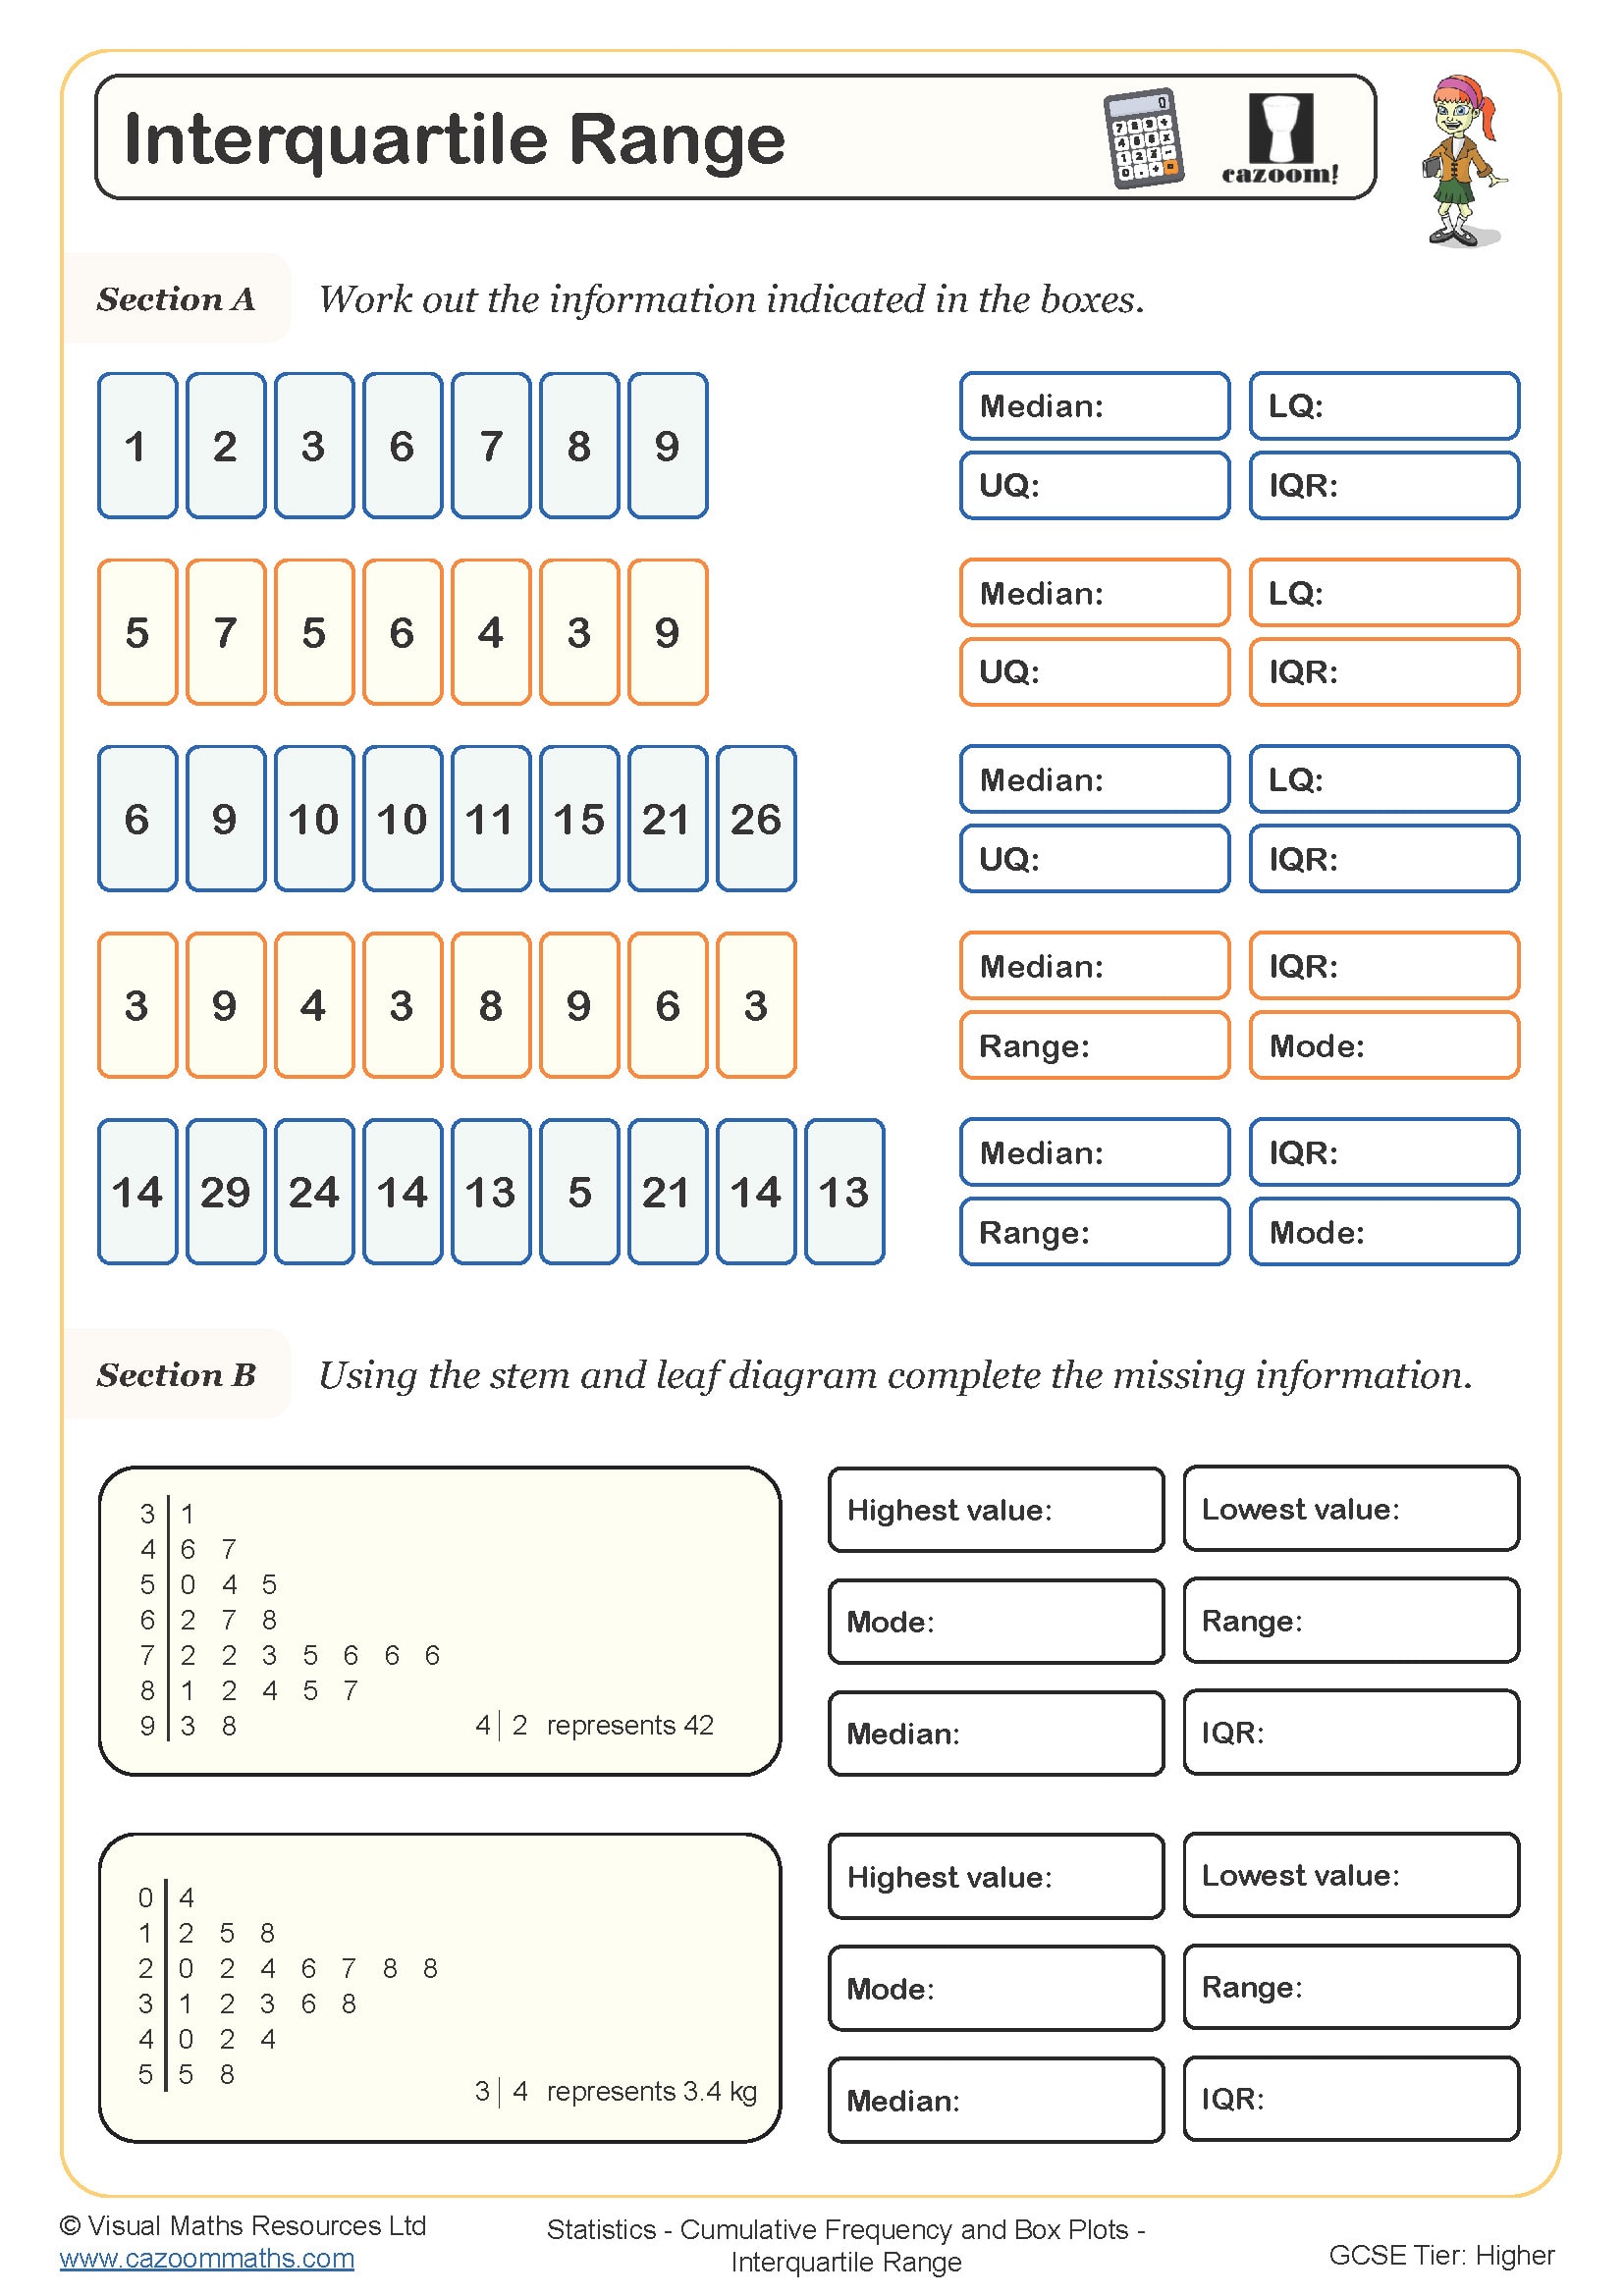
Section B provides a back-to-back stem and leaf diagram, which learners are asked to convert to two box plots before making comparisons.
RELATED TO Box Plots (B) WORKSHEET
Frequently Asked Questions
Plotting and reading from box plots
