Cumulative Frequency Diagrams (A) WORKSHEET
Cumulative Frequency Diagrams (A) WORKSHEET DESCRIPTION
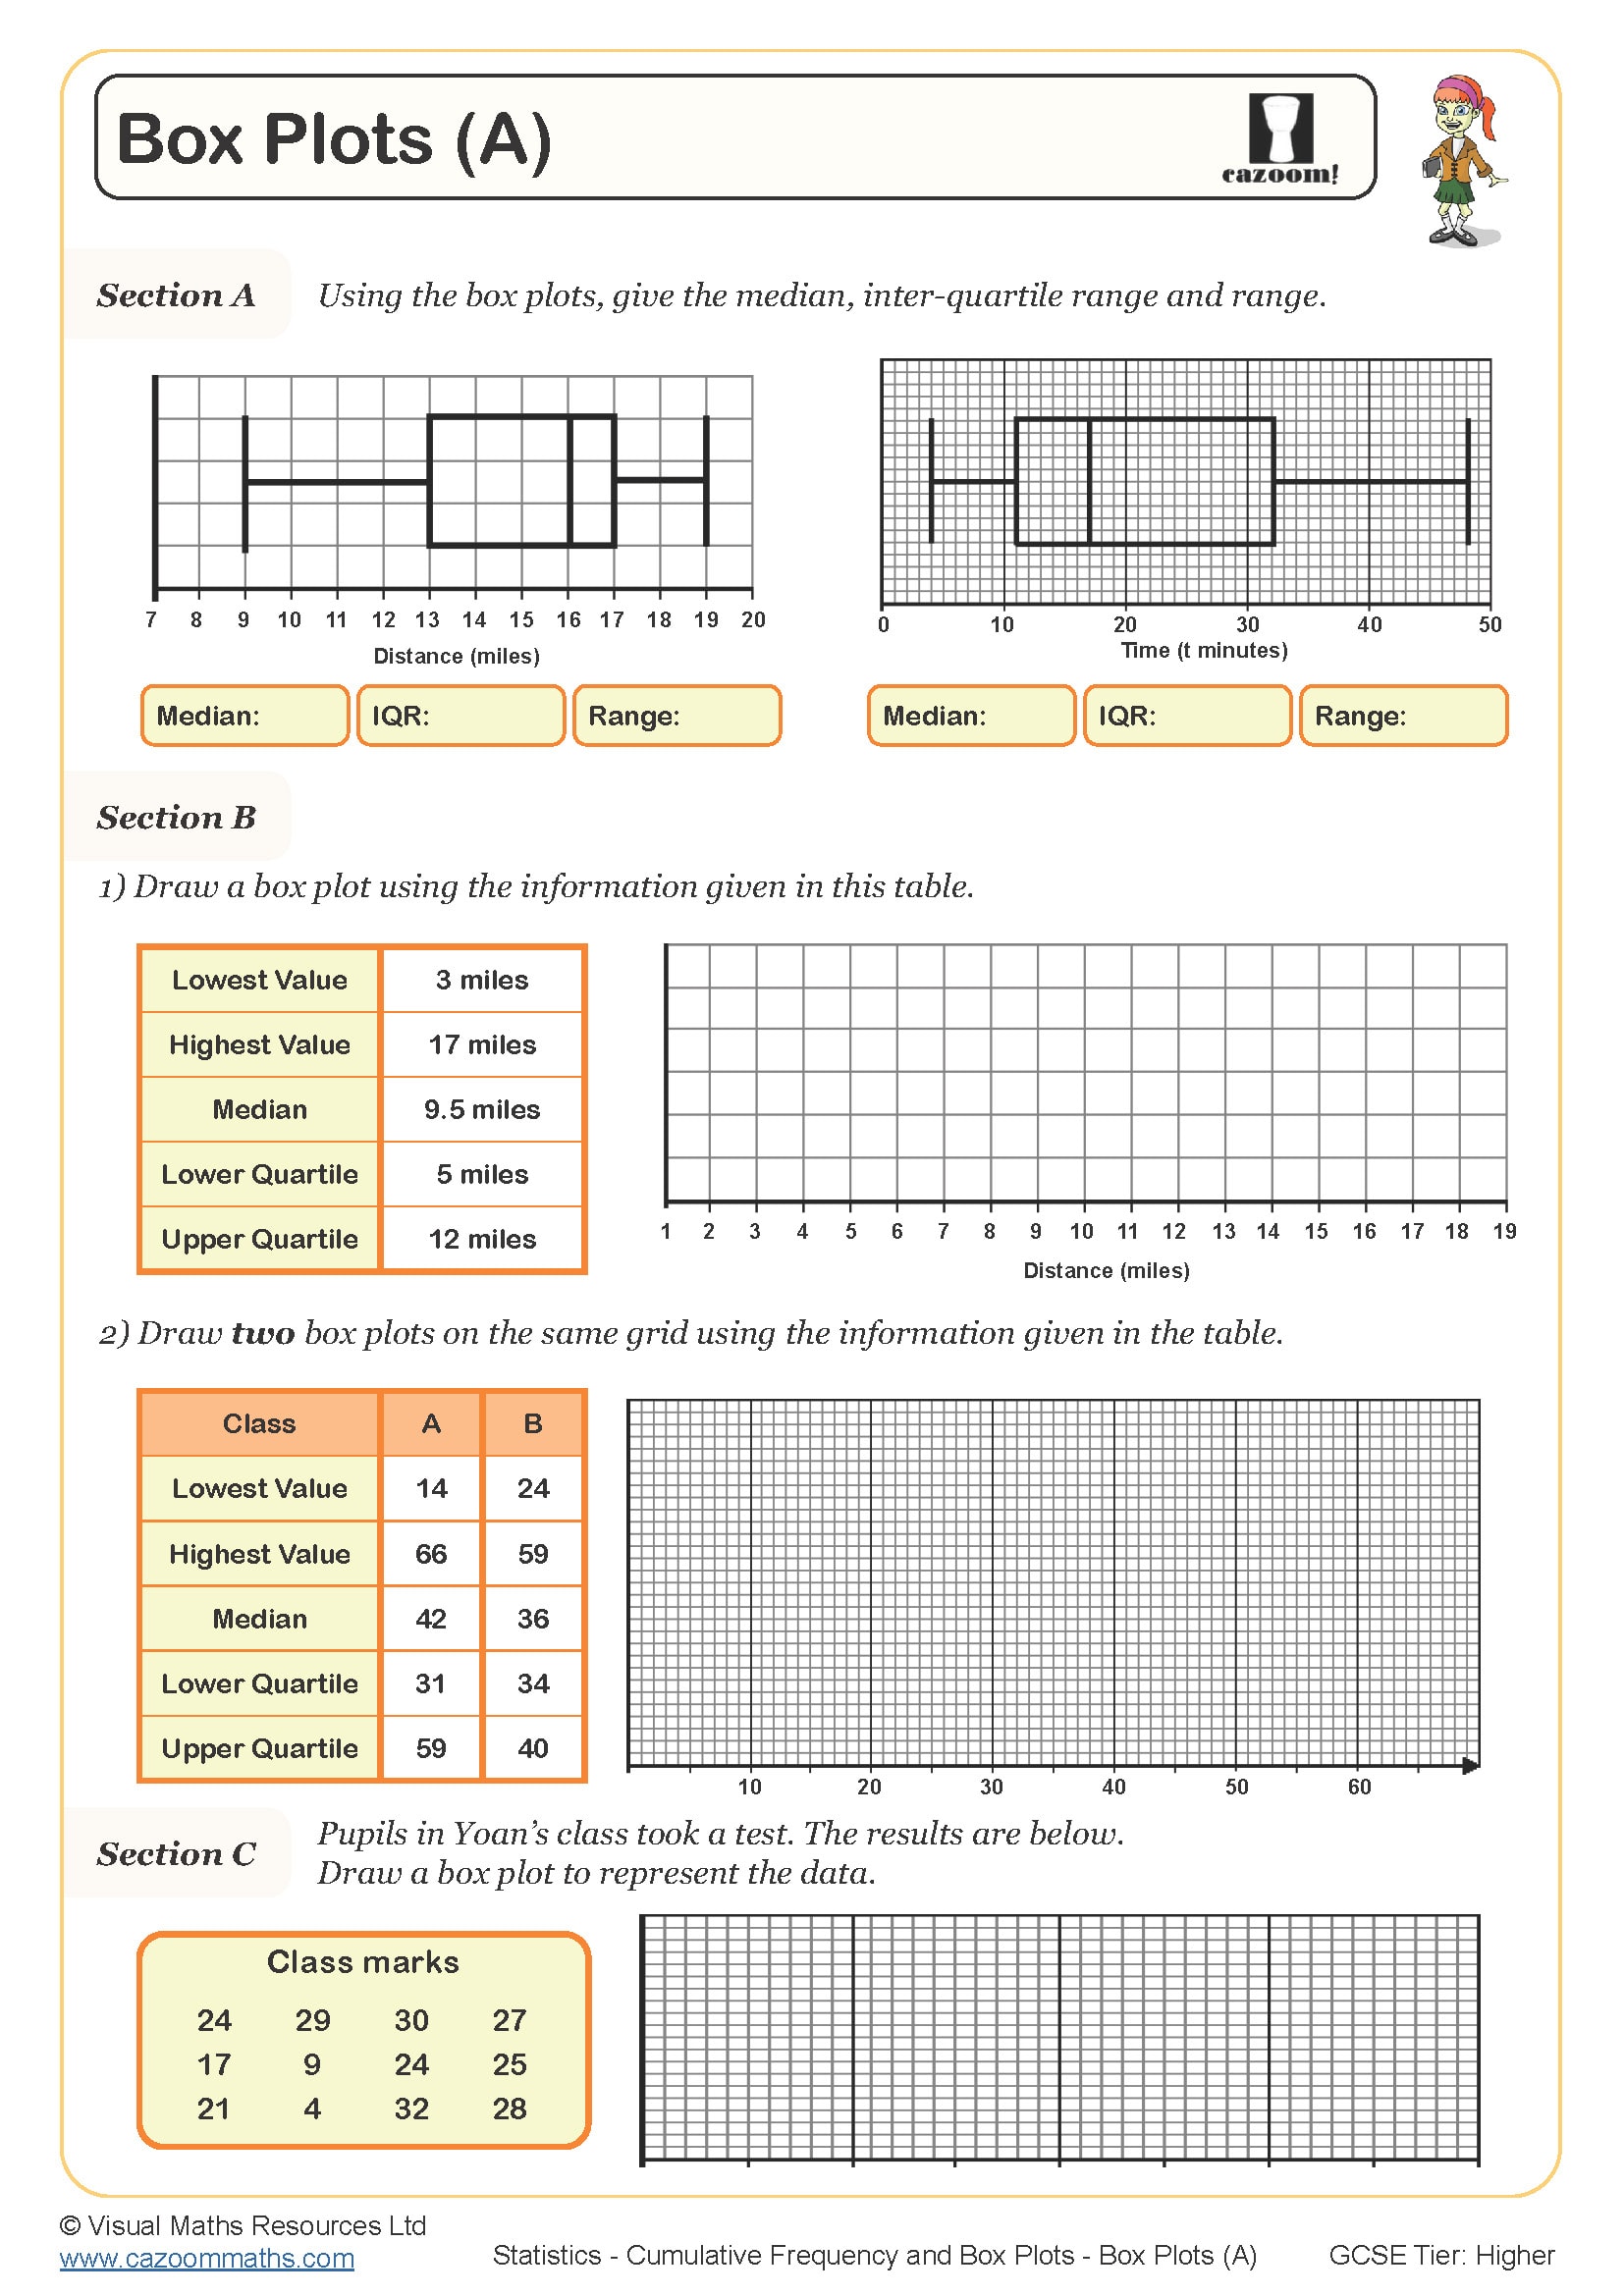
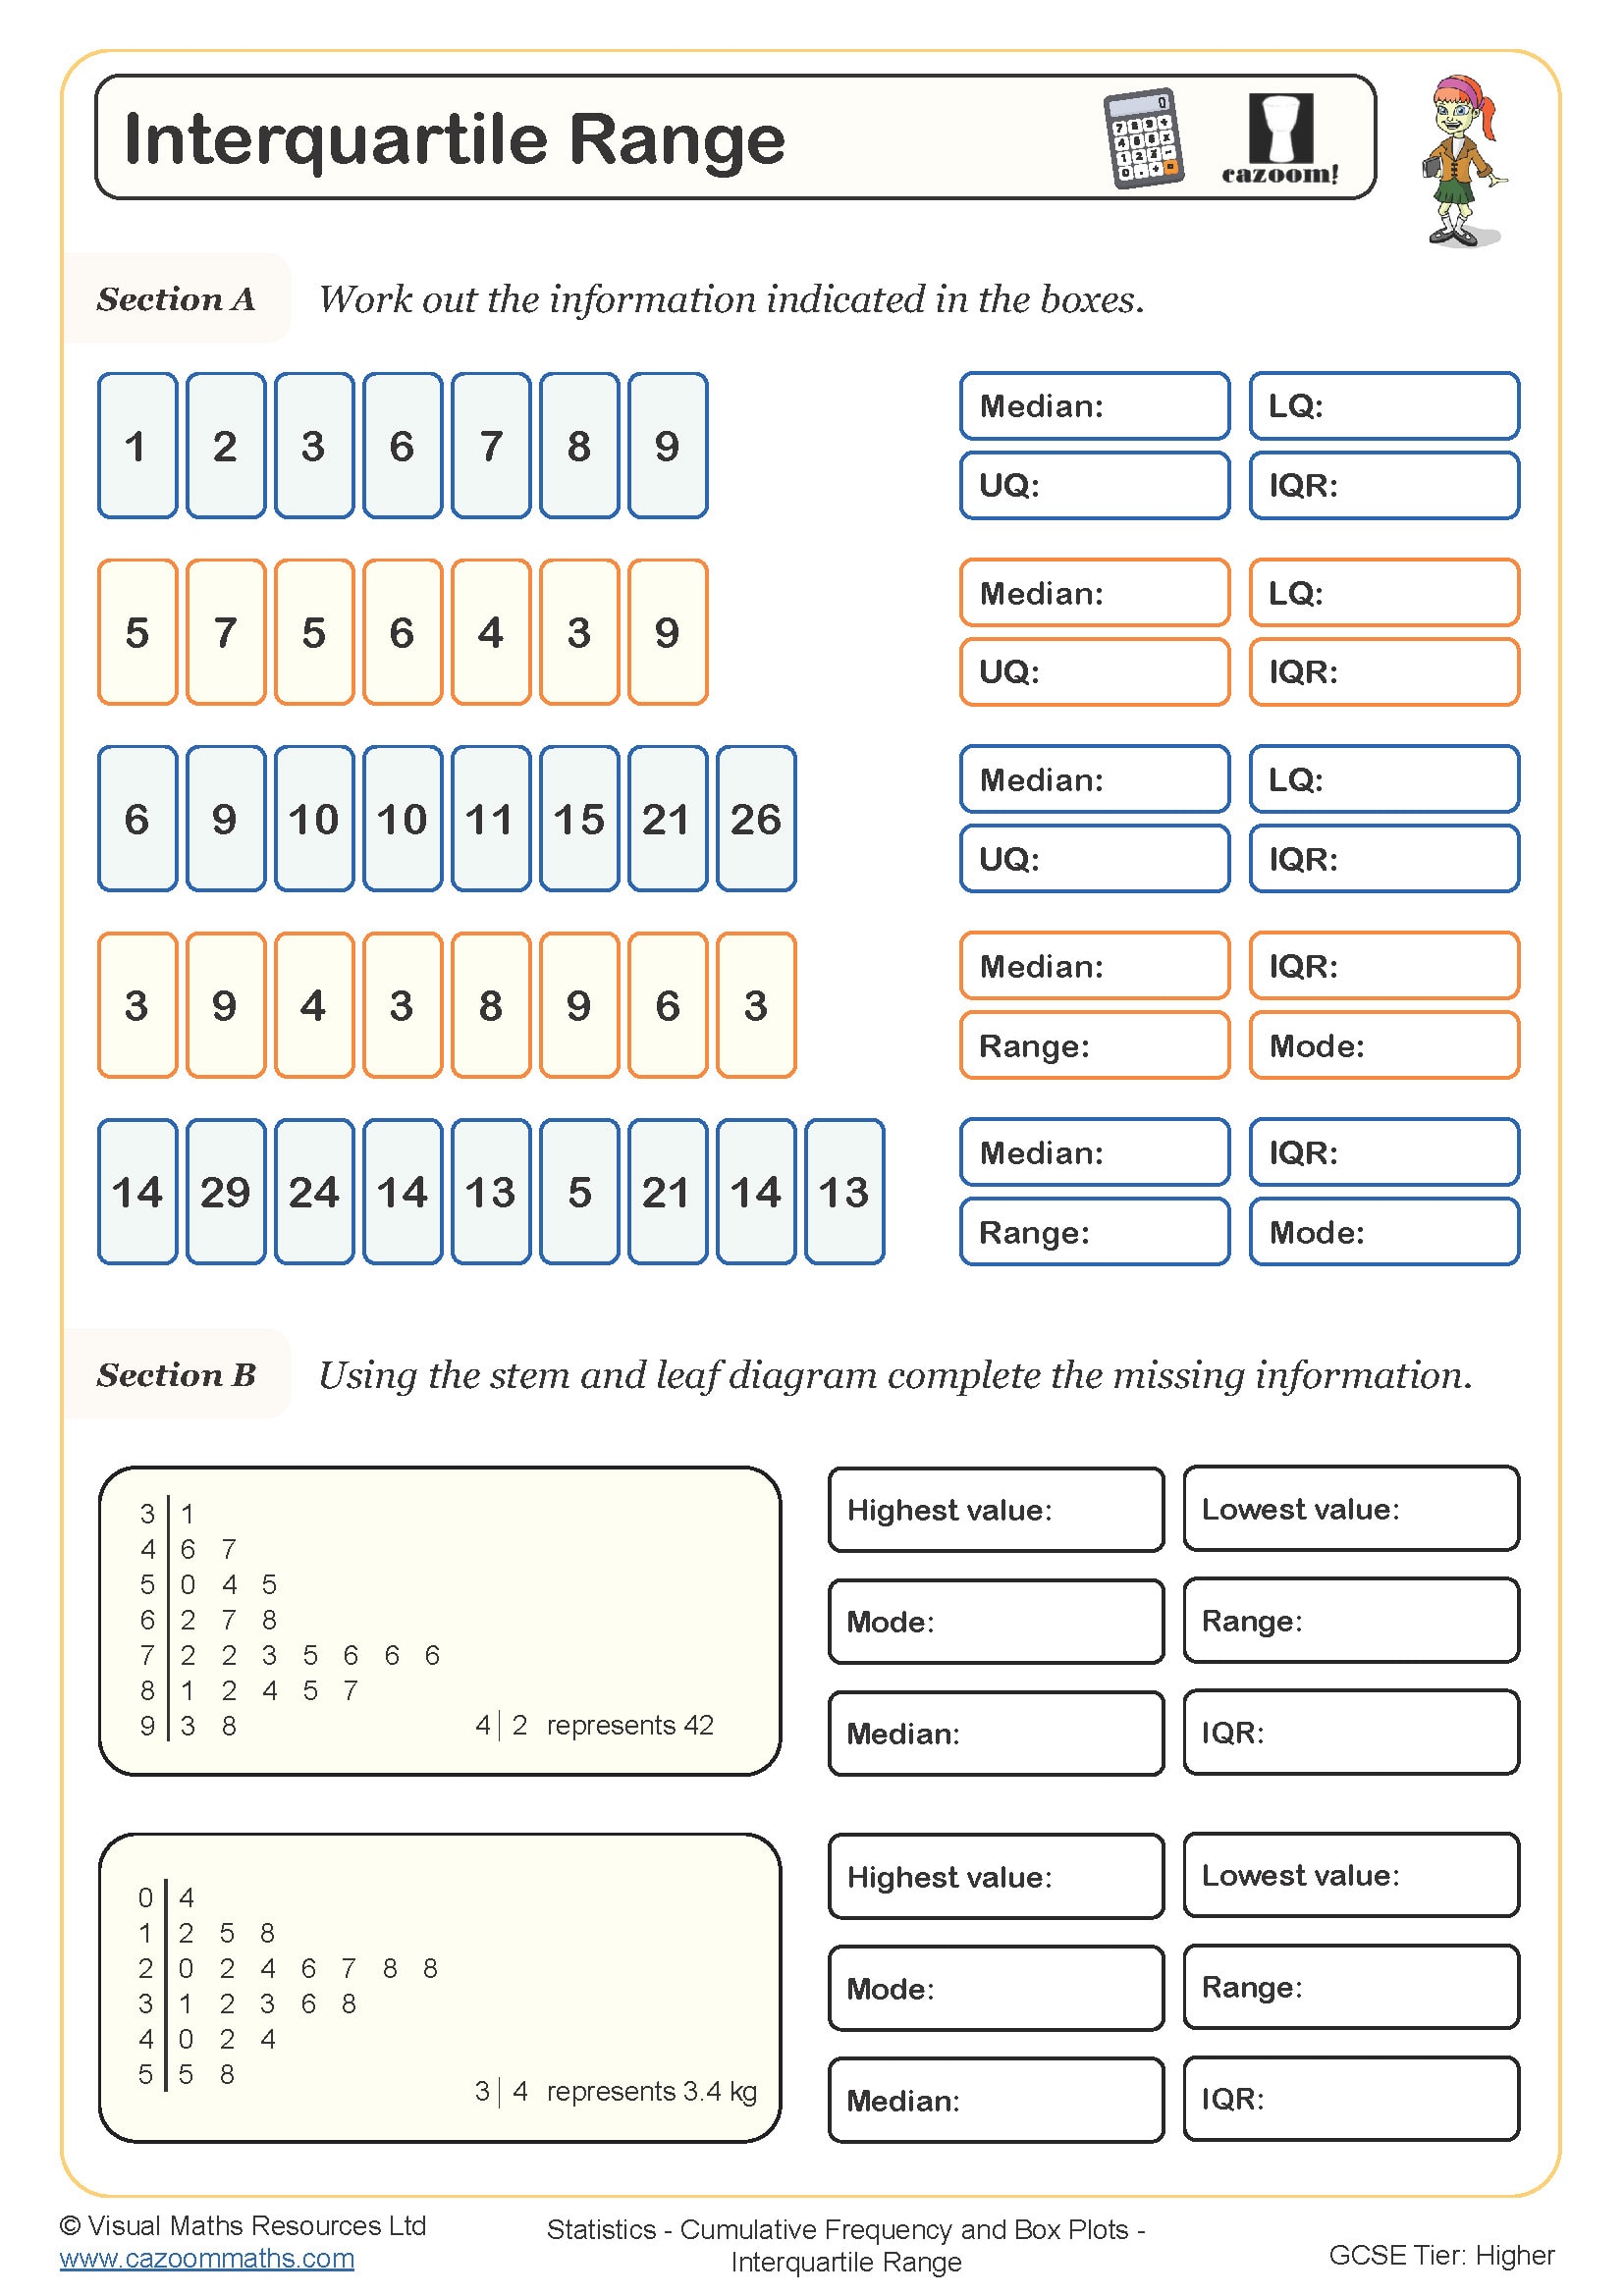
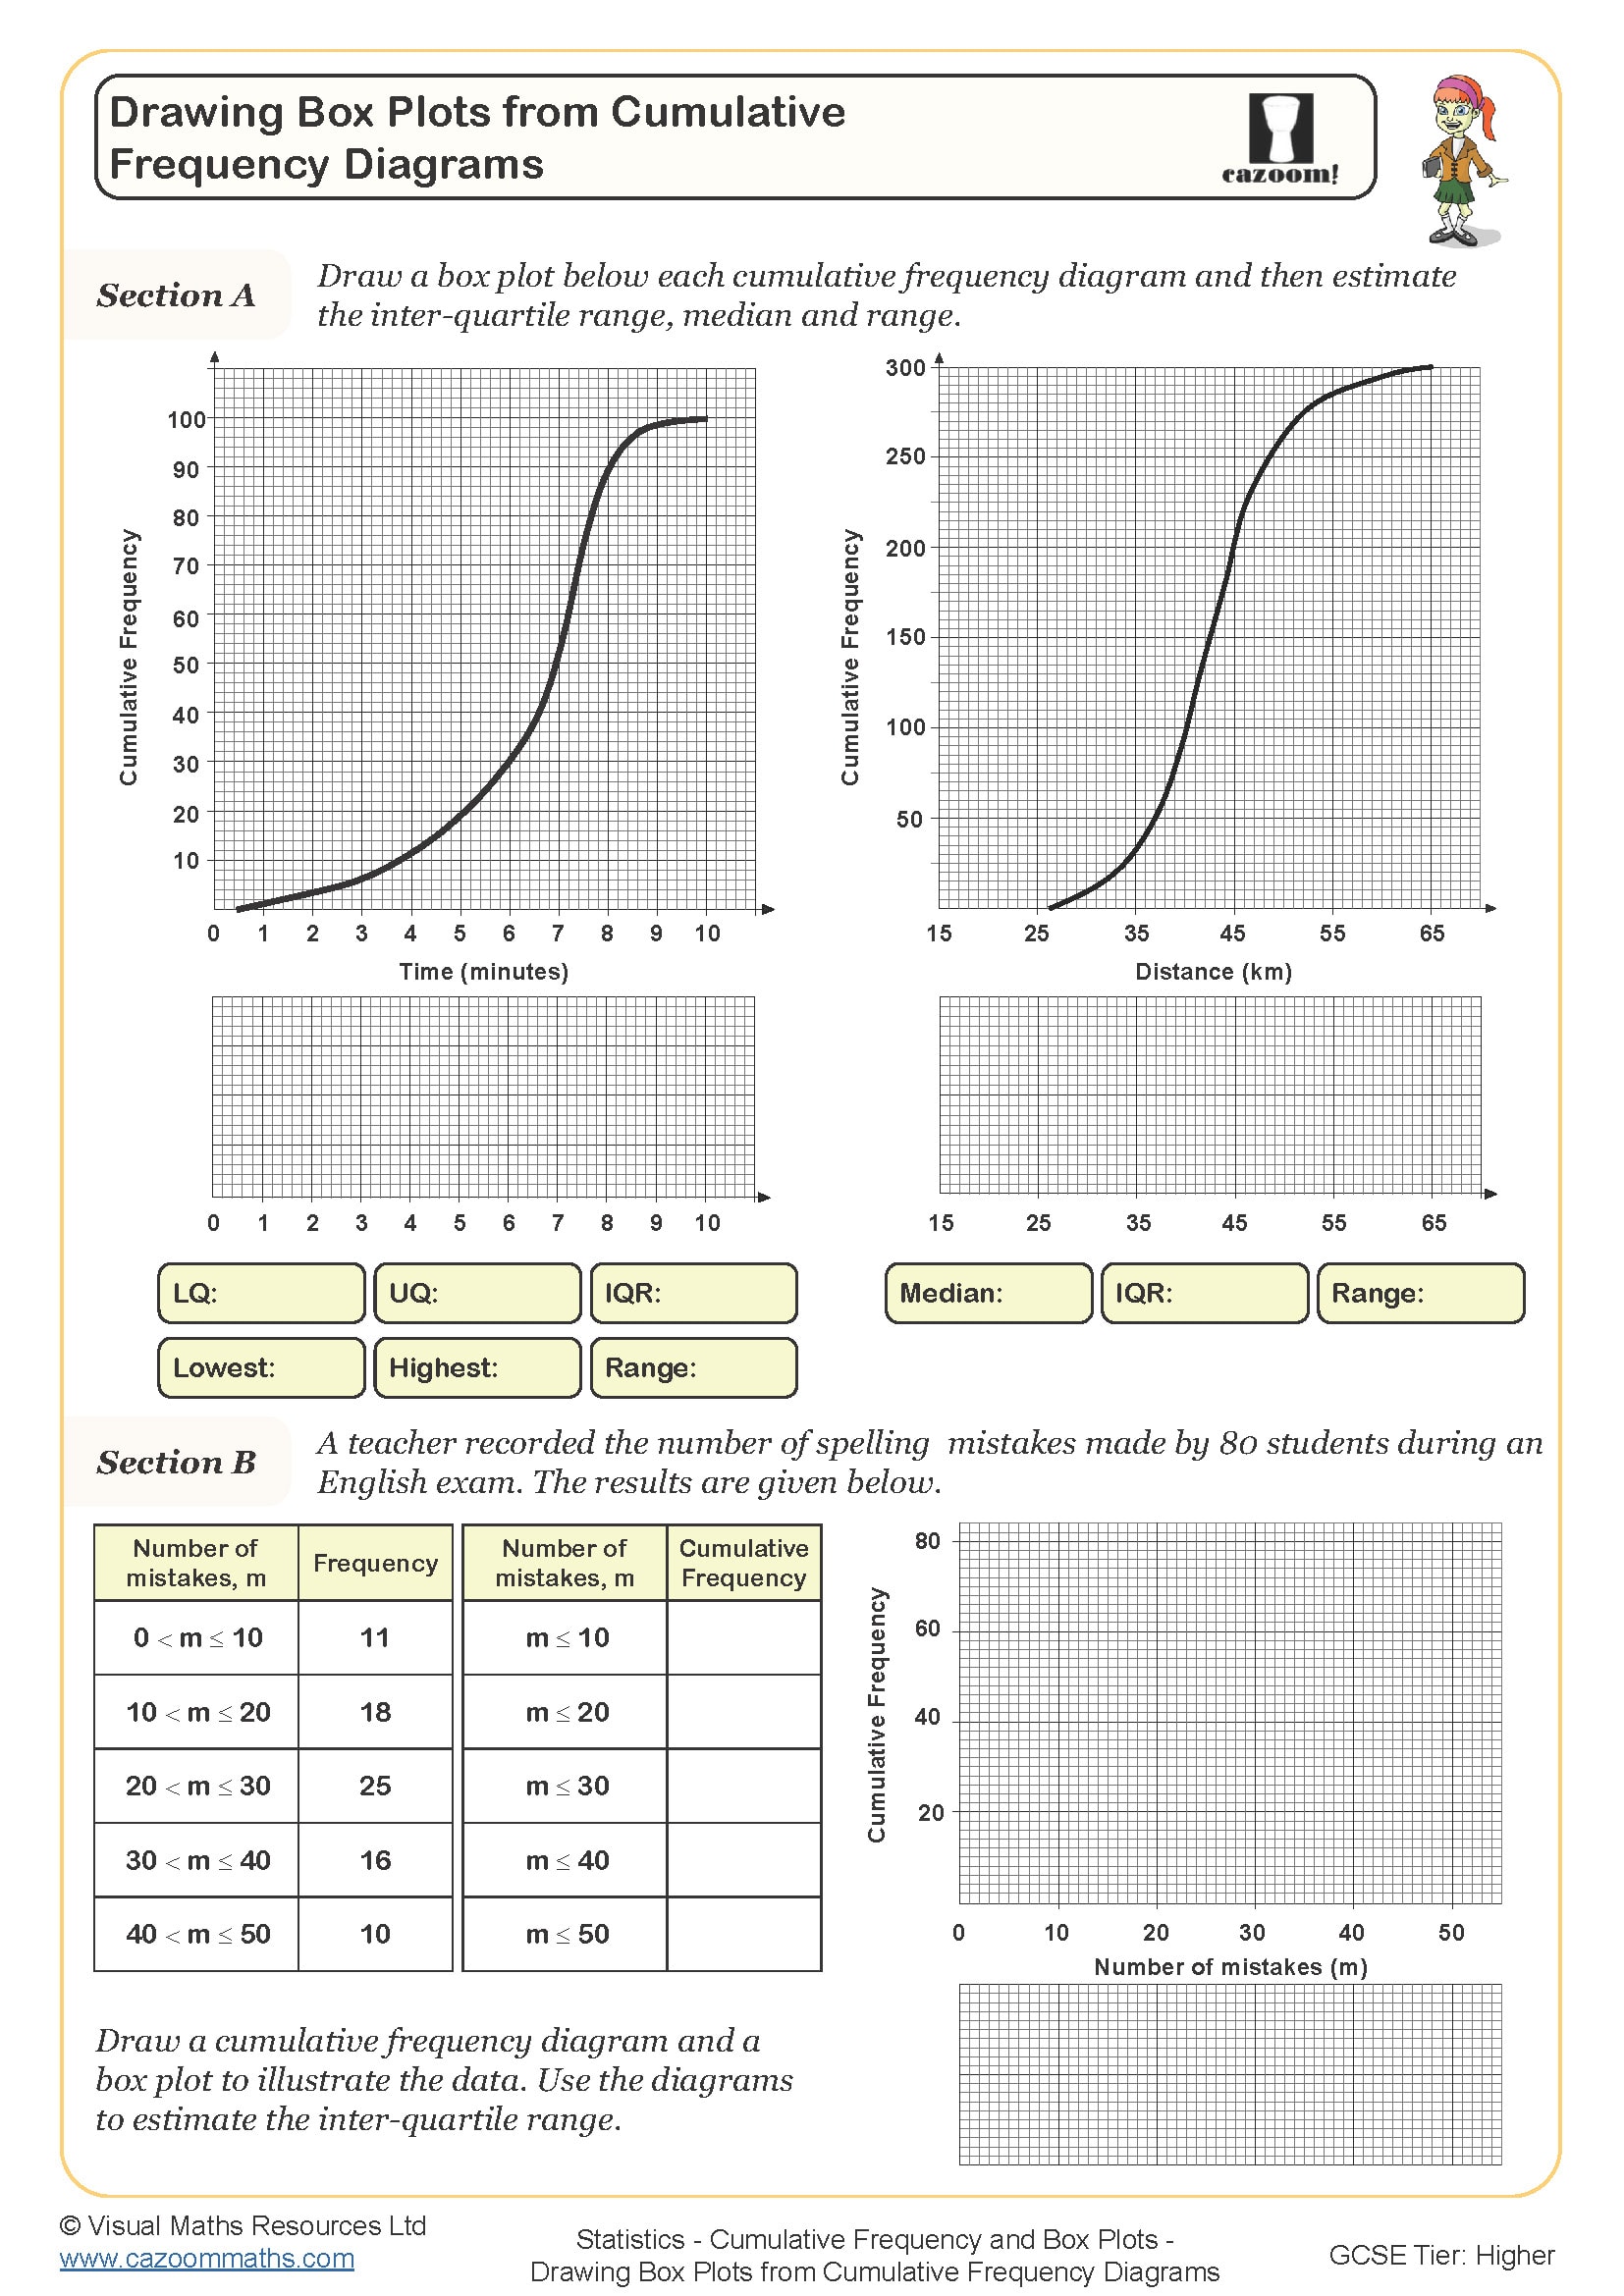
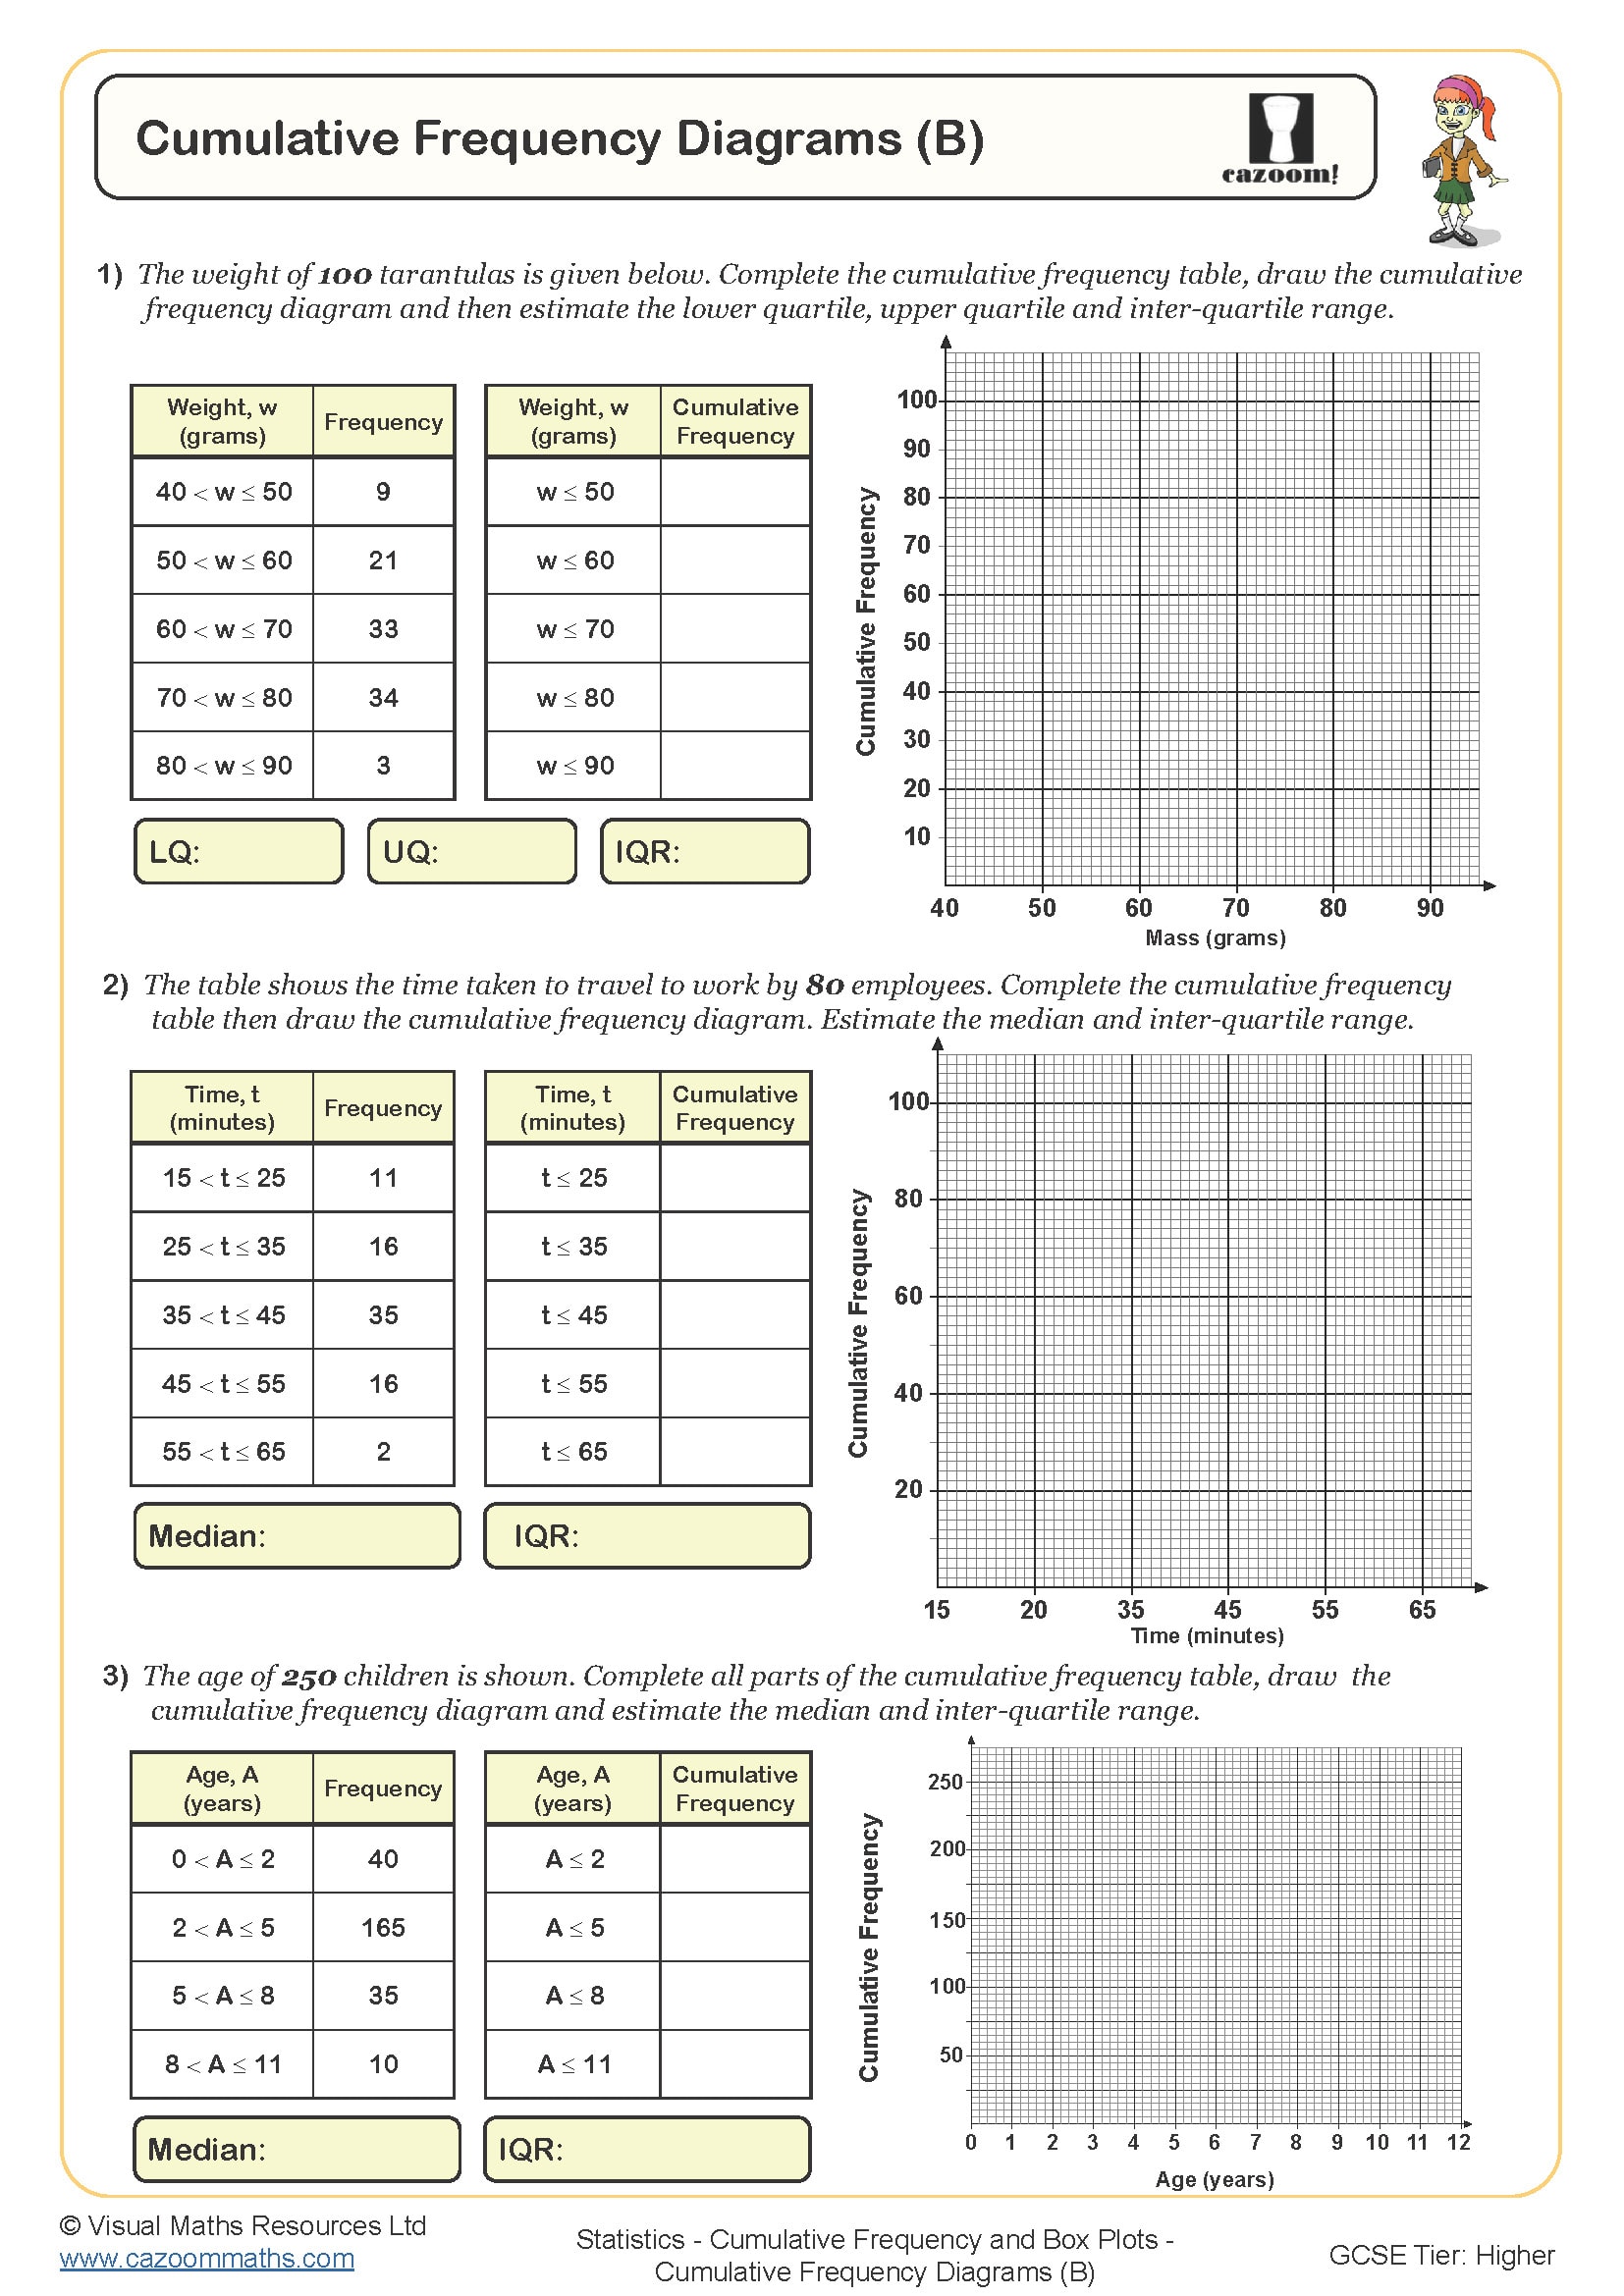
This worksheet is designed to give learners practice in plotting cumulative frequency diagrams. Three frequency tables are provided with an empty cumulative frequency column. Next to each table in a labelled axes for learners to plot the cumulative frequency curve.
All worksheets are created by the team of experienced teachers at Cazoom Maths.
 Worksheet")
RELATED TO Cumulative Frequency Diagrams (A) WORKSHEET
Frequently Asked Questions
Students should be comfortable working with grouped frequency distributions and plotting coordinates before tackling cumulative frequency diagrams. These foundational skills are essential because learners will need to calculate cumulative totals from frequency data and then accurately plot these values as coordinate points. Without a solid grasp of these prerequisites, students may struggle with both the computational and graphical aspects of the task.