Draw Time Series Graphs WORKSHEET
Draw Time Series Graphs WORKSHEET DESCRIPTION
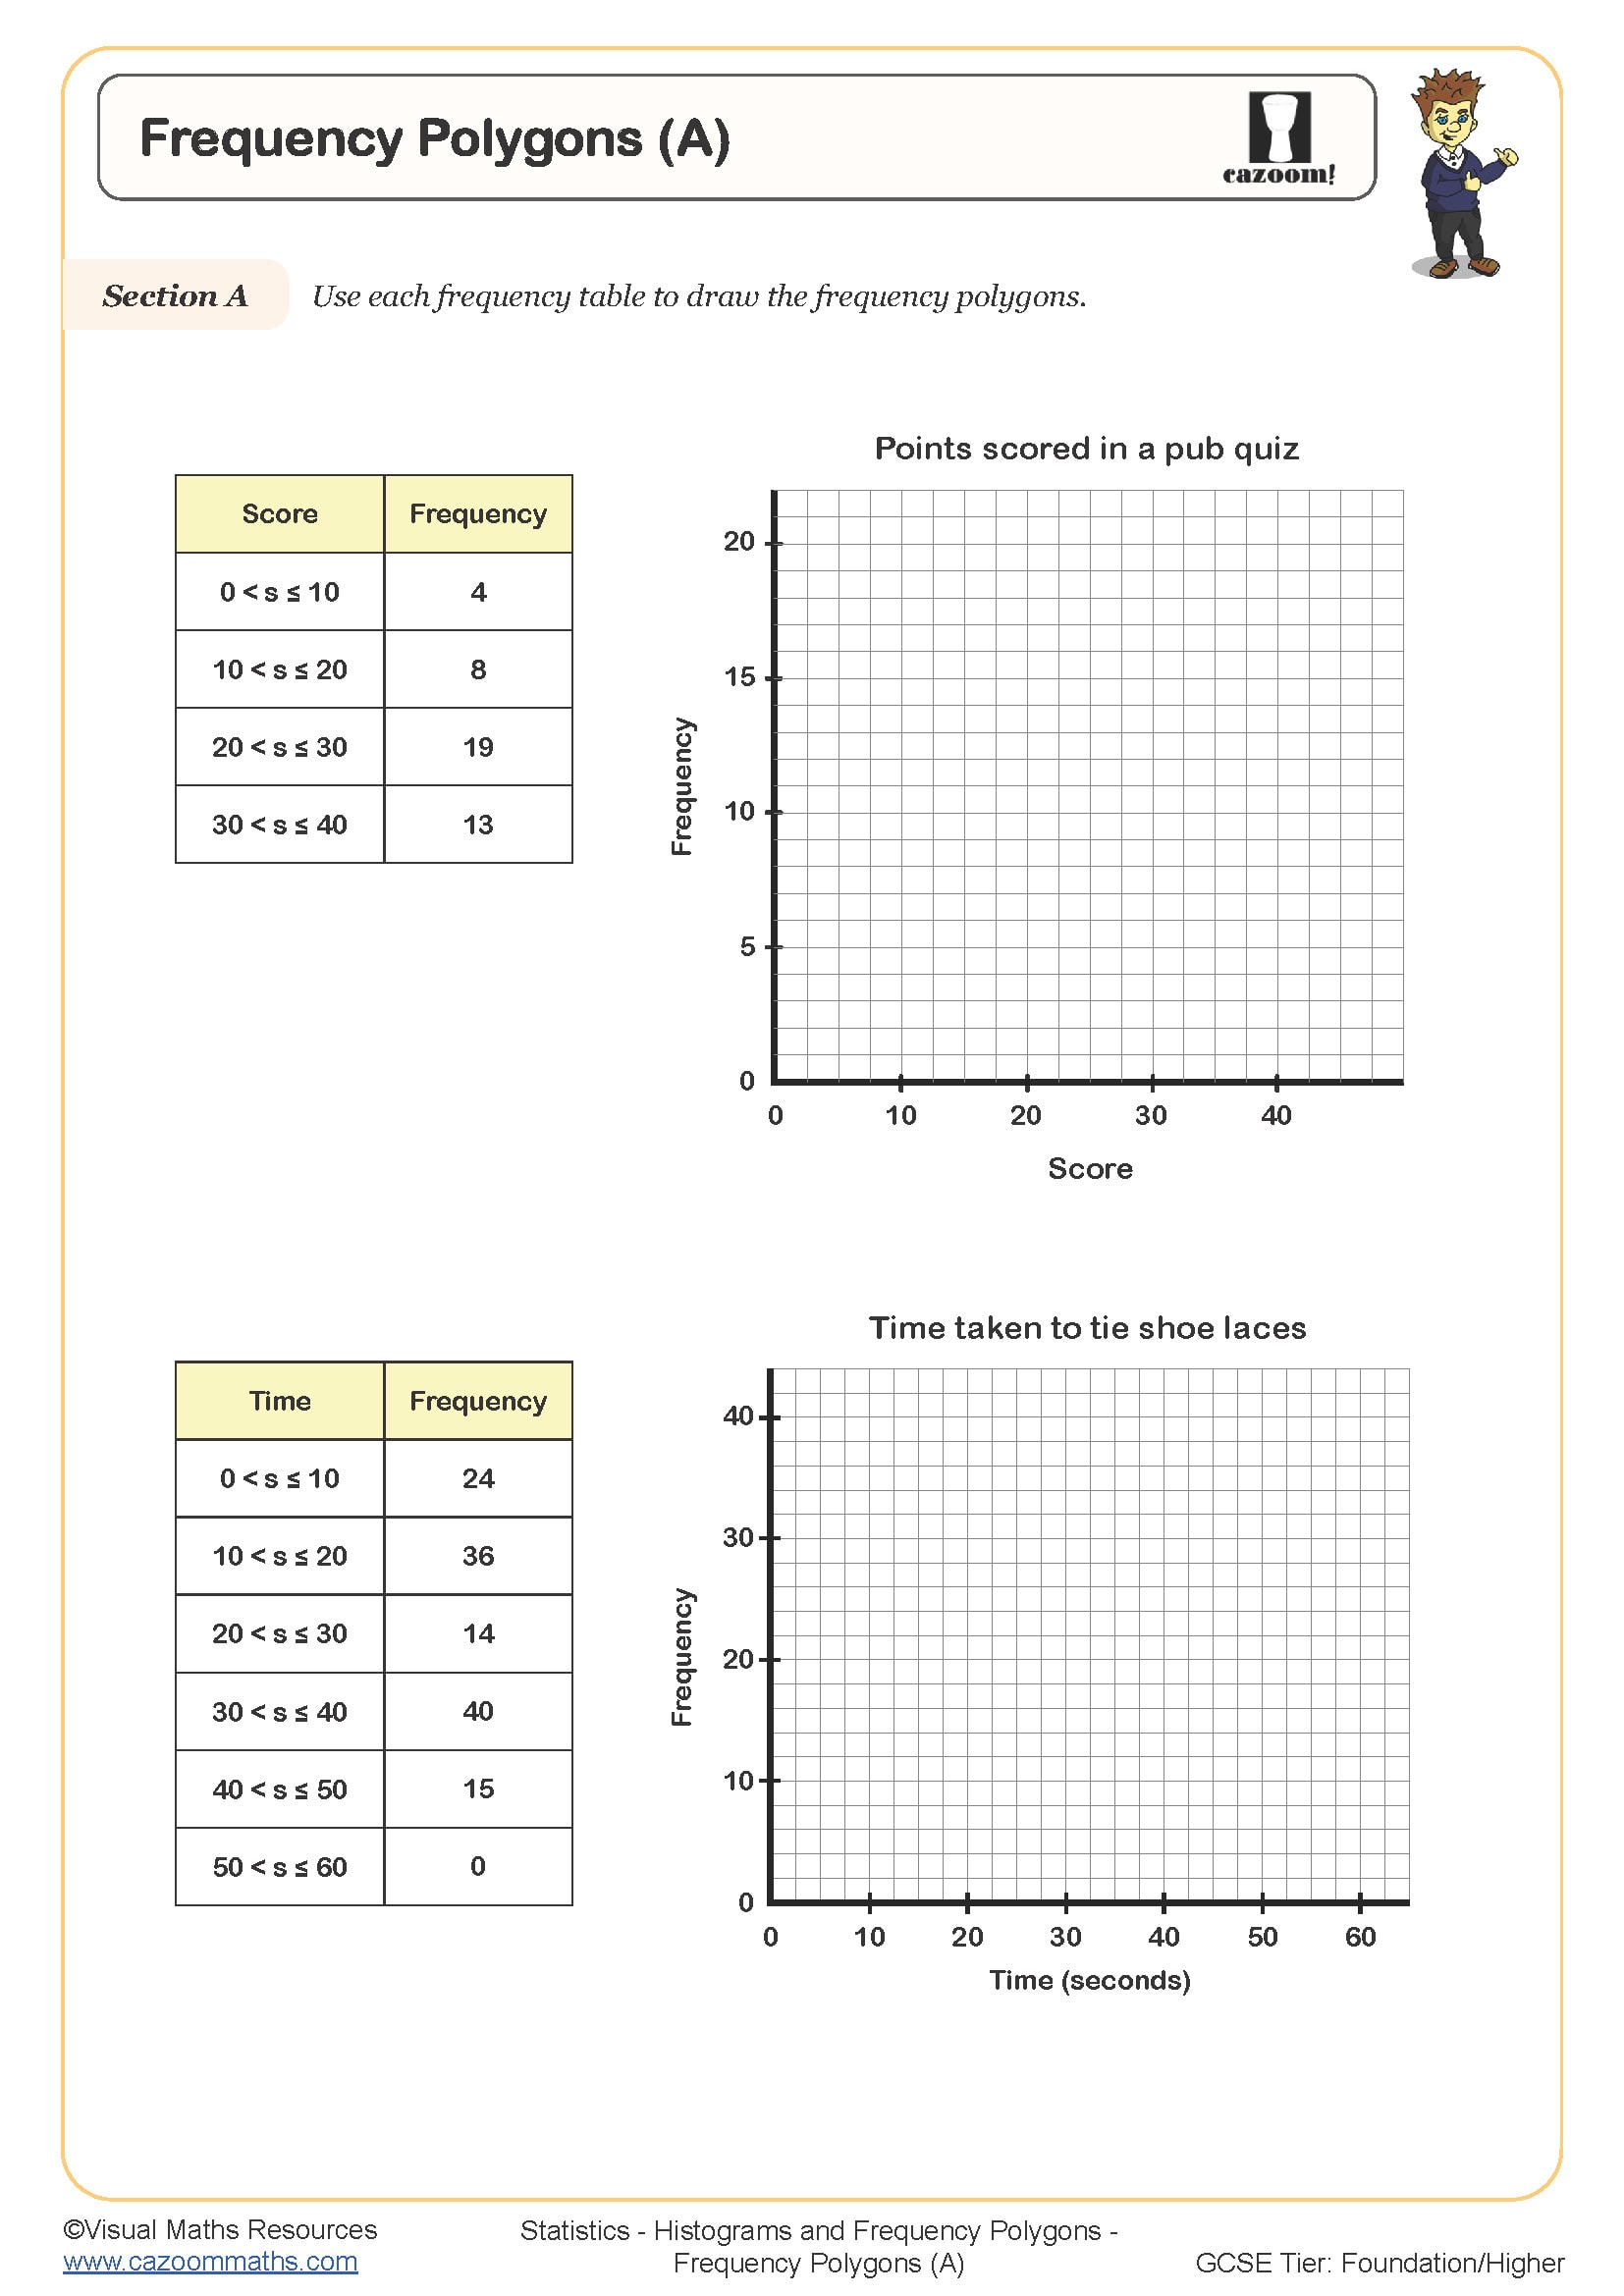
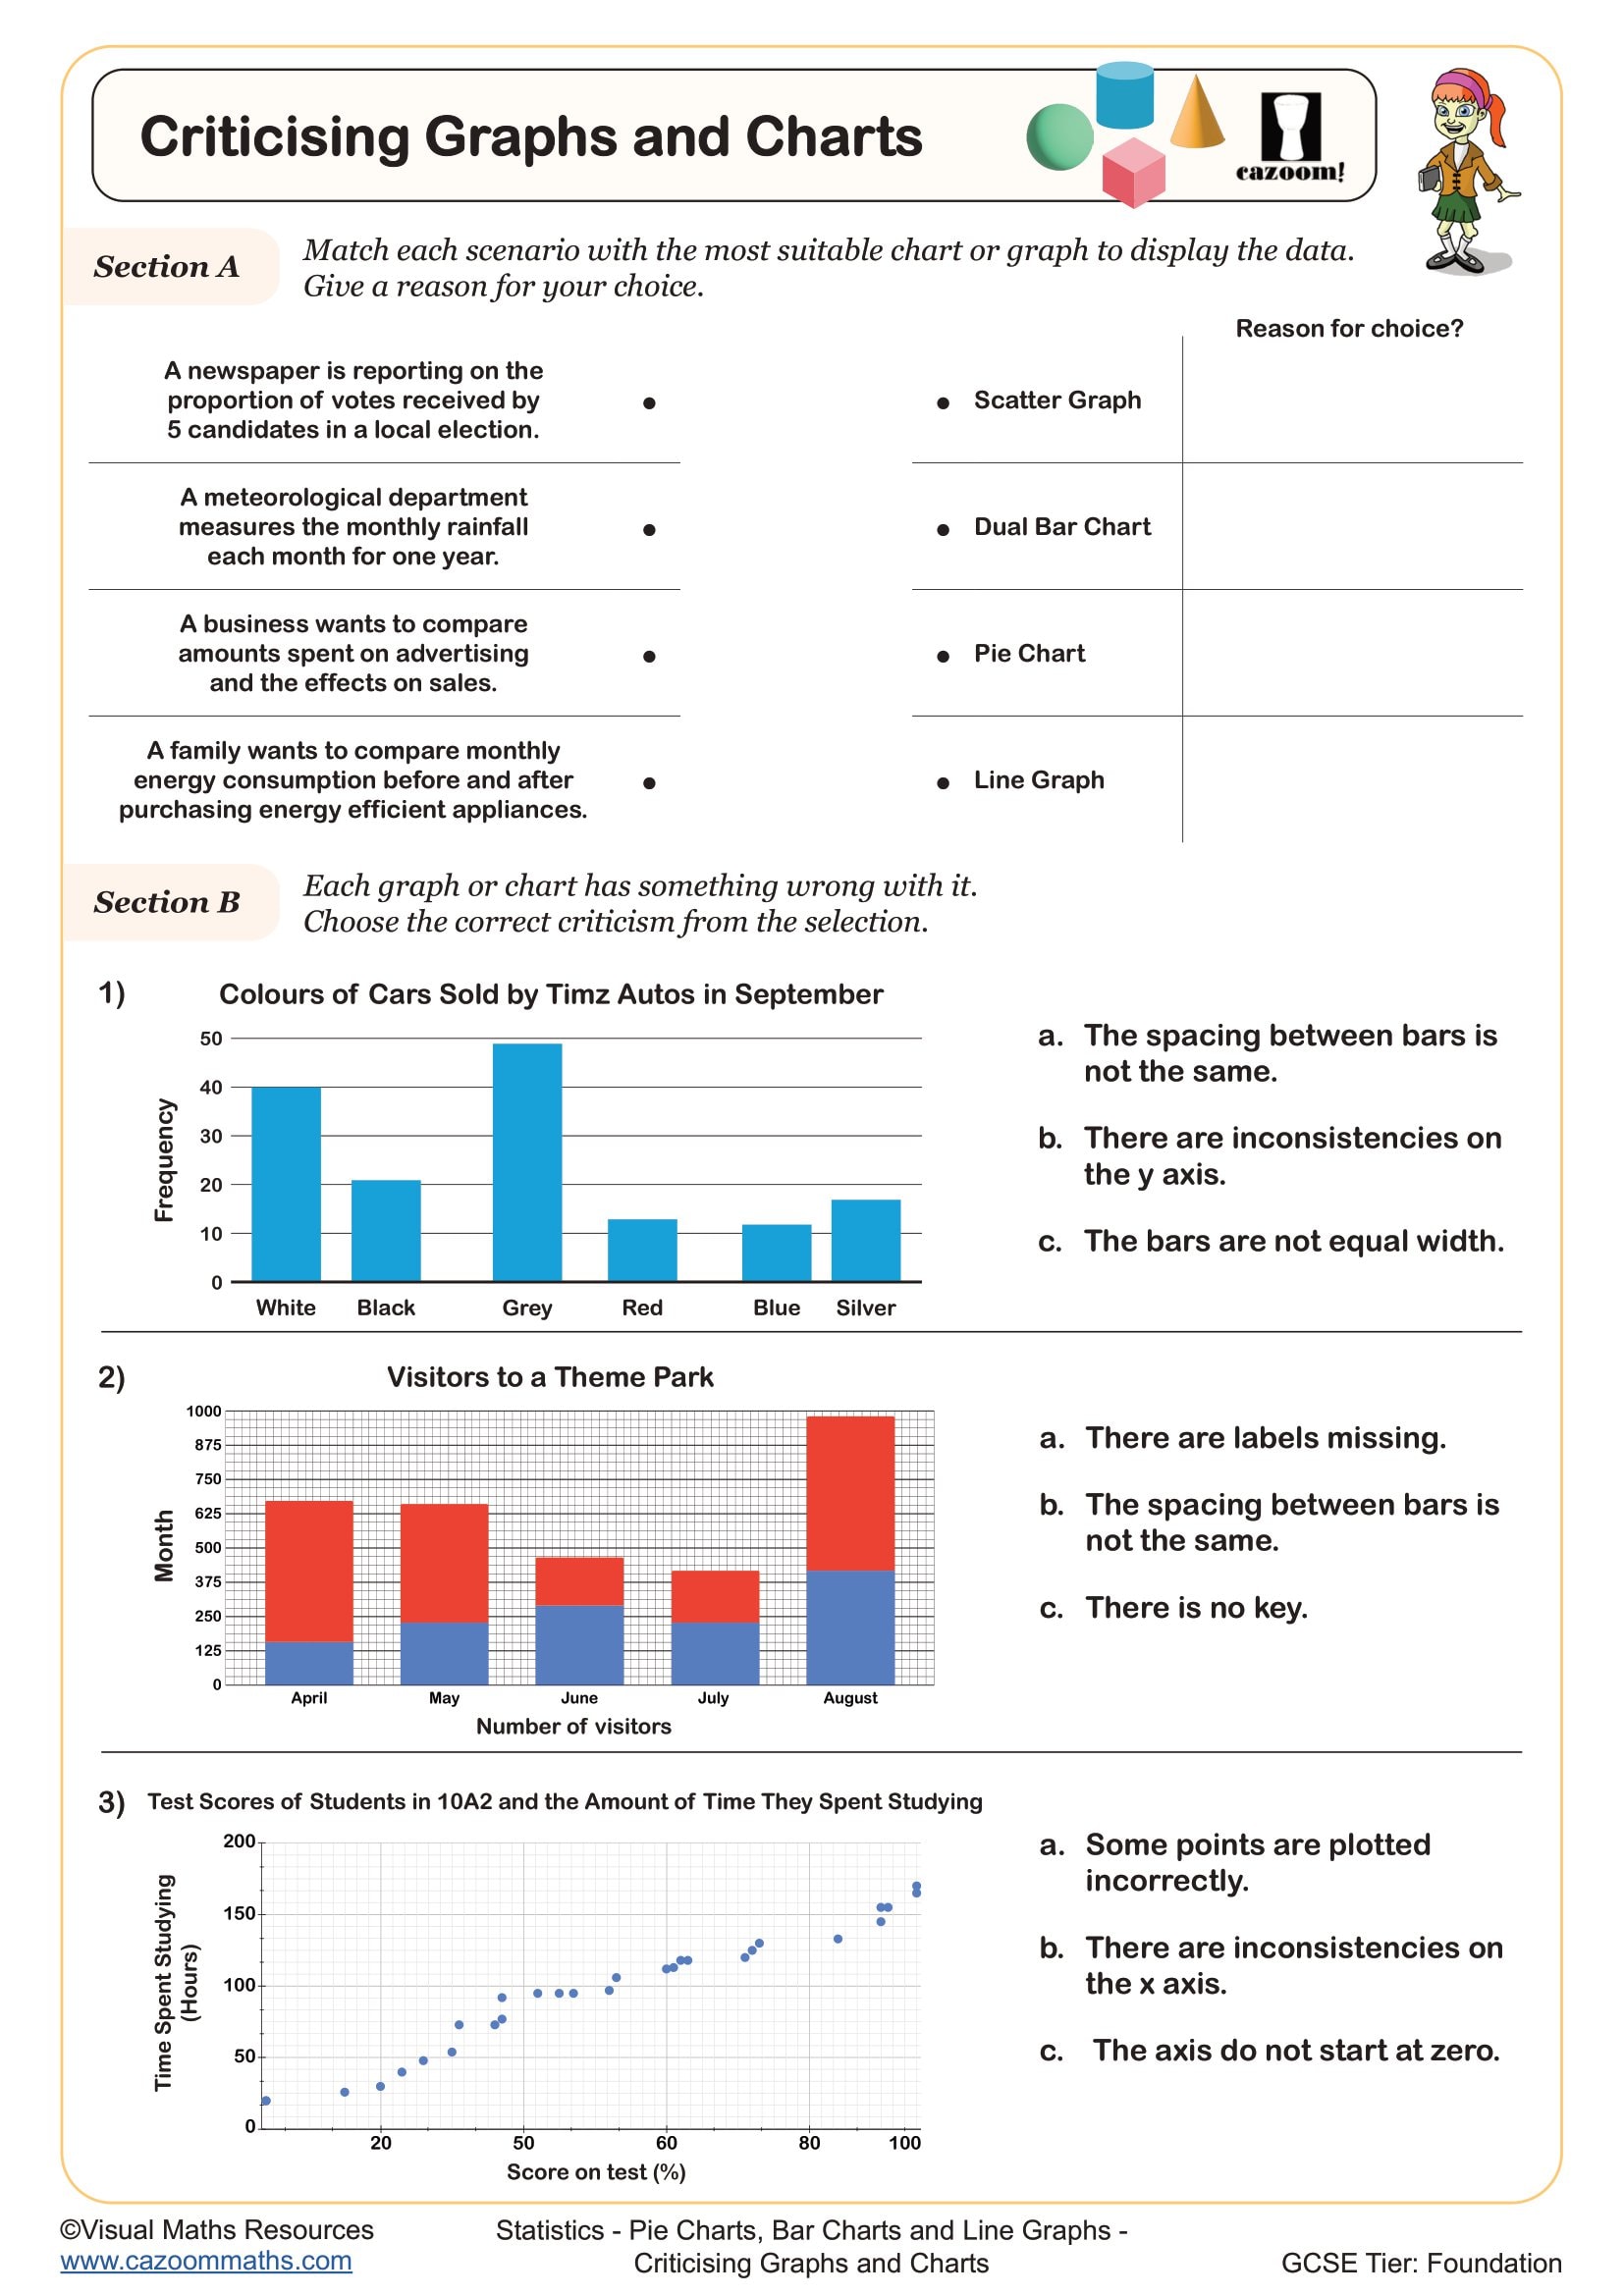
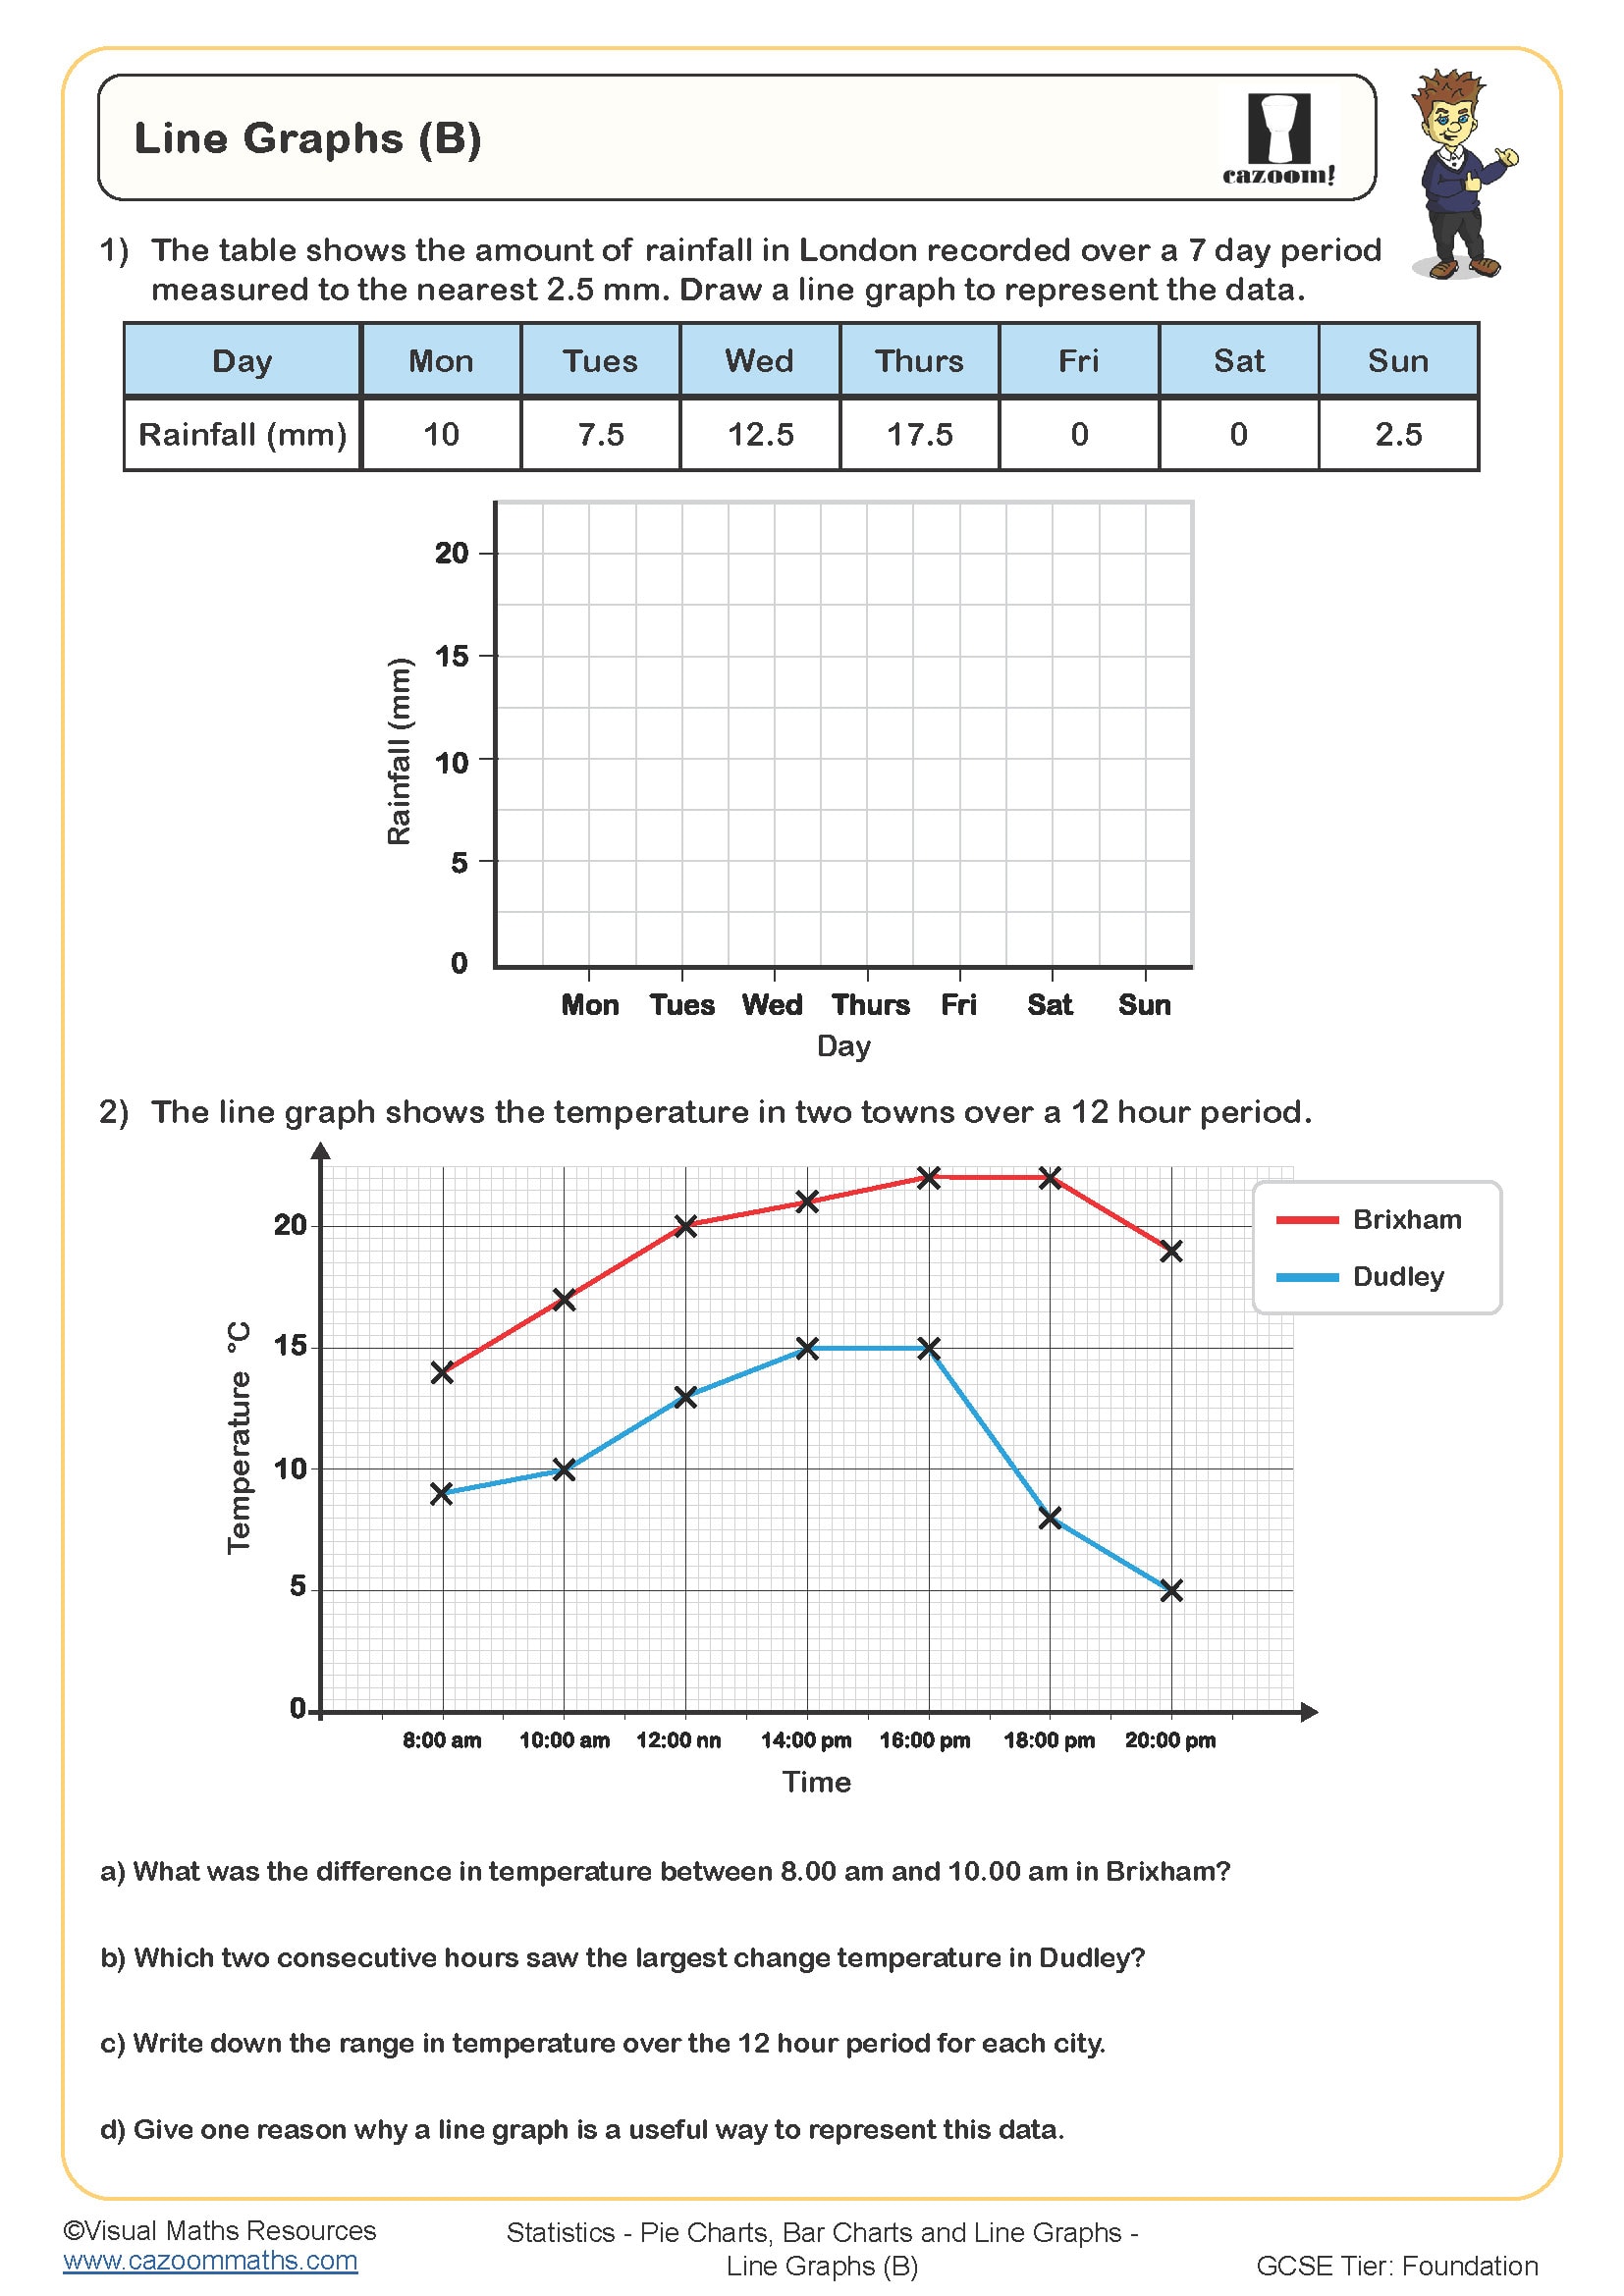
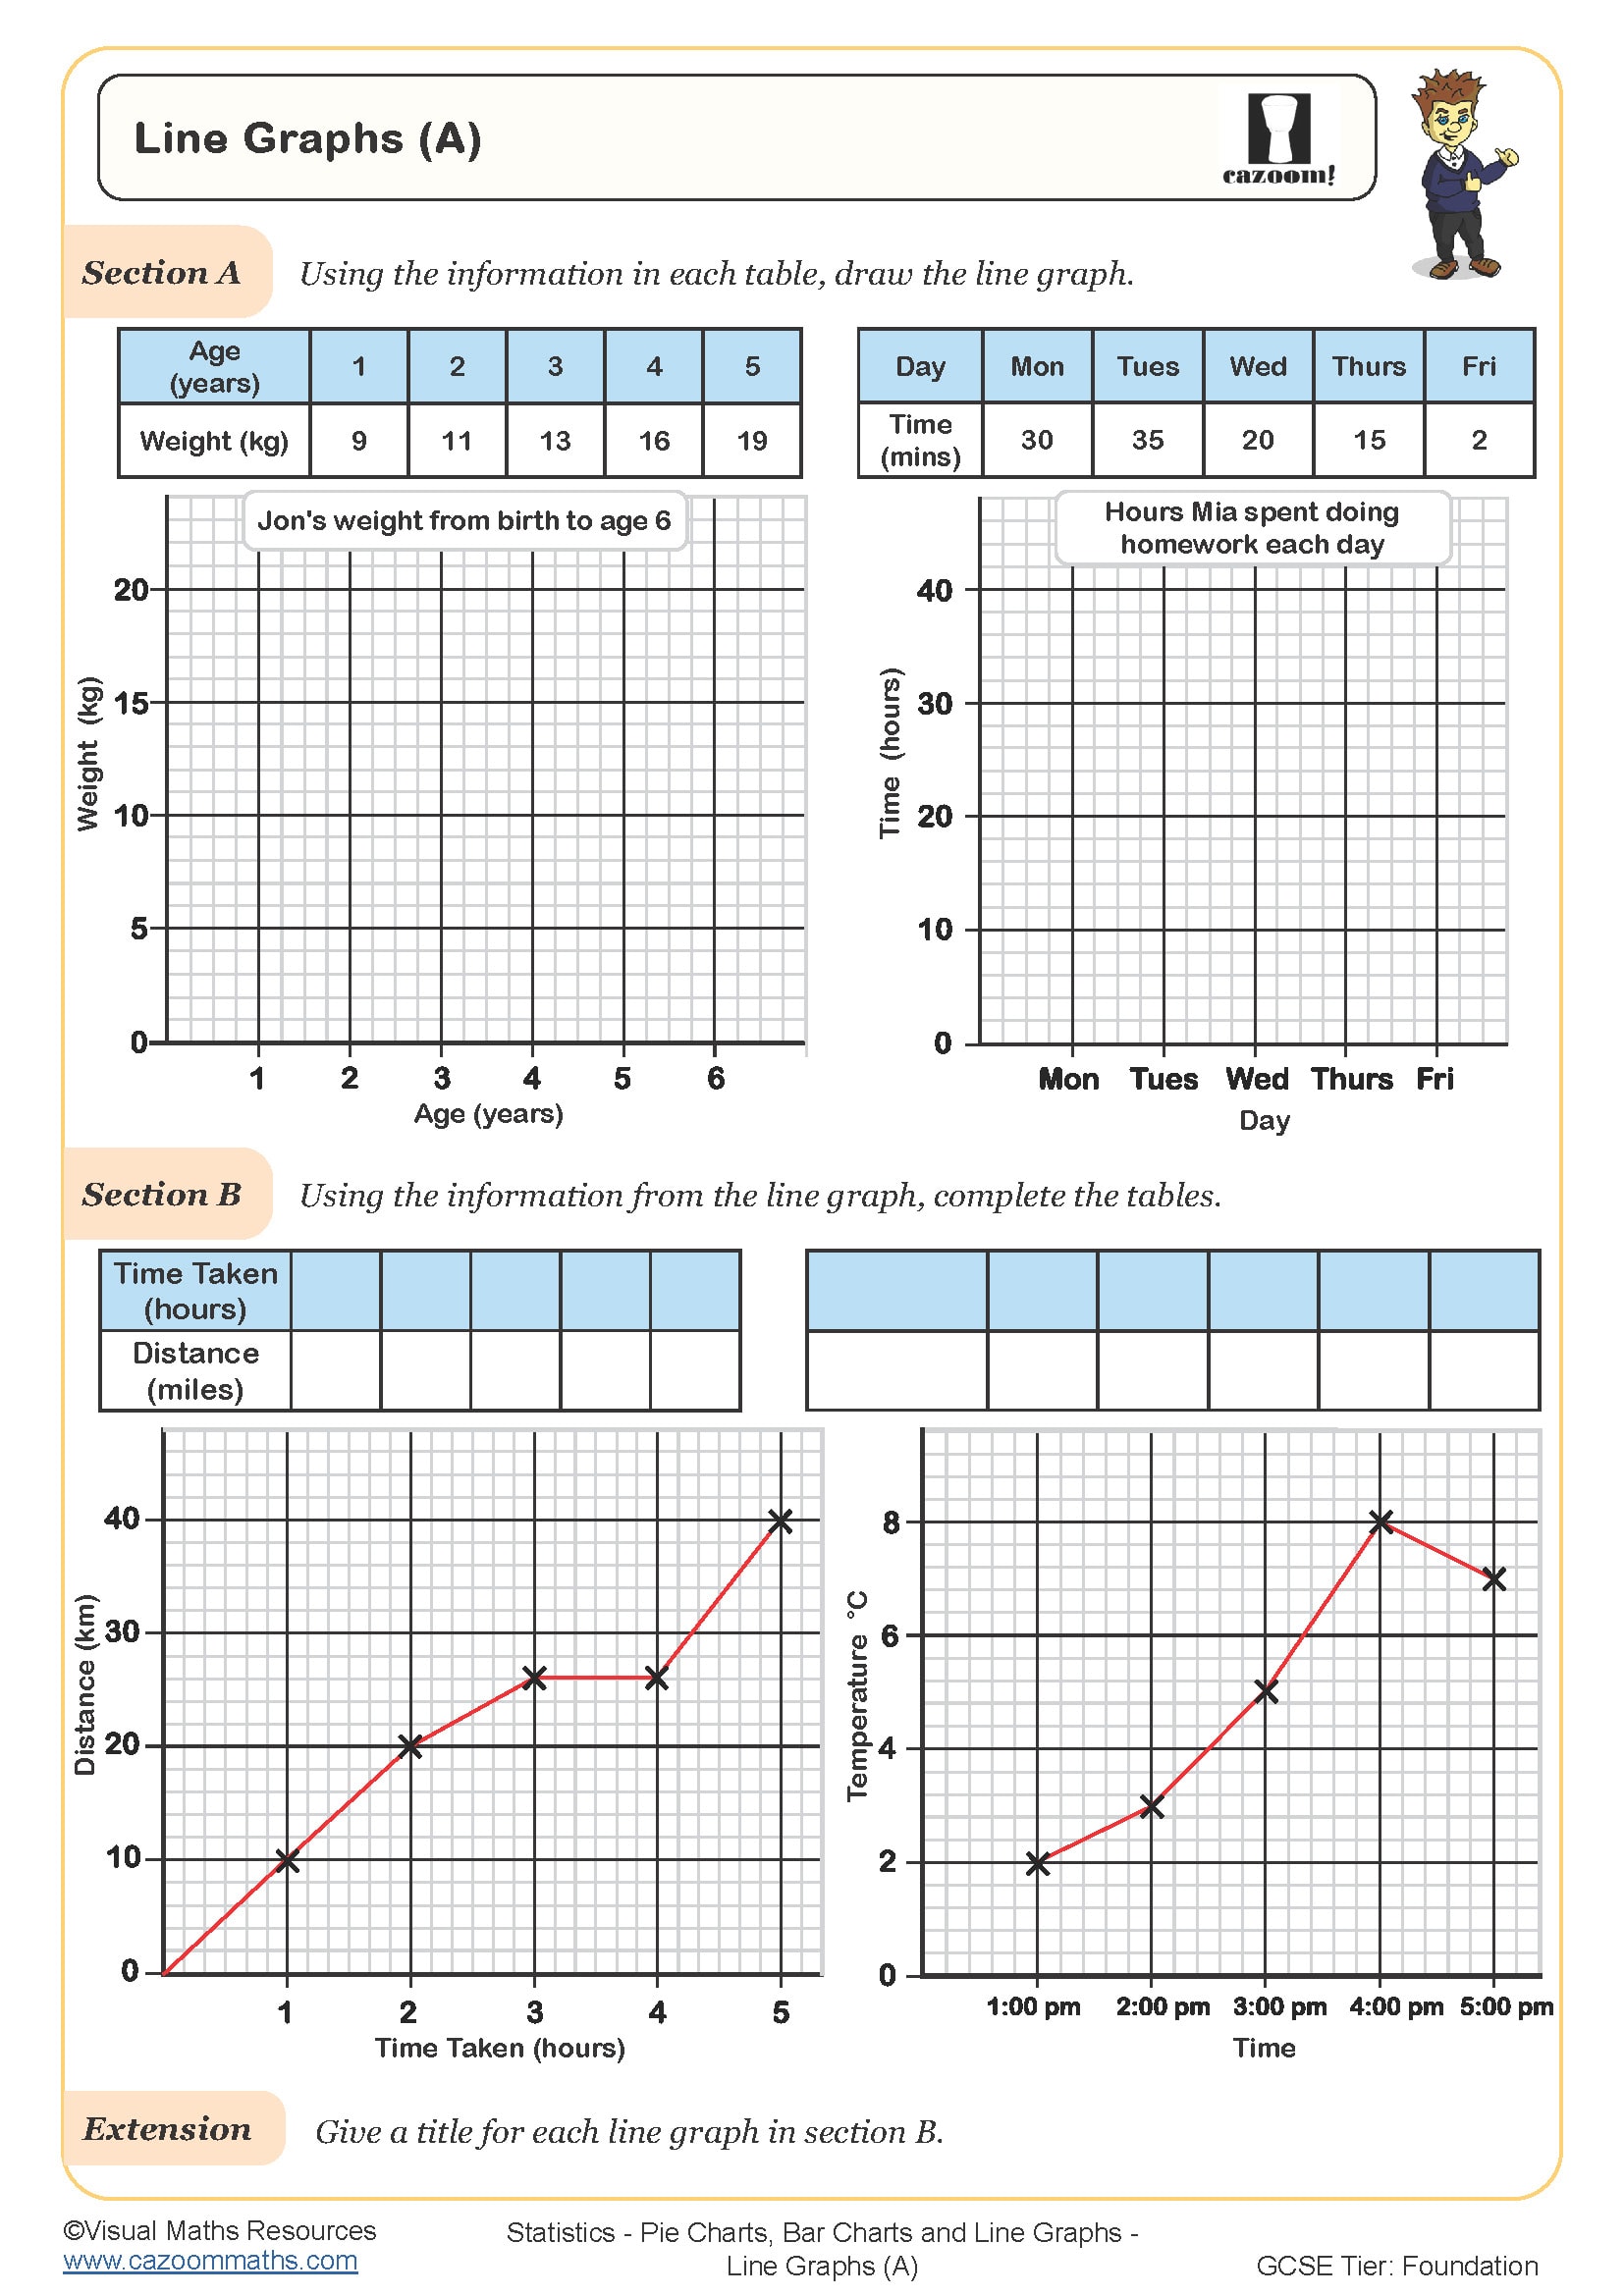
This worksheet focuses on developing students' ability to draw and interpret time series graphs.
The first question requires students to select the most suitable time series graph that accurately represents the data provided in a table. They must then justify their choice by explaining the reasoning behind their decision.
Over the remaining questions learners will complete a time series graph, draw their own, including labelling the axes too, and look for errors in a time series graph.
This worksheet provides a comprehensive introduction to drawing and interpreting time series graphs while offering opportunities for critical analysis and applied skills.
All worksheets are created by the team of experienced teachers at Cazoom Maths.

RELATED TO Draw Time Series Graphs WORKSHEET
Frequently Asked Questions
Students should already be comfortable with drawing line graphs before tackling this resource. This foundational skill will help them focus on the specific techniques needed for time series data rather than struggling with basic graph construction. The worksheet builds naturally on this prerequisite knowledge to develop more advanced interpretation and analysis skills.