Drawing Bar Charts from Frequency Tables (A) WORKSHEET
Drawing Bar Charts from Frequency Tables (A) WORKSHEET DESCRIPTION
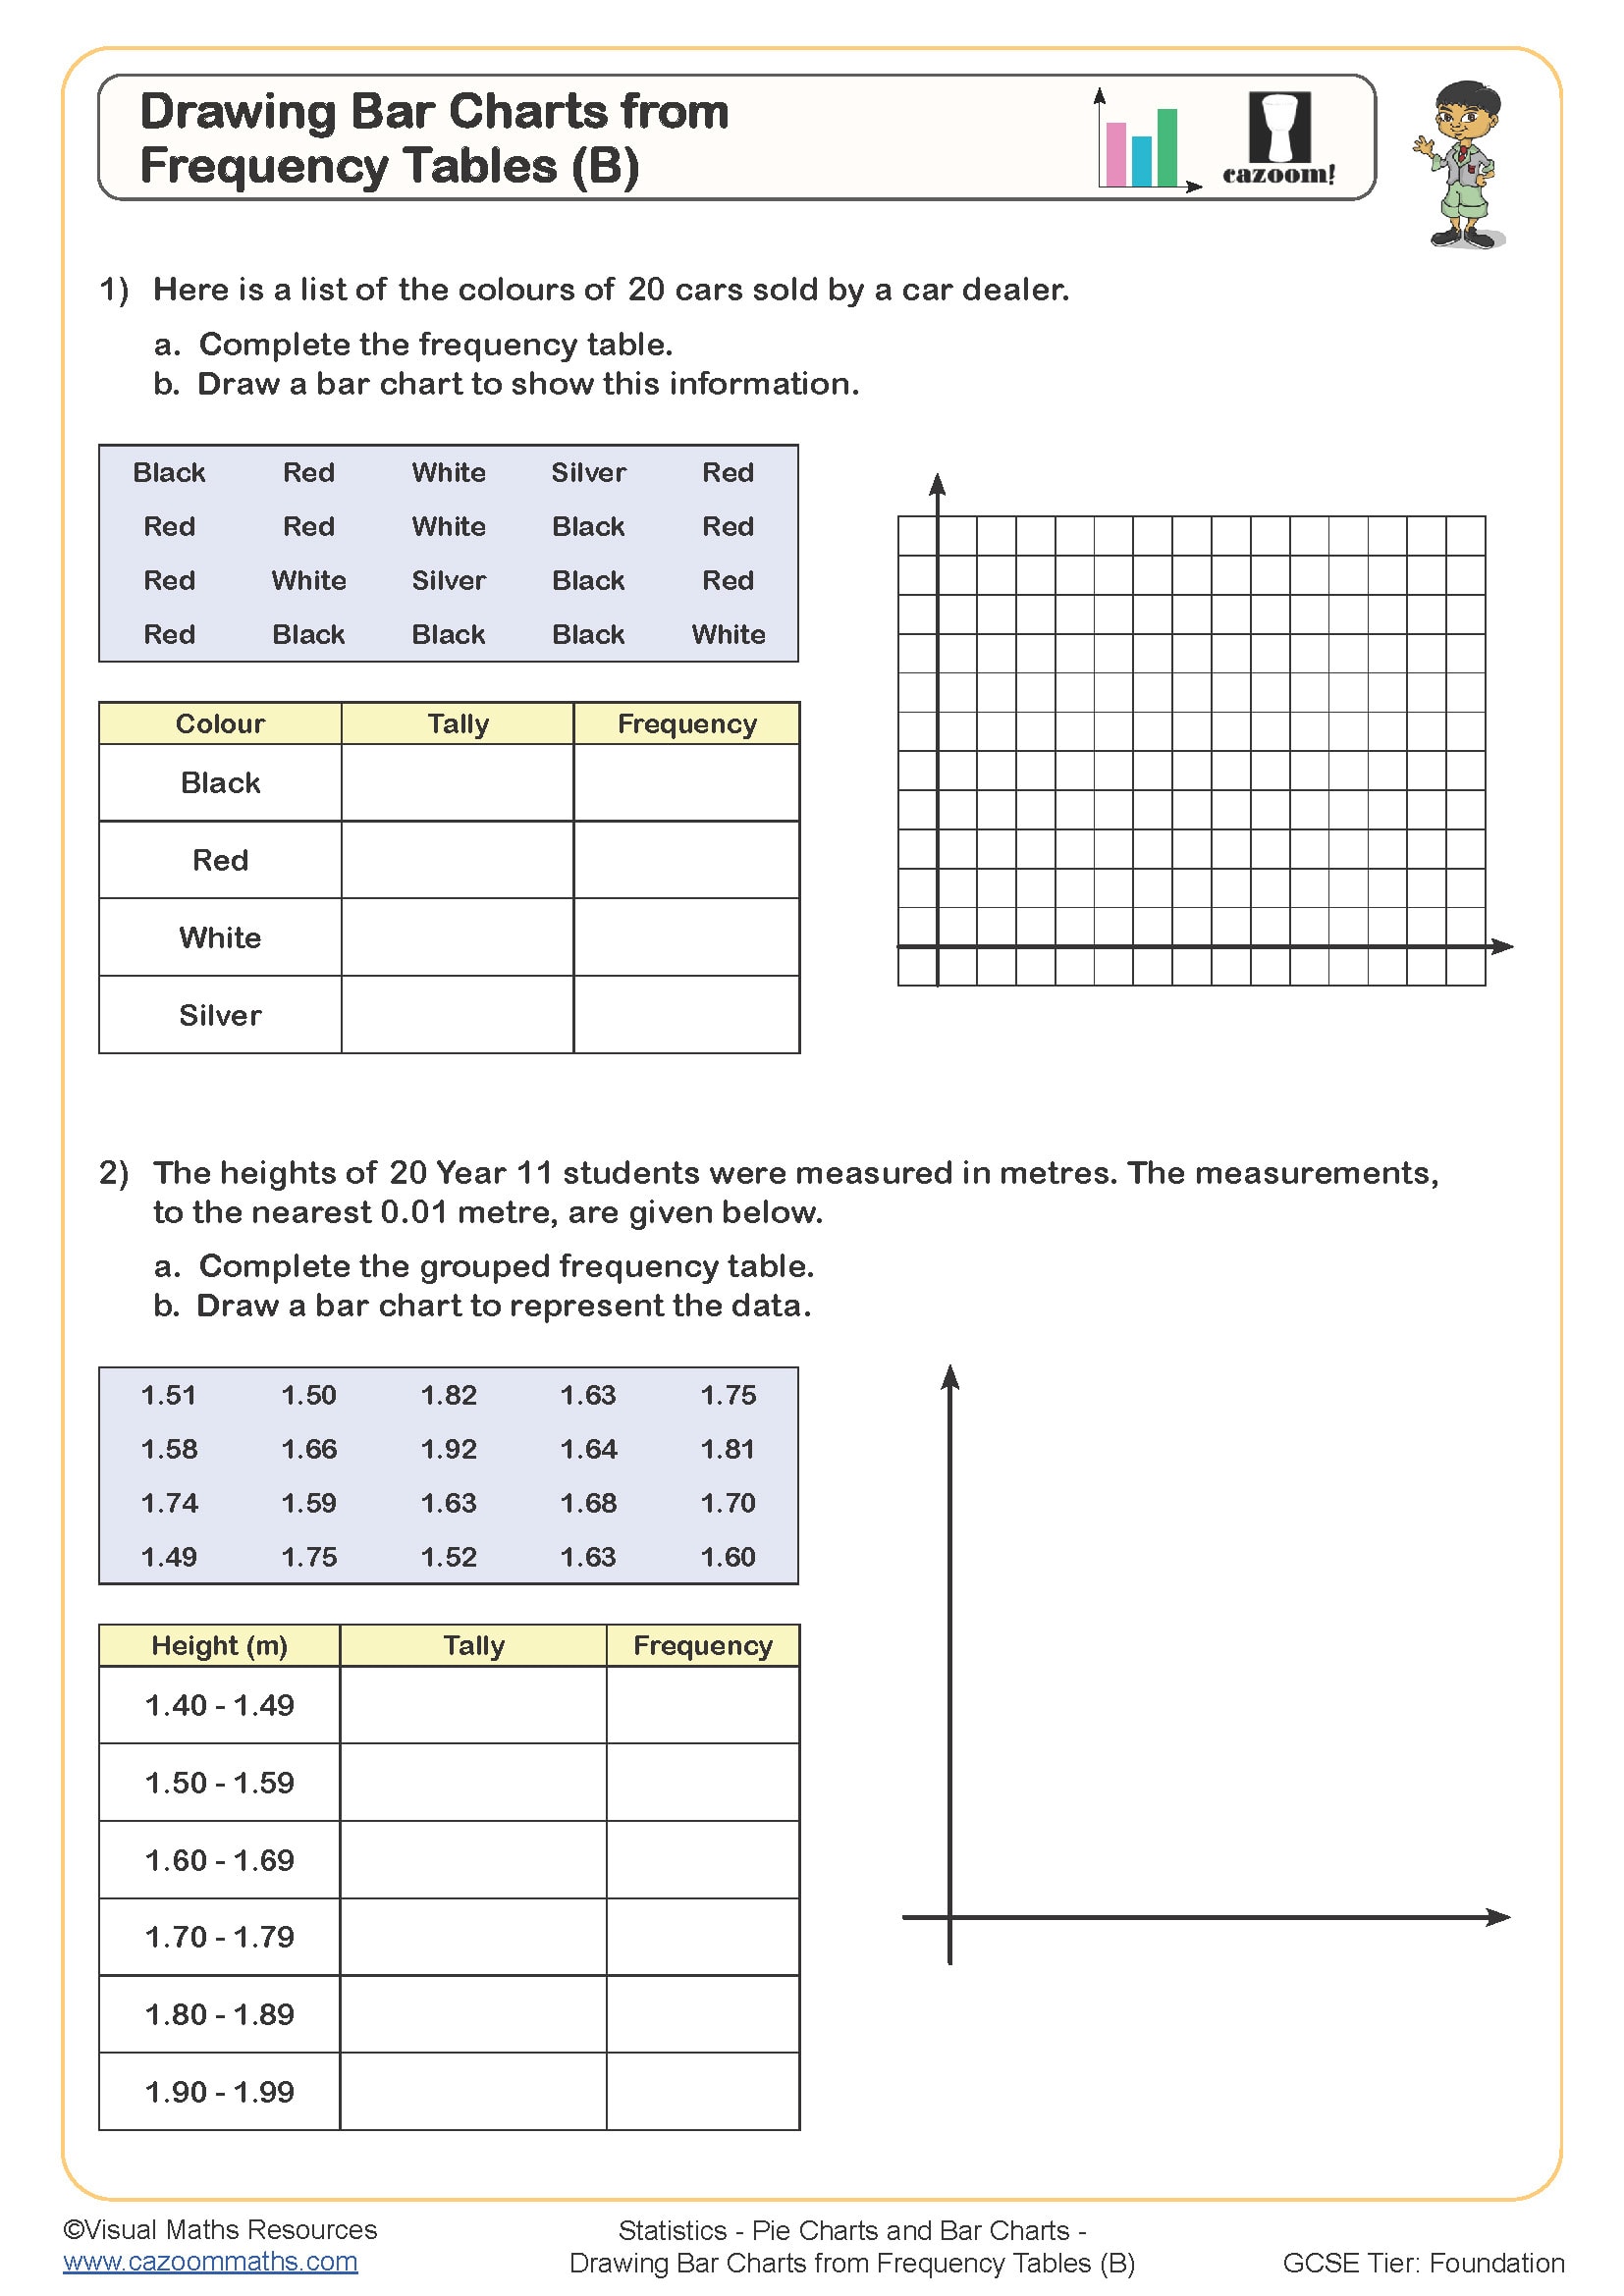
This worksheet gives an opportunity for learners to practise taking information from a tally chart to produce a bar chart. Learners will need to complete the frequency columns of the four tally charts and then use the axes provided to make their own bar chart. The importance of correct scales and labelling can be highlighted during this task. Follow this worksheet with Drawing Bar Charts from Frequency Tables (B).
All worksheets are created by the team of experienced teachers at Cazoom Maths.
 Worksheet")
RELATED TO Drawing Bar Charts from Frequency Tables (A) WORKSHEET
Frequently Asked Questions
Students should be comfortable working with tally tables as this forms the prerequisite knowledge for these activities. They'll be building on this foundation by converting tally information into frequencies, then taking the additional step of creating visual representations through bar charts.