Drawing Bar Charts from Frequency Tables (B) WORKSHEET
Suitable for Year groups: Year 7, Year 8
GCSE Tier: Foundation
Targeting grades: 1-3
Prerequisite knowledge: Tally tables.
Learning Objective: Drawing Bar Charts from a frequency table
Drawing Bar Charts from Frequency Tables (B) WORKSHEET DESCRIPTION
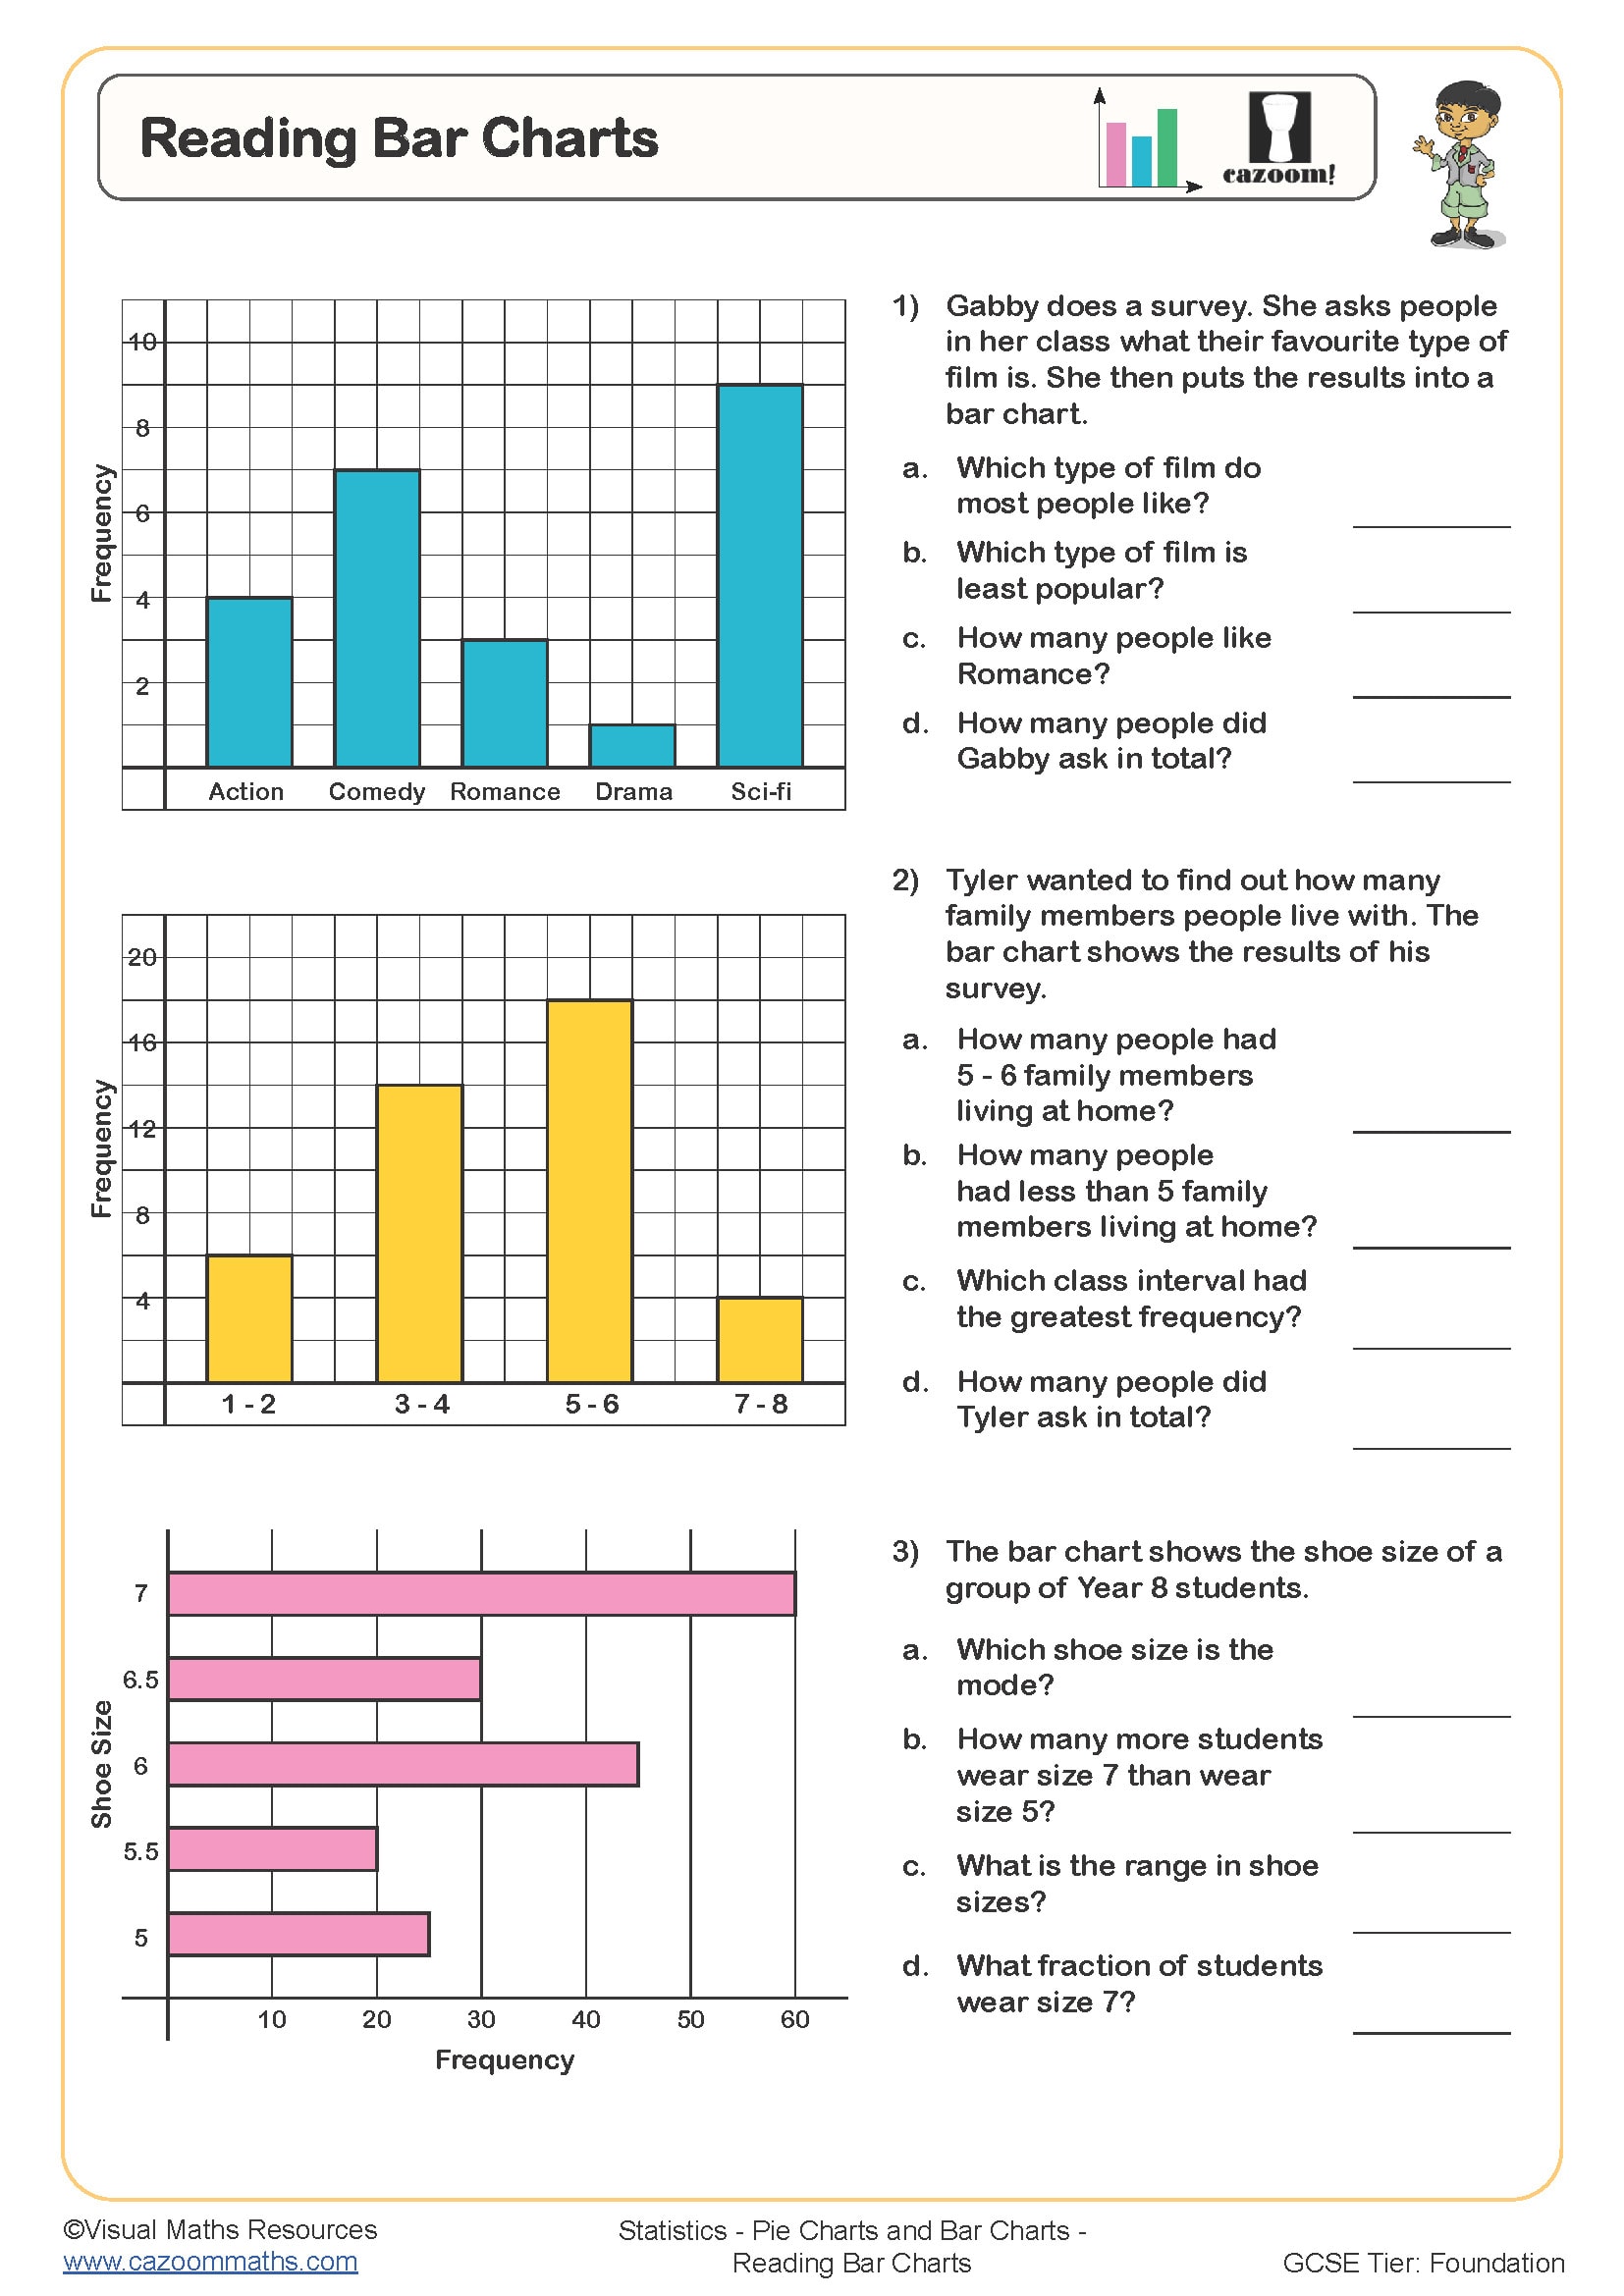
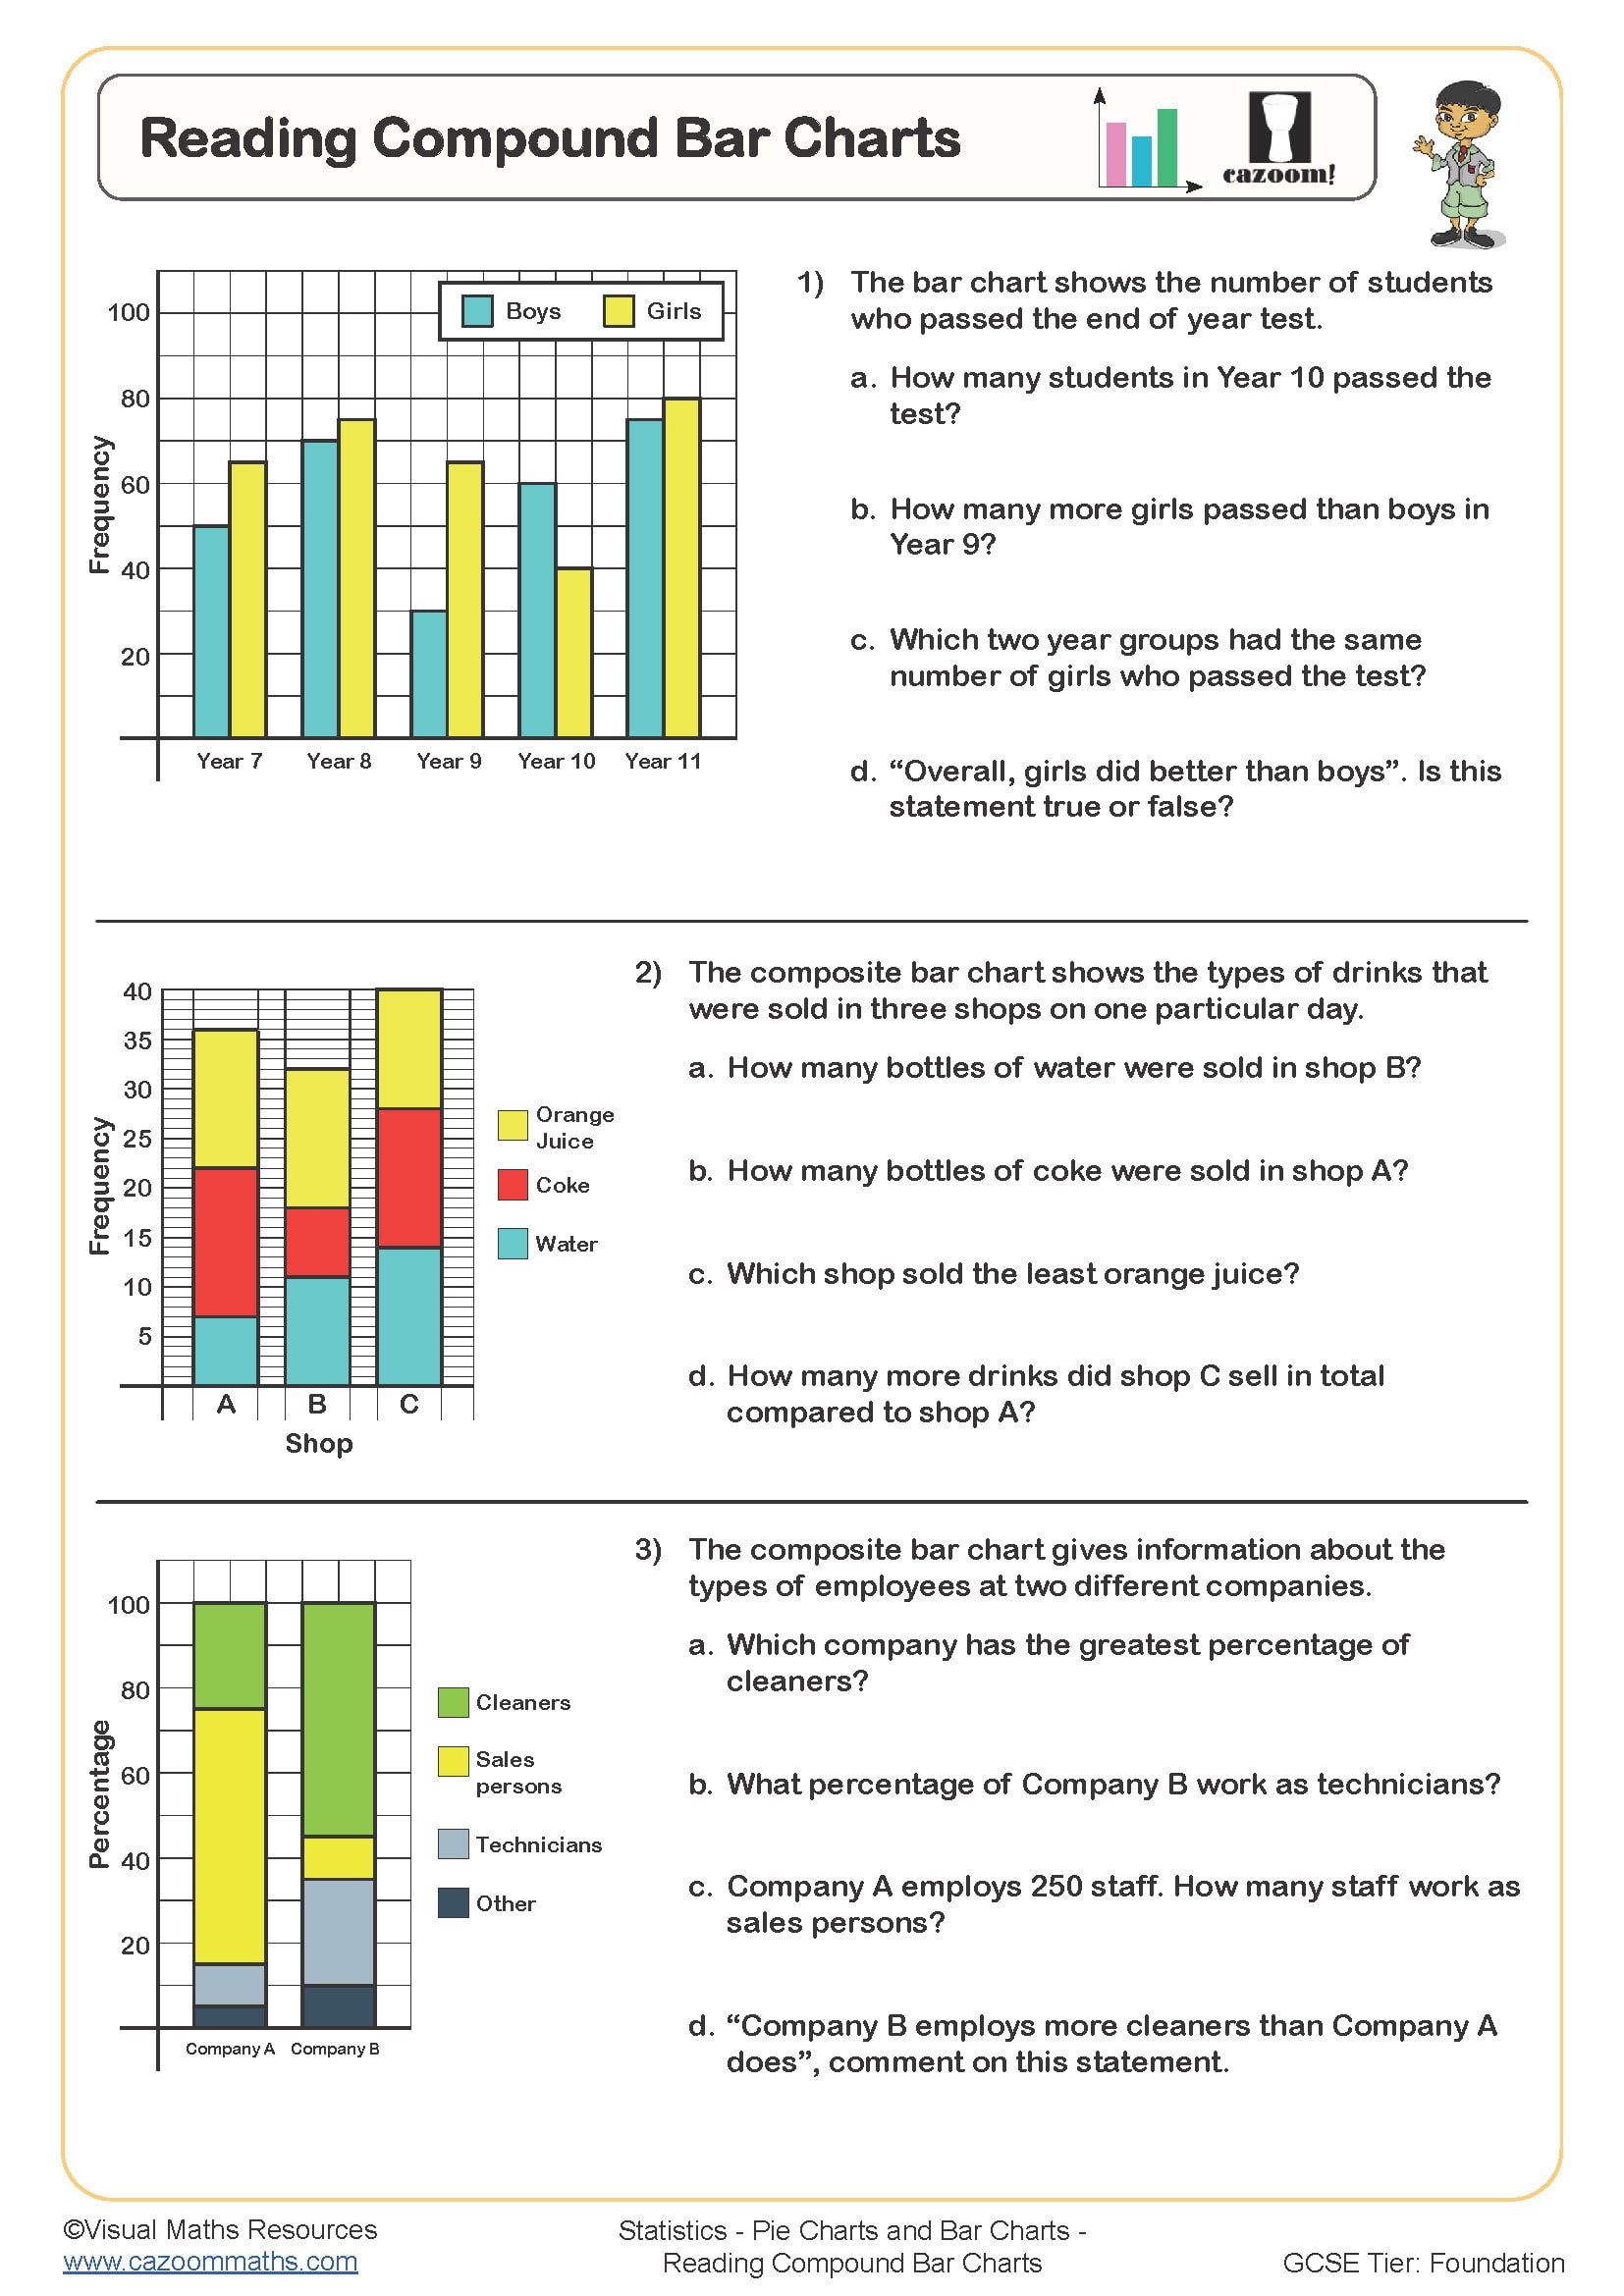
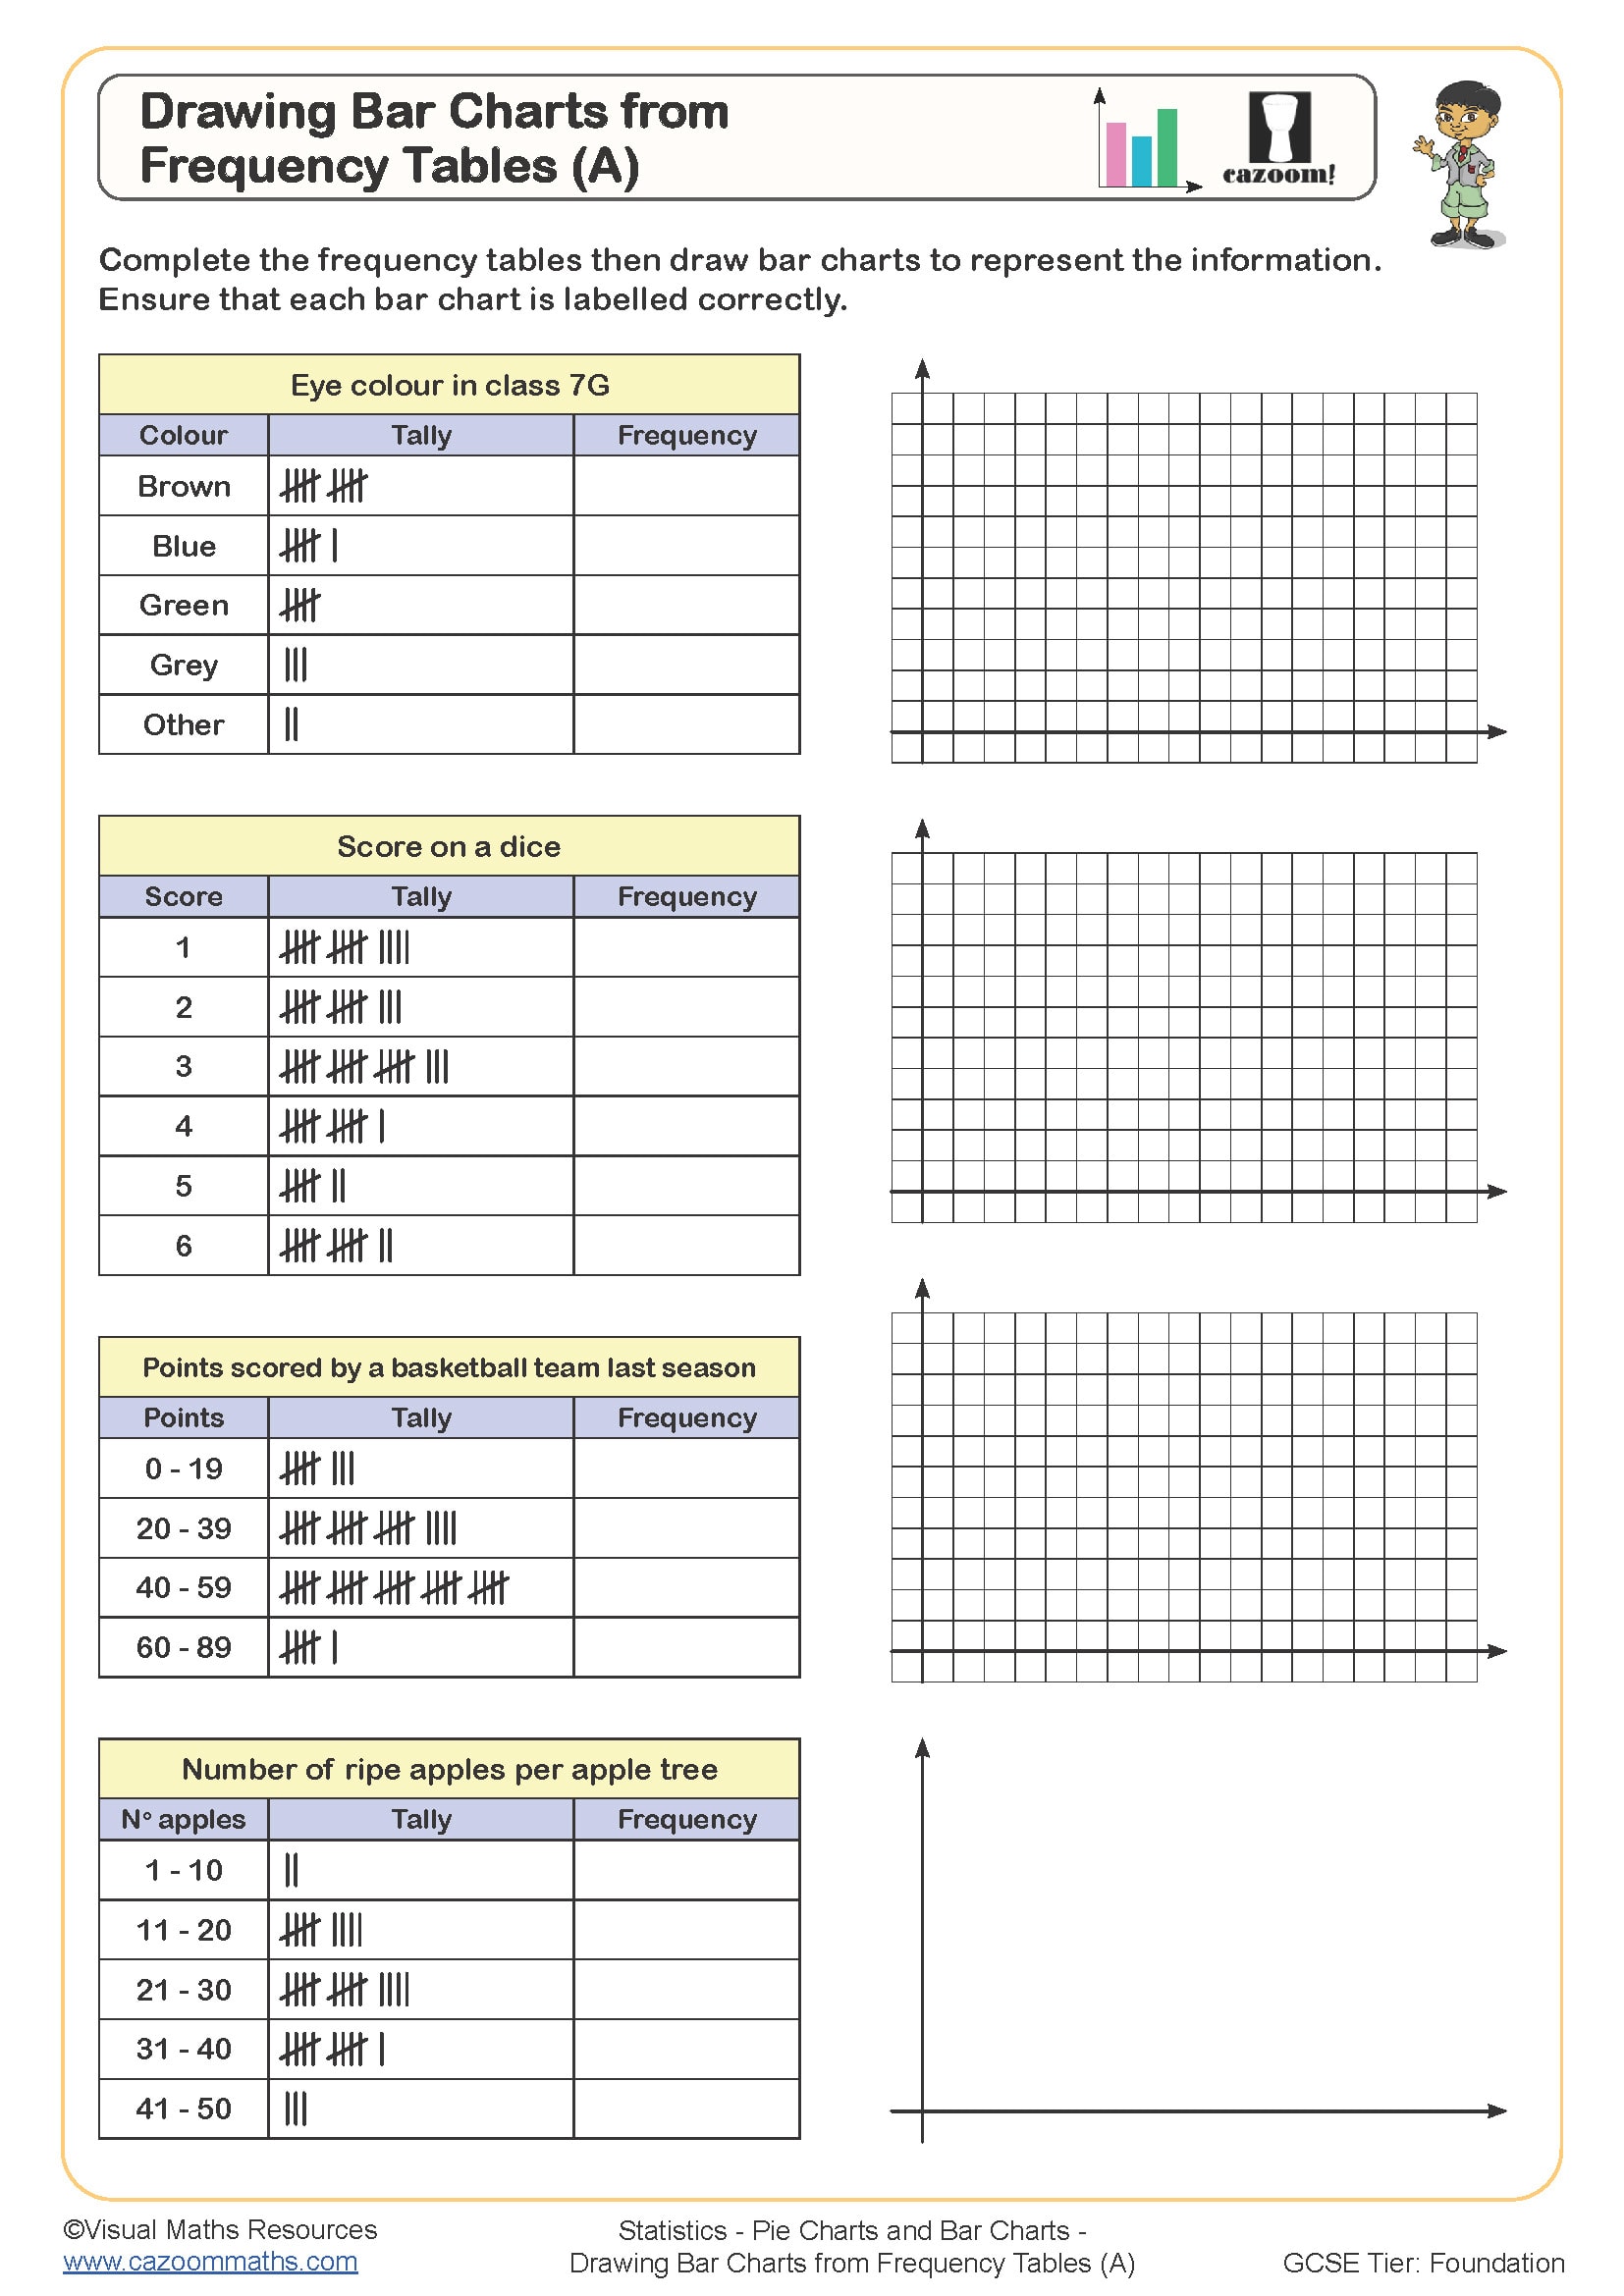
This worksheet can be used alongside Drawing Bar Charts from Frequency Tables (A). It provides two sets of data for which tally charts and bar charts are to be produced. Empty tally charts and axes are provided. The importance of correct scales and labelling can be highlighted during this task.
All worksheets are created by the team of experienced teachers at Cazoom Maths.
 Worksheet")
RELATED TO Drawing Bar Charts from Frequency Tables (B) WORKSHEET
Frequently Asked Questions
This resource is designed for Year 7 and Year 8 students who are developing their data handling skills. It's particularly effective for learners who have already mastered tally tables and are ready to progress to creating visual representations of data.