Drawing Box Plots from Cumulative Frequency Diagrams WORKSHEET
Drawing Box Plots from Cumulative Frequency Diagrams WORKSHEET DESCRIPTION
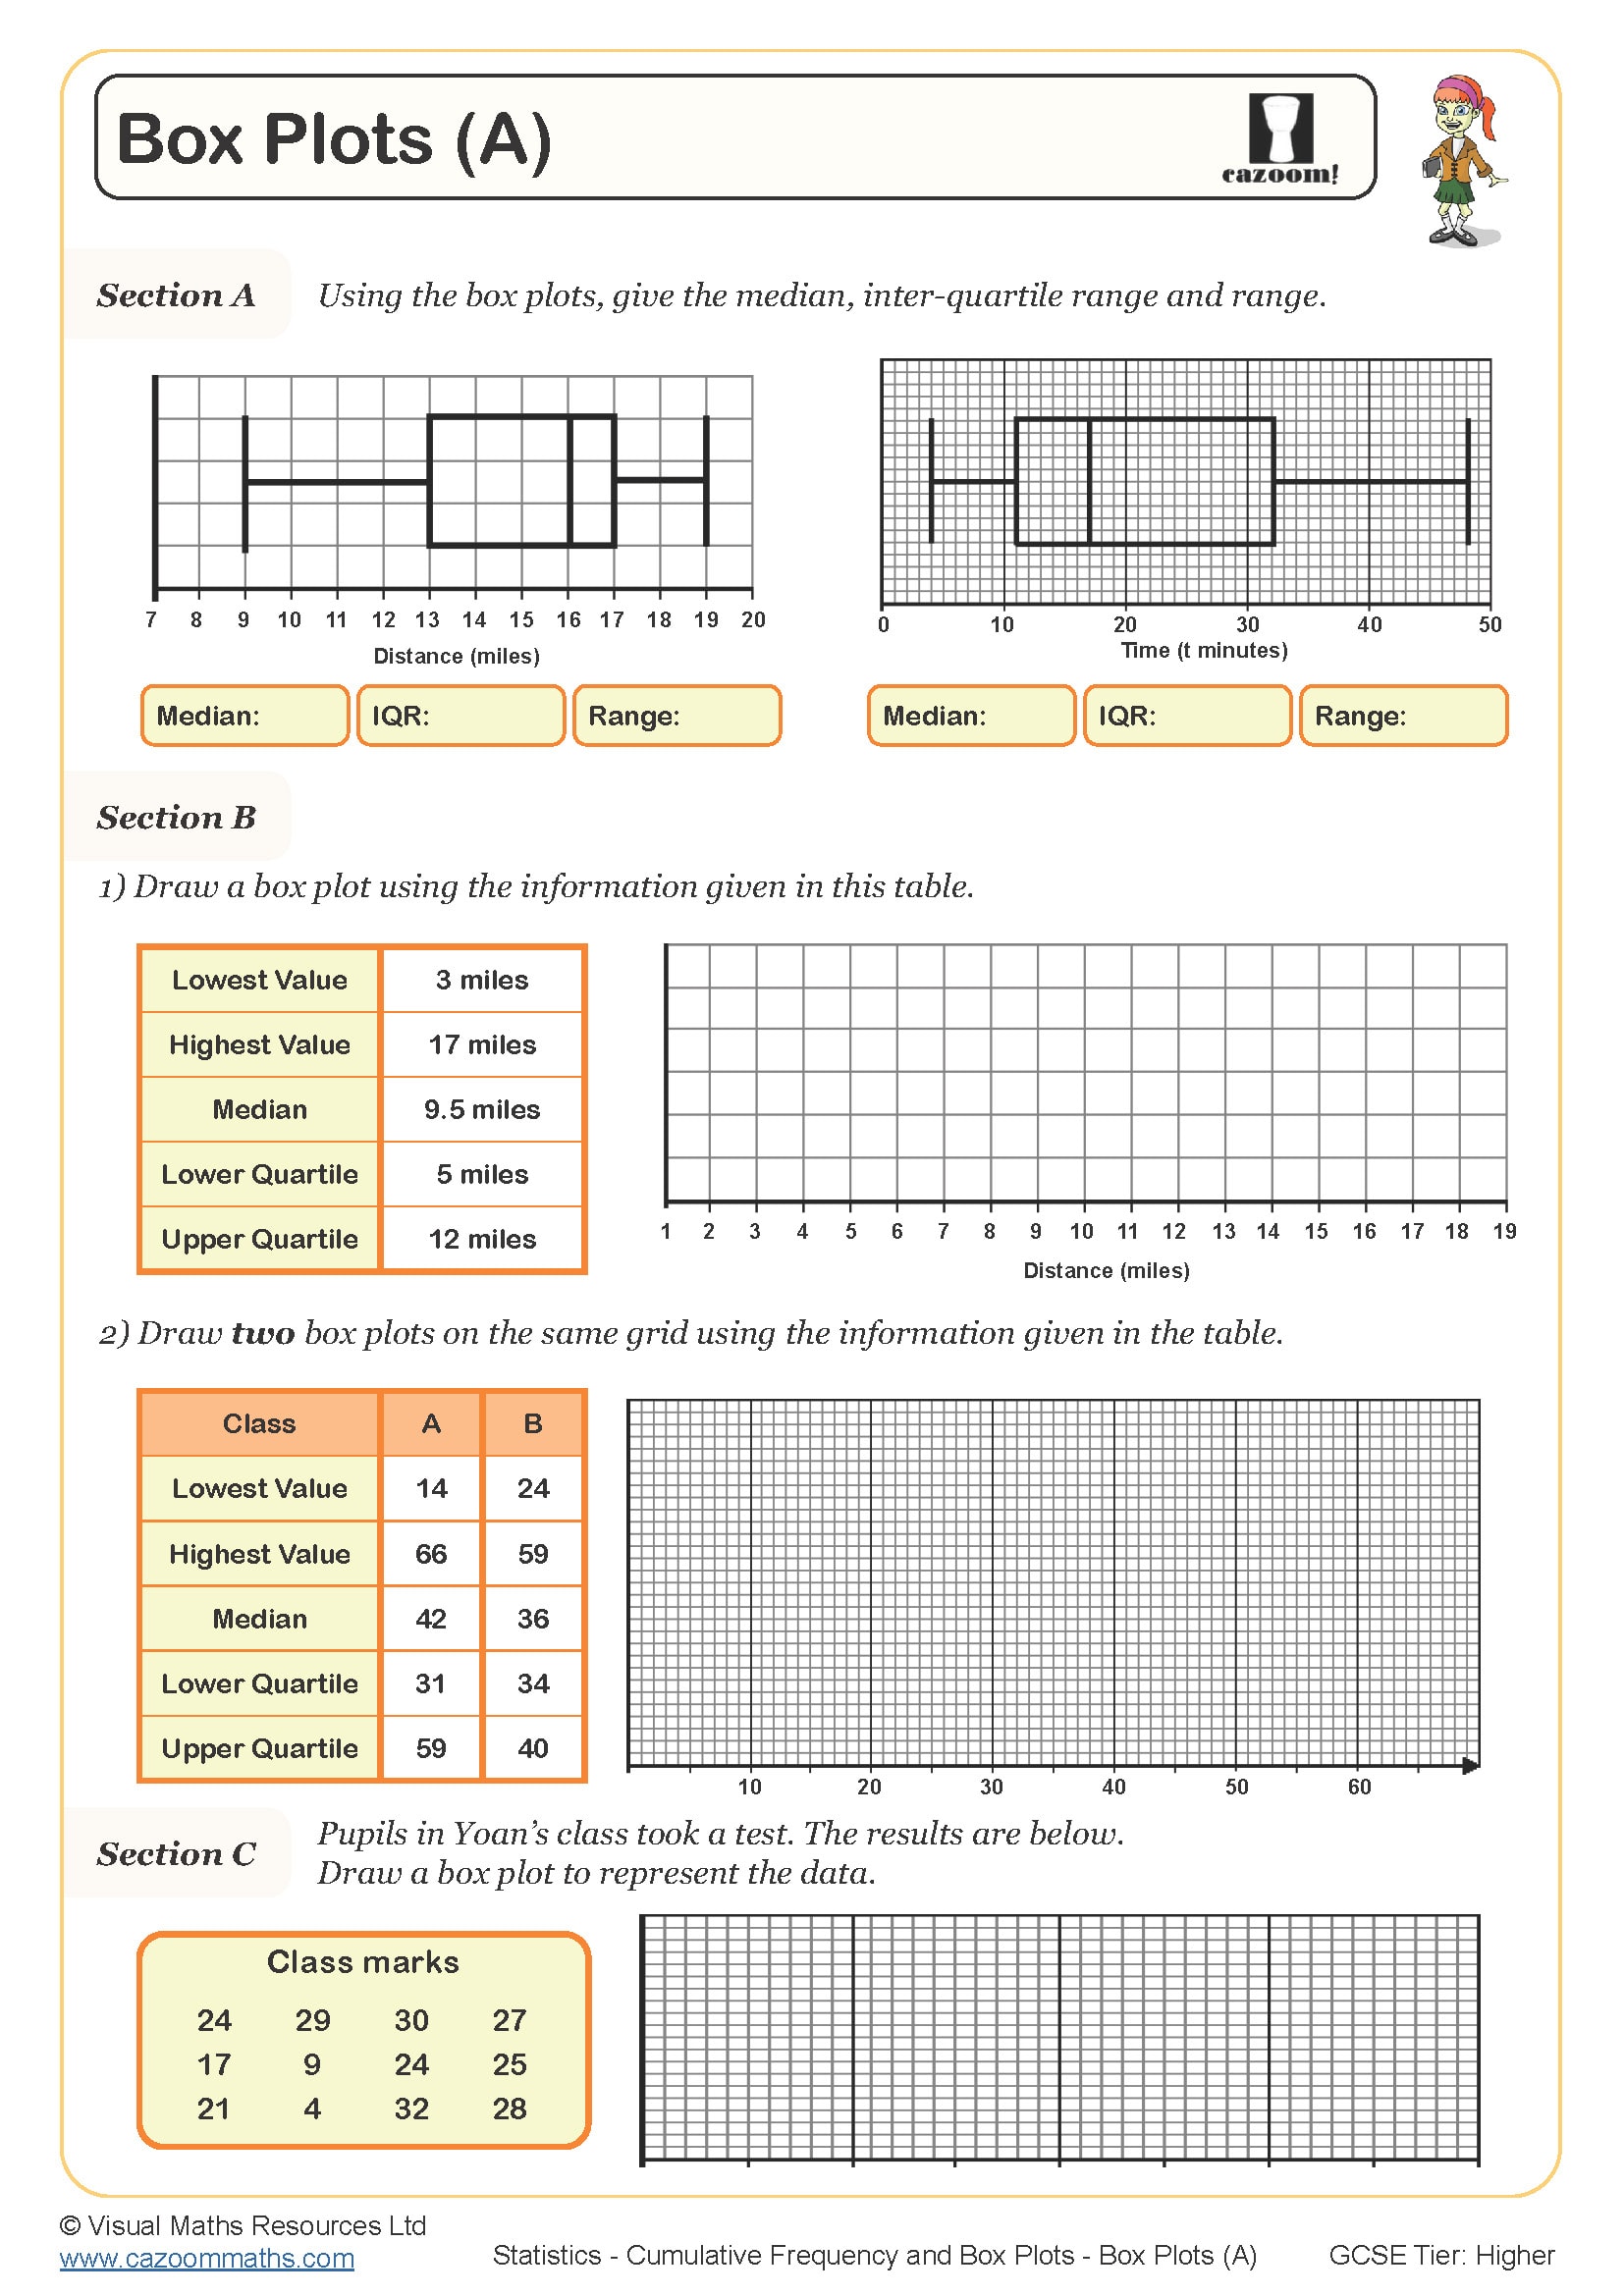
This worksheet is designed to help build the skill of drawing a box plot from a cumulative frequency diagram.
In section A, learners are given two cumulative frequency diagrams and below each one is a separate axes for box plot.
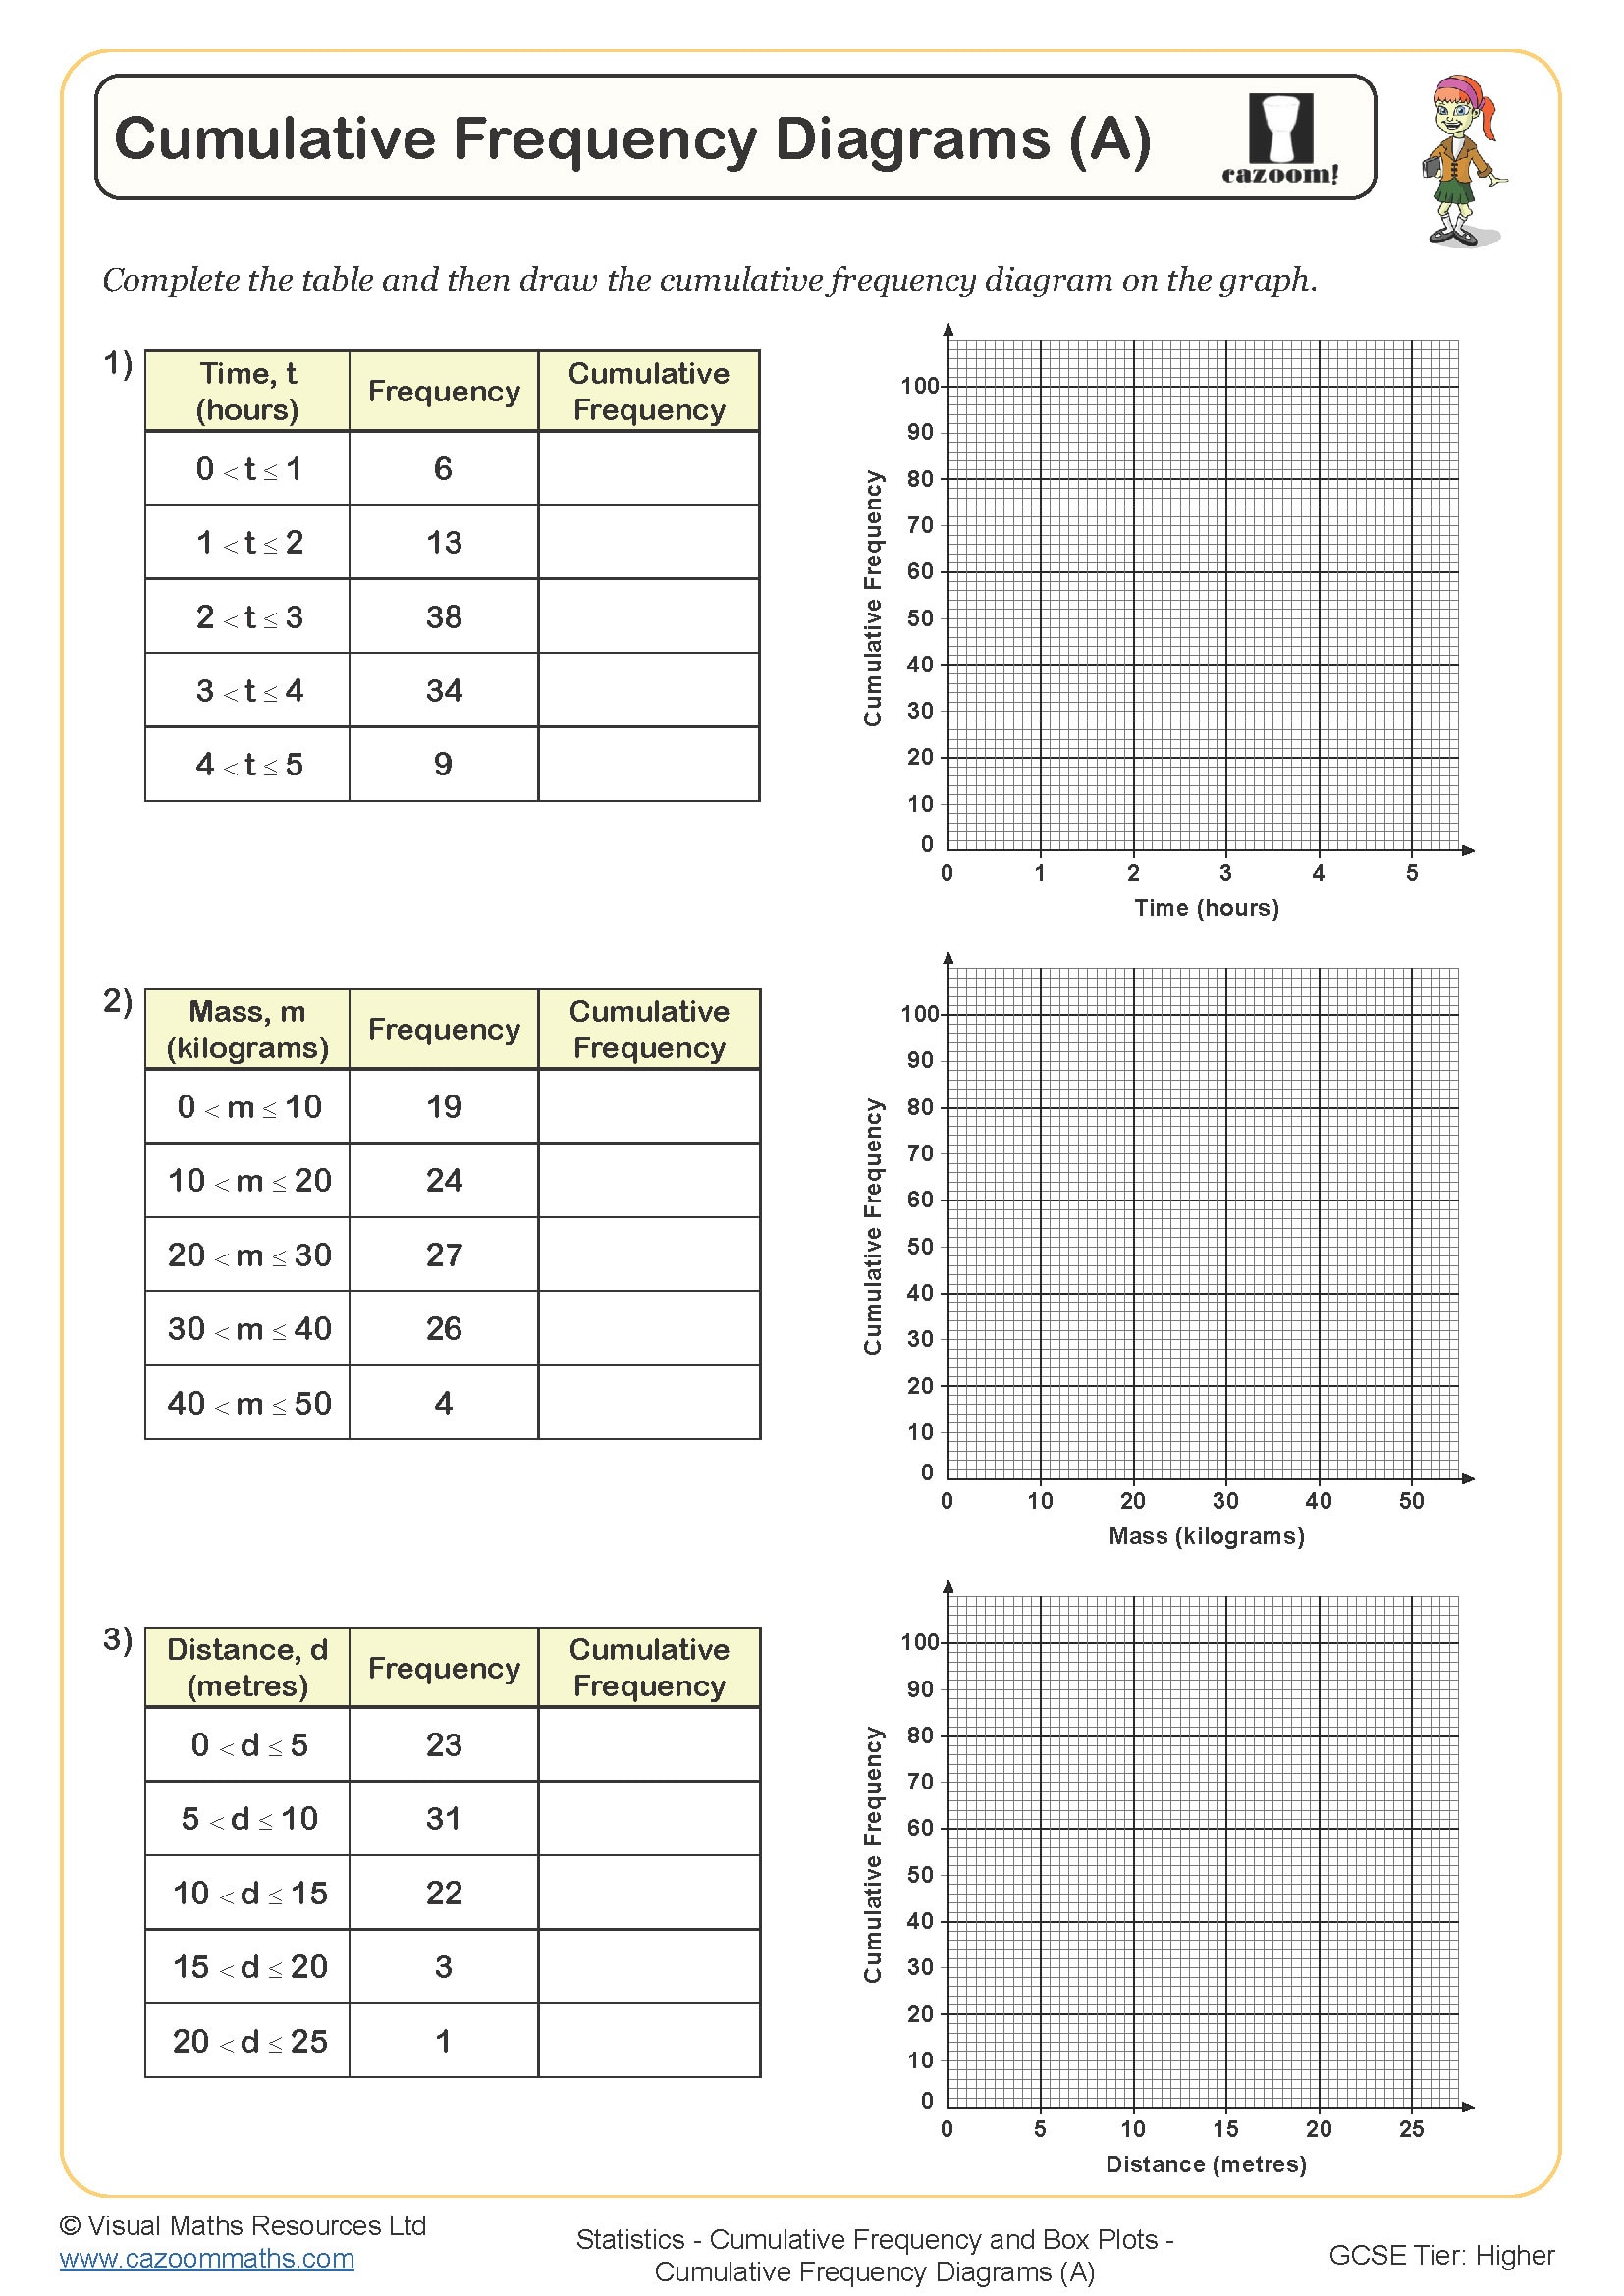
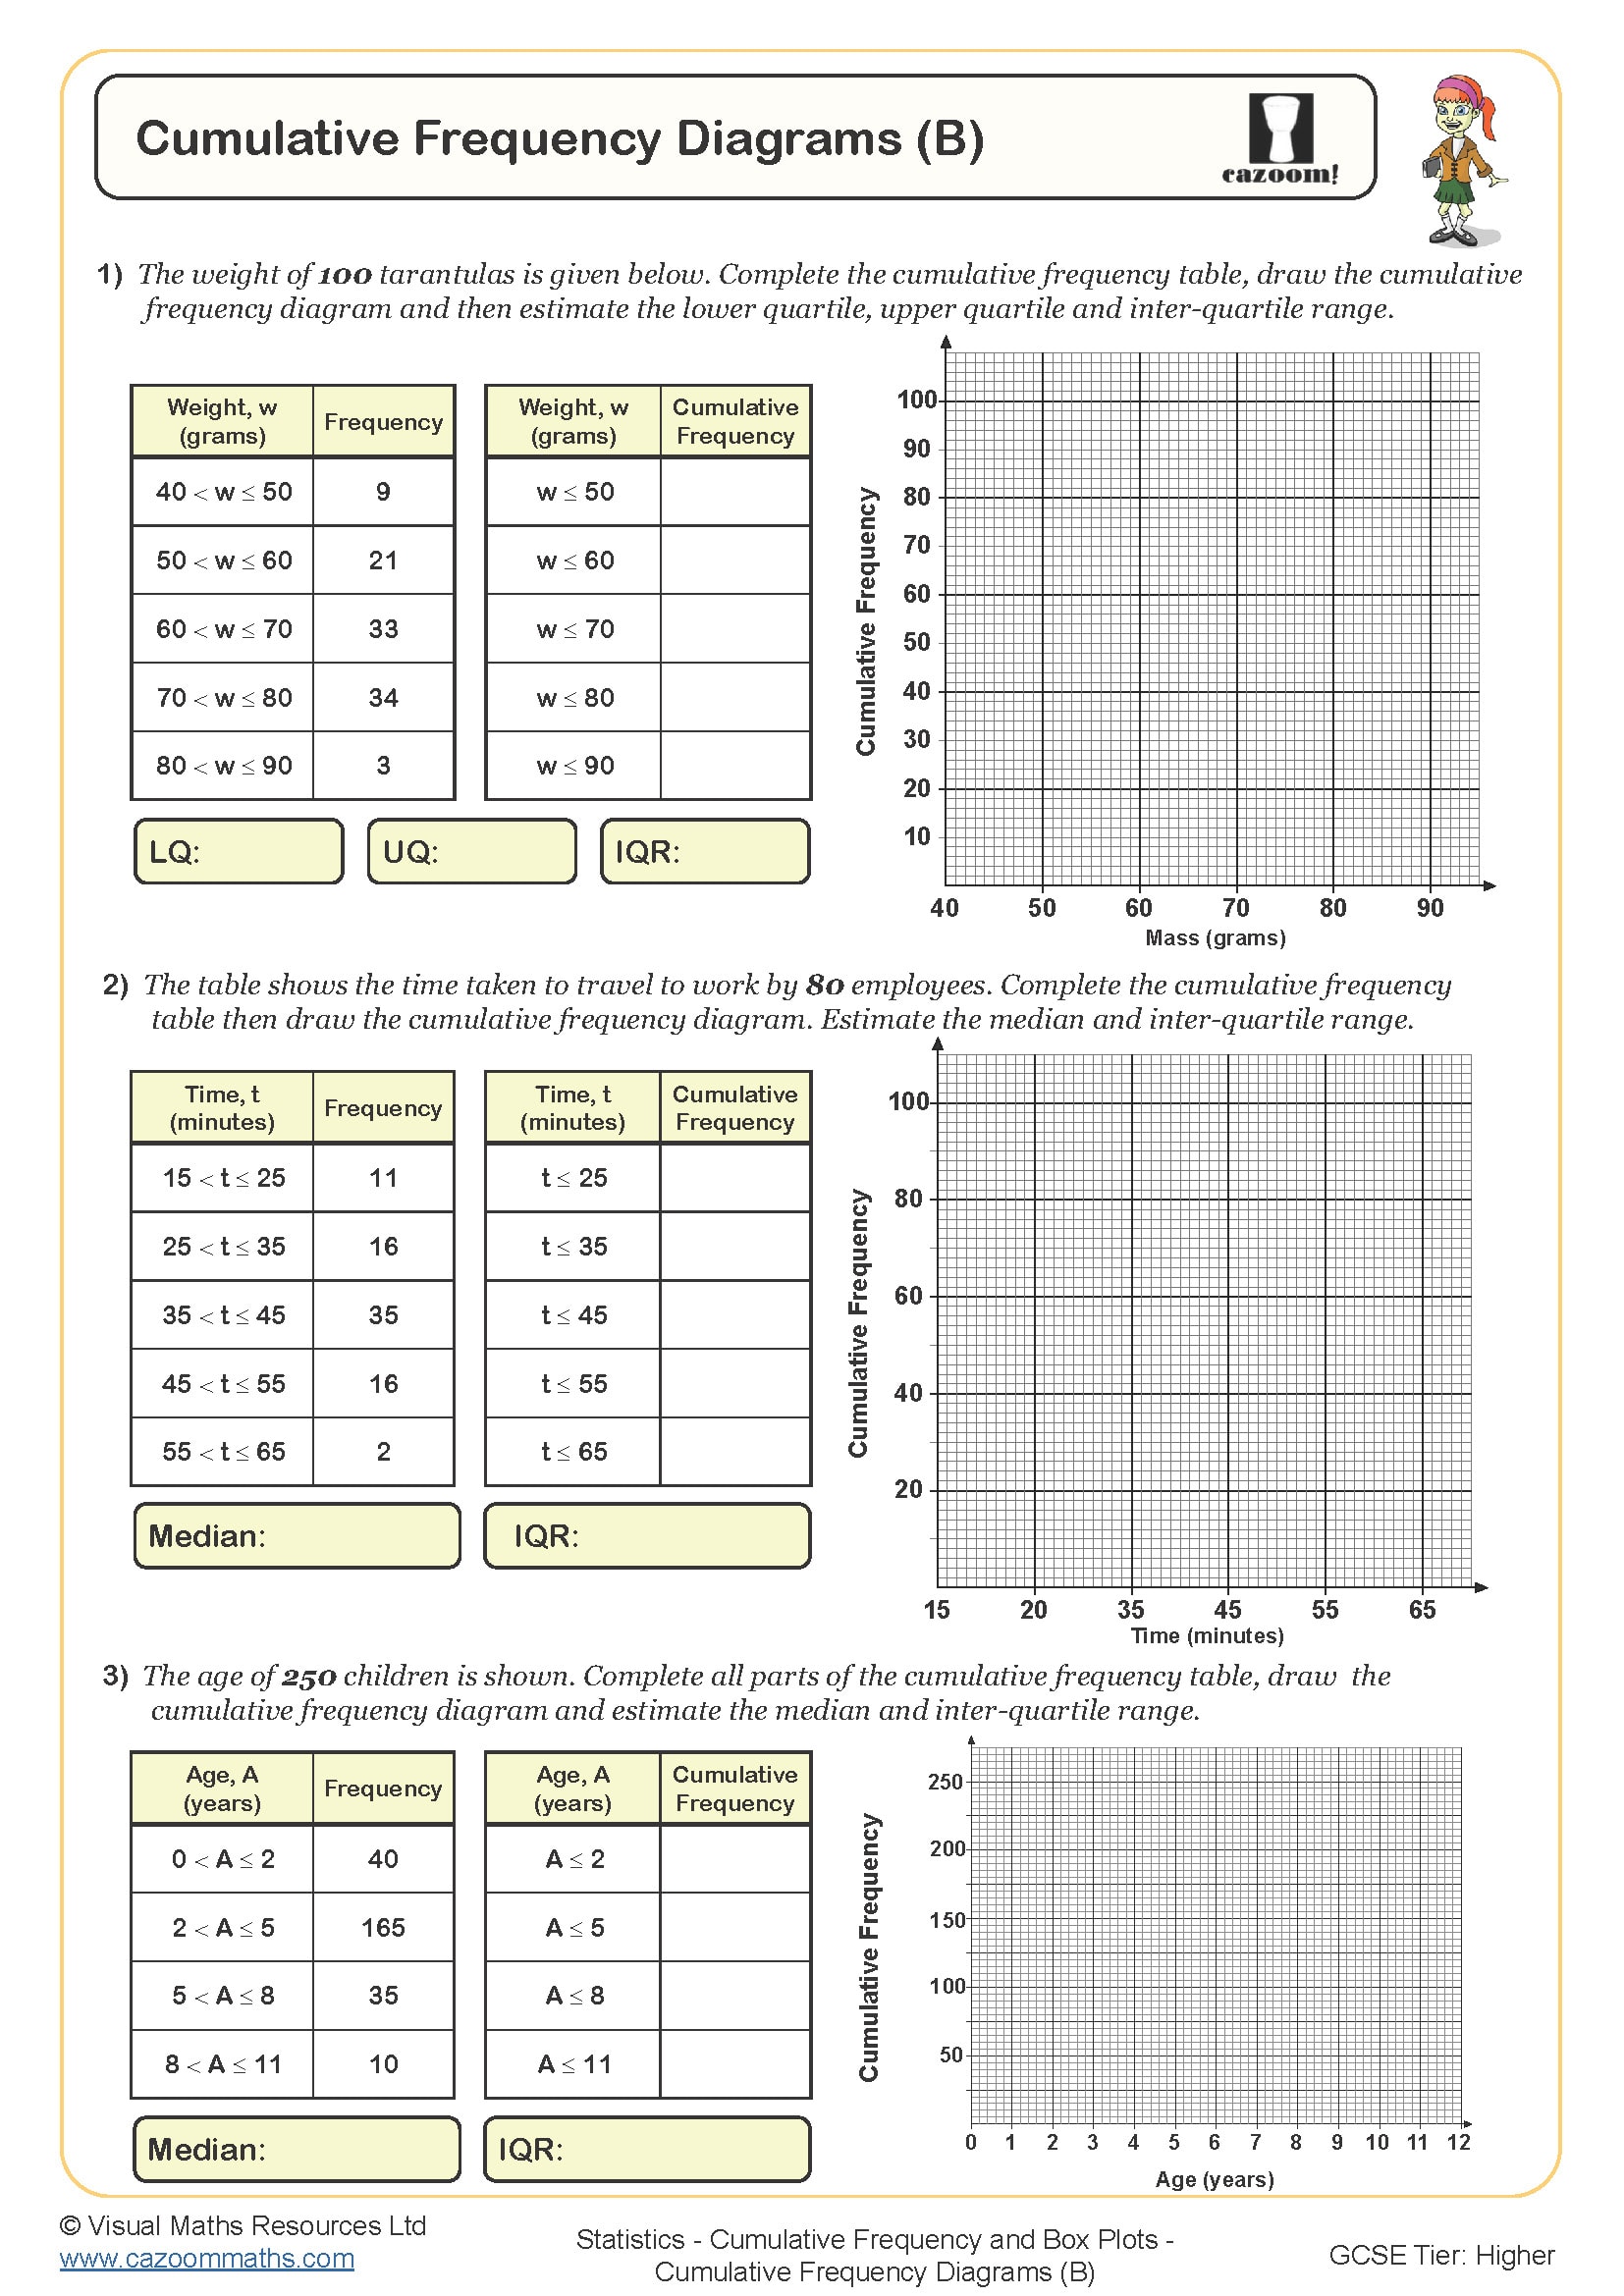
In section B, learners are given a grouped frequency table and leaners need to draw a cumulative frequency diagram before then constructing a box plot.
All worksheets are created by the team of experienced teachers at Cazoom Maths.

RELATED TO Drawing Box Plots from Cumulative Frequency Diagrams WORKSHEET
Frequently Asked Questions
Students should be comfortable with grouped frequency distributions, coordinates, box plots, and averages and range before tackling this material. These foundational skills are essential because learners need to read values from cumulative frequency curves, identify quartile positions, and understand how the five-number summary translates into a box plot format. Without these prerequisites, students may struggle to make the connections between the different representations of data.