Graphing Inequalities (A) WORKSHEET
Graphing Inequalities (A) WORKSHEET DESCRIPTION
Introduce learners to graphing inequalities with this worksheet that will guide them through the basics.
In Section A, students are presented with a range of inequalities and tasked with matching each to the corresponding graph that represents the solution region. The constants in the inequalities are either 9 or -9, allowing students to explore and compare how inequalities involving x, y, or both variables behave. This comparison also helps them distinguish between inequalities that include or exclude equality.
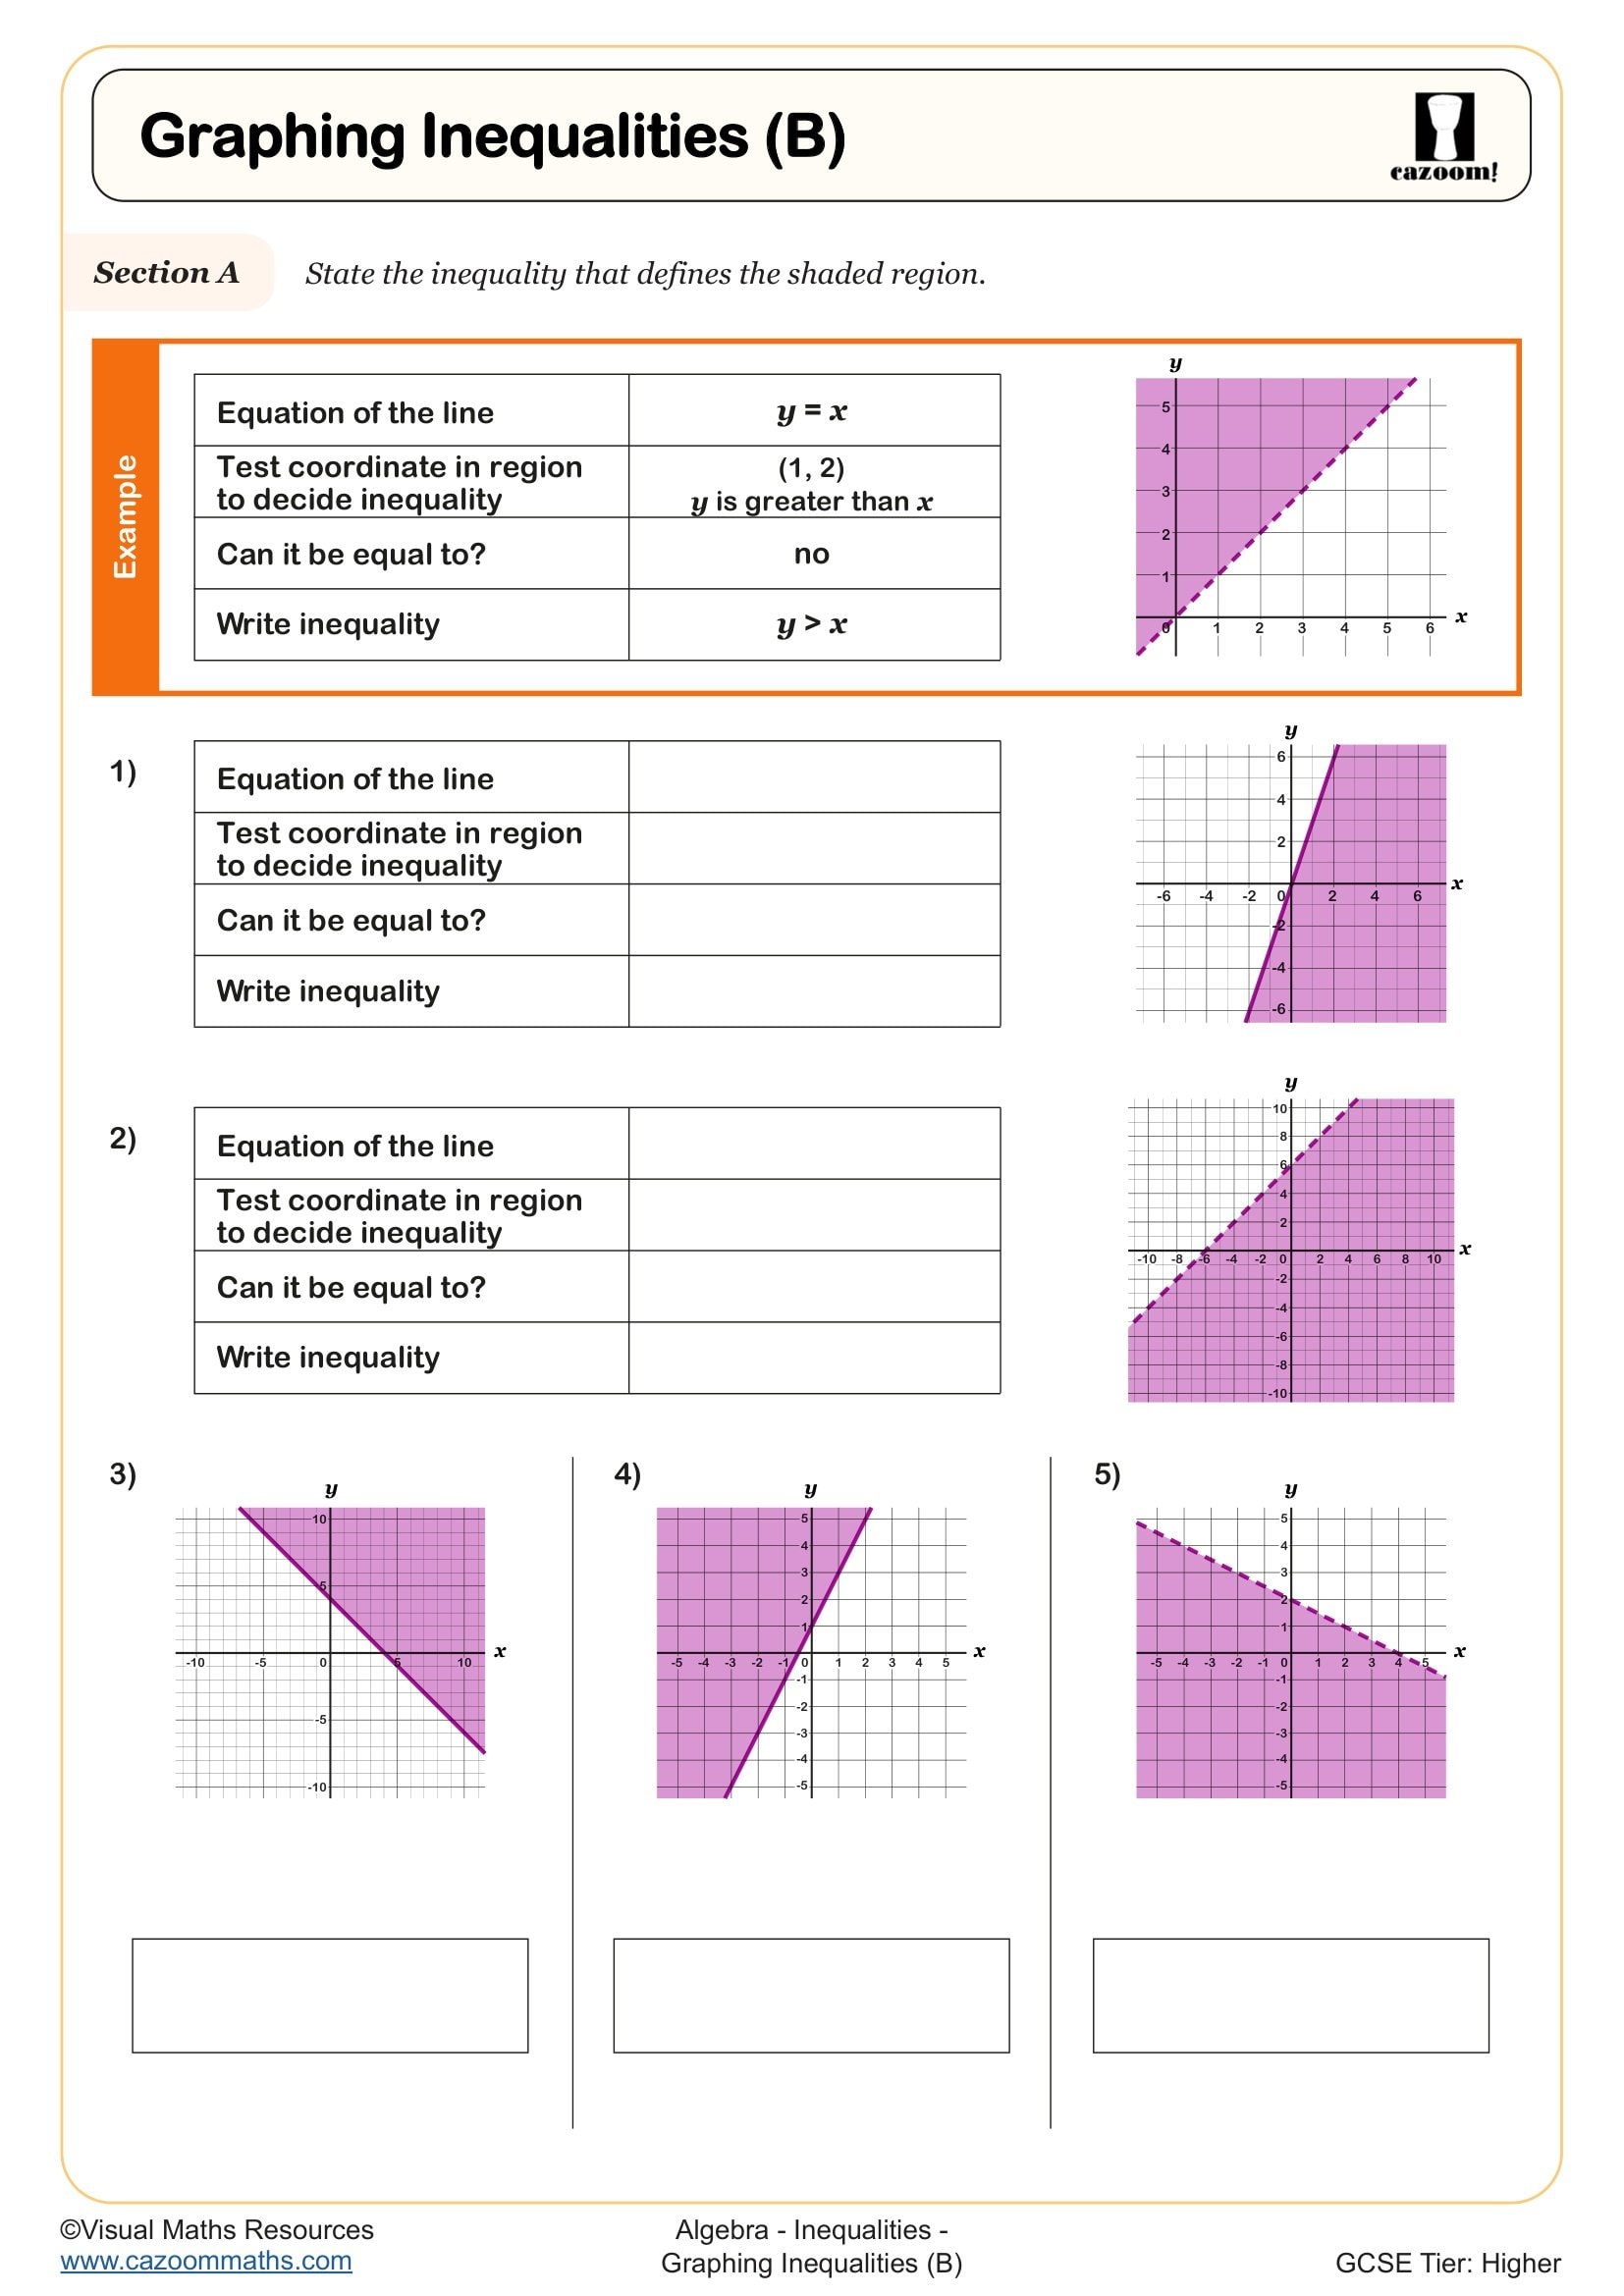
Next in Section B, learners are guided towards stating the inequality represented by different shaded regions. As they consider the equation of the graph, whether the region is above or below this line and whether it has equality or not.
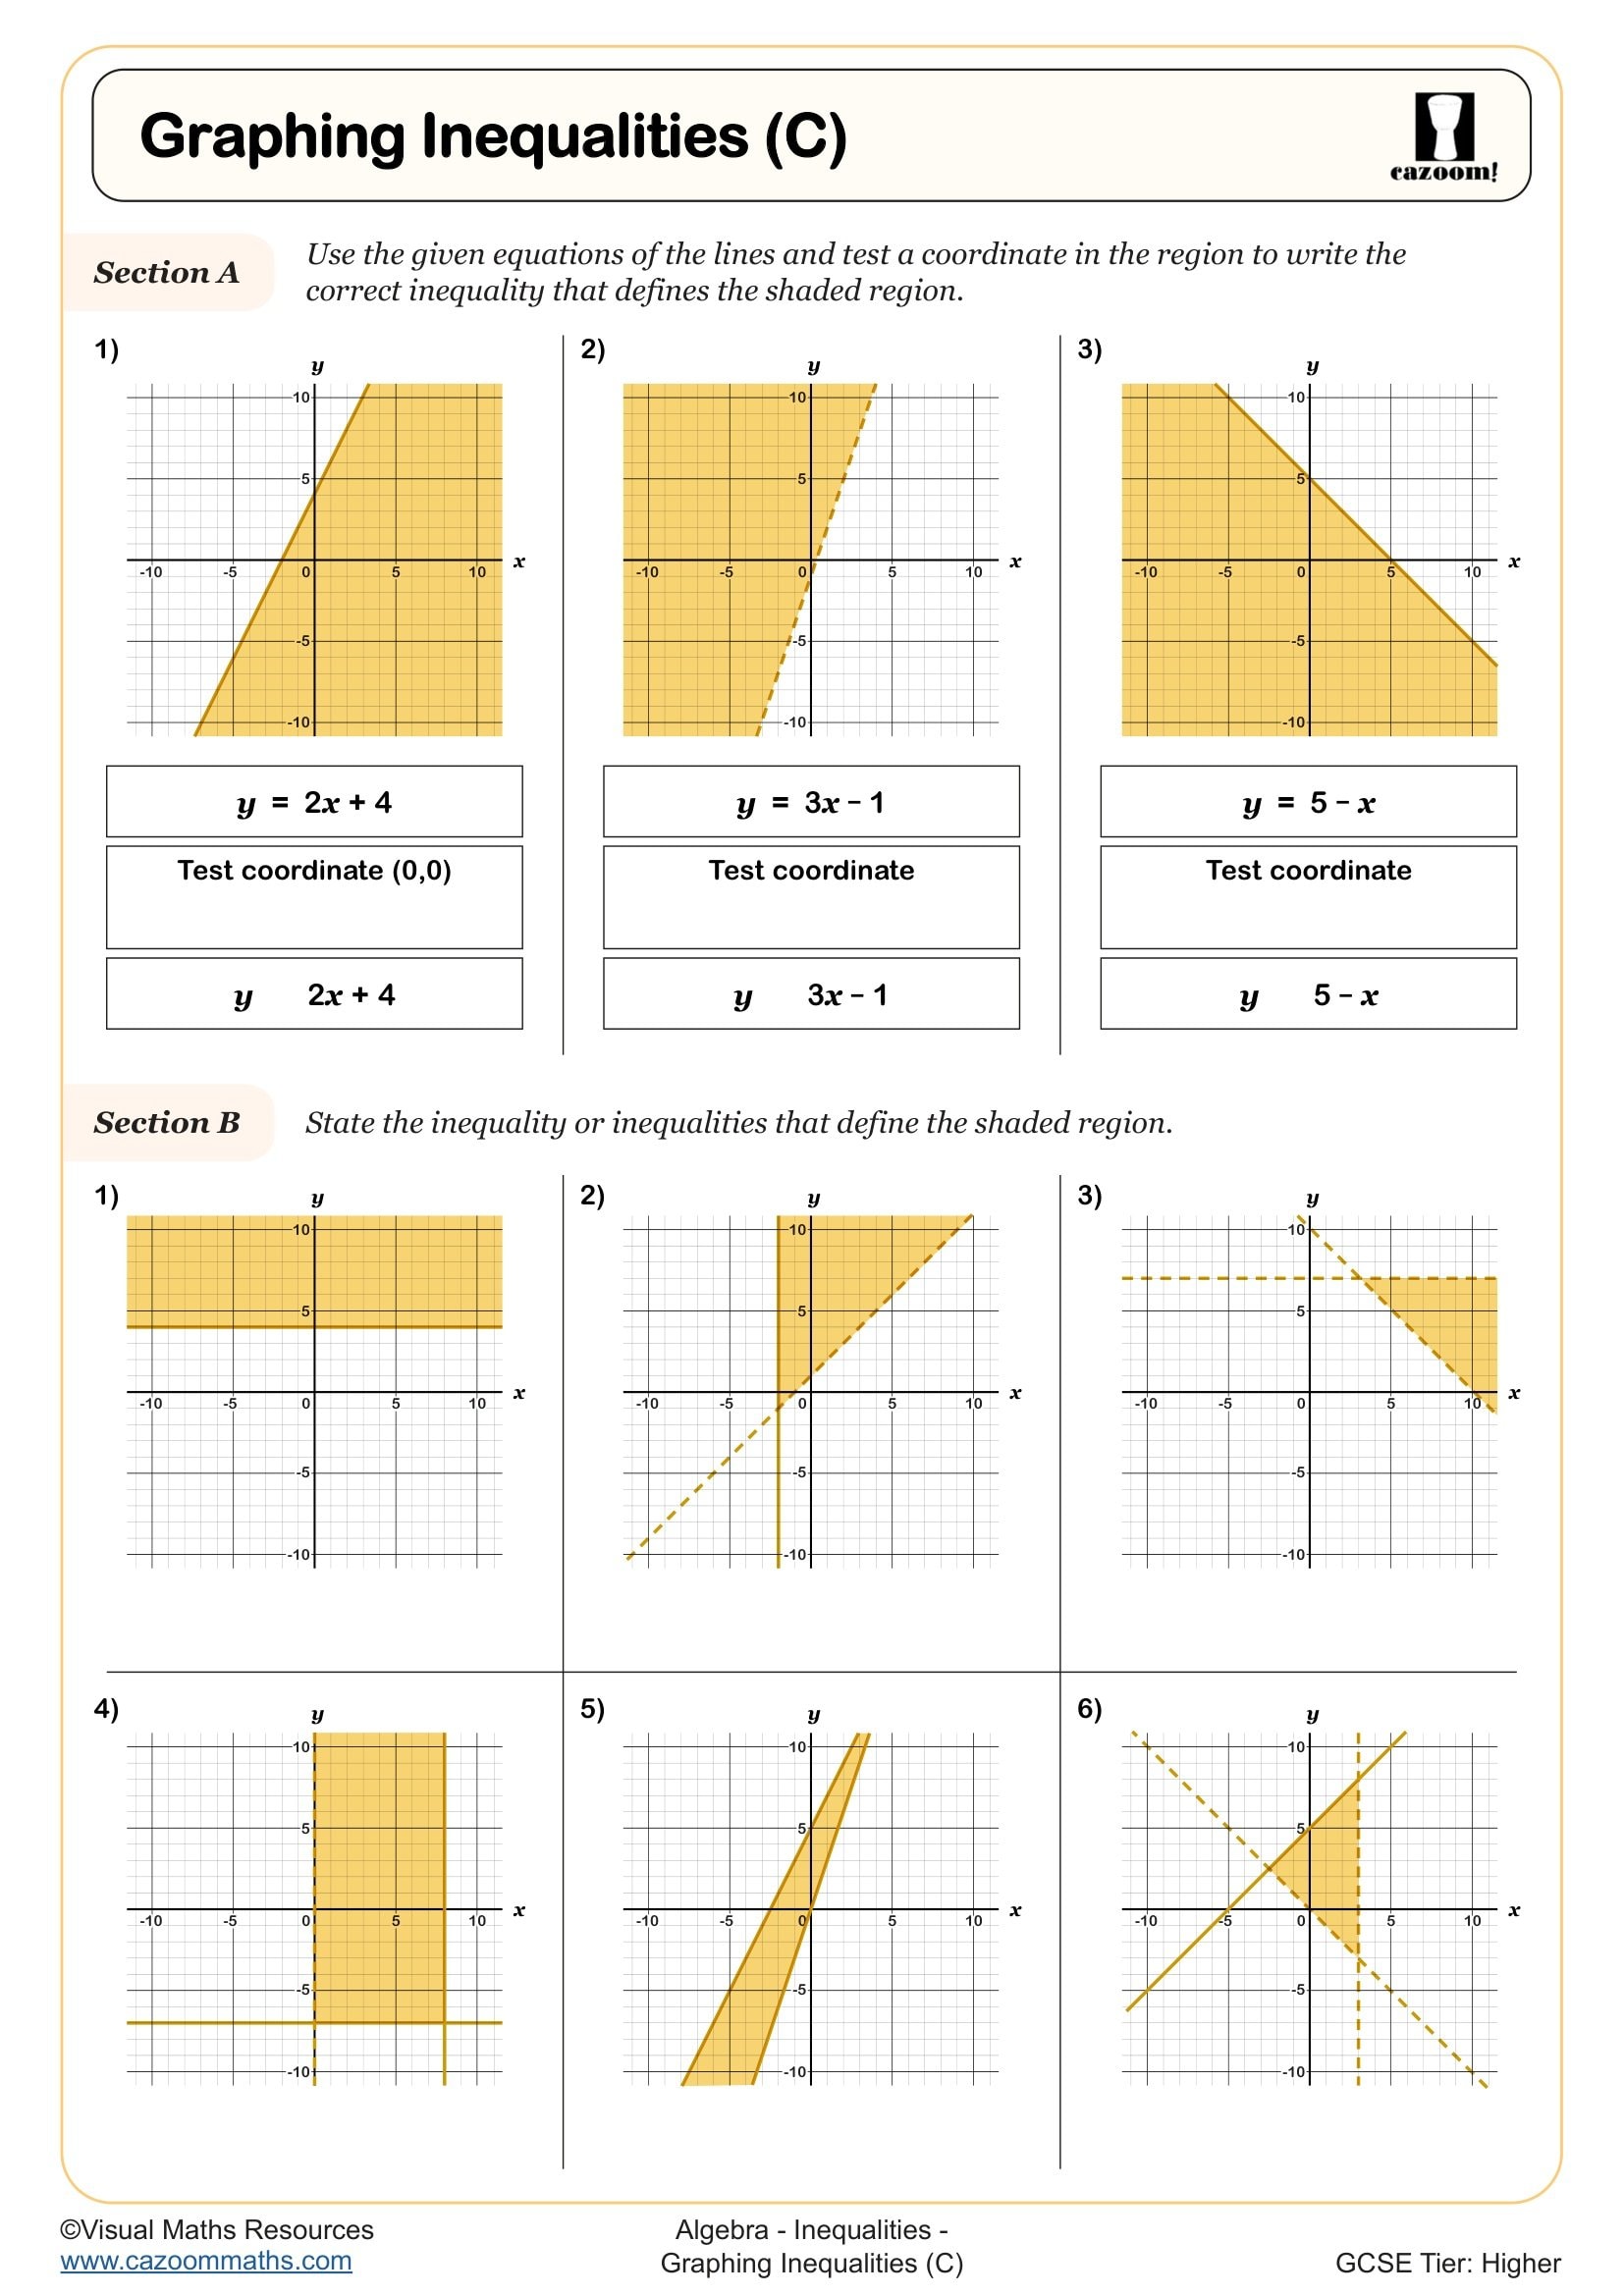
Then in Section C, pupils will represent six different inequalities on separate sets of axes.
All worksheets are created by the team of experienced teachers at Cazoom Maths.

RELATED TO Graphing Inequalities (A) WORKSHEET
Frequently Asked Questions
Students should be comfortable with substitution into formulae before tackling this resource. They'll also need to understand equations of lines parallel to the x and y axes, as well as those in the form y + x = c, since recognising these line types is crucial for interpreting the boundary lines in inequality graphs.