Graphing Inequalities (B) WORKSHEET
Graphing Inequalities (B) WORKSHEET DESCRIPTION
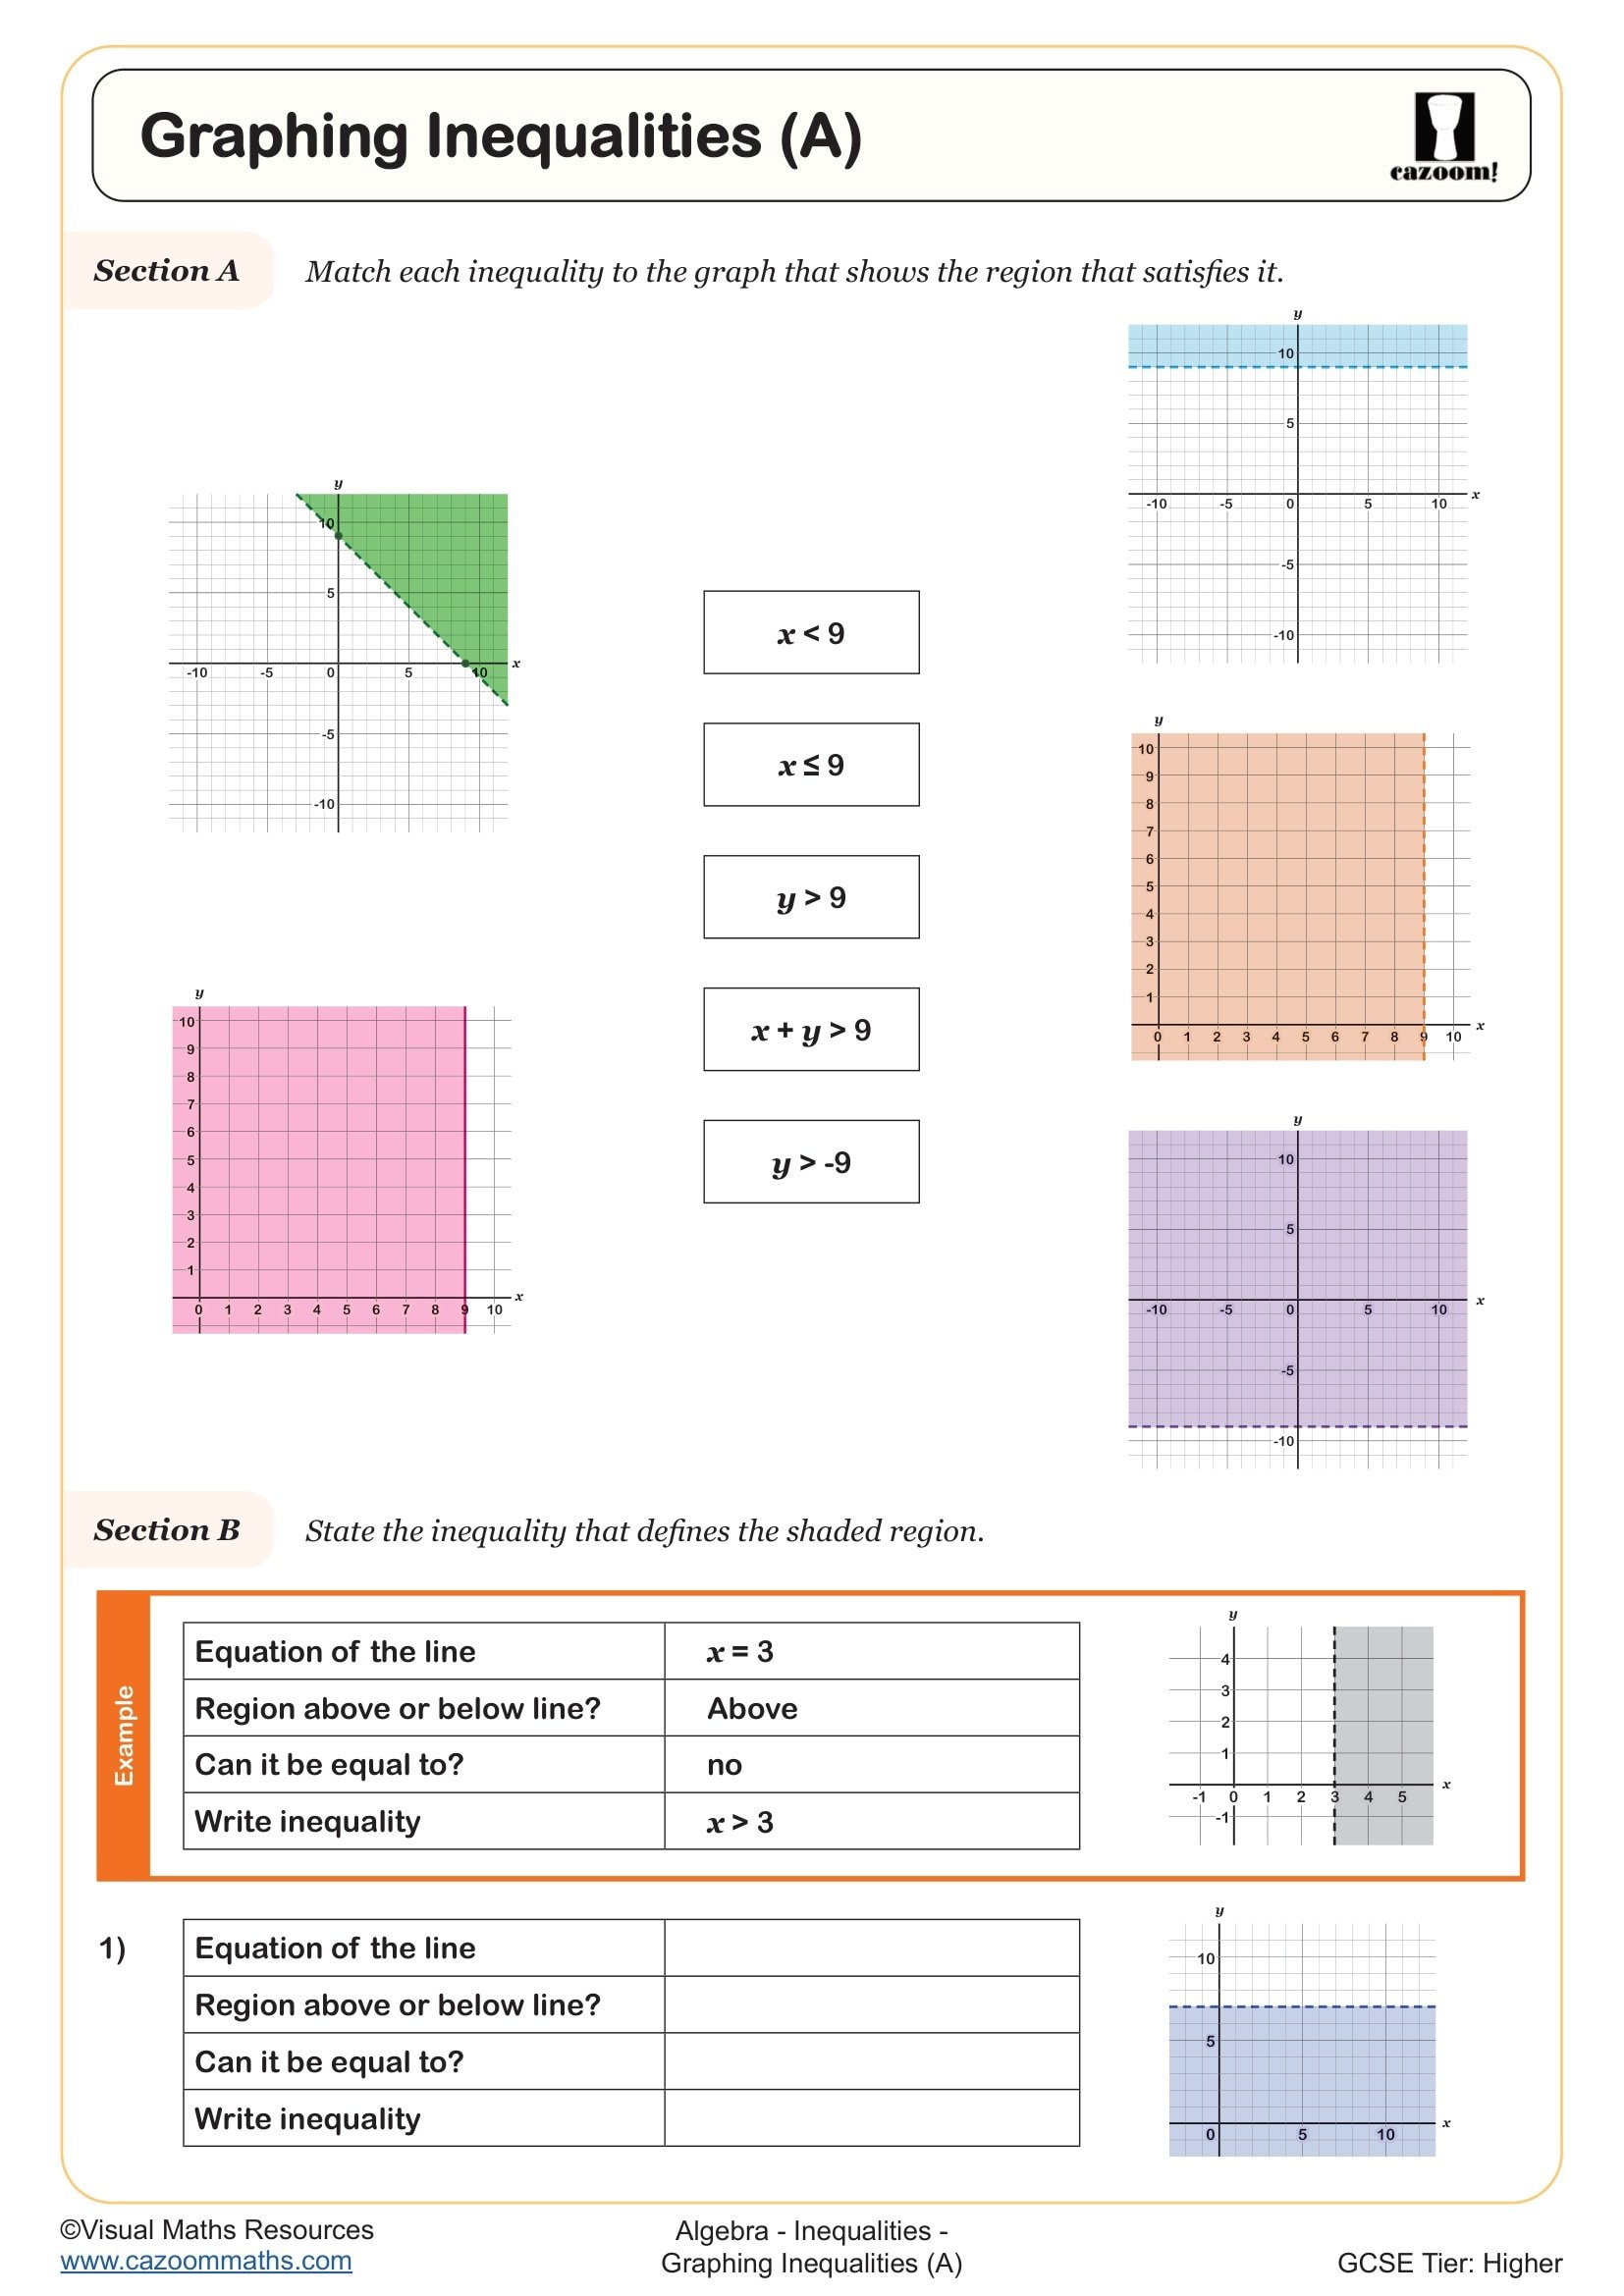
Students will graph single linear inequalities throughout this worksheet.
In Section A learners are reminded to find the equation of line that defines the region and to use a test coordinate inside the region to determine the inequality. Aftering seeing an example they will repeat this process over five questions.
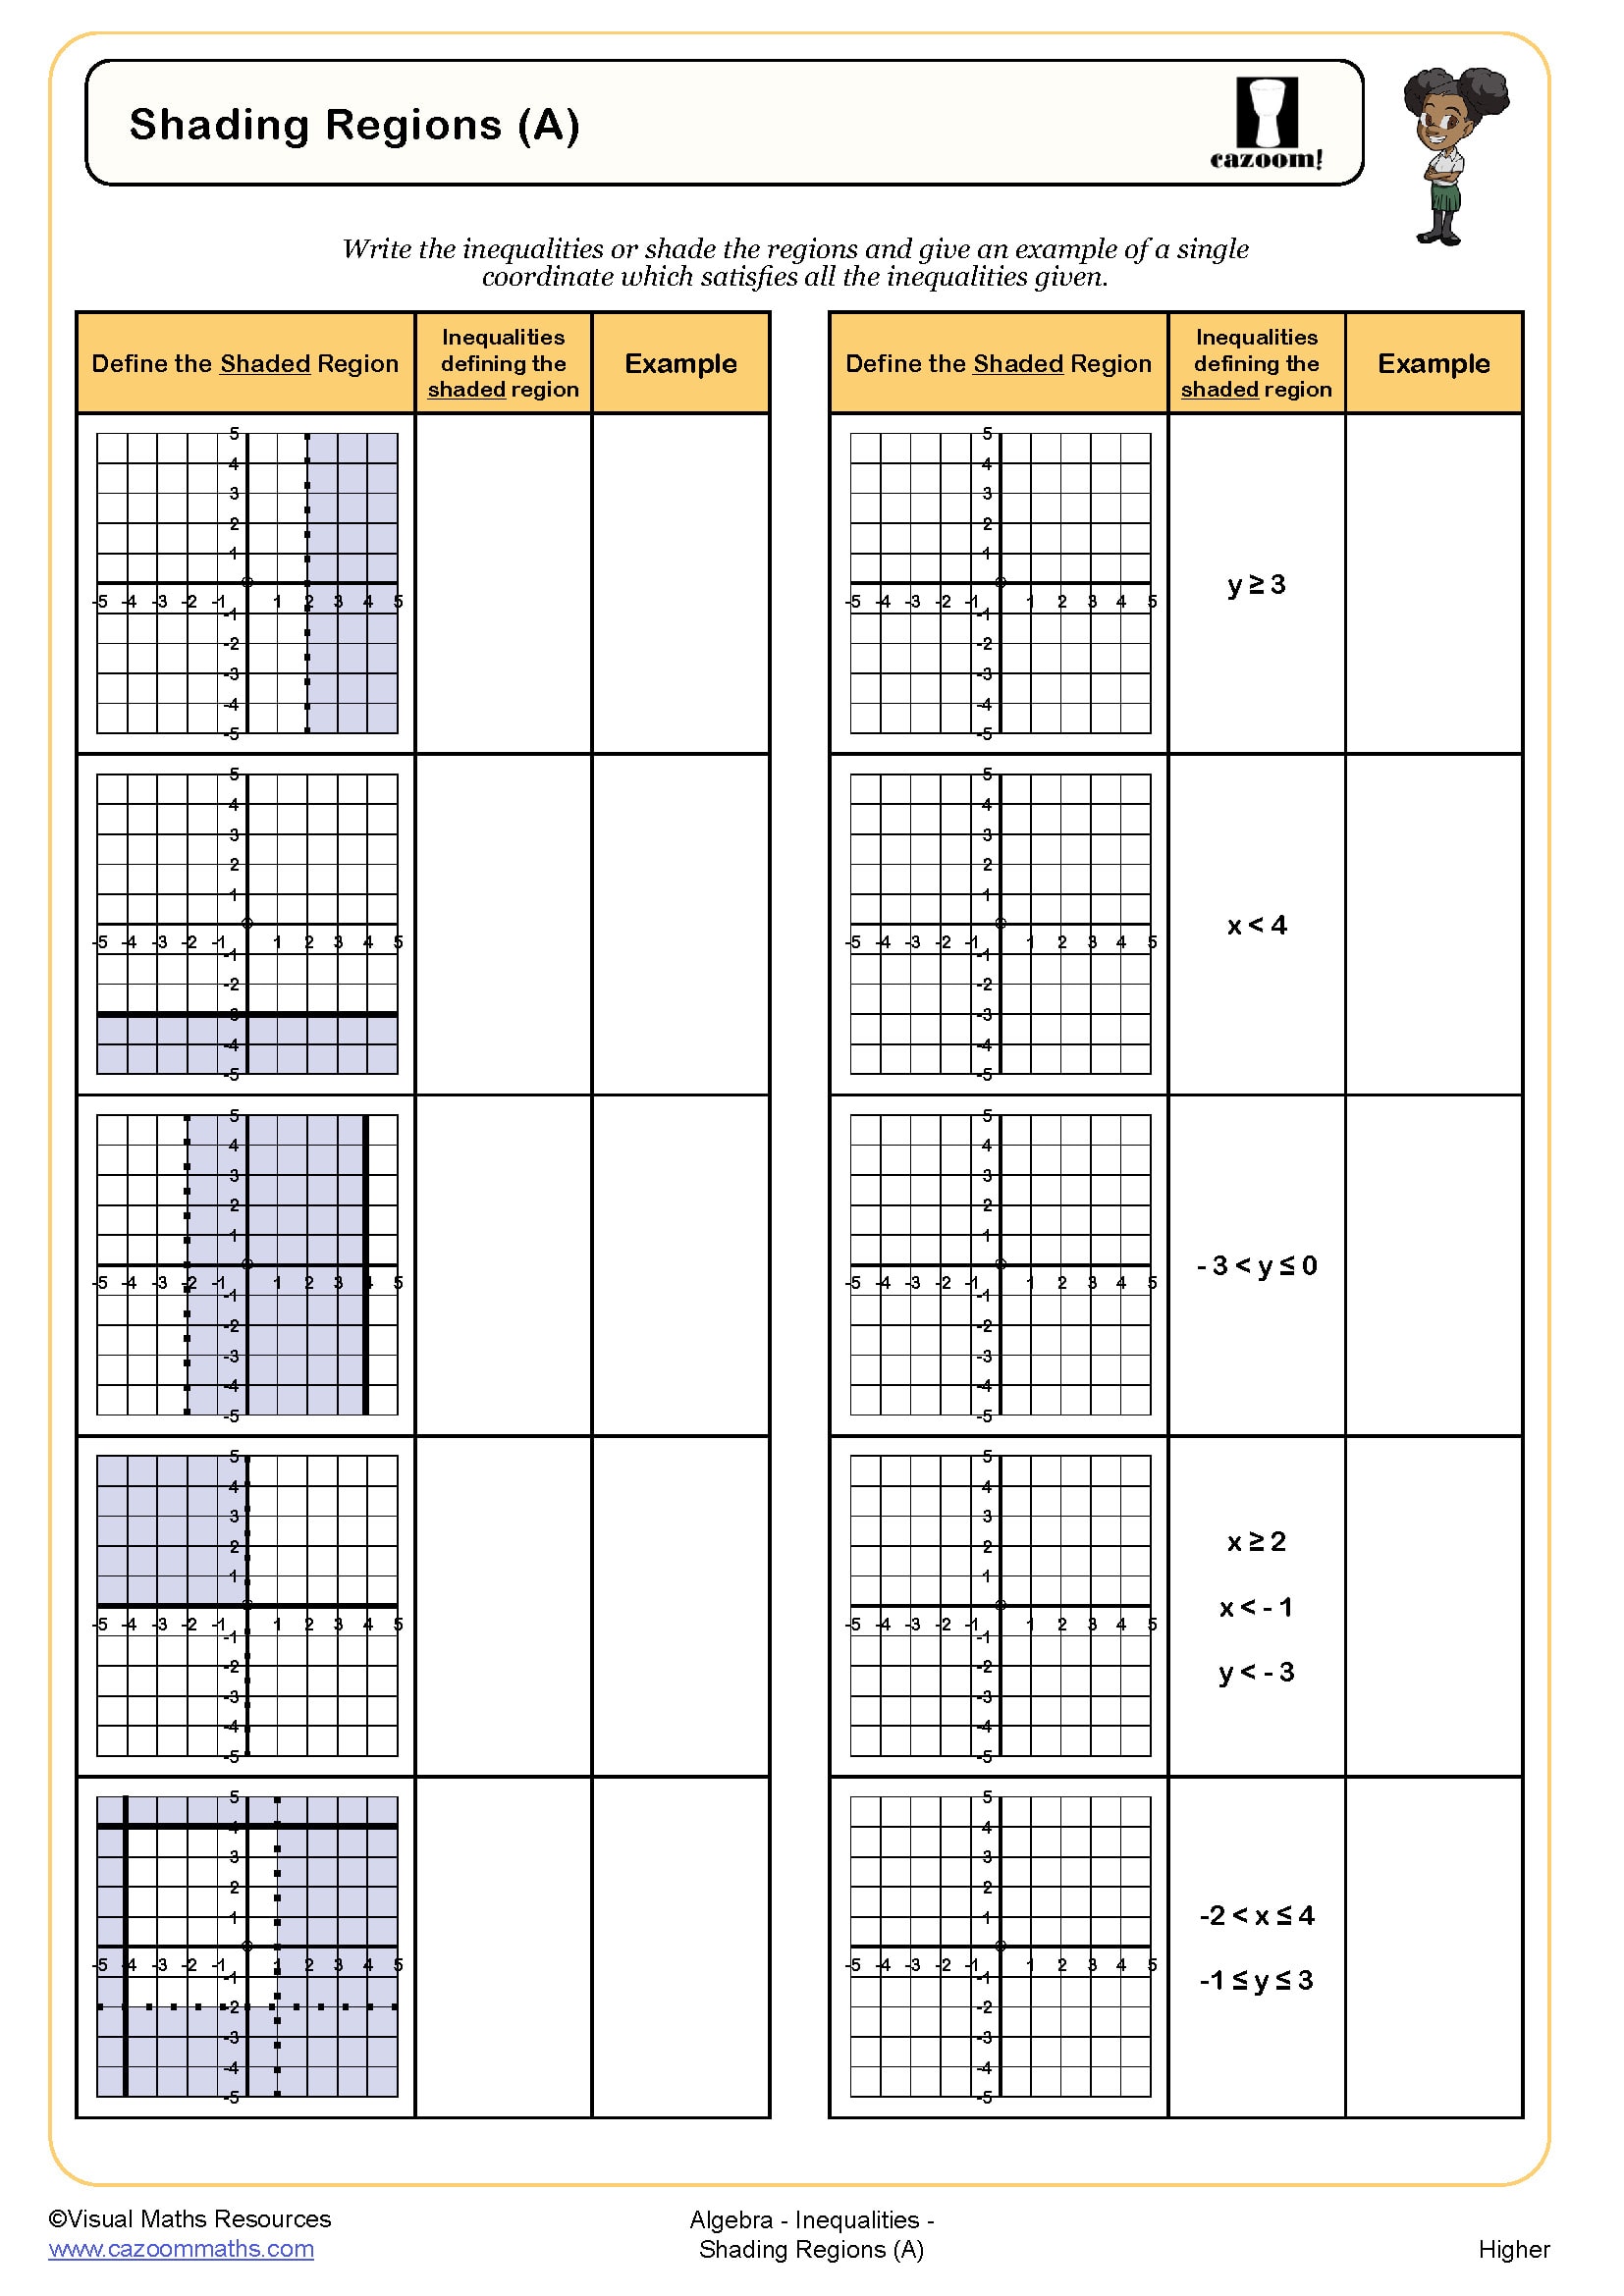
Next pupils are asked to graph nine different linear inequalities on separate pre-drawn coordinate grids in Section B. Students are required to plot graphs in the form y = mx + c with positive and negative values of m and c before using a test coordinate again to choose the region that satisfies the inequality.
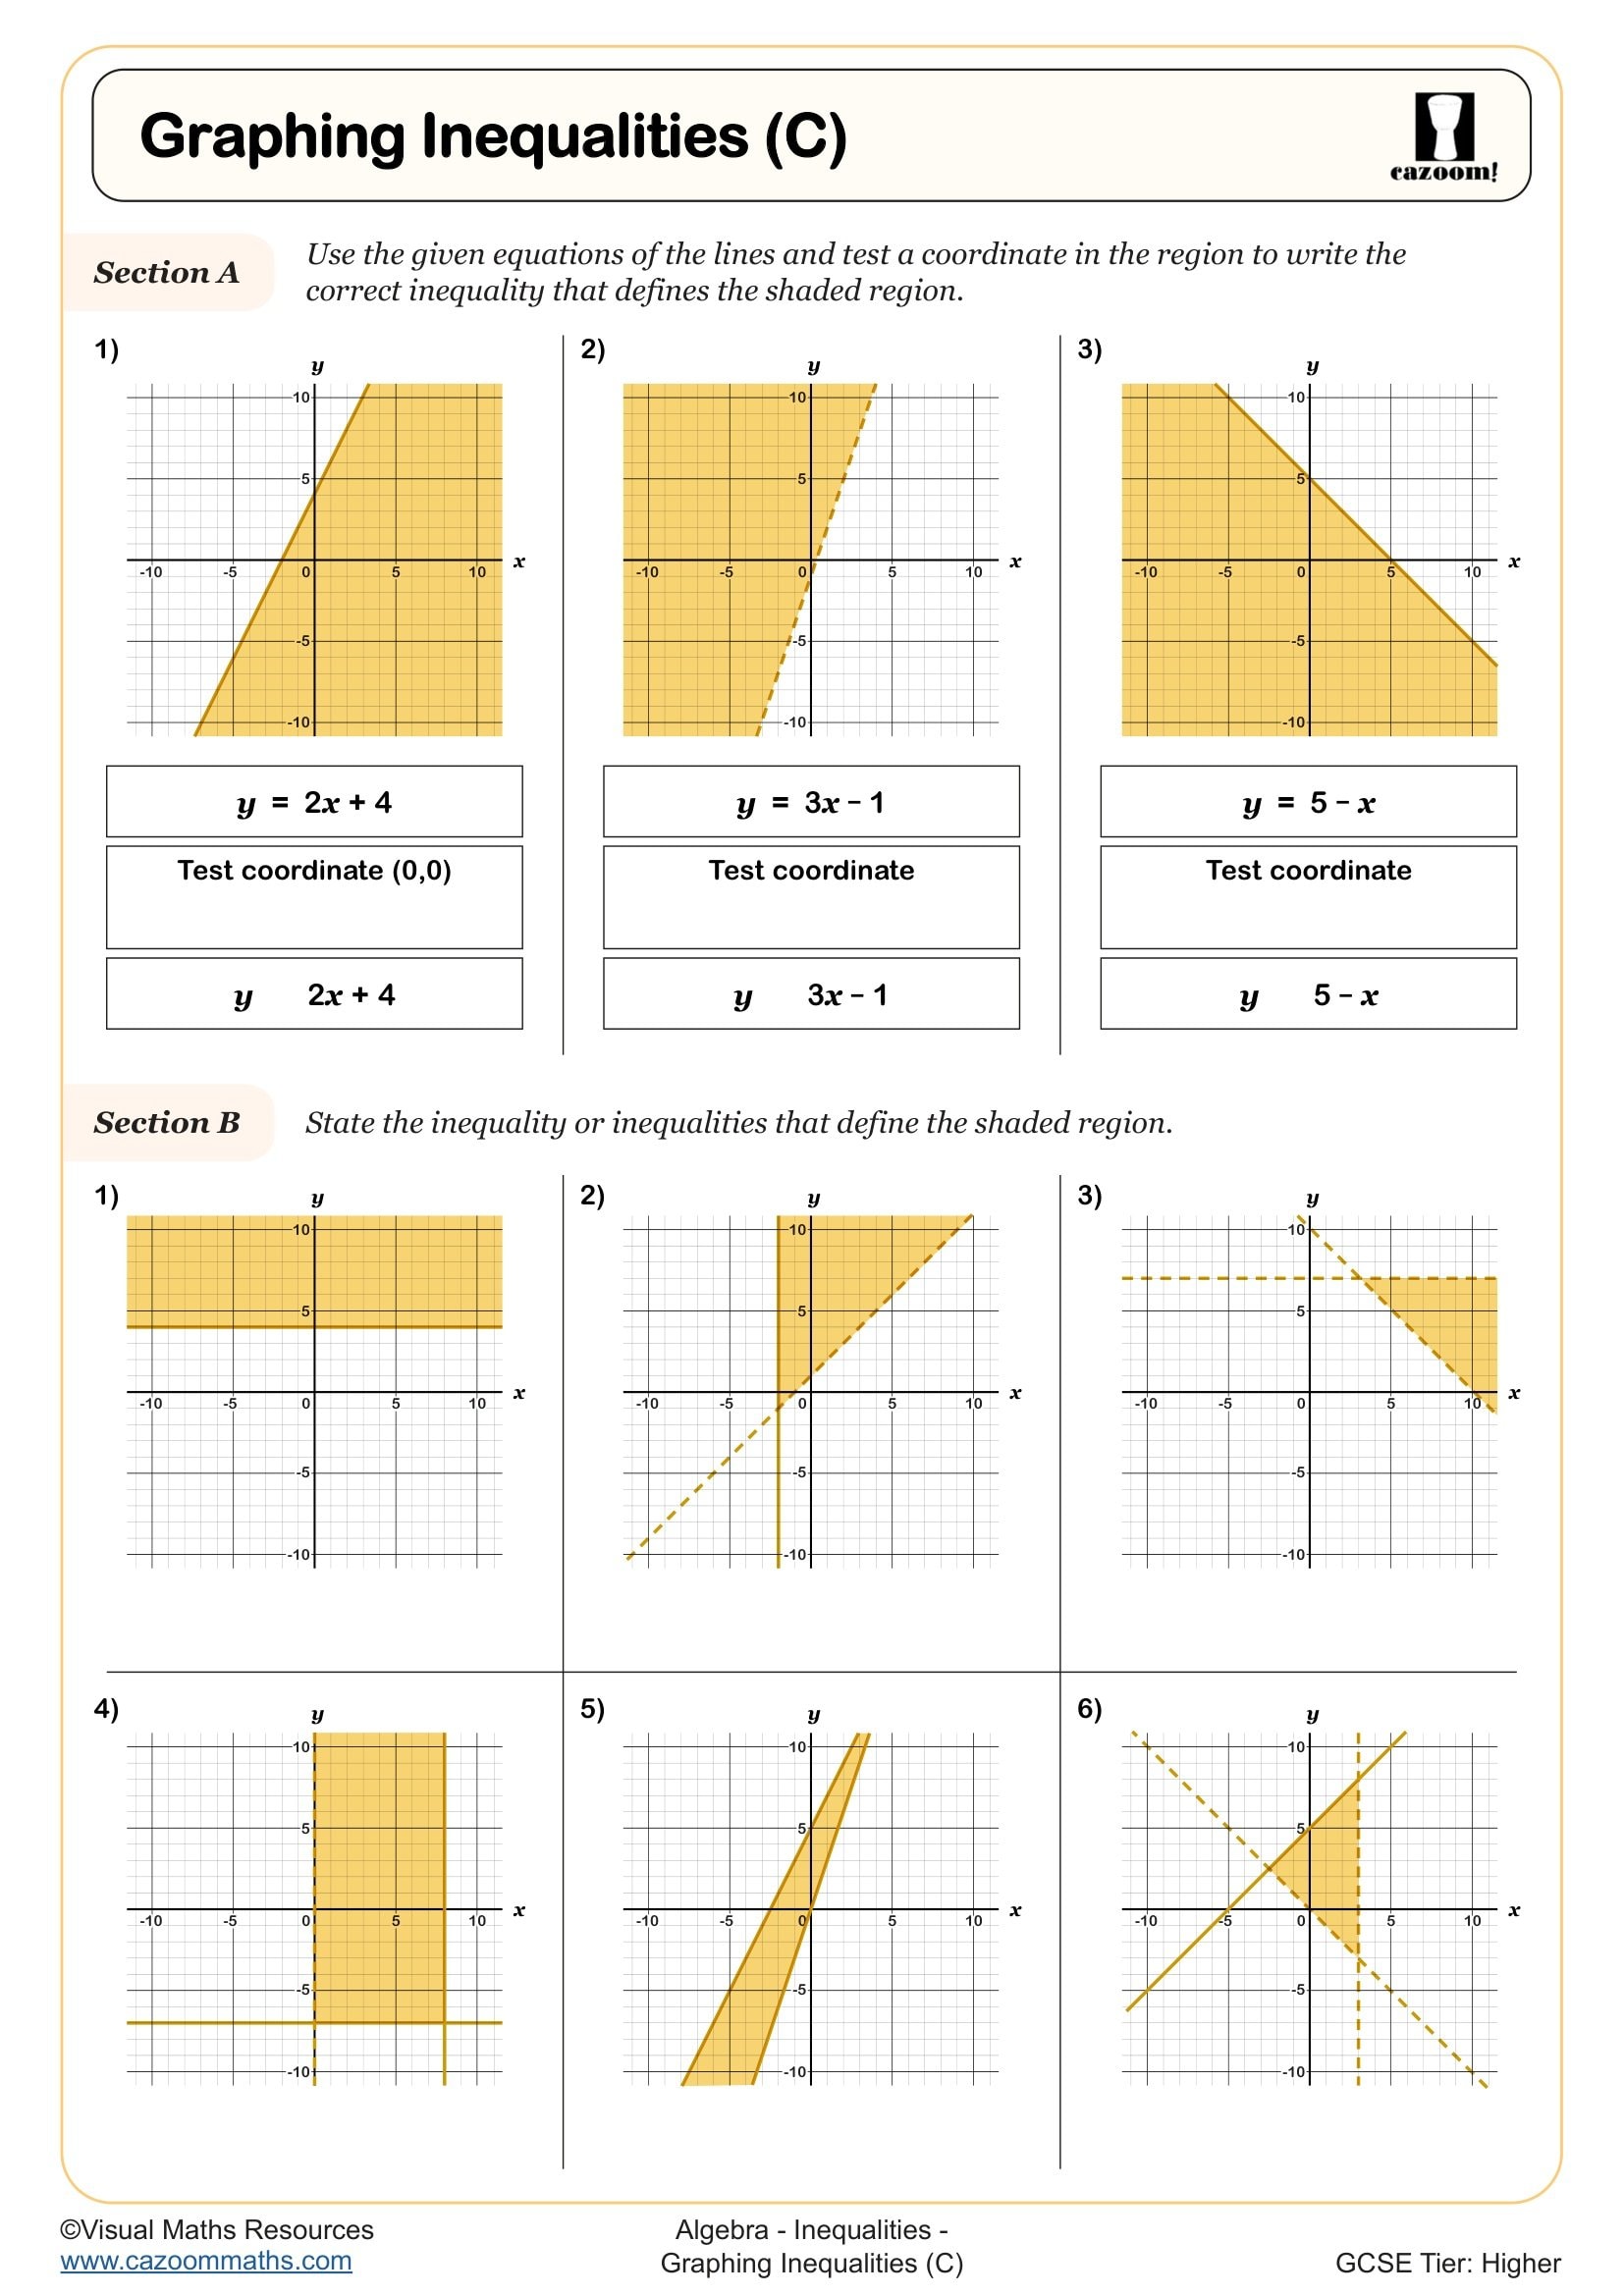
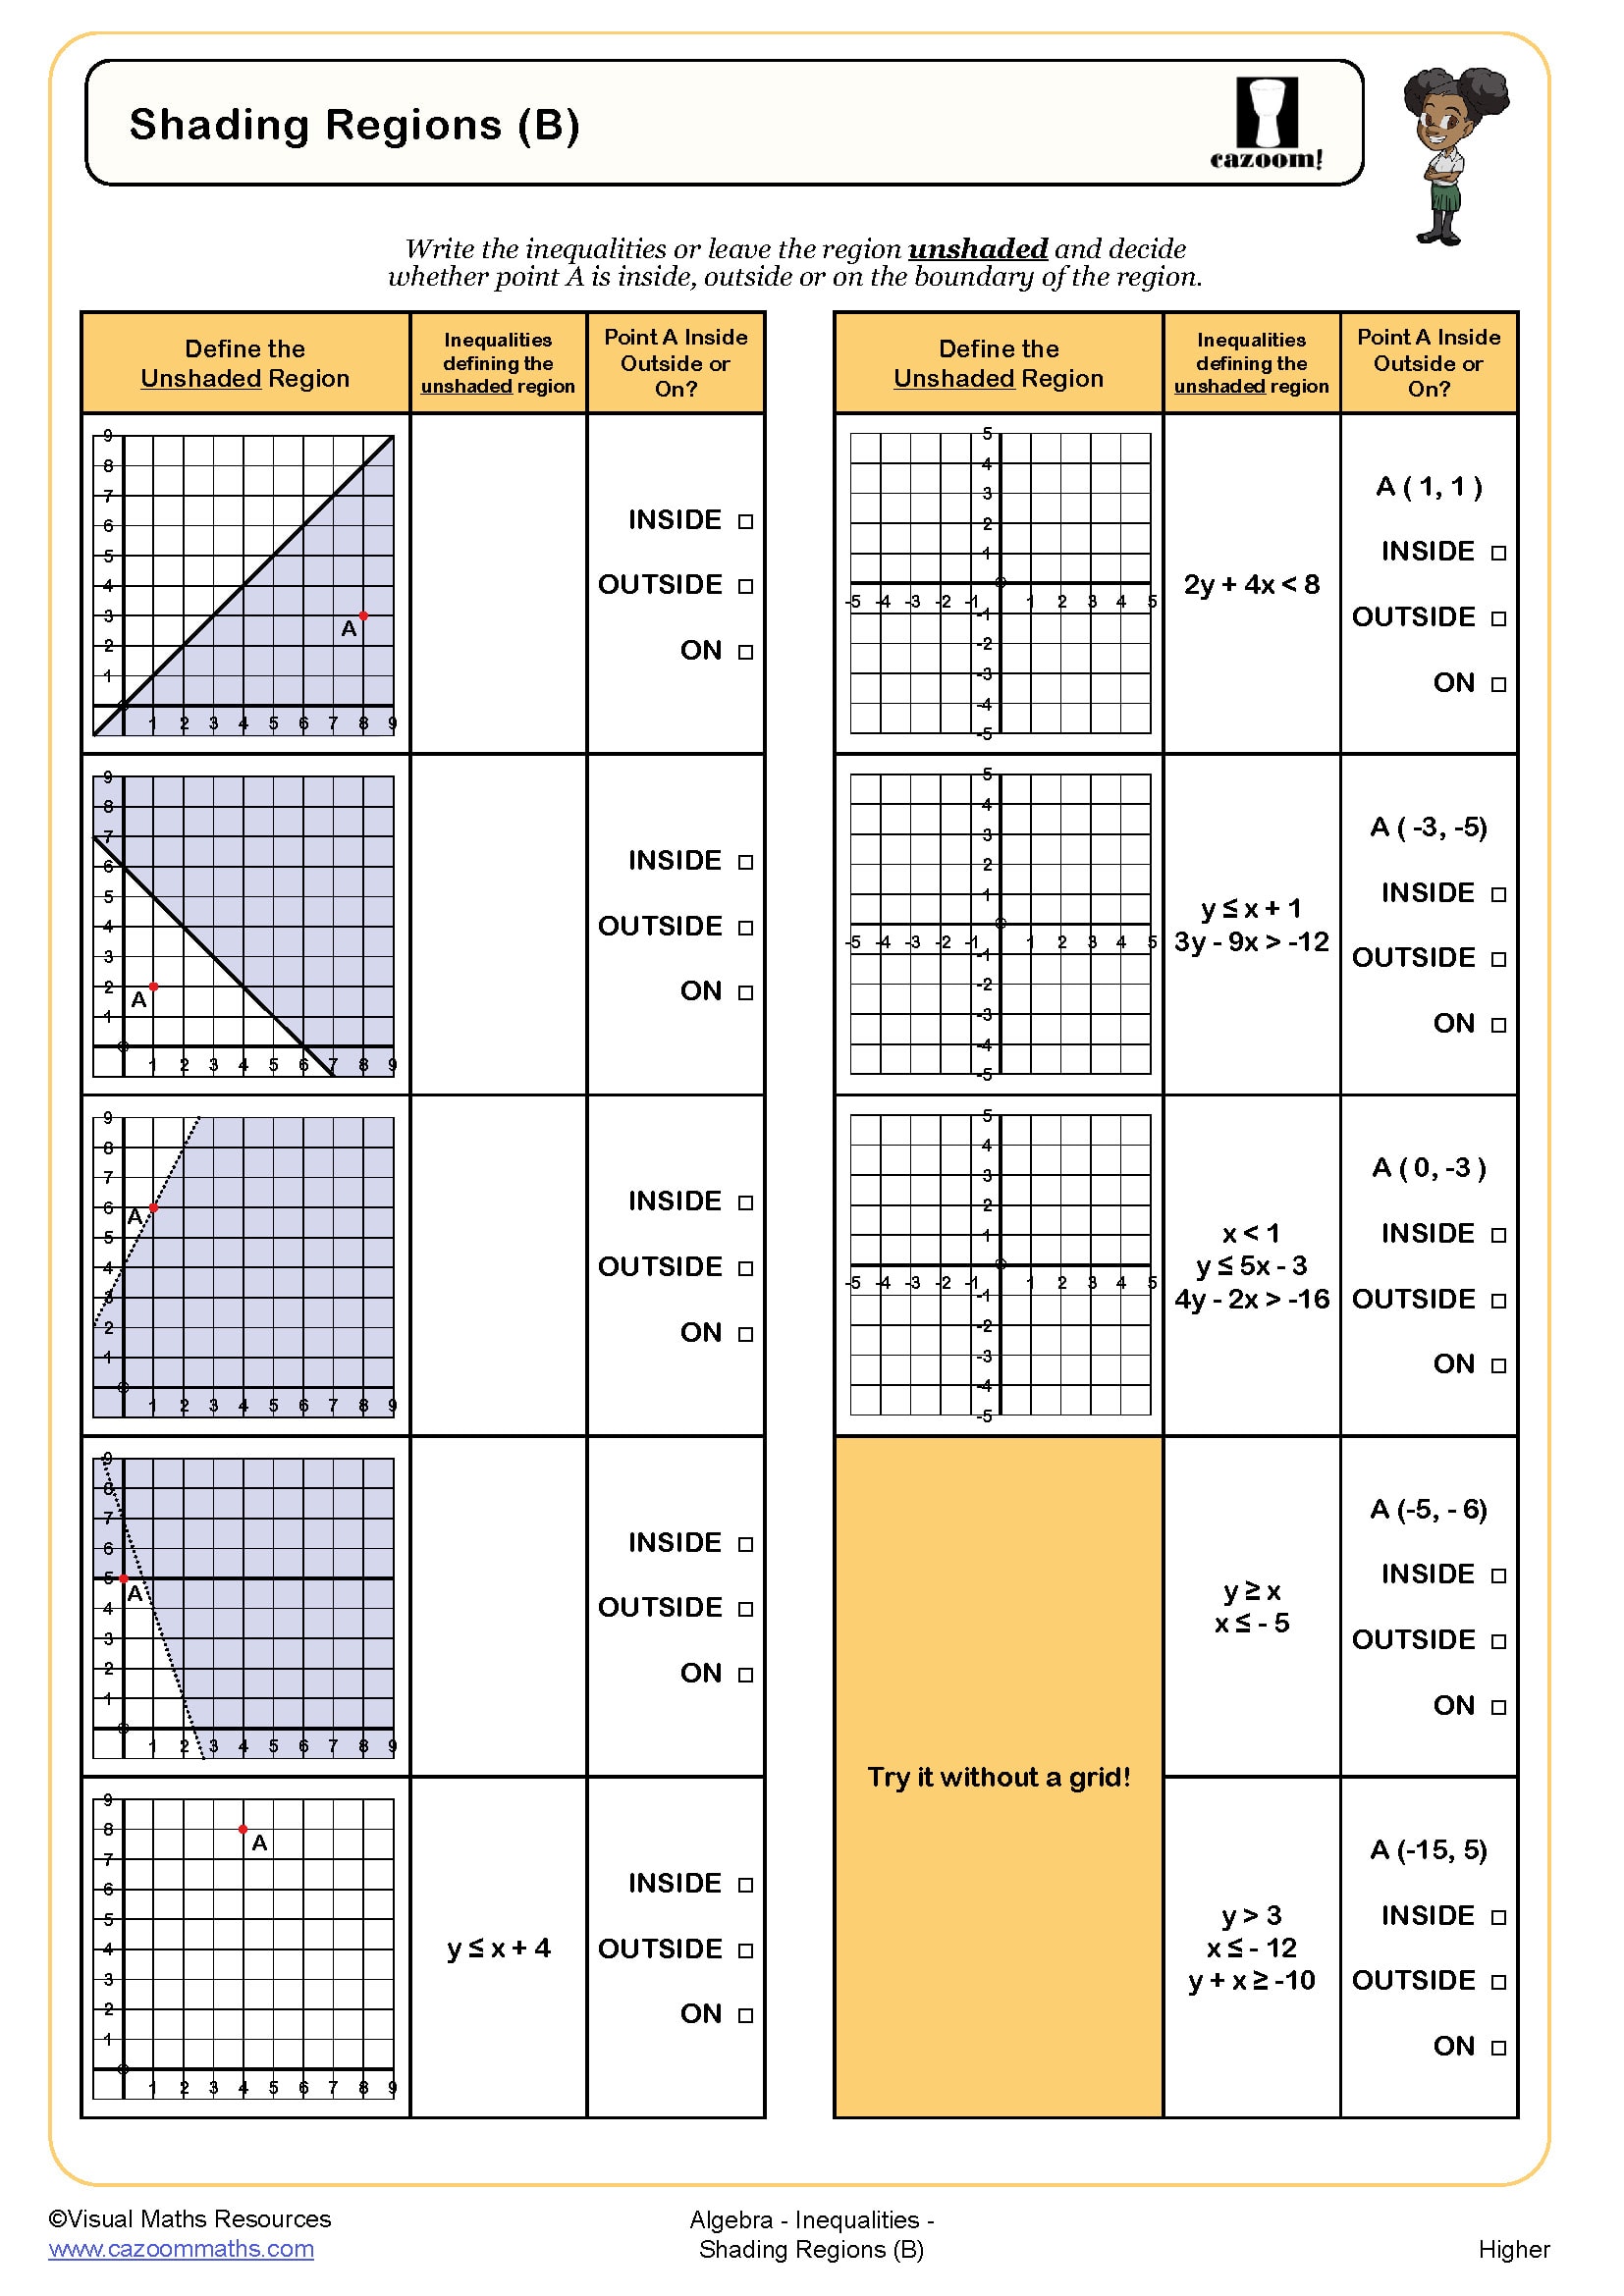
Need an extra challenge? Check out Graphing Inequalities (C) which sees learners defining regions determined by two or three inequalities.
All worksheets are created by the team of experienced teachers at Cazoom Maths.

RELATED TO Graphing Inequalities (B) WORKSHEET
Frequently Asked Questions
Represent inequalities on a graph.