Graphing Inequalities (C) WORKSHEET
Graphing Inequalities (C) WORKSHEET DESCRIPTION
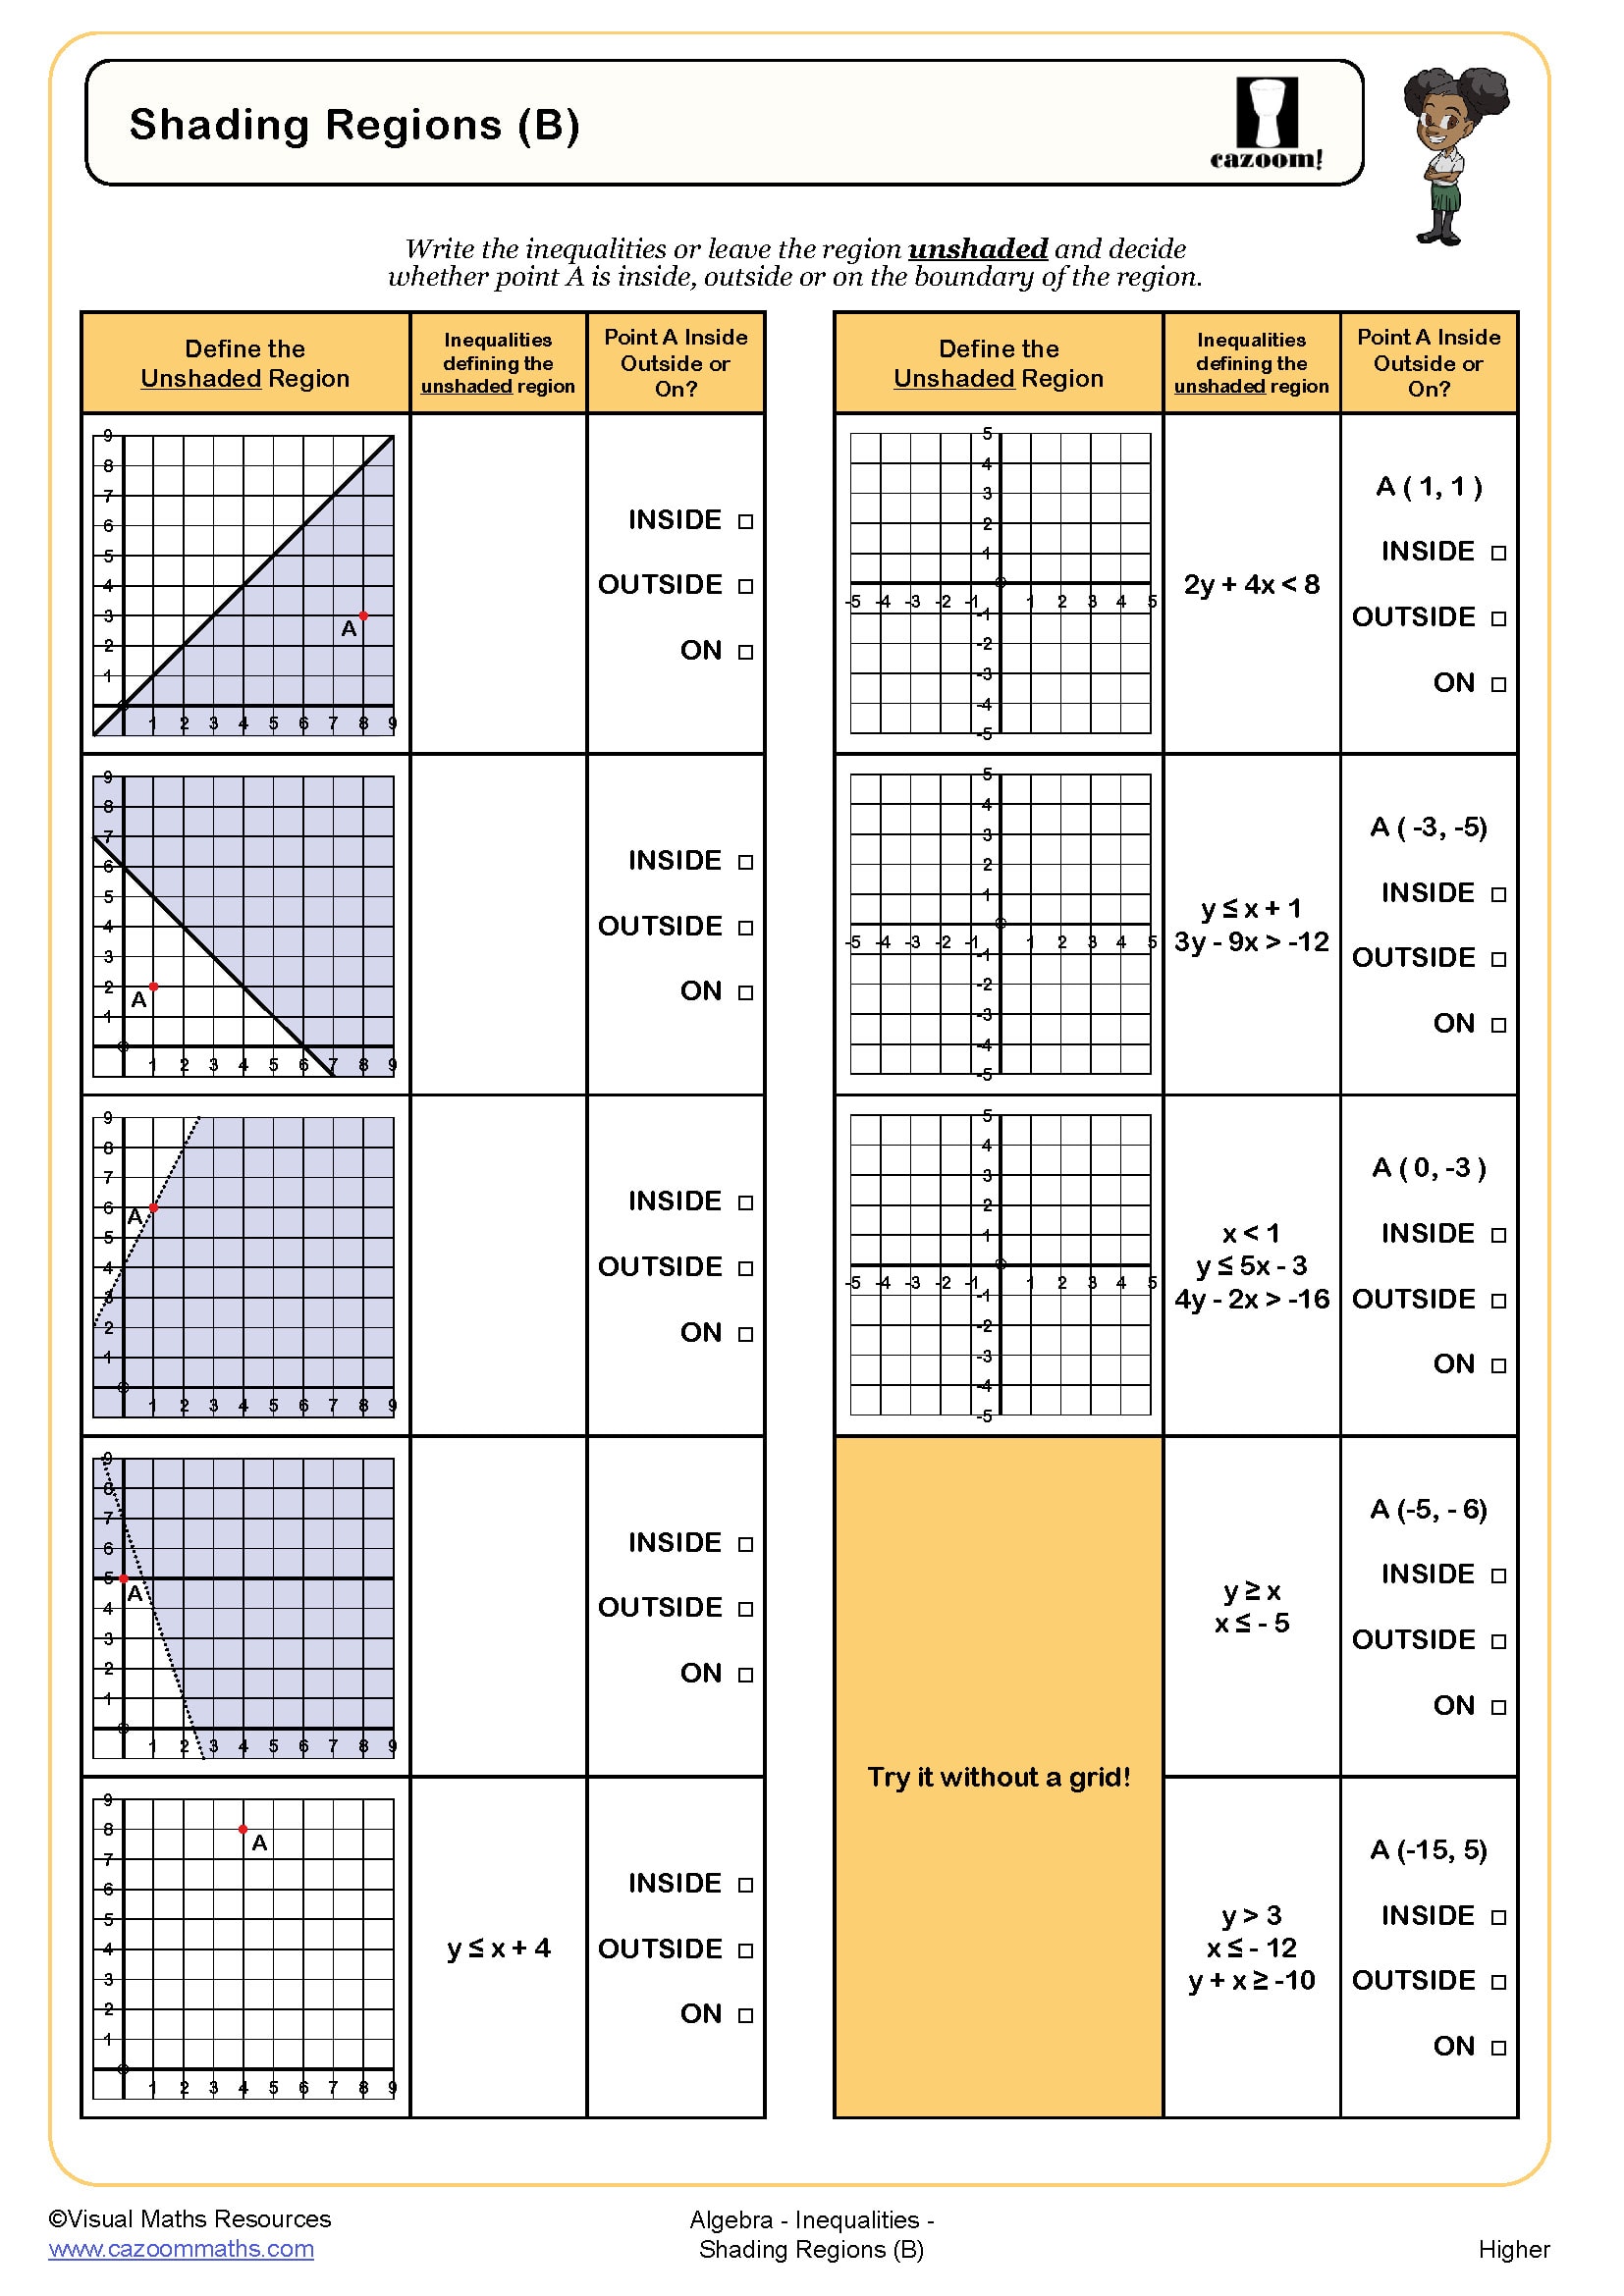
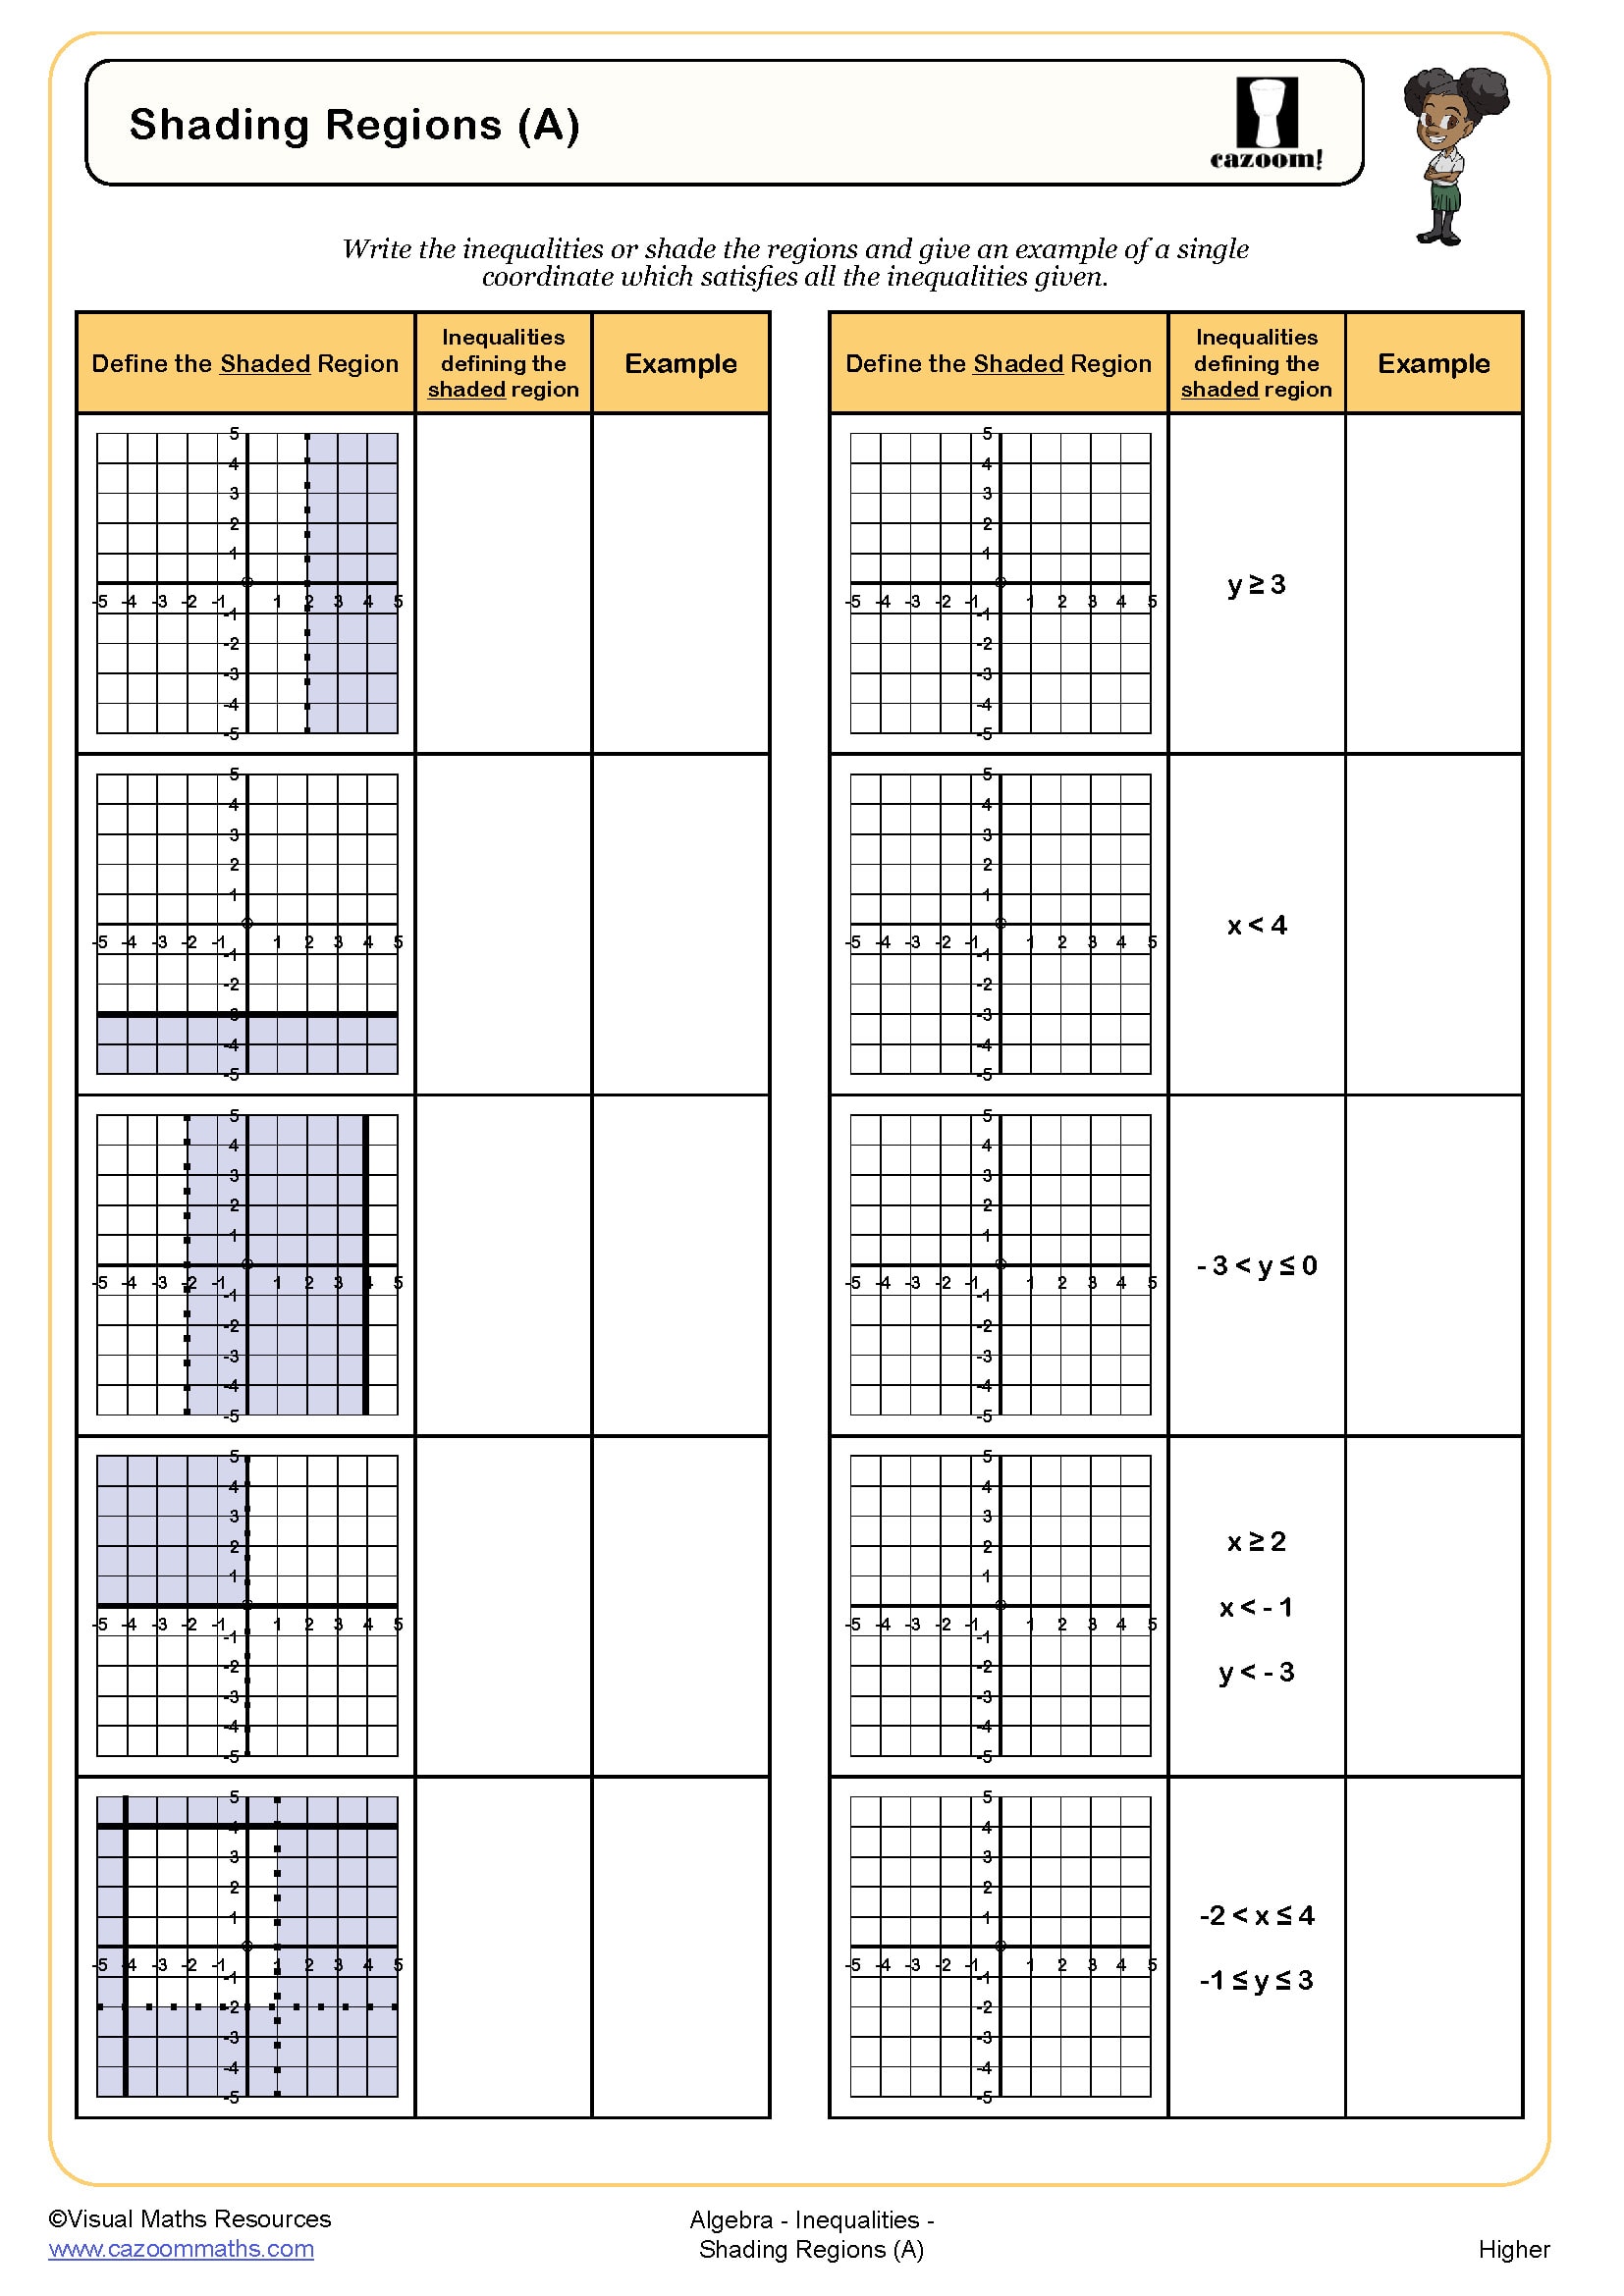
Students will define regions determined by up to three inequalities throughout this worksheet.
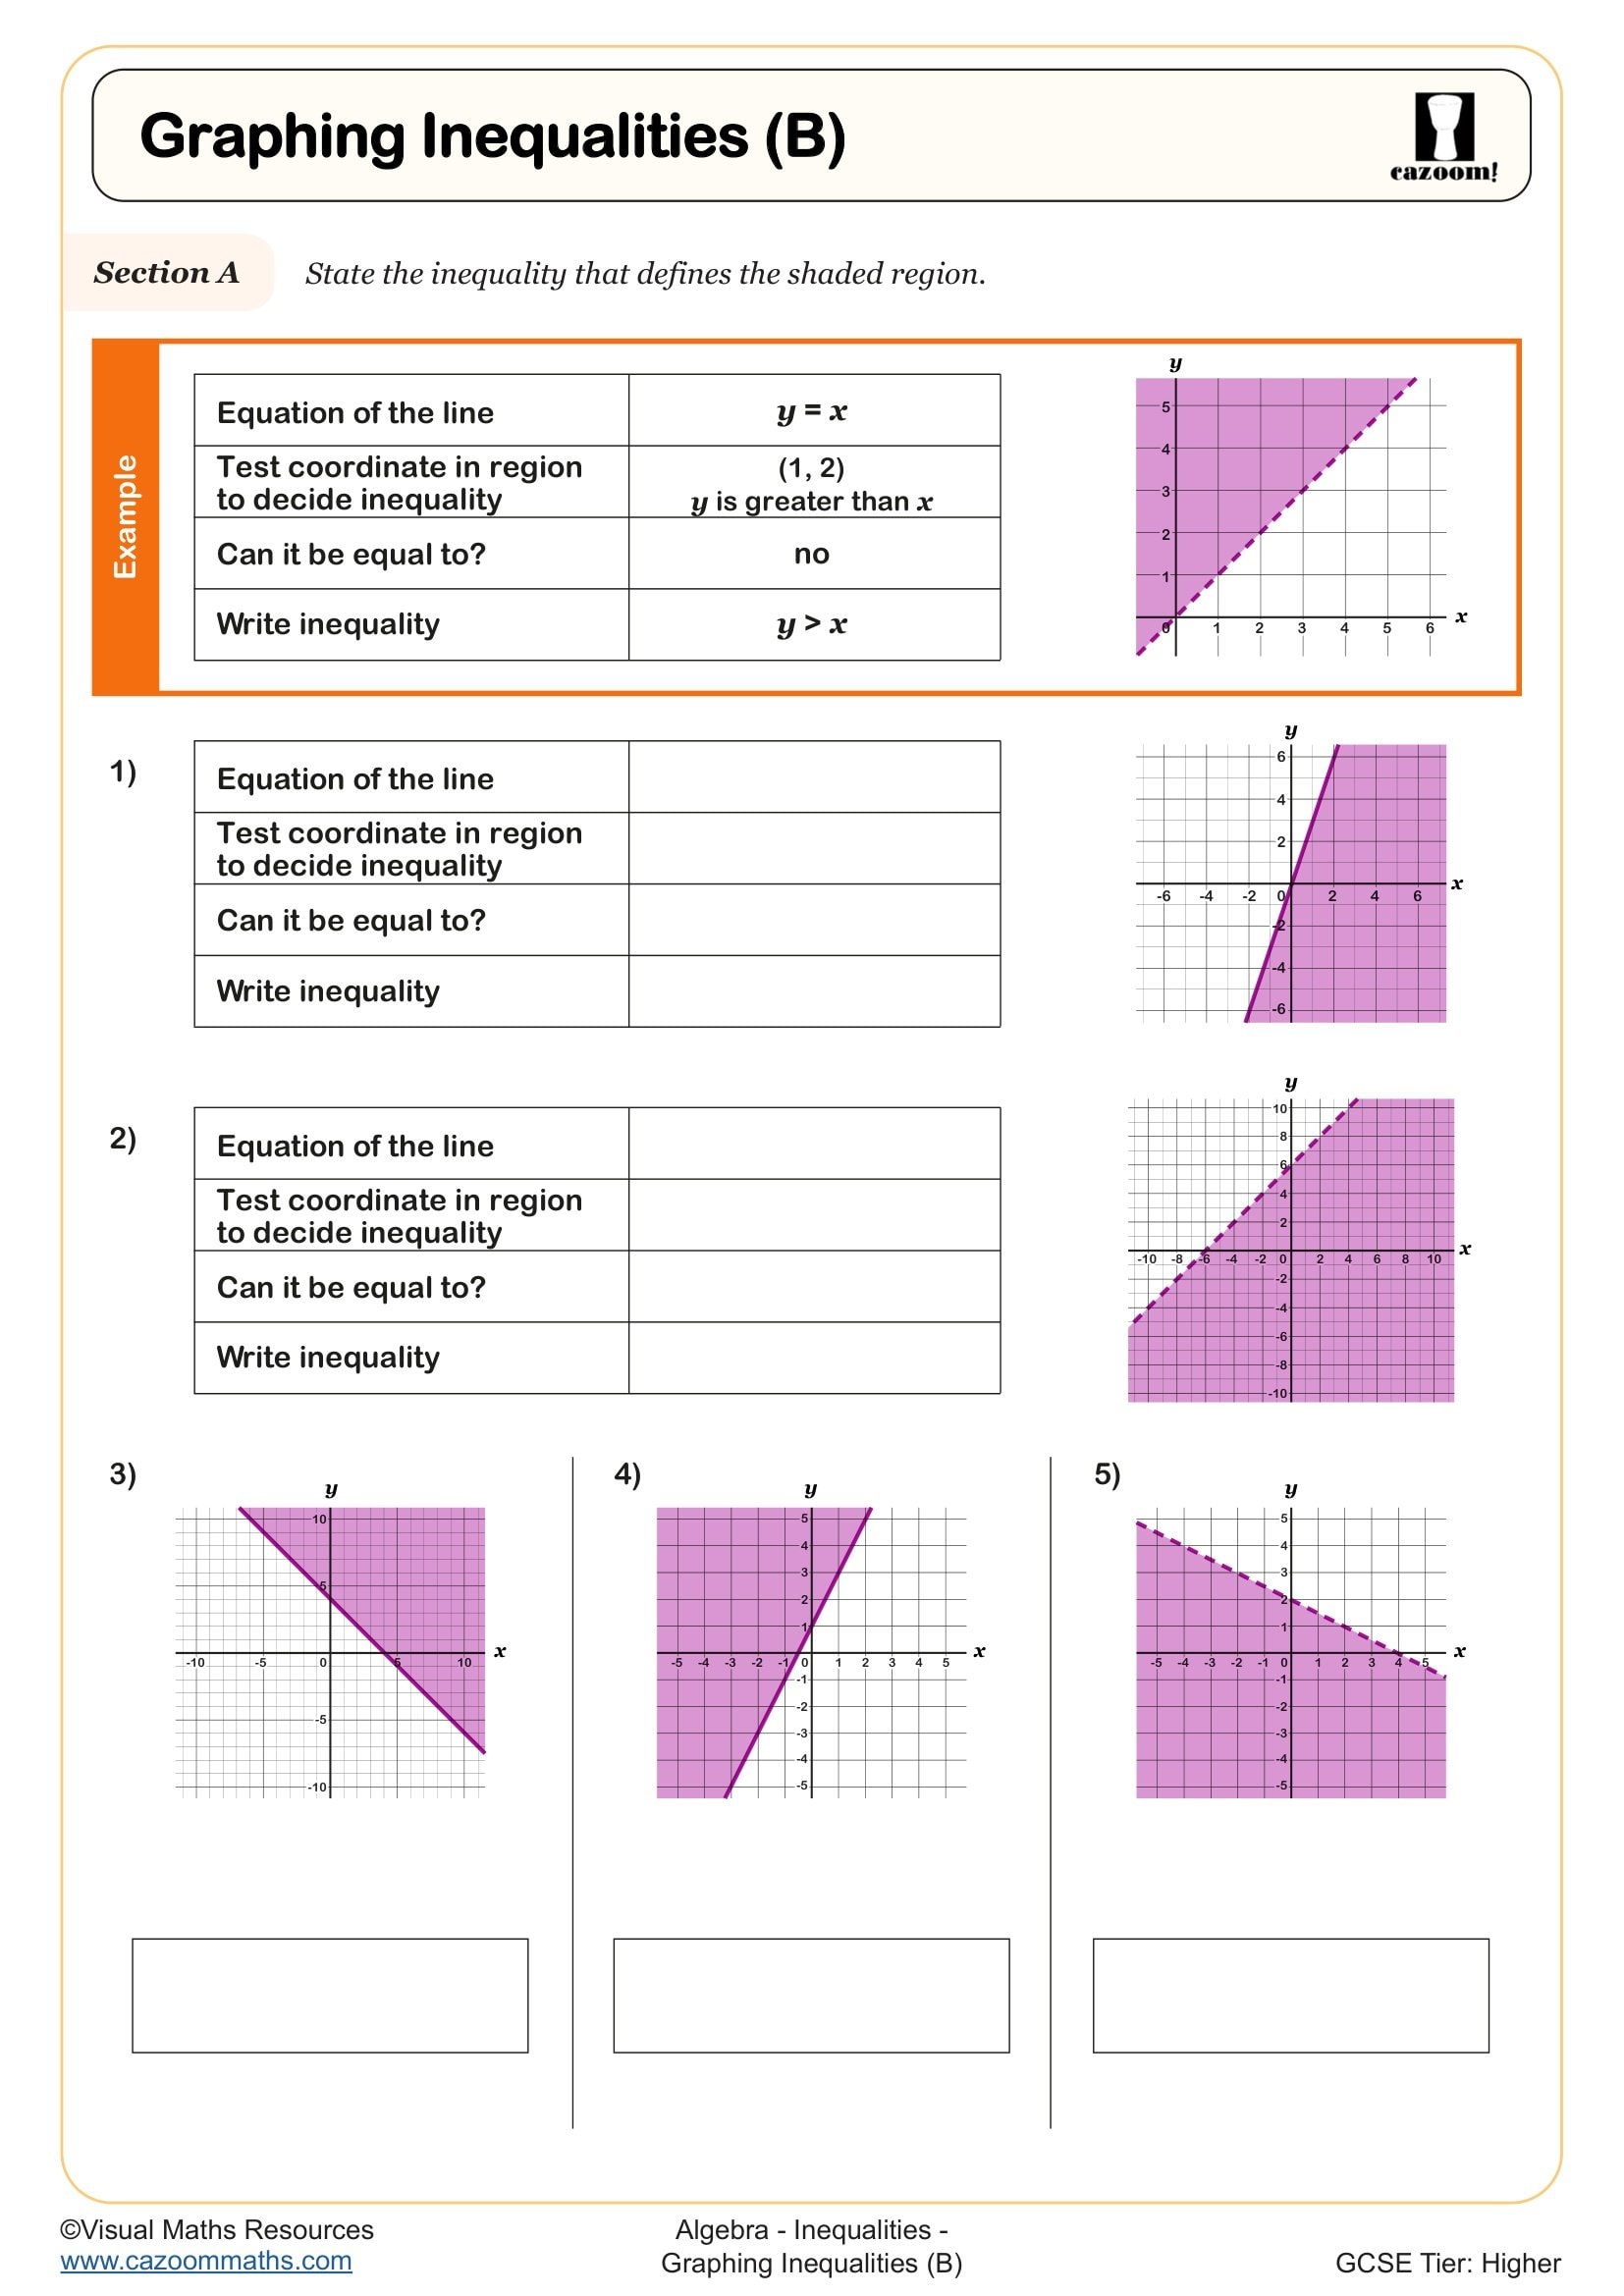
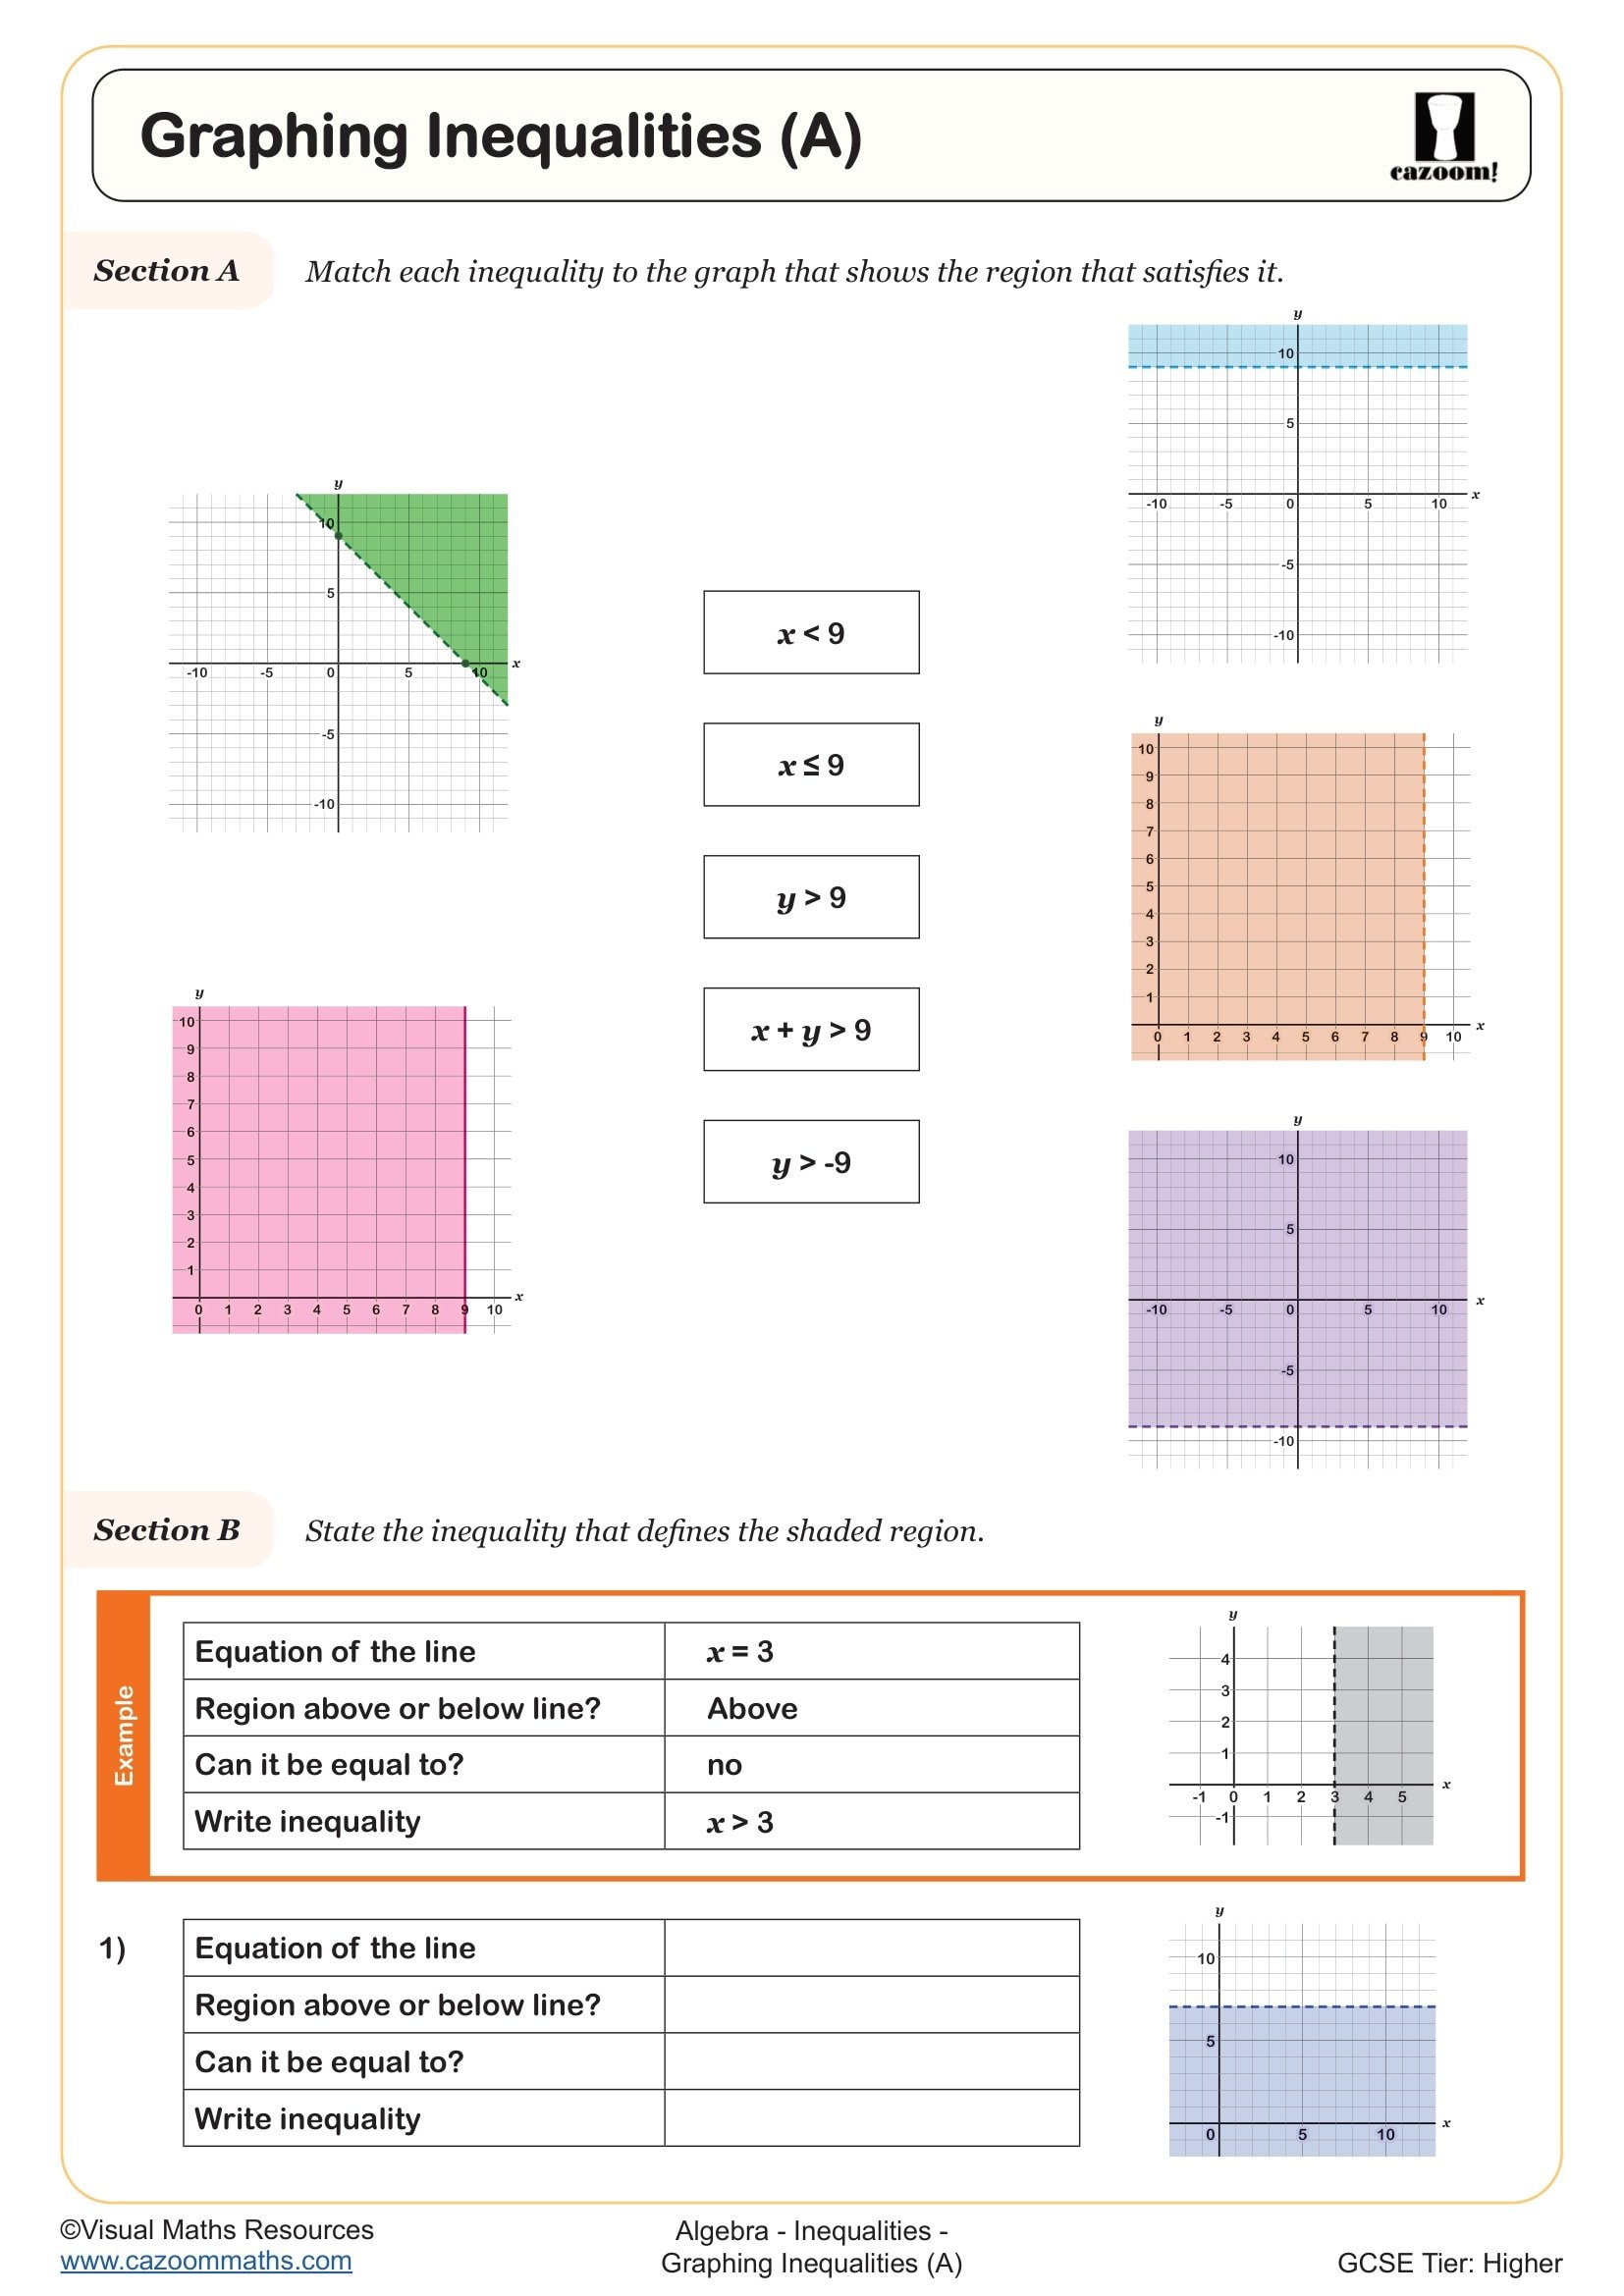
In Section A learners are reminded to use the equations of the straight lines that define the region and to use a test coordinate inside the region to determine the inequality.
Section B requires students to state the inequality or inequalities that define the shaded region. Here regions are bound by 1, 2 or 3 linear inequalities.
Lastly, Section C will see pupils plotting straight lines and shading regions which satisfy different inequalities over 6 questions. Students are provided with separate coordinate grids to draw on and again regions are bound by up to three inequalities.
All worksheets are created by the team of experienced teachers at Cazoom Maths.

RELATED TO Graphing Inequalities (C) WORKSHEET
Frequently Asked Questions
Students should be comfortable with substitution into formulae and have a solid understanding of different forms of linear equations. They'll need to recognise equations of lines parallel to the x and y axes, as well as lines in the forms y + x = c and y = mx + c, since these will form the boundaries of the regions they'll be working with.