Histograms (B) WORKSHEET
Histograms (B) WORKSHEET DESCRIPTION
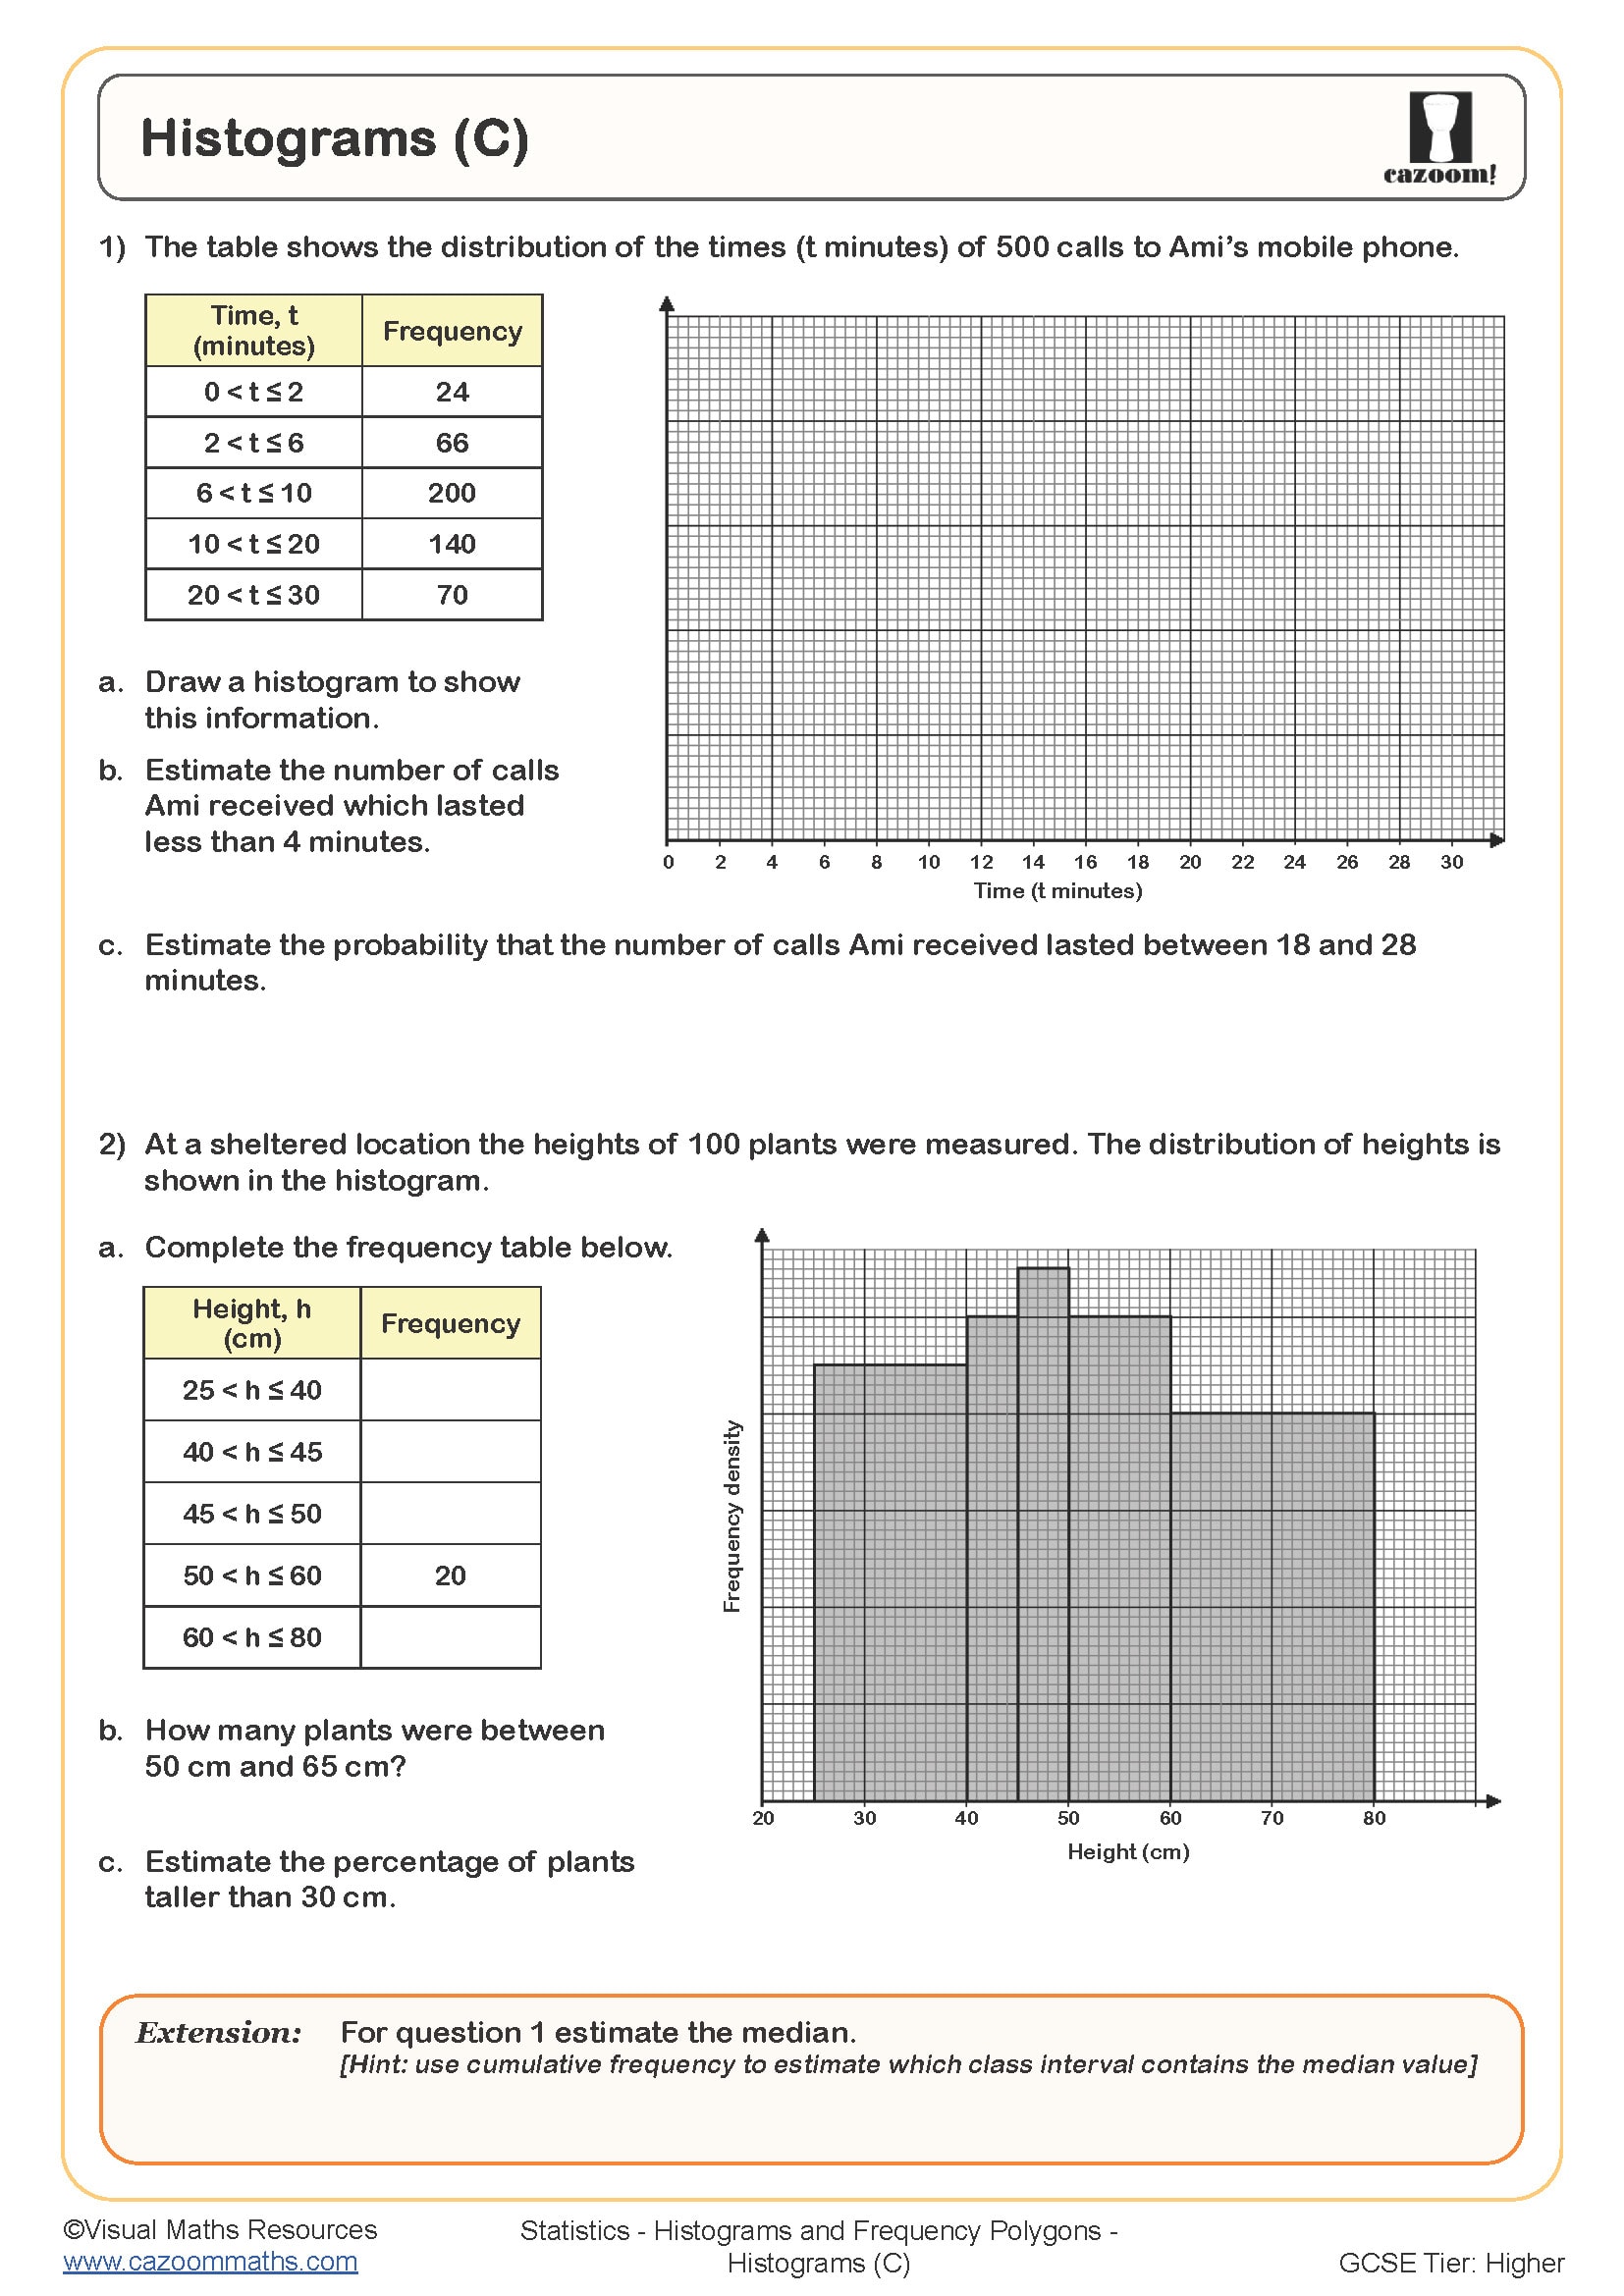
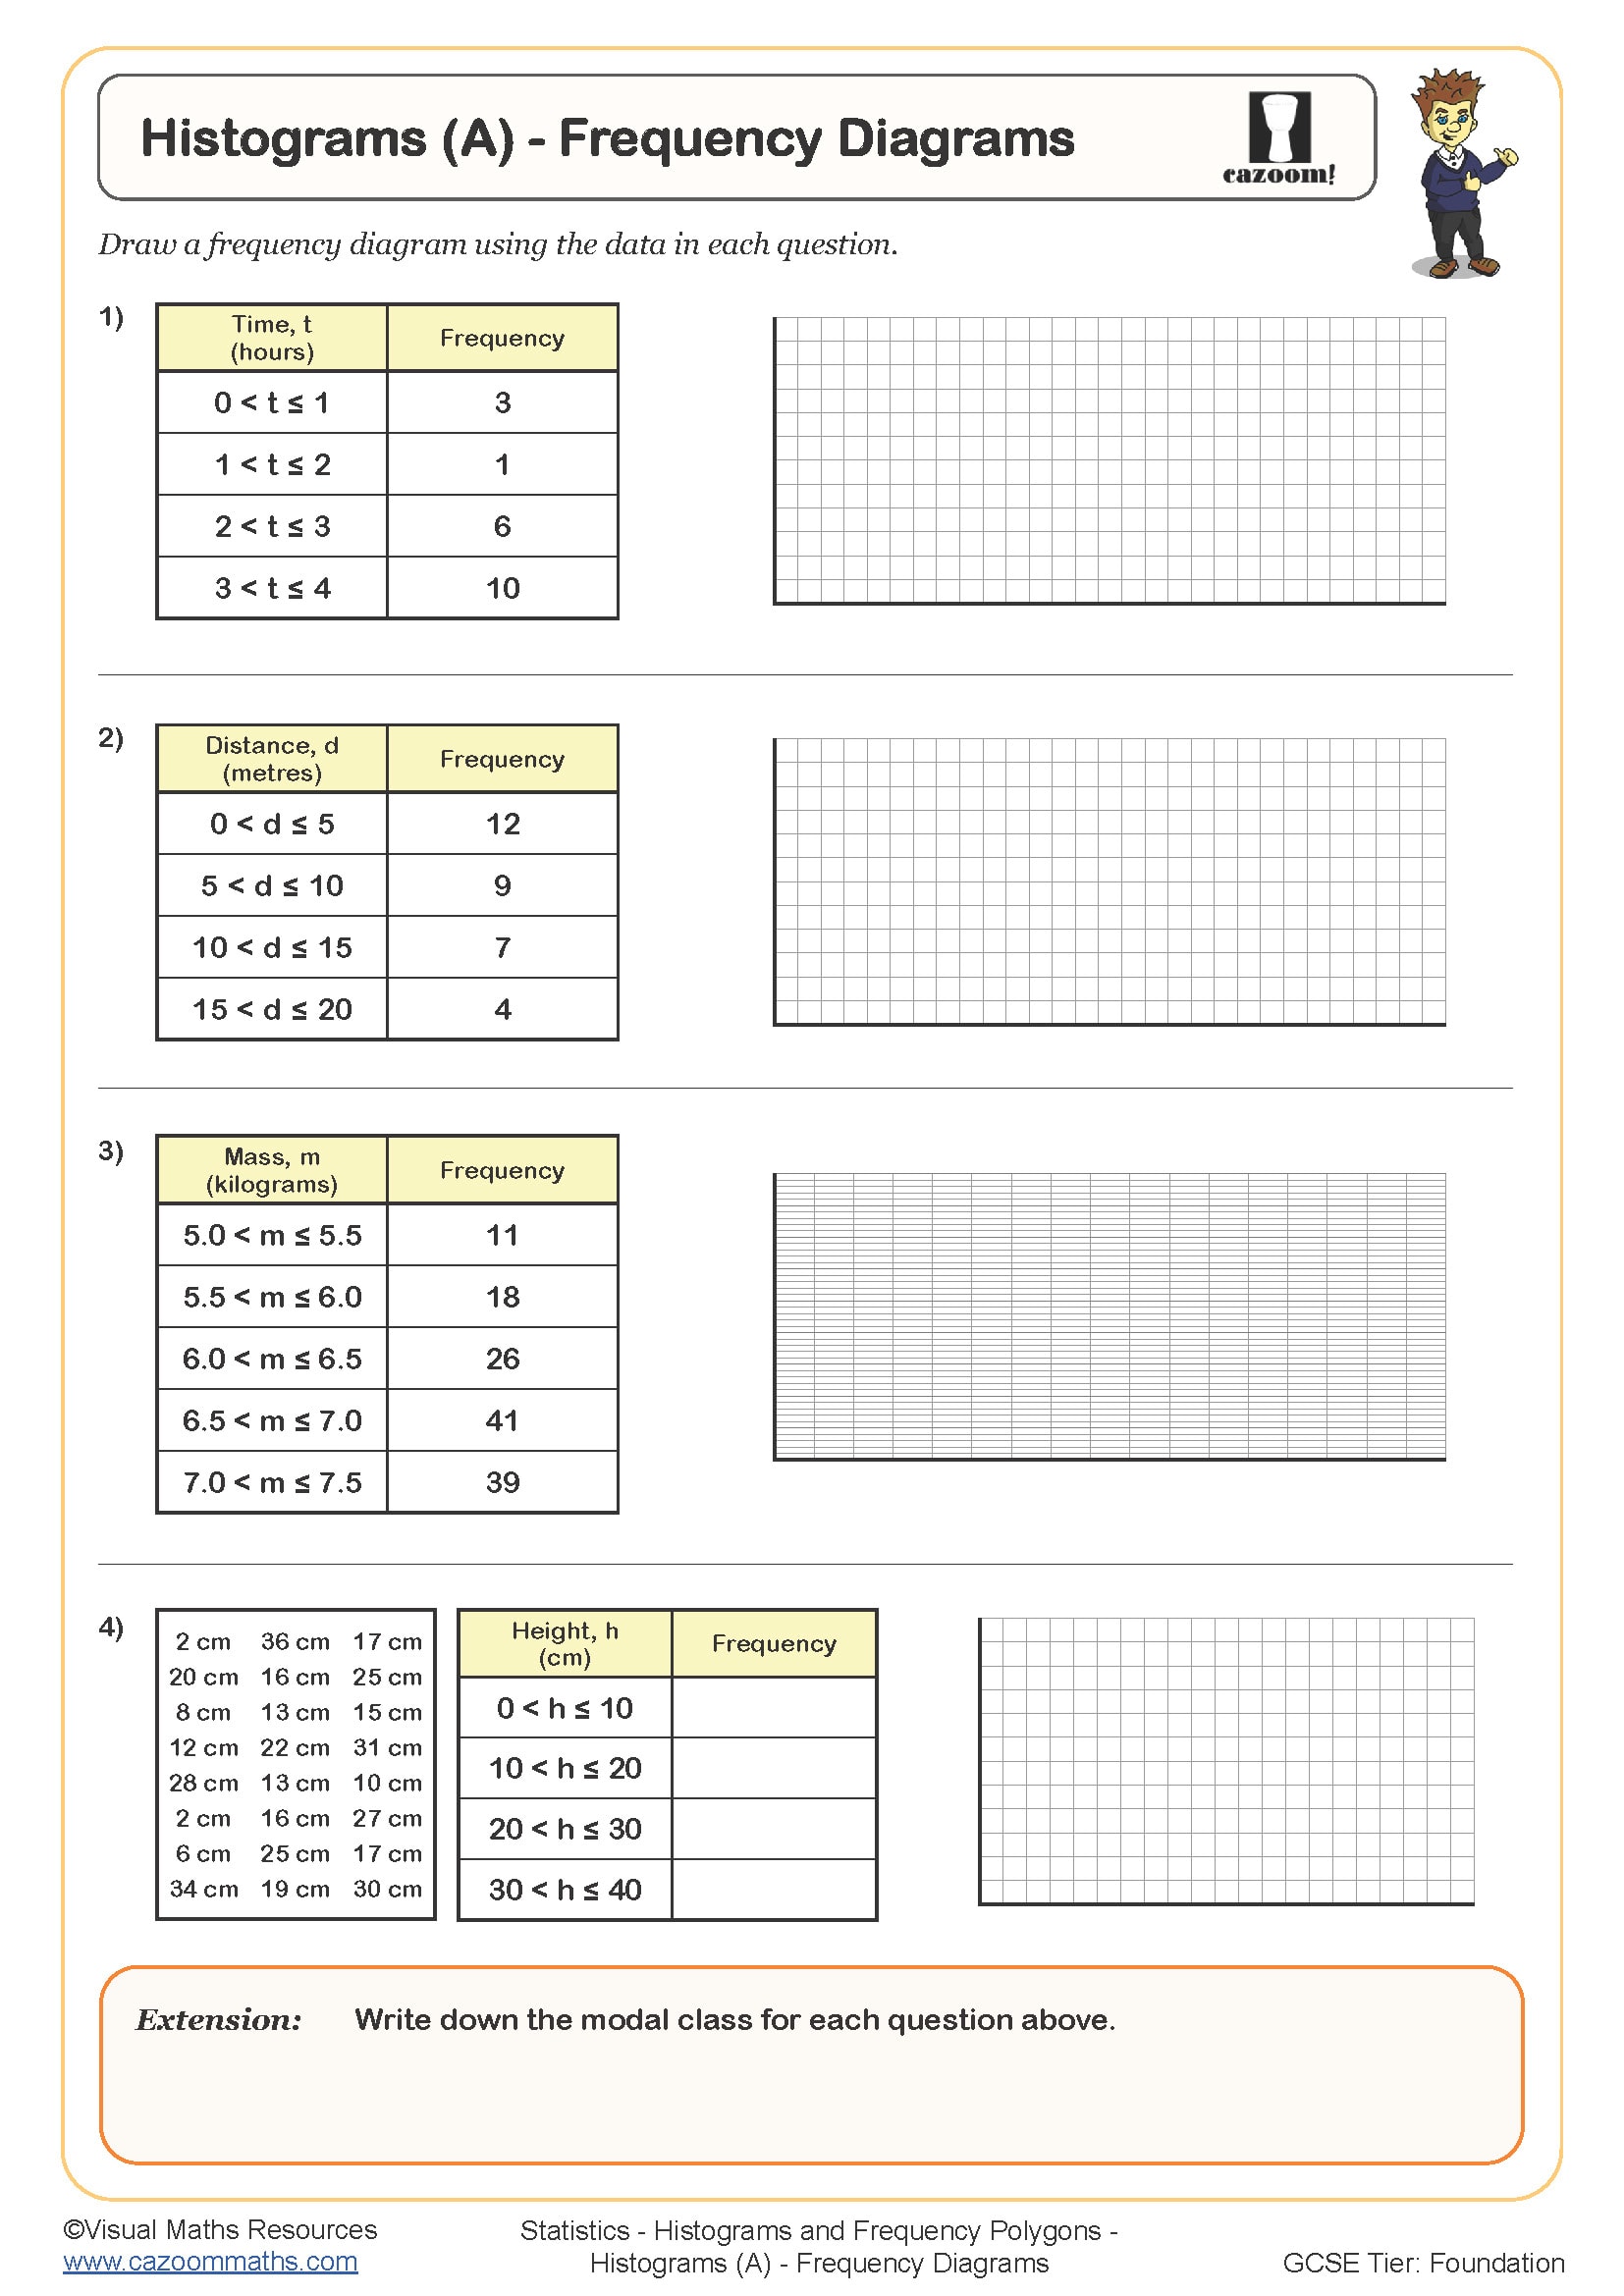
This worksheet provides some practice of drawing and reading histograms from inequal grouped frequency distributions.
Section A has two frequency tables with a frequency density column to complete alongside an axes for the histogram.
Section B provides completed histograms but with a table to complete using information about the vertical scale of a frequency.
All worksheets are created by the team of experienced teachers at Cazoom Maths.
 Worksheet")
RELATED TO Histograms (B) WORKSHEET
Frequently Asked Questions
Students should be comfortable with grouped frequency tables and plotting coordinates before tackling these histogram exercises. These foundational skills are essential because histograms require understanding how data is organised into groups and how to accurately plot points on a coordinate system. Without this prerequisite knowledge, learners may struggle with the frequency density calculations and accurate construction of their histograms.